Abstract
In this paper, the effects of nickel foam with different thicknesses, as a fluid collector, on the morphology and properties of electrode materials were explored. The Fe2O3 material, which is a common active material for supercapacitor electrodes, was used in combination with MgFe2O4. This combination resulted in better electrochemical performance and cycle stability for the Fe2O3 material. The synthesis ratio of Fe2O3/MgFe2O4 materials with the best stability, as reported in a previous article, was selected for this study. The electrode with the best performance was then selected and assembled with activated carbon to form an asymmetric supercapacitor. This supercapacitor exhibited a high specific capacity of 240 C/g, an energy density of 58.75 Wh/kg, and a power density of 200.4 W/kg at a current density of 1 A/g. These findings provide valuable references for the selection of different fluid collectors with electrodes.
1. Introduction
As the most common secondary energy, energy storage technologies for electrical energy have been extensively researched. Among the large number of available energy storage technologies, the most promising are lithium-ion batteries and ultracapacitors. Supercapacitors fill the performance gap between batteries and capacitors by offering energy and power densities between them. They can store more energy than conventional capacitors and have a higher cycle life, a higher multiplier performance, and better stability than batteries. These advantages give supercapacitors a wide range of application scenarios and have attracted widespread interest. In the previous article [1], the Fe2O3/MgFe2O4 electrode was prepared using the hydrothermal method, which can achieve high specific capacity and good cycle stability. The electrochemical testing and material characterization revealed the synergistic effect of the two materials, and the reason for the improvement of electrode cycle stability was analyzed [2,3,4,5].
The choice of fluid collector in hydrothermal processes significantly impacts electrode performance as collector morphology affects material growth [6,7,8,9]. Prior research has examined nickel foam thickness and found that a common thickness of 0.3 mm yields Fe2O3 nanosheets and MgFe2O4 nanoparticles, which is important due to the increased active sites with a thicker foam. Therefore, the material choice and structure of fluid collectors are crucial as they have varying conductivity and oxidation resistance, which in turn influence overall electrode performance. Additionally, material structures and porosities also affect growth quality [10,11,12,13]. Wang et al. [14] used Fe2O3 nanotube arrays coated with polypyrrole on carbon cloth, which displayed good cyclic stability with 80% retention after 10,000 cycles. However, they achieved only a modest initial specific capacity of 230 F/cm2 at 1 A/cm2. In contrast, Kumar et al. [15] achieved a higher initial specific capacity of 600 F/g with Mn3O4-Fe2O3/Fe3O4@rGO, although only 61% was retained after 1000 cycles. Therefore, different carriers have a great influence on the performance of the electrode.
The previous article explored the optimal stability of the Fe2O3/MgFe2O4 material synthesis ratio. In this paper, the influence of nickel foam with different thicknesses, as a fluid collector, on the morphology and performance of electrode materials will be investigated using the synthesis ratio explored in the previous article, and the synthetic route of the material remains unchanged [1]. Nickel foam with different thicknesses will be used in the market common nickel foam. The electrode with the best performance will then be selected as the cathode. Taking into consideration factors such as potential window and specific capacity, the anode of the assembled supercapacitor will be commercial activated carbon [16,17].
2. Experimental Section
2.1. Preparation of Fe2O3/MgFe2O4 Powders
The steps for the synthesis of Fe2O3/MgFe2O4 electrode materials are the same as in the previous paper, except that different thicknesses of the nickel foam are changed as the carrier. Fe2O3/MgFe2O4 electrodes with 0.3, 0.5, and 1.0 mm thicknesses of nickel foam were prepared, respectively named FM-2, FM-0.5NF, and FM-1.0NF, and their properties were compared using electrochemical tests [18]. Then, the reasons for the performance changes were analyzed through the characterization of various materials. The specific parameters of the electrodes are shown in Table 1. The molar ratio of composites is calculated by the ion concentration of ICP-OES.

Table 1.
Comparison of nickel foam samples with different thicknesses.
2.2. Preparation of Anode Electrode
To prepare the anode materials for asymmetric supercapacitors, the fluid collecting nickel foam is first cleaned by ultrasound. Then, the foam is cut to the required shape and size. The cleaning process of the foam nickel involves sequentially using 1 M dilute hydrochloric acid, anhydrous ethanol, and deionized water for 3–5 min. This effectively removes the oxide layer, surface oil stains, and other impurities. After the cleaning, the nickel foam is placed in a vacuum drying oven. Vacuuming is conducted, followed by heating the foam up to 60 °C at a heating rate of 2 °C/min. The heating is maintained at 60 °C for 6 h. The mixture consists of GO, ACET, and PVDF in a ratio of 8:1:1. 1-methyl-2-pyrrolidone is then slowly dripped until the powder is fully wet. The evenly coated mixture is applied to both sides of the nickel foam using a brush and is dried for 6 h. Subsequently, the nickel foam is pressed by a tablet press at a pressure of 10 MPa for 5 min. This process ensures that the electrode material is firmly packed into the pores of the nickel foam, resulting in the GO electrode. By comparing the weight of the nickel foam before and after the electrode, the load of active material is determined to be 2–4 mg/cm2 [19,20,21,22].
2.3. Materials Characterisation and Electrochemical Measurements
For the preparation, all samples were analyzed in phase by X-ray diffraction (XRD, Bruker D8 Advance, Wuhan, China). The product morphology was characterized using a scanning electron microscope (SEM, Zeiss Gemini 300, Wuhan, China). Chemical composition and material binding mode samples were characterized using transmission electron microscopy (TEM, Tecnai G2 F30, Wuhan, China). A full spectral characterization of the sample and the analysis of the Fe2+/Fe3+ content of samples before and after cycle testing were characterized using X-ray photoelectron spectroscopy (XPS, Thermo Scientific K-Alpha, Wuhan, China).
The electrochemical properties of all samples were tested using a three-electrode system with the sample electrode as the working electrode, the platinum wire as the counter electrode, the Hg/HgO as the reference electrode, and the electrolyte using 1 M KOH. Cyclic voltammetry (CV), constant current charge/discharge and cyclic stability tests were carried out on all samples. The GCD test is used to calculate the specific capacity and is based on the following equation [23]:
where C (C/g) is the specific capacity, I (A) is the discharge current, (s) is the total discharge time, and m (mg) is the electrode material loading mass. The material loading masses were found using inductively coupled plasma optical emission spectrometer (ICP-OES) testing and ranged from 1.0 mg to 1.2 mg.
3. Results and Discussion
3.1. Phase Composition, Microstructure and Surface Chemistry
Figure 1 shows the XRD characterization of FM-2-0.5NF- and FM-2-1.0NF-loaded materials compared with FM-2 samples. As can be seen from the figure, the sample loads all have obvious diffraction peaks, which proves that the crystal structure is intact. Through comparison, it can be found that, for FM-0 sample load material [1], these peaks at 2θ angles of 24.125°, 33.117°, 35.604°, 40.823°, 49.412°, 54.002°, 62.375°, and 63.948° can be observed in the X-ray diffraction pattern, it is completely consistent with the standard card JCPDS NO.89-0597 of Fe2O3 material. For FM-2--0.5NF and FM-2-1.0NF samples, there are diffraction peaks at 2θ = 30.212°, 35.587°, 37.227°, 43.253°, 57.210°, and 43.253°. The MgFe2O4 material standard card JCPDS NO.73-1960 is consistent with that of the FM-2 sample, and the intensity of these peaks relative to Fe2O3 diffraction peaks is greater than that of the FM-2 sample. From a certain level, it can be shown that the MgFe2O4 content in these samples accounts for a larger proportion [24,25].
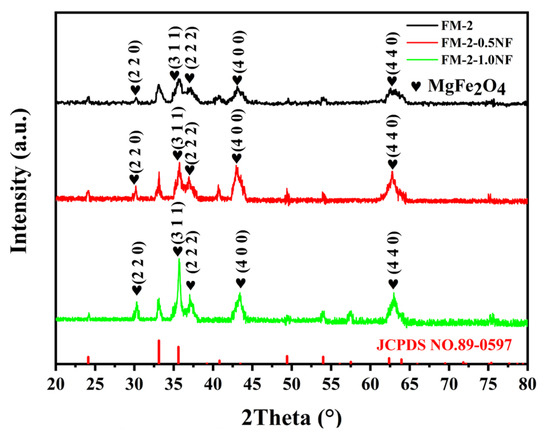
Figure 1.
XRD pattern of FM-0.3 NF, FM-0.5 NF, and FM-1.0 NF.
X-ray photoelectron spectroscopy analysis was performed on FM-2-0.5NF and FM-2-1.0NF electrodes. The broad spectrum scanning patterns of samples in the range of 0–1400 eV are shown in Figure 2. As can be seen from the figure, in the binding energy range of 0–1400 eV, similar to the FM-2 sample, the spectra of C 1s, O 1s, Fe 2p, Ni 2p, and Mg 1s can also be clearly observed. The diffraction peak intensity of Mg 1s increases with the increase of nickel foam thickness, which indicates that the relative content of Mg increases to a certain extent, which is consistent with the change of molar ratio of Fe2O3/MgFe2O4 and the peak intensity of XRD obtained by the ICP-OES test. XRD and XPS wide-scan test patterns further show that Fe2O3/MgFe2O4 loaded in FM-2-0.5NF and FM-2-1.0NF samples have been successfully synthesized.
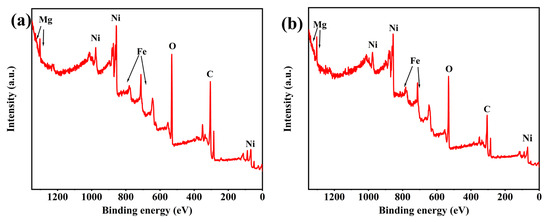
Figure 2.
X-ray photoelectron spectroscopy for broad spectrum analysis. (a) FM-0.5NF (b) FM-1.0NF.
Figure 3 shows the SEM characterization of FM-0.5NF and FM-1.0NF. As can be seen from the figure, the supporting material morphology prepared by nickel foam with thicknesses of 0.5 and 1.0 mm under the same initial conditions is similar to that obtained by nickel foam with a thickness of 0.3 mm, both of which are the composite of nanosheets and nanoparticles. Figure 3a,c show the SEM images of FM-0.5NF and FM-1.0NF samples at 10,000 ratios, where the load material of the FM-2-1.0NF sample grows more densely, which is consistent with the conclusion that the load material of the FM-2-1.0NF sample is heavier by ICP-OES. The growth of both materials is relatively uniform, and there is no obvious agglomeration of nanosheets. Figure 3b,d shows the SEM characterization of 100,000 times of the two samples, in which the spherical substances in both samples are significantly increased and the gaps of the Fe2O3 nanosheets are filled in, indicating that, under the same initial preparation conditions, the MgFe2O4 material on the growth is significantly increased with a larger thickness of nickel foam as the base. Although the thicker nickel foam brings more growth sites of materials and increases the load material, the size of Fe2O3 nanosheets does not increase accordingly, and the thickness remains about 15 nm, similar to that of the MF-2 sample. The retention of the Fe2O3 nanosheet in a small size makes it less affected by volume change, which is also conducive to the retention of performance. More spherical MgFe2O4 increases the contact between Fe2O3 nanosheets, which may be helpful for electron conduction to some extent, while enhancing the electron exchange ability of the material. Fm-0.5 NF and FM-2-1.0NF have better stability than FM-2. According to SEM characterization, compared with FM-2 samples, FM-0.5NF and FM -1.0NF samples can support more MgFe2O4 material, and more material loading does not increase the size of Fe2O3 nanosheets. This makes the contact between Fe2O3/MgFe2O4 materials better, thus enhancing the electron exchange and further improving the stability of the material, which is also the reason for the retention of the electrochemical impedance of the material [26].
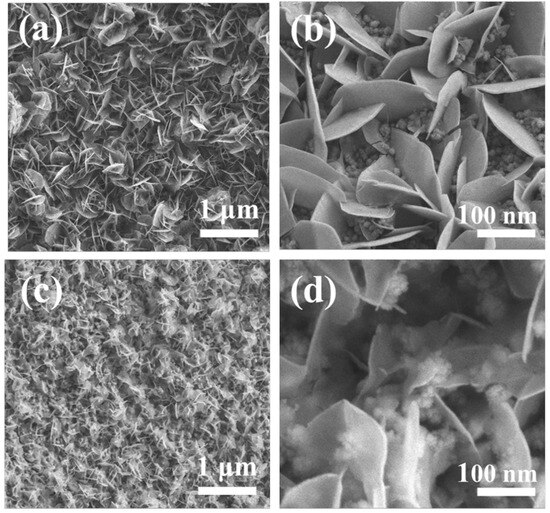
Figure 3.
(a,b) FM-0.5NF sample FESEM (c,d) FM-1.0NF sample FESEM.
3.2. Electrochemical Characterizations
Electrochemical tests were conducted on FM-2-0.5NF and FM-2-1.0NF, and the results are shown in Figure 4 and Figure 5. Figure 4a,b show the CV patterns of FM-2-0.5NF and FM-2-1.0NF at a scanning rate of 10–50 mV/s. Both electrodes have obvious REDOX peaks, showing pseudocapacitance. The reduction peak has a large response current, but the current magnitude is different from the peak current of the oxidation peak, showing a quasi-reversible reaction. The CV patterns of FM-2-0.5NF and FM-2-1.0NF samples vary with the scanning rate, and the shape and position of the REDOX peaks are still well maintained. For FM-2-0.5NF samples, at a scanning rate of 10 mV/s, the oxidation peak and reduction peak potentials are 0.47 V and 0.36 V, respectively, with a difference of 0.11 V. At a scanning rate of 50 mV/s, they were offset to 0.60 V and 0.33 V, respectively, and the difference increased to 0.27 V. At 10mV/s, the reduction peaks of FM-2-1.0NF samples were 0.5 V and 0.32 V, respectively, with a difference of 0.18 V; at 50 mV/s, they were 0.55 V and 0.29 V, with a difference of 0.26 V. The results show that both 0.5 mm and 1.0 mm thick nickel foam electrodes have good reversibility, and 1.0 mm nickel foam electrodes have better reversibility. Figure 4c,d show the GCD patterns of FM-2-0.5NF and FM-2-1.0NF. A 1–8 A/g current density was also selected for each constant-current charge–discharge test. As can be seen from the figure, the specific capacity of FM-2-0.5NF and FM-2-1.0NF samples decreases with the increase of current density. At a 1 A/g current density, the specific capacity is 372.5 C/g and 379.5 C/g, respectively, which is slightly reduced compared with the FM-2 sample. Among them, FM-2-1.0NF samples have a better magnification performance than FM-2-0.5NF samples. At a 1–8 A/g current density, the specific capacities are 379, 348.5, 327.5, and 291 C/g, respectively. When the current density reaches a high magnification of 8 A/g, the specific capacitors can still reach 77% of the specific capacitors when the current density is 1 A/g, 67% higher than FM-2-0.5NF and 73% higher than FM-2. Since the electrolyte is used consistently, this increase in magnification performance may be due to load material variations. Among them, the FM-0.5-NF sample has the lowest specific capacity, which may be due to the fact that 0.5 mm nickel foam does not have advantages for the growth of materials. Further analysis was conducted through subsequent tests and characterization.
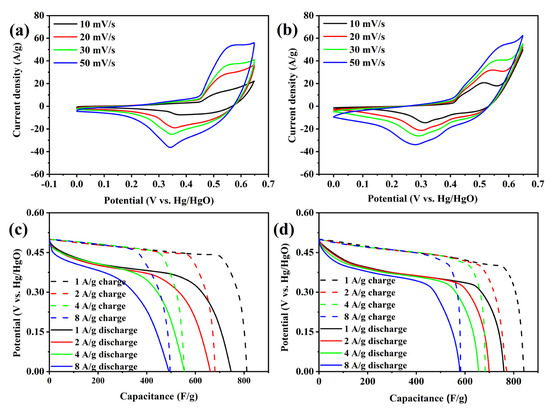
Figure 4.
CV curves of (a,b) FM-2-0.5NF and FM-2-1.0NF and GCD curves of (c,d) FM-2-0.5NF and FM-2-1.0NF.

Figure 5.
(a) FM-0.5NF and FM-1.0NF cyclic stability patterns (b) FM-0.5NF and FM-1.0NF cyclic EIS patterns.
Figure 5a depicts the cyclic stability pattern of FM-2, Fm-2-0.5 NF, and Fm-2-1.0 NF. It can be observed that the overall specific capacity of FM-2-0.5NF and FM-2-1.0NF decreases during the cycle. After the GCD cycle, the specific capacity of FM-2-0.5NF declines to 312.5 C/g, which is 83.9% of the initial specific capacity. In comparison, the specific capacity of the FM-5 sample after the cycle is 344.5 C/g. This confirms that the Fm-2-1.0 NF sample exhibits a slower decay rate, indicating an increase in the thickness of the nickel foam and a decrease in the initial specific capacity of the hydrothermal electrode. However, this trade-off leads to improved cycle stability. Furthermore, even though the specific capacity of FM-2-1.0NF is initially slightly lower than that of FM-2, it consistently remains at 375.5 C/g after approximately 400 cycles, which is consistently higher than the FM-2 sample. The improved stability can be attributed to the larger size and pore size of the nickel foam. On the other hand, Figure 5b shows the electrochemical impedance curves before and after the FM-2-0.5NF and FM-2-1.0NF cycles, and Table 2 lists the results of the electrical conductivity test. Prior to the cycle, Fm-2-0.5NF, Fm-2-1.0NF samples exhibited Faraday impedance of 1.1 Ω and 0.6 Ω, and the exhibit electrical conductivity values of 1429 s/cm and 1250 s/cm, respectively, with Fm-2-1.0NF samples having the lowest initial impedance. After 1000 cycles for both electrodes, the Faraday impedance increased to 1.7 Ω for the FM-2-0.5NF sample and 0.9 Ω for the FM-2-1.0NF sample. These results suggest that the 1.0mm nickel foam electrode has the lowest impedance after circulation, representing the minimal degree of material deactivation and, hence, the best stability.
Table 2.
The conductivity results of the sample.
Figure 6 shows the XPS characterization pattern before and after FM-2-0.5NF and FM-2-1.0NF cycles. Figure 6a shows the O 1s spectra of FM-2-0.5NF and FM-2-1.0NF before and after the cycle. All curves can also be fitted to three components corresponding to lattice oxygen (OⅠ), chemisorbed oxygen (OⅡ), and physical adsorption oxygen (OⅢ), which are similar to FM-0 and FM-2. The content of the three oxygen elements is shown in Figure 6b. It can be seen from the figure that the chemisorbed oxygen ratio of FM-2-1.0NF after cycling is higher than that of FM-2-0.5NF, indicating that the FM-2-1.0NF electrode has better activity. The chemisorption oxygen ratio of FM-2-0.5NF and FM-2-1.0NF decreased after 1000 cycles, and the initial OⅡ percentage of FM-2-1.0NF was about 61%, which remained at 68% after 1000 cycles. However, the chemisorbed oxygen ratio of FM-2-0.5NF samples decreased significantly before and after the cyclic charge-discharge test, accounting for 33% after the cycle, which was the lowest among the four samples. Therefore, it can be inferred that FM-2-1.0NF electrode materials have more oxygen vacancies at the initial stage and have the best electrochemical activity [27,28].
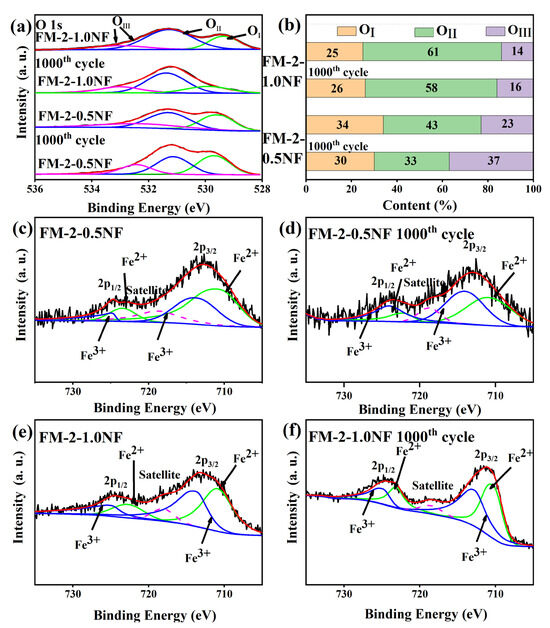
Figure 6.
(a) XPS spectrum of O1s (b) contents of OⅠ, OⅡ, and OⅢ before and after cycle (c,d) Fe 2p spectrum of FM-2-0.5NF before and after cycle (e,f) Fe 2p spectrum of FM-2-1.0NF before and after cycle.
Figure 6c,d shows the spectrum of Fe2p before and after the cycle of the FM-2-1.0NF sample. It can be seen from the figure that Fe2p has two different characteristic peaks at 710.8 eV and 724.4 eV, which can correspond to the peaks of Fe 2p3/2 and Fe 2p1/2. The location of the peak value can correspond to that of the FM-2 sample. After partial peak fitting, FM-2-0.5NF samples had a relatively high Fe2+/Fe3+ ratio of 1.19 before the cycle. After 1000 cycles, Fe2+/Fe3+ decreased to 0.68, indicating a loss of material activity, which was also consistent with the assumption of oxygen vacancy. Figure 6c,d show the Fe 2p spectra of FM-2-1.0NF samples before and after cycling. Before the cycle, Fe2+/Fe3+ was 1.1 and, after the cycle, it remained at 0.94, indicating that FM-2-1.0NF samples had better activity preservation, which was due to the better reversible reaction during the charging and discharging process [29].
A larger thickness of nickel foam will have more material forming sites. Therefore, these sites will increase the overall load of the material, but they will not have a significant impact on the nanometer size of the material. The electrode prepared by nickel foam with a 0.5 mm thickness has a similar growth material proportion and mass compared to 0.3 mm, but its conductivity is greatly reduced. On the other hand, the conductivity of the electrode prepared with 1.0 mm thick nickel foam is similar, but the quality and proportion of the material is lower, indicating that 0.5 mm thick nickel foam does not offer any advantage. Although the 1.0 mm thickness of nickel foam exhibits worse conductivity, it provides better contact between the composites, leading to lower electrochemical impedance and better stability. Thus, the initial specific capacity of the FM-2-1.0NF sample is smaller, but the retention rate of the capacitor is better during cycling. Consequently, in this follow-up study, the FM-2-1.0NF electrode prepared with foam nickel of a 1.0mm thickness was chosen as the research choice [30].
The GO electrode was tested. The cyclic voltammetry test pattern is shown in Figure 7a. As can be seen from the figure, at a low scanning rate, the CV pattern is close to a rectangle, showing double electric layer capacitance dominated by physical adsorption. The shape of the rectangle is irregular, indicating the existence of a REDOX reaction, which may be attributed to the functional groups on the GO surface. At the scanning rate of 10–30 mV/s, the shape of the CV pattern remains basically unchanged, showing good magnification performance. When the scanning rate reaches 50 mV/s, part of the shape changes due to the great influence of the functional group pseudo-capacitance, but the shape is very symmetrical, indicating good reversibility. Figure 7b shows the comparison of CV patterns of the GO anode and the Fe2O3/MgFe2O4 electrode at a scanning rate of 10 mV/s. It can be found that the reduction peak of the GO electrode as an anode is higher, which is slightly lower than that of the cathode, but can be compensated by the increase of load mass.
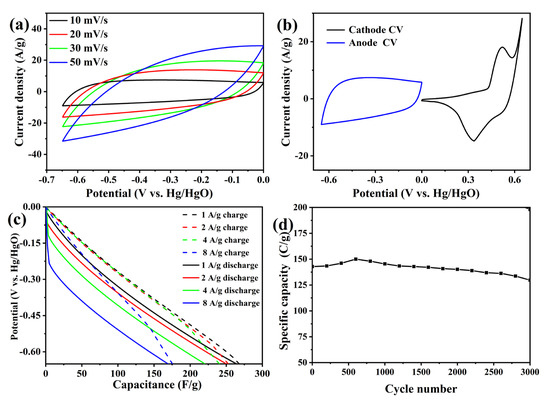
Figure 7.
(a) CV curve of GO (b) CV comparison between GO anode and Fe2O3/MgFe2O4 cathode (c) GCD curve of GO (d) cyclic stability pattern of GO.
Figure 7c shows the GCD curve of the GO anode at −0.65–0 V. The curve is basically straight, with only a slight stagnation platform, showing obvious double-layer characteristics. The charge and discharge curve has a certain curvature, which comes from the pseudo capacitance of functional groups. At a high scanning rate, the Faraday response is delayed due to fast scanning, which leads to rapid potential change in the charge–discharge curve. At a current density of 1, 2, 4, and 8 A/g, the specific capacity of the electrode is 169.6, 160.5, 140.4, and 107.25 C/g respectively, which has a good performance. Figure 7d shows the cycle stability pattern of the GO electrode. The electrode increases slightly from 141.7 C/g to 148.85 C/g at 0–500 cycles, due to the exposure of more active sites during the cycle. After 3000 cycles, the electrode specific capacity drops to 127.4 C/g, which is 90% of the initial specific capacity. GO electrodes show good cyclic stability.
The electrochemical test shows that graphene oxide, as an anode, has a good double layer performance at −0.65–0 V potential and less pseudo capacitance performance. In the 1 A/g GCD test, it can show a high specific capacity of 169.6 C/g, and the GO electrode has good cyclic stability. After 3000 cycles, 90% of the initial specific capacity can be maintained. The electrode and Fe2O3/MgFe2O4 cathode can be adapted for the assembly of capacitor batteries.
The potential size of the whole battery is determined by the potential window of the anode and the cathode and the degree of adaptation of the poles. In this whole battery, because the anode uses the graphene oxide electrode, it has a large potential window. The cathode Fe2O3/MgFe2O4 electrode potential window is 0–0.65 V. In order to adapt the cathode potential, the anode potential window is first selected as −0.65–0 V. Therefore, the potential window of the whole battery is tested from 0–1.3 V, and the potential window is successively increased, and the appropriate working potential is selected based on specific capacity, charging, and discharging efficiency and other factors.
Figure 7 shows CV patterns and GCD patterns of different potentials of the whole battery at a scanning rate of 10 mV/s. Figure 8a shows the CV patterns of the whole battery with the maximum potential of 1.3–1.7 V. It can be seen from the figure that all CV patterns have obvious REDOX peaks with similar peak current heights, showing good reversibility. With the increase of the potential window, the response current also increased gradually, and the CV pattern shifted to the right and maintained a good shape. In the pattern of the highest potential 1.3–1.7 V, the peak current density of the reduction peak is 5.55, 5.56, 6.15, 6.24, and 6.52 A/g, respectively. It can be seen that the circuit density of the reduction peak increases the most when the potential window reaches 0–1.5 V, indicating that the material activity increases greatly in this potential window. When the maximum potential reaches 1.7 V, it can be seen that the CV pattern has a large tail, which is due to the severe polarization caused by excessive potential. This polarization will cause electrolytic water reaction and damage to the electrode, so the maximum potential is limited below 1.7 V.
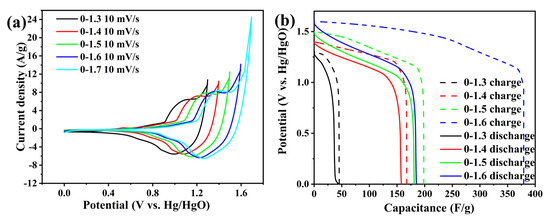
Figure 8.
(a) CV patterns of different potential windows of the whole battery. (b) GCD patterns of different potential windows of the whole battery.
Figure 8b shows the GCD at a 1 A/g current density in different potential windows. It can be seen from the CV pattern that the maximum potential is limited to 1.7 V, so the maximum potential from 1.3 V to 1.6 V is selected. As can be seen from the figure, the charge–discharge capacitance increases with the increase of the potential window. In the 0–1.3 V potential window, the material exhibits low activity, with a specific capacity of 63.7 C/g. When the potential window expanded to 0–1.4 V, an obvious plateau of pattern stagnation was observed, indicating the occurrence of the Faraday reaction. The charging specific capacity is increased to 233.8 C/g, while the discharge specific capacity reaches 219.8 C/g, and the charging and discharging efficiency is 94%. When the potential window is 0–1.5 V, the charge–discharge capacitance is further increased, the charge–discharge specific capacity is 297 C/g, the discharge specific capacity is 241.5 C/g, and the charge–discharge efficiency drops slightly to 91%. When the potential window reaches 0–1.6 V, it can be found that the charge–discharge pattern has a serious stagnant platform. The charging specific capacity reaches 606.4 C/g, but the discharge specific capacity is still only 296 C/g, and the charge–discharge efficiency is only 49%. Excessive potential leads to difficulty in charging the electrode after reaching a certain potential, resulting in severe polarization of the electrode, and an irreversible Faraday reaction, releasing the same amount of electricity as the charged amount. Such high potential can cause serious deactivation of electrode material, damage of material morphology, and a decrease of electrode performance. Therefore, in order to take into account the specific capacity, charge–discharge efficiency, and electrode stability of the electrode, a potential window of 0–1.5 V was selected in this study.
Figure 9c shows that the supercapacitor exhibits the highest energy density, measuring 58.75 Wh/kg, at a current density of 1 A/g. Additionally, the power density is recorded at 200.4 W/kg. As the current density increases, it results in a reduction in charging and discharging time, leading to a substantial increase in power density but a decrease in energy density. The energy density–power density curve presented in the figure indicates a slight downward trend, illustrating the overall magnification performance of supercapacitors.
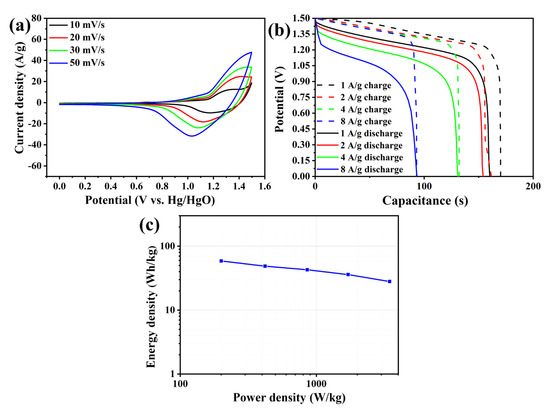
Figure 9.
Full cell electrochemical test. (a) CV pattern. (b) GCD pattern. (c) Energy density–power density diagram.
It can be observed from Figure 9c that the supercapacitor exhibits the highest energy density of 58.75 Wh/kg at a current density of 1 A/g, along with a power density of 200.4 W/kg. As the current density increases, the charging and discharging time decreases, leading to a significant increase in power density but a decrease in energy density. The energy density–power density curve in the figure demonstrates a slight downward trend, reflecting the overall performance characteristics of supercapacitors.
The cycle stability pattern of the whole battery for 3000 cycles is shown in Figure 10a. It can be observed that the supercapacitor demonstrates good cycle stability. The specific capacity is maintained at 222 C/g, which is 92% of the initial specific capacity, after 1000 cycles. After 2000 cycles, the specific capacity decreases to 216 C/g, accounting for 90% of the initial specific capacity. Moreover, during the period from 2000 to 3000 cycles, the supercapacitors experience a faster decay in specific capacity. The specific capacity after 3000 cycles is 198 C/g, which corresponds to 83% of the initial specific capacity. Comparatively, the cycle stability of the whole battery of the supercapacitor is better than that of the cathode. This is attributed to two factors. Firstly, the high stability of the anode contributes to an improvement in the overall battery stability. Secondly, the presence of errors in the adaptation between the anode and cathode limits the utilization of the cathode material’s activity, thereby enhancing the electrode’s lifespan. Figure 10b shows the CV curve changes after different cycles. It can be seen from the figure that the electrode has the maximum response current density before the cycle starts, indicating that the supercapacitor has the best activity before the cycle. After 1000 cycles, the REDOX peak height of CV patterns decreased slightly, indicating partial deactivation of the material. By comparing with the reduction peak of the pre-cycle pattern, it can be found that the reduction peak of the supercapacitor decreases significantly at the potential range of 1.1–1.4 V, indicating that the supercapacitor is first deactivated from this range at the beginning of the cycle. After 2000 cycles, it can be found that the CV pattern does not change much compared with 1000 cycles, indicating that the loss of electrochemical activity is small. This conclusion can correspond to Figure 10a. According to the cycle stability pattern, the specific capacity decreases by only 6 C/g after 1000 cycles. After 3000 cycles, compared with CV patterns of 2000 cycles, it can be seen that the reduction peak value decreased significantly in the range of 0.8–1.1 V potential, while there was little change in the range of 1.1–1.4 V. This indicates that, in the late cycle, the supercapacitor was seriously deactivated at 0.8–1.1 V potential, while the activity of 1.1–1.4 V potential basically no longer declined. The sequence of deactivation may be related to the time of deactivation of the two materials in Fe2O3/MgFe2O4, respectively [31,32].
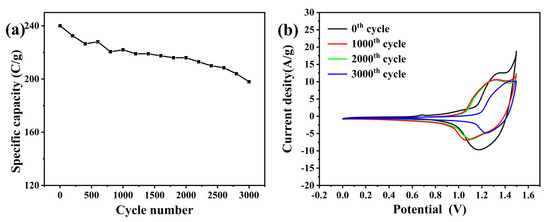
Figure 10.
(a) Cycle stability curve of the whole battery of the supercapacitor. (b) CV pattern after different cycles.
By selecting appropriate cathodes for Fe2O3/MgFe2O4 electrodes and performing performance tests in a two-electrode system, it is found that the whole battery has a high specific capacity of 240 C/g, an energy density of 58.75 Wh/kg, and a power density of 200.4 W/kg at a current density of 1 A/g. The asymmetric supercapacitor composed of Fe2O3/MgFe2O4//GO has a good electrochemical performance and can be used as a cheap and high-performance energy storage device.
4. Conclusions
The influence of the fluid collector on the active material and the performance of the electrode sheet in an electrode sheet is investigated in this study. The Fe2O3/MgFe2O4 material mentioned earlier is loaded onto various fluid collectors. Through electrochemical testing and material characterization, the impact of the fluid collector is examined, and a suitable fluid collector is chosen for electrode preparation. Subsequently, the obtained electrode serves as the cathode, and a suitable GO anode is selected. These components are then assembled into a hybrid supercapacitor battery. To obtain the parameters of the entire battery, appropriate potential window selection and thorough electrochemical testing are conducted. The following specific results are obtained:
- (1)
- After selecting the appropriate cathode electrode material, select the appropriate collector for it. Fe2O3/MgFe2O4 electrodes were prepared from nickel foam with different thicknesses, and the influence of different fluid concentrations was investigated by electrochemical testing and material characterization. It is found that, for electrodes, the larger thickness of nickel foam has more material forming sites, so the electrode load increases, but the larger load does not lead to the larger size of Fe2O3 nanosheets. In addition, the content of MgFe2O4 nanoparticles increased with the increase of thickness, indicating that more forming sites were convenient for the growth of MgFe2O4 nanoparticles. The addition of MgFe2O4 nanoparticles leads to better interatrial contact, thus improving electrochemical impedance and increasing the reversibility of the material reaction. Although the larger thickness of the nickel foam leads to poorer conductivity and thus lower initial specific capacity, combined with stability analysis, the larger-thickness nickel foam electrode has a better overall performance.
- (2)
- Fe2O3/MgFe2O4 electrodes were prepared by an appropriate collecting system as the cathode of the supercapacitor, and an appropriate anode was selected for it. It is found that the potential window of the electrode material is too narrow to be used as an anode. GO was selected as the anode with high performance. The electrode has a high specific capacity of 169.6 C/g and an excellent stability of 90% capacitance retention rate after 3000 cycles. Taking the electrode as the anode, the quality of active material was matched by the performance difference of the anode and cathode, and the whole battery of the supercapacitor was assembled.
- (3)
- An electrochemical test was carried out on the assembled full battery of the supercapacitor in the two-electrode system. Firstly, the specific capacity and charge–discharge efficiency of the electrode under different potential windows were selected as 0–1.5 V, and the test showed that the supercapacitor had a high specific capacity of 240 C/g at the current density of 1 A/g, energy density of 58.75 Wh/kg, and power density of 200.4 W/kg. Supercapacitors also have good stability, with an 83% capacitance retention rate for 3000 cycles. The deactivation potential sequence of the supercapacitor was analyzed by the CV curve after the cycle, and the difference of the deactivation process of the cathode composite material was determined.
This paper provides an idea for the selection of the Fe2O3/MgFe2O4 fluid set, and the assembled high performance Fe2O3/MgFe2O4//GO asymmetric supercapacitor has good commercial value.
Author Contributions
Writing-original draft, J.L.; Writing-review and editing, Y.M.; Date curation, Q.S.; Investigation, Z.W.; Project administration, G.G. All authors have read and agreed to the published version of the manuscript.
Funding
This research was supported by 111 Project (B17034) Innovative Research Team Development Program of Ministry of Education of China (IRT_17R83), the Guiding Project of Hubei Provincial Department of Education (B2021330), and Open project of Hubei Key Laboratory of Power System Design and Test for Electrical Vehicle granted No.14.
Data Availability Statement
Data cannot be obtained due to privacy.
Conflicts of Interest
The authors declare no conflict of interest.
References
- Guo, G.; Su, Q. Cycling stability of Fe2O3 nanosheets as supercapacitor sheet electrodes enhanced by MgFe2O4 nanoparticles. RSC Adv. 2023, 6, 3643–3651. [Google Scholar] [CrossRef] [PubMed]
- Wang, G.; Yu, M.; Feng, X. Carbon materials for ion-intercalation involved rechargeable battery technologies. Chem. Soc. Rev. 2021, 50, 2388–2443. [Google Scholar] [CrossRef] [PubMed]
- Reddy, G.R.; Dillip, G.R.; Sreekanth, T.V.M.; Rajavaram, R. Mechanistic investigation of defect-engineered, non-stoichiometric, and Morphology-regulated hierarchical rhombus-/spindle-/peanut-like ZnCo2O4 microstructures and their applications toward high-performance supercapacitors. Appl. Surf. Sci. 2020, 529, 147123. [Google Scholar] [CrossRef]
- Sethi, M.; Shenoy, U.S.; Muthu, S.; Bhat, D.K. Facile solvothermal synthesis of NiFe2O4 nanoparticles for high-performance supercapacitor applications. Front. Mater. Sci. 2020, 14, 120–132. [Google Scholar] [CrossRef]
- Kumar, A.; Rathore, H.M.; Sarkar, D.; Shukla, A. Nanoarchitectured transition metal oxides and their composites for supercapacitors. Electrochem. Sci. Adv. 2021, 2, e2100187. [Google Scholar] [CrossRef]
- Dillip, G.R.; Banerjee, A.N.; Anitha, V.C.; Deva, B.; Raju, P.; Joo, S.W.; Min, B.K. Oxygen vacancy-induced structural, optical, and enhanced supercapacitive performance of zinc oxide anchored graphitic carbon nanofiber hybrid electrodes. ACS Appl. Mater. Interfaces 2016, 8, 5025–5039. [Google Scholar] [CrossRef] [PubMed]
- Reddy, G.R.; Kumar, N.S.; Raju, B.D.P.; Shanmugam, G.; Al-Ghurabi, E.H.; Asif, M. Enhanced supercapacitive performance of higher-ordered 3d-hierarchical structures of hydrothermally obtained ZnCo2O4 for energy storage devices. Nanomaterials 2020, 10, 1206. [Google Scholar] [CrossRef]
- Guo, C.; Yin, M.; Wu, C.; Li, J.; Sun, C.; Jia, C. Highly stable gully-network Co3O4 nanowire arrays as battery-type electrode for outstanding supercapacitor performance. Front. Chem. 2018, 6, 636. [Google Scholar] [CrossRef]
- Attia, S.Y.; Mohamed, S.G.; Barakat, Y.F.; Hassan, H.H.; Zoubi, W.A. Supercapacitor electrode materials: Addressing challenges in mechanism and charge storage. Rev. Inorg. Chem. 2022, 42, 53–88. [Google Scholar] [CrossRef]
- Schütter, C.; Pohlmann, S.; Balducci, A. Industrial requirements of materials for electrical double layer capacitors: Impact on current and future applications. Adv. Energy Mater. 2019, 9, 1900334. [Google Scholar] [CrossRef]
- Fleischmann, S.; Mitchell, J.B.; Wang, R.; Zhan, C.; Jiang, D.E.; Presser, V.; Augustyn, V. Pseudocapacitance: From fundamental understanding to high power energy storage materials. Chem. Rev. 2020, 120, 6738–6782. [Google Scholar] [CrossRef] [PubMed]
- Tan, H.T.; Sun, W.; Wang, L.; Yan, Q. 2D transition metal oxides/hydroxides for energy-storage applications. ChemNanoMat 2016, 2, 562–577. [Google Scholar] [CrossRef]
- Yang, Z.; Cheng, Q.; Li, W.; Li, Y.; Yang, C.; Tao, K. Construction of 2D ZIF-derived hierarchical and hollow NiCo-LDH “nanosheet-on-nanosheet” arrays on reduced graphene oxide/Ni foam for boosted electrochemical energy storage. J. Alloys Compd. 2021, 850, 156864. [Google Scholar] [CrossRef]
- Wang, Y. Polypyrrole-encapsulated Fe2O3 nanotube arrays on a carbon cloth support: Achieving synergistic effect for enhanced supercapacitor performance. Electrochim. Acta 2021, 386, 138486. [Google Scholar] [CrossRef]
- Kumar, R. Microwave-assisted synthesis of Mn3O4-Fe2O3/Fe3O4@ rGO ternary hybrids and electrochemical performance for supercapacitor electrode. Diam. Relat. Mater. 2020, 101, 107622. [Google Scholar] [CrossRef]
- Simon, P.; Gogotsi, Y. Materials for electrochemical capacitors. Nat. Mater. 2008, 7, 845–854. [Google Scholar] [CrossRef] [PubMed]
- Dar, M.A.; Dinagaran, S.; Govindarajan, D.; Ahamed, S.R.; Habib, F.; Siva, C.; Moholkar, A.V.; Ahmad, Z.; Yatoo, M.A. Snx-0MnxS nanomaterial based electrodes for future-generation supercapacitor and data storage devices. J. Alloys Compd. 2023, 958, 170523. [Google Scholar] [CrossRef]
- Yuan, Y.; Zhou, J.; Rafiq, M.I.; Dai, S.M.; Tang, J.; Tang, W.H. Growth of ni-mn layered double hydroxide and polypyrrole on bacterial cellulose nanofibers for efficient supercapacitors. Electrochim. Acta 2019, 295, 82–91. [Google Scholar] [CrossRef]
- Ma, L.T.; Fan, H.Q.; Wei, X.Y.; Chen, S.M.; Hu, Q.Z.; Liu, Y. Towards high areal capacitance, rate capability, and tailorable supercapacitors: Co3O4@polypyrrole core-shell nanorod bundle array electrodes. J. Mater. Chem. A 2018, 6, 19058–19065. [Google Scholar] [CrossRef]
- Das, A.K.; Sahoo, S.; Arunachalam, P.; Zhang, S.; Shim, J.J. Facile synthesis of Fe3O4 nanorod decorated reduced graphene oxide (RGO) for supercapacitor application. RSC Adv. 2016, 6, 107057. [Google Scholar] [CrossRef]
- Wang, T.; Chen, H.C.; Yu, F.; Zhao, X.S.; Wang, H.X. Double-shelled hybrid MgFe2O4/Fe2O3 hollow microspheres as a high-capacity anode for lithium-ion batteries. J. Ind. Eng. Chem. 2022, 110, 262–273. [Google Scholar]
- Nandi, D.; Mohan, V.B.; Bhowmick, A.K. Metal/metal oxide decorated graphene synthesis and application as supercapacitor: A review. J. Mater. Sci. 2020, 55, 6375–6400. [Google Scholar] [CrossRef]
- Brousse, T.; Bélanger, D.; Long, J.W. To Be or Not To Be Pseudocapacitive. J. Electrochem. Soc. 2015, 162, A5185–A5189. [Google Scholar] [CrossRef]
- Pan, Y.; Zhang, Y.; Wei, X.; Yuan, C.; Yin, J.; Cao, D.; Wang, G. MgFe2O4 nanoparticles as anode materials for lithium-ion batteries. Electrochim. Acta 2013, 109, 89–94. [Google Scholar] [CrossRef]
- Wang, J.; Zhou, H.; Nanda, J.; Braun, P.V. Three-dimensionally mesostructured Fe2O3 electrodes with good rate performance and reduced voltage hysteresis. Chem. Mater. 2015, 27, 2803–2811. [Google Scholar] [CrossRef]
- Liu, H.; Liu, X.; Wang, S.; Liu, H.K.; Li, L. Transition metal based battery-type electrodes in hybrid supercapacitors: A review. Energy Storage Mater. 2020, 28, 122–145. [Google Scholar] [CrossRef]
- Gao, W.; Li, Y.; Zhao, J.; Zhang, Z.; Tang, W.; Wang, J.; Wu, Z.; Li, Z. Design and Preparation of Graphene/Fe2O3 Nanocomposite as Negative Material for Supercapacitor. Chem. Res. Chin. Univ. 2022, 38, 1097–1104. [Google Scholar] [CrossRef]
- Liu, W.; Zhu, M.; Liu, J.; Li, X.; Liu, J. Flexible asymmetric supercapacitor with high energy density based on optimized MnO2 cathode and Fe2O3 anode. Chin. Chem. Lett. 2019, 30, 750–756. [Google Scholar] [CrossRef]
- Zhang, Y.; Lin, R.; Fu, Y.; Wang, X.; Yu, X.; Li, J.; Zhu, Y.; Tan, S.; Wang, Z. Metal-organic framework derived Fe2O3 nanocubes on intertwined N-doped carbon nanowires for fiber-shaped supercapacitor. Mater. Lett. 2018, 228, 9–12. [Google Scholar] [CrossRef]
- Zhu, X.; Zhu, Y.; Murali, S.; Stoller, M.D.; Ruoff, R.S. Nanostructured reduced graphene oxide/Fe2O3 composite as a high-performance anode material for lithium ion batteries. ACS Nano 2011, 5, 3333–3338. [Google Scholar] [CrossRef]
- Zhang, M.; Sha, J.; Miao, X.; Liu, E.; Shi, C.; Li, J.; He, C.; Li, Q.; Zhao, N. Three-dimensional graphene anchored Fe2O3@C core-shell nanoparticles as supercapacitor electrodes. J. Alloys Compd. Interdiscip. J. Mater. Sci. Solid-State Chem. Phys. 2017, 696, 956–963. [Google Scholar] [CrossRef]
- Guo, R.; Dang, L.; Liu, Z.; Lei, Z. Incorporation of electroactive NiCo2S4 and Fe2O3 into graphene aerogel for high-energy asymmetric supercapacitor. Colloids Surf. A Physicochem. Eng. Asp. 2020, 602, 125110. [Google Scholar] [CrossRef]
Disclaimer/Publisher’s Note: The statements, opinions and data contained in all publications are solely those of the individual author(s) and contributor(s) and not of MDPI and/or the editor(s). MDPI and/or the editor(s) disclaim responsibility for any injury to people or property resulting from any ideas, methods, instructions or products referred to in the content. |
© 2023 by the authors. Licensee MDPI, Basel, Switzerland. This article is an open access article distributed under the terms and conditions of the Creative Commons Attribution (CC BY) license (https://creativecommons.org/licenses/by/4.0/).