Abstract
The jadeite jade in Guatemala exerts remarkable commercial quality, which has attracted wide attention. Guatemalan jadeite jade displays a rich variety of colors; however, the color formation of this jadeite jade has not been systematically investigated to date. In this paper, we study different colors of jade samples to trace the compositions and color-causing mechanisms through petrography, X-ray fluorescence spectroscopy (XRF), Fourier transform infrared spectroscopy (FTIR), laser Raman spectroscopy (LRS), and UV-visible absorption spectroscopy (UV-Vis), as well as electron probe microanalysis (EPMA). The results show that jadeite and omphacite are the main mineral compositions of Guatemalan jadeite jade, together with minor albite and other impurities. The color of Guatemala jadeite jade is mainly related to Cr3+, Fe2+, and Fe3+, of which a small amount of Cr3+ causes the jadeite jade to be emerald green. Moreover, 1~2% FeO contents can lead to the blue or gray color of the samples, while the Fe3+ makes the sample dark green. The green color of some Cr3+-free jadeite is caused by the electron transition between bands of Fe3+, and the green color is related to the iron content. Moreover, the chemical composition analysis shows that some metallic elements existed in Guatemalan jadeite jade, such as Ca, Ti, Al, Si, Ni, Fe, Mn, Cr, Na, Mg, and Sr, and some trace elements were lost or unevenly distributed, which may lead to the heterogeneity of the color of the samples. Our present investigation provides insights into color discrimination, quality evaluation, and identification of Guatemala jadeite jade.
1. Introduction
Guatemala jadeite jade, composed of jadeite and minor omphacite, is rich in color, and there are green, blue-green, gray, black and other types. The mining area can also generate the “Guatemala imperial jade” with the best quality and highest value [1,2], which shows a brilliant green color. The blue-green variety called Type II by Foshag is commercially termed as “Olmec Blue” and presents a distinct blue hue, translucence, and attractive blue color under transmitted light [2]. The color of jadeite jade is influenced by its main constituent minerals, the types and contents of trace elements in jadeite or diopside, as well as secondary minerals. Thus, the color of jadeite jade has a close relationship with the geological or tectonic evolution of its formation. According to the different formation processes, it can be divided into two categories of primary and secondary colors. After the formation of jade, the secondary color is generally caused by the infiltration of external-colored minerals such as hematite, limonite, and clay minerals, distributed in the surface and near the surface [3]. The primary color is caused by chromic ions during the formation of jadeite, which is the color of the main minerals (jadeite, Kosmochlor, and omphacite) and the secondary minerals (hornblende, albite) [4,5]. Currently, mineral chemistry studies show that the color of jadeite jade is associated with the content of chromogenic elements. For instance, a large amount of Cr3+ causes the jadeite jade to be dark green, while minor Cr3+ cause jade to appear an emerald-green color. Cr3+ was derived from the metasomatic chromium spinel, chromite, and sodium chromite pyroxene in serpentinites. The Fe causes jadeite to be dark green or gray, and may be associated with omphacite that is rich in Ca, Fe, and Mg but does not contain Cr3+ [5]. Nearly all iron is presented as ferric (trivalent) iron in white jadeite jade, while in black jadeite jade, half is ferrous (divalent) and half is ferric (trivalent). In the green jadeite jade, the Fe2+/Fe3+ ratio ranges from 0.1 to 0.2 [6].
Jadeite jade from Guatemala and Myanmar are often similar in appearance, thus the origin between them is quite difficult to constrain. ‘Jade’ contains the high-pressure minerals of jadeite or omphacite with specific mol.% Jd (Jd%) in the solid-solution jadeite–diopside–hedenbergite. The Jd% value was then quantified from the wavenumber shift of the symmetric Si–O–Si Raman vibration band [7,8]. The Raman and FTIR spectra of the omphacite shift proportionally toward the low-wave number with the isomorphic substitution of Na+Al3+ → Ca2+(Mg2+, Fe2+). Semi-quantitative calculations based on the Raman (~680 cm−1) and FTIR modes (~658, ~576, and ~424 cm−1) showed consistent jadeite end-member components (~43% to ~64%) in the Myanmar samples; whereas, those (~23% to ~87.5%) of the Guatemala samples were wider and generally lower [9,10]. The rarity of jadeite and its top color are the main factors in evaluating jadeite. Color is essential to the quality evaluation of jadeite jade, and the commercial value of jadeite is also related to the uniformity of color distribution, transparency, and mineral compositions. The price of Guatemala jadeite jade has risen rapidly in the market, and it is generally similar in appearance to Myanmar jadeite jade, and is occasionally sold disguised as the latter. The Guatemala jadeite jade shows a variety of colors and complex compositions. However, relatively little research has been conducted on the origin and color grading of Guatemalan jadeite in the market [11,12].
In this paper, the spectroscopic characteristics and color origin of different colors of Guatemala jadeite jade were studied. The different mineral facies of jadeite jade were identified by infrared and Raman spectra. The color origin of various chemical components and trace elements were reasonably analyzed with UV-VIS, XRF, and EPMA. This study is significant for the identification and trading of jadeite jade in the market.
2. Geological Background
The Guatemala jadeite jade deposit occurs in the North America–Caribbean plate collision zone in southern North America (Figure 1). The Guatemala Suture zone, also called the Guatemala Central fault zone, separates the Maya Plate from the Caribbean Plate [13,14]. High pressure and low temperature (HPLT) metamorphism exists on both the north and south sides of the Motagua fault zone. However, the compositions of orebodies on both sides show distinct characteristics. In the southern orebodies, there is a large amount of jadeitite, eclogite, glaucophane-eclogite, glaucophane schist, and other HPLT rock minerals, which act as crystalline and metasomatism-type jadeite jade deposits, formed during the late Jurassic period at 154 Ma. Meanwhile, the northern orebodies contain a large amount of jadeitite, albite, garnet-clinozoisite amphibolite, or clinozoisite eclogite, which is a crystalline jadeite deposit, formed during the late Cretaceous period at 98–95 Ma. HPLT-eclogite, garnet amphibolite, and jadeite in the central Motagwa River Valley rock masses can be found [15,16], while the commercial exploitation value of Guatemalan jadeite jade is mostly discovered in the Mesozoic tectonic serpentinite rock mass along the Motagwa fault zone [17,18].
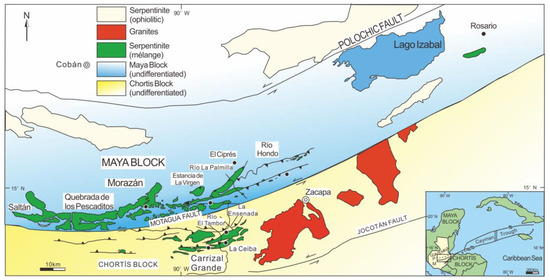
Figure 1.
Generalized geological framework of Guatemala jadeite jade deposits. The inserted figure shows that Guatemala jadeite jade deposits are located between the Maya Block and Chortis Block (modified after Harlow et al. [16]).
The Guatemala jadeite jade is usually generated in serpentinite bodies in lenticular or veined shapes, and some exist as single structural inclusions. Jadeitite is commonly associated with albite. Albitites are formed at a lower pressure at the expense of jadeitite, and some albite-mica rocks could have formed at pressures comparable to jadeite and yet others formed at lower pressure conditions [19,20]. In addition, the enrichment layers of jade also exist in the alluvium and riverbed terraces of the Motagua River, with gravels up to 1 m in diameter. The jadeite jade formation temperature is <400 °C, while the pressure is between 0.5 and 1.1 GPa [21].
Guatemala jadeite jade ores commonly show green, purple, blue, and black characteristics, occasionally presenting a brilliant green color, and its transparency is translucent to slightly transparent and partially opaque. The mineral compositions are dominated by jadeite, omphacite, mica, and hedenbergite, with medium to refined grains and uniform and dense textures.
3. Sampling and Methods
3.1. Sampling
Based on the jade color and transparency classification standard, about 20 raw stone samples were screened for analysis, from which six different colors of light green, dark green, black-green, blue-green, gray-green, and black samples were selected for fine polishing (Figure 2). Basic gemological properties, such as refractive index (RI) and specific gravity (SG), are measured three times per sample to determine the range of parameters. The internal textural characteristics of the samples are then observed under a gemstone microscope (Figure 3), and polished thin sections were prepared for petrographic studies. Then, the FTIR, Raman spectroscopy, and UV-Vis were performed at different positions of the samples; the spectrogram was analyzed, and the trace elements were roughly judged in combination with XRF measurements. Finally, EPMA was used to determine the content of the main elements in the samples, and the main formation mechanisms for the different colors were analyzed comprehensively.
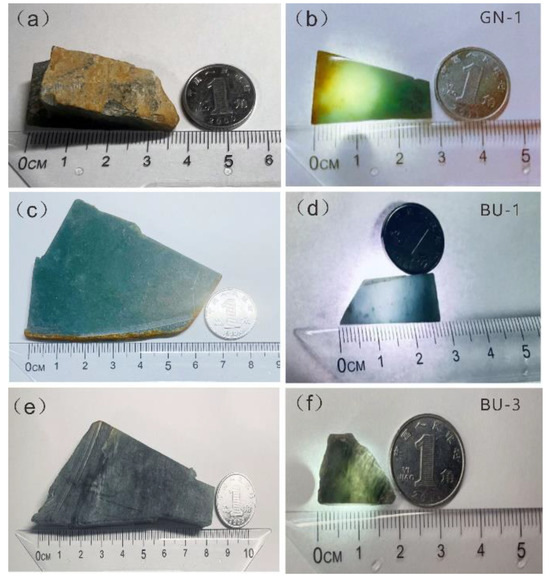
Figure 2.
Photograph of representative hand specimens of Guatemala jadeite jade. (a,b) The edges of the sample GN-1 show a large amount of yellow weathered skin before polishing. While the polished interior has green and yellow sections. (c,d) Sample BU-1 with blue-green color before and after polishing. (e,f) Sample BU-3 with black color before and after polishing.
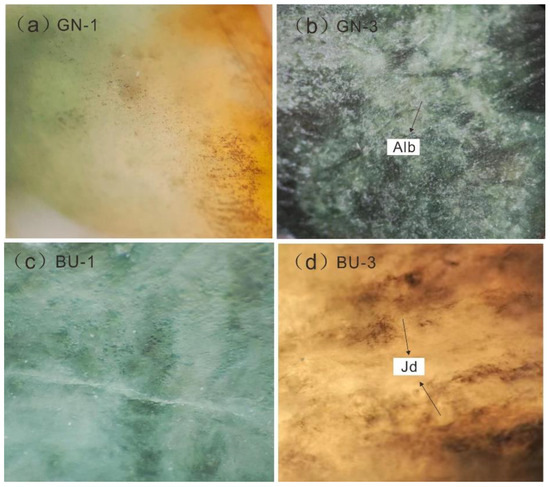
Figure 3.
Representative microscopic photos of samples. Alb: albite; Jd: jadeite.
The first group of samples showed different green tones, which were labeled as GN-1 (light green), GN-2 (dark green), and GN-3 (black-green); while the second group of samples, with other green tones, was marked with BU-1 (blue-green), BU-2 (gray-green), and BU-3 (black). All of the samples show glassy luster with uneven color distribution. The GN-1 sample shows weathered yellow skin, while the GN-3 sample exhibits numerous irregular white spots visible to the naked eye. The interior of the BU-1 sample presents a blue-green color under transmission light, and the interior of the BU-3 sample exists in abundant black particles (Figure 2).
The refractive indexes of the samples measured by using a well-polished plane are 1.665–1.672, and the refractive index by point measurement was 1.66, indicating the approximate parameters. The specific gravity of the samples measured by the hydrostatic method is in the range of 3.26–3.43. The absorption line of 437 nm was observed under spectroscope. The samples show inert characteristics under ultraviolet fluorescence. The Mohs hardness is about 7.
3.2. Analytical Methods
3.2.1. Fourier Transform Infrared Spectroscopy (FTIR)
The representative samples were tested using TENSOR27 FTIR (BRUKER OPTICS, Ettlingen, Germany) at the Chinese Academy of Metrology. Test conditions: resolution: 4 cm−1; time: 100 ms. Collect multiple scans to improve accuracy.
3.2.2. Laser Raman Spectroscopy
Raman spectroscopy of representative samples was performed at the National Jewelry Quality Supervision and Inspection Center using a Dual-100 (Jiangsu Tianrui Instrument Co., Ltd., Suzhou, China). The wavelength used is 532 nm, and the instrument setup allows a spectral resolution of 4 cm−1. We used a scanning time of 10 s of spectrum in an extending mode spanning 100~4000 cm−1 with a grating of 1800 gr mm−1, about 1 cm−1 resolution, and a 50× lens.
3.2.3. UV-Visible Spectroscopy (UV-Vis)
UV-Vis of representative samples was performed at the National Jewelry Quality Supervision and Inspection Center using a Gem UV-100 instrument (Jiangsu Tianrui Instrument Co., Ltd., Suzhou, China). Analytical conditions: integration time: 100 ms; collection cycle: 8 times. The test condition uses reflection, and a test range of 200–1000 nm.
3.2.4. X-ray Fluorescence Spectroscopy (XRF)
XRF was performed at Chengdu Avenue Benzhen Jewelry Testing Center using an EDS880 instrument (Chengli Bochuang Technology Chengdu Co., Ltd., Chengdu, China). Test conditions: element range: Na~U; resolution: 145 eV; current: 600 mA; voltage: 200 V. Each sample is tested three times at different positions on the polished surface to improve accuracy.
3.2.5. Electronic Probe Micro-Analysis (EPMA)
The electron microprobe analyses (EPMA) and backscattered electron (BSE) and surface scanning of the samples were performed at Wuhan Upspectrum Analysis Technology Laboratory using a JEOL JXA-8230 microprobe (Nippon Electronics, Tokyo, Japan) with an accelerating voltage of 15 kV, beam current 2 × 10⁻⁸ A, and beam spot diameter 3 μm. The data collection time is 20–60 s. The ZAF method was used to correct the data, and the analysis accuracy was less than 1%. Wavelength dispersive spectroscopy (WDS) analyzed the chemical compositions of different samples. Testing standards: calcite (Ca), rutile (Ti), corundum (Al), quartz (Si), nickelic (Ni) oxide, hematite (Fe), huebnerite (Mn), chromium oxide (Cr), jadeite (Na), forsterite (Mg), and potassium feldspar (K).
4. Results and Discussion
4.1. Petrographic Analysis
The petrography study shows that the main mineral in jadeite jade with black color is jadeite, accounting for more than 90%, while the secondary mineral is omphacite, with a content of ~5%. The mineral intergranular space is filled with Fe-oxides and opaque metal minerals with a content of ~1%. The mineral grains generally exhibit semi-idiomorphic columnar to xenomorphic granular textures with particle sizes of 0.1~3 mm, and 0.5~5 mm, respectively (Figure 4a). There are apparent reaction boundaries, ductile deformation, and cataclastic structures among the minerals, indicating that they were formed by dynamic metamorphism under certain P/T conditions. The omphacite mostly replaced early jadeite along jadeite fractures or grain edges or crystallized among jadeite grains, suggesting that jadeite crystallized earlier than omphacite [21,22]. The late omphacite and early jadeite may be transformed by dynamic metamorphism and undergo ductile deformation, thus recrystallizing, while the late crystalline veins are mainly composed of purest jadeite. The black inclusions and fissures in Guatemala jadeite jade increase the gap between jadeite particles and enhance light refraction and diffuse reflection. In addition, there are many defects and dark inclusions inside the jade, which change the transparency, affecting the color depth of the jade (Figure 4b). Some samples show microblastic and parallel fibrous textures. Other samples show porphyrioblastic textures. Both of the samples suggest that the main mineral is jadeite, accounting for more than 90%, which presents II blue color under the orthogonal polarizer (Figure 4c,d).
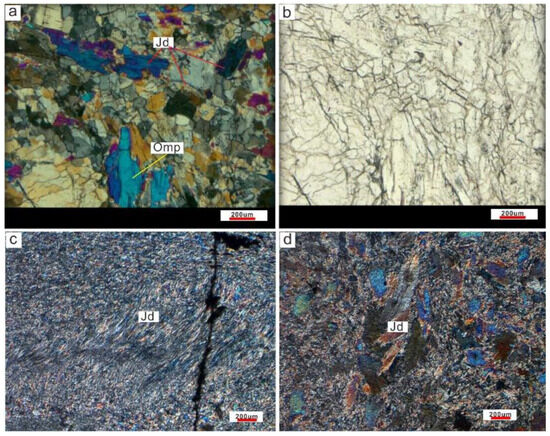
Figure 4.
Representative photomicrographs showing the different textures of samples with different colors. (a) Textural characteristics of jadeite and omphacite under crossed polarizer. (b) Fractures and black minerals in the jadeite jade under single polarizer. (c,d) Distinct textural characteristics of jadeite under crossed polarizer. Jd: jadeite; Omp: omphacite.
4.2. FTIR Analysis
Due to the absorbed peaks of omphacite and jadeite being quite similar, the peaks of GN-1, GN-2, BU-2, and BU-3 samples present slightly different characteristics (Figure 5). The samples were identified by discriminating the significant absorption peaks of jadeite’s “five finger peaks,” 1169 cm−1, 1078 cm−1, 937 cm−1, 597 cm−1, and 517 cm−1, respectively [22,23,24]. The results show that the peaks of GN-1 and GN-2 samples are consistent with jadeite. Moreover, according to the infrared-absorption peaks of the jade sample >658.7, >574.5, >422.5 cm−1, the Na/Na + Ca ratio of the jade sample is higher than 0.8, jointly revealing that the main mineral of the samples is jadeite. Otherwise, it is omphacite [22,23]. The typical indication is that the main mineral composition of the sample is jadeite.
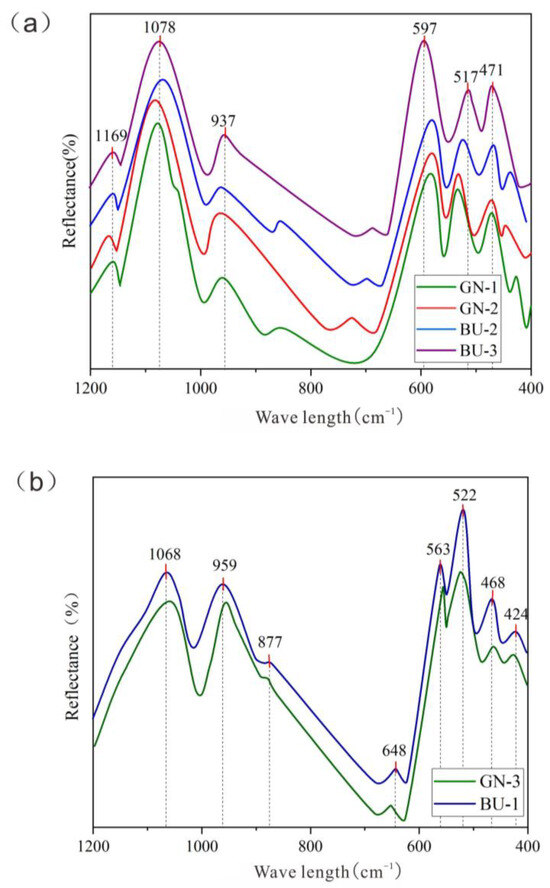
Figure 5.
Infrared spectra of Guatemalan jadeite specimens: (a) Infrared spectra showing jadeite characteristic peaks of Guatemalan jadeite jade. (b) Guatemalan jadeite jade with characteristic peaks of omphacite.
FTIR was performed with the reflection mode. The infrared beam illuminates the sample on the bench [24], and the detector collects the scattered light to obtain spectra by the correlation vibration of Si-O and M-O, and the absorption peaks in the range of 1100–800 cm−1 are attributed to Si-Ob-Si asymmetric stretching vibration and Ot-Si-Ot symmetrical stretching vibration, respectively [23]. The absorption peaks located at 600–400 cm−1 belong to the Si-O bending vibration and M-O stretching vibration, respectively (Table 1). The GN-3 and BU-1 samples are dominantly composed of omphacite, indicating the main mineral compositions of Guatemala jadeite jade are jadeite and omphacite instead of single components [24].

Table 1.
Infrared spectral peak assignments of samples with distinct colors.
4.3. Raman Spectrum Analysis
Raman shift peaks were observed at 1044 cm−1, 995 cm−1, 701 cm−1, 578 cm−1, 530 cm−1, 379 cm−1, and 330 cm−1 in the samples of GN-1, GN-2, BU-2, BU-3, BU-2 (white lines), and BU-3 (gray margins) (Figure 6). In the 1200–800 cm−1 range, 1044 cm−1 and 995 cm−1 are caused by Si-O symmetric stretching vibration. The absorption peaks of the 701 cm−1, 578 cm−1, and 530 cm−1 in the 800–400 cm−1 are attributed to the Si-Ob-Si symmetric bending vibration. (Table 2). The above shift peaks are compatible with the features of jadeite. Moreover, the samples all show double peaks near 1000 cm−1, so it is inferred that the main component mineral of the samples is jadeite. In addition, the peak intensity of different samples near 995 cm−1 exhibits different characteristics [23]. When the peak intensity gradually decreases, it is related to the partial replacement of jadeite by omphacite.
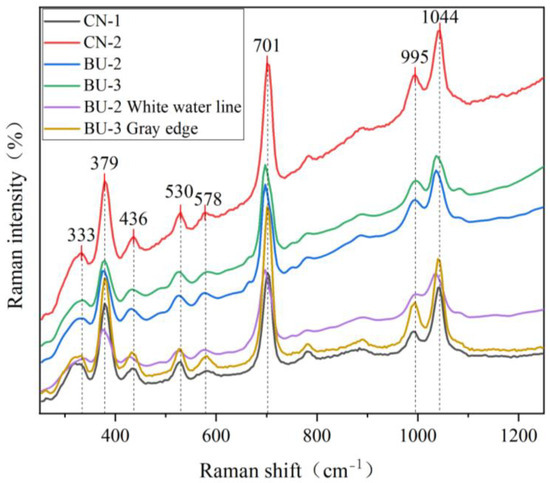
Figure 6.
Guatemalan jadeite jade with jadeite characteristic peaks shown by Raman spectroscopy.
Table 2.
Raman peak assignment of samples GN-1, GN-2, BU-2, white water line, BU-3, and white edge.
The sample BU-1 presents peaks at 1025 cm−1, 689 cm−1, and 358 cm−1, which are typical peaks of omphacite minerals, while no double peaks were detected near 1000 cm−1 with only a single peak discovered at 1025 cm−1, indicating that the transformation of jadeite into omphacite is relatively complete (Figure 7). The shape of the peaks shows that the sample BU-1 exhibits smooth structures, while the Dark green spot shows sharp characteristics, indicating that the crystallinity of the latter is higher. Moreover, the ~680 cm−1 peak could be used to identify jadeite and omphacite, revealing compositional variations of the jadeite–omphacite solid solution [24]. The results show the spectra shift toward omphacite for some analyzed spots (Figure 7), indicating that the composition of the solid solution shifts toward omphacite. It is inferred that the blue-water jadeite becomes darker with the increase in omphacite content [24,25].
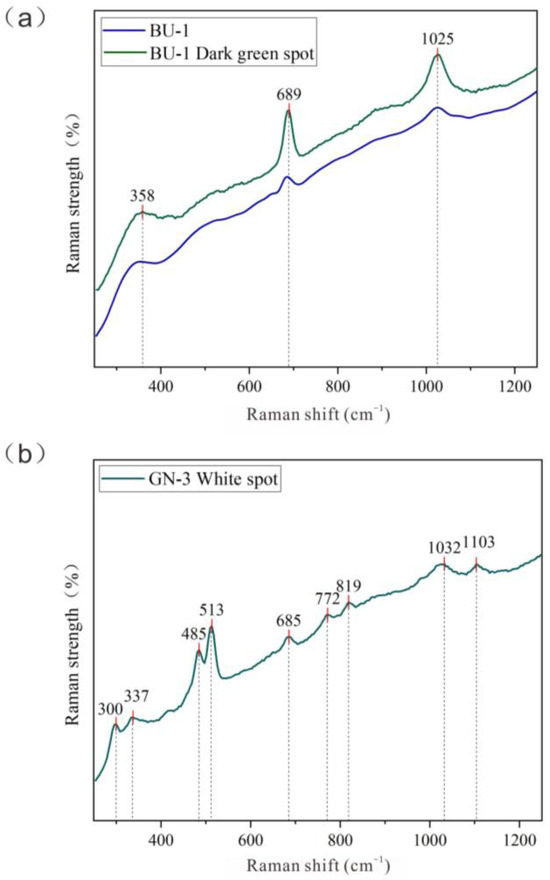
Figure 7.
Raman spectrogram of Guatemala jadeite jade. (a) Blue-green Guatemala jadeite indicates transition from jadeite to omphacite. (b) Black-green Guatemala jadeite jade showing characteristic peaks of omphacite.
In the range of 1200–800 cm−1, the peak assigned by the Si-O symmetric stretching vibration band is 1025 cm−1. In the range of 800–400 cm−1, the peaks that satisfy the symmetric bending vibration band assignment of Si-Ob-Si are 689 cm−1 and 685 cm−1. (Table 3).
Table 3.
Raman peak assignment of sample BU-1 and dark green spot.
In addition, the white spot of the GN-3 sample shows that the main peaks are located at 1103 cm−1, 1032 cm−1, 819 cm−1, 772 cm−1, 685 cm−1, 513 cm−1, 485 cm−1, 337 cm−1, and 300 cm−1, suggesting albite mineral (Figure 6). The peaks at 513 cm−1, 485 cm−1, and 330 cm−1 are relatively sharp, indicating albite with a good degree of crystallization. According to the FTIR analysis, the main constituent mineral of the GN-3 substrate is omphacite; so, it can be further inferred that the sample contains a large amount of omphacite and minor albite.
In the range of 1200–800 cm−1, the peaks assigned by the jadeite peak and the peaks assigned by the Si-O symmetric stretching vibration band are 1032 cm−1, and the peaks assigned by the albite peak are 1103 cm−1 and 819 cm−1. In the range of 800–700 cm−1, the peak position of the albite peak satisfying the assignment of the AL-O symmetric stretching vibration band is 772 cm−1, and in the range of 700–400 cm−1. The peak locations of albite satisfying the Ot-Si-Ot bending vibration band assignment are 685 cm−1, 513 cm−1, and 485 cm−1. In the 400–10 cm−1 range, the albite peak position meeting the M-O stretching vibration band assignment is 337 cm−1 and 300 cm−1, which belong to the vibration spectrum of chain silicate (Table 4).
Table 4.
Raman spectral peak assignment of sample GN-3 white spot.
4.4. UV-Vis Analysis
The results show that all samples exhibit an absorption peak near 436 nm in the purple zone (Figure 8). In jadeite, the iron commonly replaces Al3+ with Fe3 (Fe2+ is only minor in jadeite), and the absorption peaks at 437 and 380 nm can be attributed to the d–d electronic transition of Fe3+ in the octahedral field [26]. The intensity of the 437 nm absorption peak indicates the amount of Fe3+ in the jadeite jade [27,28]. In contrast, iron usually exists as Fe2+ in omphacite due to charge-balanced coupled substitution [25]. The weakest absorption peak of the sample GN-1 is located at 436 nm, and the peak shape shows smooth or imperceptible features. The absorption peak of GN-3 is the strongest, and the peak shape is sharp, indicating that the Fe content significantly impacts color. In contrast, the absorption peaks of 630 nm, 660 nm, and 692 nm related to Cr were not detected [24,25]. Therefore, it is inferred that the green color of jadeite jade samples GN-1, GN-2, BU-2, and BU-3 presents no relation to Cr3+, while its color is determined to be related to Fe3+ [26], resulting from the interband electronic transition of Fe3+. Based on the previous conclusion that the change of FeO contents is proportional to transparency and blue purity [27], the blue-green BU-1 sample is slightly transparent, meeting the FeO content of 1 wt.%–2 wt.%, and the amount of Cr is low, which jointly leads to its green color being grayish or bluish [28]. It was confirmed that the color blue-green was related to the contents of Cr3+ and Fe2+. Overall, UV-Vis analysis indicates no Cr absorption peak in gray-green jade but contains a Fe absorption peak, which indicates no Cr or negligible Cr content. Because the jade shows a gray tone, it suggests that Fe exists in the form of Fe2+.
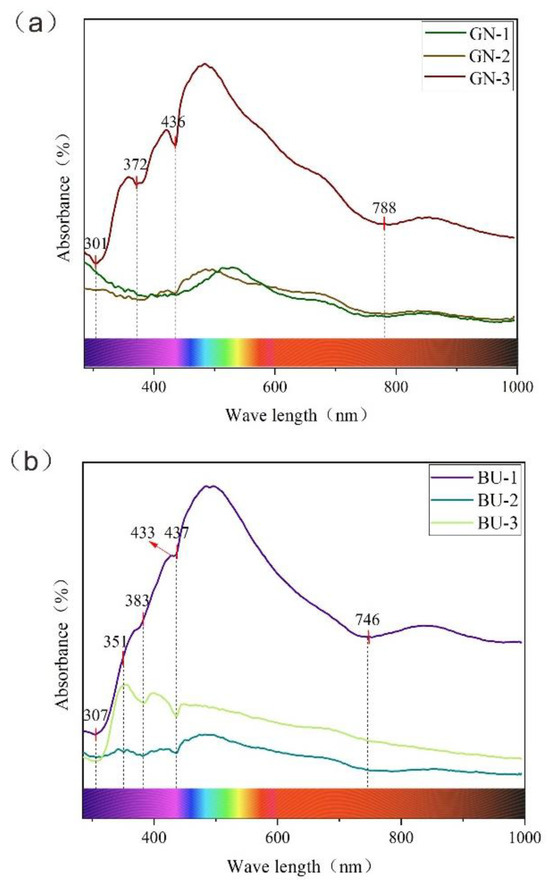
Figure 8.
Ultraviolet-visible spectrum of Guatemala jadeite jade: (a) Different shades of green Guatemala jadeite jade, with varying amounts of Fe. (b) Green Guatemala jadeite jade with other tones, excluding Cr.
4.5. XRF Analysis
The critical chemical elements were analyzed as a supplement to the color origin content. The chemical elements’ analysis results in this study are presented in Table 5.
Table 5.
X-ray fluorescence spectral data of Guatemalan jadeite jade (%).
The dark/mottled green pyroxenic jadeites from Guatemala are composed of jadeite and omphacite, and µ-XRF elemental maps of the omphacite show elevated Ca-Mg-Fe contents [29]. The contents of Fe in samples GN-2, GN-3, and BU-2 exhibit relatively high characteristics in the range of 54.58%, 57.98%, and 60.34%, respectively, indicating that it may be the factor leading to the green color deepening of jade. Among them, the contents of Sr show widely variational characteristics, with the highest content reaching 30.85% (Table 5). The presence of accessory minerals may indicate the involvement of hydrothermal activities during mineralization. The inhomogeneous distribution of Sr in the Guatemala jadeite jade suggests enrichment or depletion during the mineralization processes [28]. The Guatemala jadeite jades contain about 10–12% diopside [28,29]. Notably, the BU-3 sample appears green in color under transmitted light and shows a distinct absorption signature associated with Fe in the XRF spectrum. Therefore, the color of this sample is not related to Cr3+, and Fe2+ dominantly causes its green hue. However, due to the infiltration of jadeite particles and other metal minerals into the space during the later stage of jade formation, the transparency was reduced, and the color turned darker.
4.6. Mineral Chemistry
Representative samples (GN-1, GN-3, BU-1, BU-3) of different colors were selected for EPMA analysis. The mineral EPMA analysis results in this study are presented in Table 6 and plotted in Figure 9. The predominate chemical components of jadeite (sample GN-1, GN-3, BU-1, BU-3) in the present study are SiO2, Al2O3, and Na2O, in the range of 58.87–60.81 wt.%, 22.82–24.99% wt.%, and 13.62–14.91 wt.%, with average values of 59.35 wt.%, 24.06 wt.%, and 14.07 wt.%, respectively, similar to the theoretical values of jadeite [23,24]. The contents of FeO vary from 0.17 to 1.08 wt.%, with an average of 0.56 wt.%. The contents of CaO range from 0.10 to 1.83 wt.%, with a mean of 0.95 wt.%. Thus, the results indicate that jadeite is the main mineral composition of samples GN-1 and BU-3. Generally, Al2O3, SiO2, and Na2O contents exhibit relatively low characteristics, while CaO, FeO, and MgO are relatively high. Ca2+ replaced Na+ in the M2 position, while Al3+ in the M1 position was replaced by Fe3+ and Mg2+, indicating that the late fluid influences jadeite rock formation. Moreover, the contents of CaO are higher than standard values, suggesting that the initial temperature of jadeite jade formation is higher [25,26]. The contents of FeO and MgO are relatively high, resulting in the dark color of the jade. At the same time, the compositions do not consist of Cr2O3, which indicates its color is not directly related to Cr. Moreover, the data showed that the base of the GN-1 sample did not contain NiO, while there was 0.054 wt.% of NiO in the yellow spot, indicating that NiO played an essential role in natural color. In addition, we speculate that the limonite may also cause supergene oxidation in the lattice cracks of jadeite, resulting in a yellow color [27,28,29].
Table 6.
The EPMA data of composed minerals in Guatemala jadeite jade (wt.%).
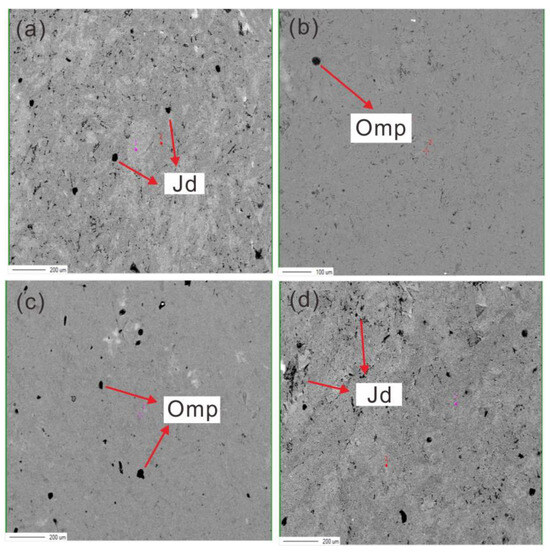
Figure 9.
Representative backscatter electron images (BSE) and analyzed spots. Jd: jadeite, Omp: omphacite, Alb: albite. (a) Light green sample. (b) Black-green samples. (c) Blue-green samples. (d) Black samples with abundant black inclusions dominated by jadeite as well as minor omphacite and metallic minerals.
In contrast, the theoretical values of omphacite (Ca, Na)(Mg, Fe2+, Fe3+, Al)[Si2O6] are SiO2: 55.82%, CaO: 13.29 wt.%, Al2O3: 10.36 wt.%, MgO: 8.31 wt.%, Na2O: 6.91 wt.%, and FeO: 5.28 wt.% [27,28]. The predominate chemical components of omphacite (GN-3, BU-1) in the present study are SiO2, Al2O3, and CaO, in the range of 57.88–58.56 wt.%, 11.60–12.37 wt.%, and 11.07–12.03 wt.%, with average values of 58.33 wt.%, 11.94 wt.%, and 11.54 wt.%, respectively, similar to the theoretical values of jadeite [29,30]. The contents of Na2O range from 7.44 to 7.91 wt.%, with an average value of 7.65 wt.%. The contents of FeO vary from 2.03 to 2.85 wt.%, with an average of 2.57 wt.%, significantly higher than jadeite. The contents of Cr2O3 vary from 0.01 to 0.02 wt.%, averaging 0.01 wt.%. It shows that both GN-3 and BU-1 are jadeite jade composed of omphacite. The contents of Na and Al in jadeite jade mainly composed of omphacite show relatively high characteristics, while the contents of Fe, Ca, and Mg exhibit relatively low features. In the Quad-Jd-Ae diagram, the sample GN-3 was mainly concentrated in the Omp region and a few in the Jd region, indicating that the sample was mainly composed of omphacite with a small amount of jadeite (Figure 10). The distribution of some spots near the dividing line of Jd and Omp indicates the replacement of jadeite by omphacite. The drop spot of the BU-1 sample is concentrated in the Omp region, which suggests that the main mineral is omphacite. The data show that the samples GN-3 and BU-1 contain more Cr elements, with the contents of Cr2O3 in the range of 0.012 wt.%, 0.026 wt.%, and 0.004 wt.%, respectively. It is inferred that Cr3+ causes the color of GN-3 and BU-1. In addition, due to the high contents of Fe, the GN-3 is shown as a dark-green color. When the FeO content reaches 1~2%, the transparency of jadeite will be reduced. The color of GN-3 and BU-3 samples is dark, and the transparency is low, indicating that Fe3+ is low and Fe2+ content is high; so, Fe2+ is presumed to play a leading role in the color darkening and transparency reduction in jadeite. When Fe exists in the form of Fe2+ in ompacite, leading to the jadeite jade presenting a green color with a blue-gray tone [30,31], it is comprehensively inferred that the joint action of Cr3+ and Fe2+ causes the blue-green jadeite jade.
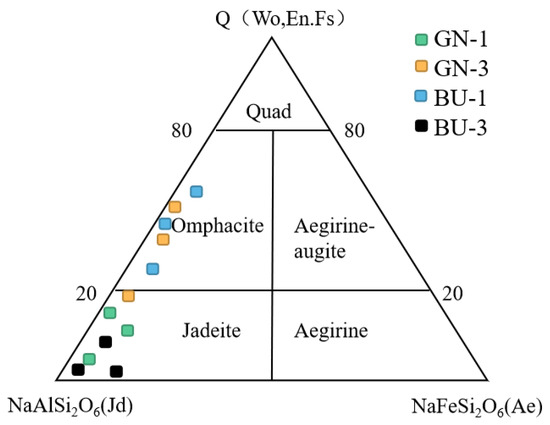
Figure 10.
The Quad-Jd-Ae triangulated diagram of Guatemala jadeite jade in different colors (modified after Morimoto (1988) [27]).
Moreover, the content of MnO in the electron probe data decreases with the sequence of dark green, blue-green, and light green, and it can be inferred that Mn2+ is proportional to the light and dark of green jade and also plays a specific role in the color formation. Moreover, because jadeite jade does not contain Cr2O3, omphacite jade is the opposite; so, the color of omphacite jade will be relatively bright.
The analysis sites of omphacite related jade are mostly concentrated in the Omp region and a few concentrated in the Jd region, indicating that omphacite is the main component mineral. Minor spots close to the dividing line of Jd and Omp indicate that jadeite tends to transition to omphacite (Figure 10).
The values of Na/(Na + Ca) and the pyroxene Nomenclature (edited by Morimoto (1988) were applied to the selection of Guatemalan jadeite samples of different colors [27], as shown in Figure 10.
Comparing samples CN-1-1 and CN-1, it can be discovered that the contents of Al2O3 and Na2O of yellow weathering skin are slightly lower than those of light-green sites [28]. In addition, the contents of CaO and MgO are more significant than those of light-green positions, indicating that the yellow part is subject to dissolution [28,29]. Sample GN-3 with black-green color and BU-1 with blue-green color, mainly composed of omphacite, shows similar characteristics in chemical compositions. However, the distinction is quite significant, mainly because of the higher contents of Cr in sample GN-3, where Cr may be derived from hydrothermal fluids, resulting in the decrease in Na, Al and the increase in Fe, Ca components, respectively. Moreover, the presence of Ni2+ and trace Mn2+ will also affect the green darkening [30,31].
5. Conclusions
The following general conclusions can be derived from the present study.
- (1)
- The main mineral components of Guatemala jadeite jade are jadeite, omphacite, and minor albite.
- (2)
- The green color of Guatemala jadeite jade, mainly composed of jadeite, is caused by the electronic transition between bands of Fe3+. Fe content is proportional to the change of color in a particular range.
- (3)
- The gray characteristics of the gray-green jadeite jade are related to Fe2+ and clay minerals. The black jadeite jade shows a black color due to the internal jadeite and metal mineral inclusions but appear green under transmitted light. The color of jadeite jade, mainly composed of omphacite, is generally attributed to Cr3+ and Fe3+, among which the blue features of blue-green jadeite jade are attributed to the presence of Fe2+ and Mn2+.
Author Contributions
Conceptualization, T.L. and C.Z.; methodology, H.Z. and Y.C.; writing—original draft preparation, all authors; writing—review and editing, T.L., C.Z. and L.L.; supervision, C.Z.; funding acquisition, T.L. and C.Z. All authors have read and agreed to the published version of the manuscript.
Funding
This research was supported by the basic research project of science, education and production integration pilot project of the Qilu University of Technology (Shandong Academy of Sciences) (Grant Number: 11240455) to Cun Zhang.
Data Availability Statement
The authors declare that they have no known competing financial interests or personal relationships that could have appeared to influence the work reported in this paper.
Acknowledgments
We are grateful to Editor-in-Chief Helmut Cölfen, Academic Editor Vladislav V. Gurzhiy and three anonymous reviewers for their constructive comments and suggestions that greatly improve this manuscript. We thank Jingjing Li, Dongni Lan, and Ce zheng for their great help during the experimental analyses. And we are grateful to Diting Liu for his generous sharing of precious jadeite jade samples.
Conflicts of Interest
The authors declare that there is no conflict of interest.
References
- Hargett, D. Jadeite of Guatemala: A contemporary view. Gems Gemol. 1990, 26, 134–141. [Google Scholar] [CrossRef]
- Foshag, W.F. Mineralogical studies on Guatemalan jade. In Smithsonian Miscellaneous Collections; The Smithsonian Institution: Washington, DC, USA, 1957; Volume 135, pp. 15–17. [Google Scholar]
- Rossman, G.R. Lavender jade. The optical spectrum of Fe3+ and Fe2+→Fe3+ intervalence charge transfer in jadeite from Burma. Am. Mineral 1974, 59, 868–870. [Google Scholar]
- Coccato, A.; Karampelas, S.; Wörle, M.; Van Willigend, S.; Pétrequin, P. Gem quality and archeological green ‘jadeite jade’ versus ‘omphacite jade’. J. Raman Spectrosc. 2014, 45, 11–12. [Google Scholar] [CrossRef]
- Ng, Y.N. Description, comparison and discussion of trace element characteristics in jadeitites from Myanmar and Guatemala. China Univ. Geosci. 2015. (In Chinese with English abstract). [Google Scholar]
- Harder, H. Trace elements as colouring agents in jadeites. J. Gemmol. 1995, 24, 508–511. [Google Scholar] [CrossRef]
- Gendron, F.; Smith, D.C.; Masson, P.; Rodríguez Martínez, M.D.C.; Ortiz Ceballos, P. Portable Raman verification and quantification of jade in Olmec ceremonial axes from El Manatí, Veracruz, Mexico. J. Raman Spectrosc. 2017, 48, 1618–1632. [Google Scholar] [CrossRef]
- Harlow, G.E.; Rossman, G.R.; Matsubara, S.; Miyajima, H. Blue omphacite in jadeitites from Guatemala and Japan. Seattle (Washington).Geological Society of America. Abstr. Programs 2003, 6, 254. [Google Scholar]
- Xing, B.Q.; Shi, G.H.; Long, T.F.; Shi, M.Y. Locality determination of inky black omphacite jades from Myanmar and Guatemala by nondestructive analysis. J. Raman Spectrosc. 2022, 53, 2009–2018. [Google Scholar] [CrossRef]
- Shinno, I.; Oba, T. Absorption and photo-luminescence spectra of Ti3+ and Fe3+ in jadeites. J. Miner. 1993, 16, 378–386. [Google Scholar] [CrossRef][Green Version]
- Burns, R.G. Mineralogical Applications of Crystal Field Theory, 2nd ed.; Cambridge University Press: New York, NY, USA, 1993; pp. 87–92. [Google Scholar]
- Finch, R.C.; Dengo, G. NOAM-CARIB Plate Boundary in Guatemala: A Cretaceous Suture Zone Reactivated as a Neogene Transform Fault. Dallas Geol. Soc. 1990, 1–45. [Google Scholar]
- Tsujimori, T.; Liou, J.G.; Coleman, R.G. Coexisting retrograde jadeite and omphacite in a jadeite-bearing lawsonite eclogite from the Motagua Fault Zone, Guatemala. Am. Mineral. 2005, 90, 836–842. [Google Scholar] [CrossRef]
- Burkart, B. Neogene north American-Caribbean plate boundary across Northern Central America: Offset along the polochic fault. Tectonophysics 1983, 99, 251–270. [Google Scholar] [CrossRef]
- Harlow, G.E.; Sisson, V.B.; Lallemant HG, A.; Sorensen, S.S.; Seitz, R. High pressure metasomatic rocks along the Motagua fault zone. Ofioliti 2003, 2, 115–120. [Google Scholar]
- Harlow, G.E.; Sisson, V.B.; Sorensen, S.S. Jadeitite from Guatemala: New observations and distinctions among multiple occurrences. Geol. Acta 2011, 9, 363–387. [Google Scholar]
- Harlow, G.E.; Tsujimori, T.; Sorensen, S.S. Jadeitites and Plate Tectonics. Annu. Rev. Earth Planet. Sci. 2014, 43, 105–138. [Google Scholar] [CrossRef]
- Johnson, C.A.; Harlow, G.E. Guatemala jadeitites and albitites were formed by deuterium-rich serpentinizing fluids deep within a subduction zone. Geology 1999, 7, 629–632. [Google Scholar] [CrossRef]
- Sorensen, S. The origin of jadeitite-forming subduction-zone fluids: CL-guided SIMS oxygen-isotope and trace-elementevidence. Am. Mineral. 2006, 7, 979–996. [Google Scholar] [CrossRef]
- Tsujimori, T.; Harlow, G.E. Petrogenetic relationships between jadeitite and associated high-pressure and low-temperature metamorphic rocks in worldwide jadeitite localities: A review. Eur. J. Mineral. 2012, 2, 371–390. [Google Scholar] [CrossRef]
- Wang, Y.J.; Shi, B.; Yuan, X.Q.; Pei, L.; Chen, T.; Xie, X.L. The Impacts of the Variation of Myanmar Jade Component on ItsInfrared Spectroscopy. Spectrosc. Spectr. Anal. 2015, 8, 2094–2098, (In Chinese with English abstract). [Google Scholar]
- François, G.; David, C.S.; Aïcha, G.B. Discovery of Jadeite-Jade in Guatemala Confirmed by Non-Destructive Raman Microscopy. J. Archaeol. Sci. 2022, 8, 837–851. [Google Scholar]
- Zhang, Y.; Shi, G.H. Origin of Blue-Water Jadeite Jades from Myanmar and Guatemala: Differentiation by Non-Destructive Spectroscopic Techniques. Crystals 2022, 10, 1448. [Google Scholar] [CrossRef]
- Shi, G.H.; Stöckhert, B.; Cui, W.Y. Kosmochlor and chromian jadeite aggregates from the Myanmar jadeitite area. Miner. Mag. 2005, 69, 1059–1075. [Google Scholar] [CrossRef]
- Chen, Q.L.; Yin, Z.W.; Bu, Y.W.; Zhong, Z.Q. Raman Spectroscopy Study on the Mineral Composition of the Guatemalan Jade. Spectrosc. Spectr. Anal. 2012, 32, 2447–2451. [Google Scholar]
- Manrique-Ortega, M.D.; Mitrani, A.; Casanova-González, E.; Jiménez-Galindo, L.A.; Ruvalcaba-Sil, J.L. Methodology for the non-destructive characterization of jadeite-jade for archaeological studies. Spectrochim. Acta Part A Mol. Biomol. Spectrosc. 2019, 217, 294–309. [Google Scholar] [CrossRef] [PubMed]
- Morimoto, N. Nomenclature of pyroxenes. Mineral. Petrol. 1988, 39, 55–76. [Google Scholar] [CrossRef]
- Yang, X. The Study on Gemological and Mineracal Characteristics of Blue-green Jadeite and Its Crust from Guatemala. China Univ. Geosci. 2019. (In Chinese with English abstract). [Google Scholar]
- Wang, L.S.; Zhang, H.H.; Liu, J.Y.; Wang, L.S.; Ou, Y.; Liu, D.M.; Liu, W. Mineral Component and Genesis of High-Grade Green Jadeite Jade from Guatemala. J. Gems Gemmol. 2022, 24, 11–30. [Google Scholar]
- Lin, C.L.; He, X.M.; Lu, Z.Y.; Yao, Y.W. Phase composition and genesis of pyroxenic jadeite from Guatemala: Insights from cathodoluminescence. R. Soc. Chem. 2020, 10, 15937–15946. [Google Scholar] [CrossRef]
- Xing, B.Q.; Shi, G.H.; Zhang, J.H.; Long, C.; Zhang, Y.; He, L.Y.; Hu, R.J. Characteristics of the Guatemalan Feicui and Its Comparison to the Myanmar Feicui. Geoscience 2021, 6, 1769–1788. [Google Scholar]
Disclaimer/Publisher’s Note: The statements, opinions and data contained in all publications are solely those of the individual author(s) and contributor(s) and not of MDPI and/or the editor(s). MDPI and/or the editor(s) disclaim responsibility for any injury to people or property resulting from any ideas, methods, instructions or products referred to in the content. |
© 2023 by the authors. Licensee MDPI, Basel, Switzerland. This article is an open access article distributed under the terms and conditions of the Creative Commons Attribution (CC BY) license (https://creativecommons.org/licenses/by/4.0/).