
Spectroscopy Characteristics and Color-Influencing Factors of Green Iron-Bearing Elbaite


Abstract
:1. Introduction
2. Materials and Methods
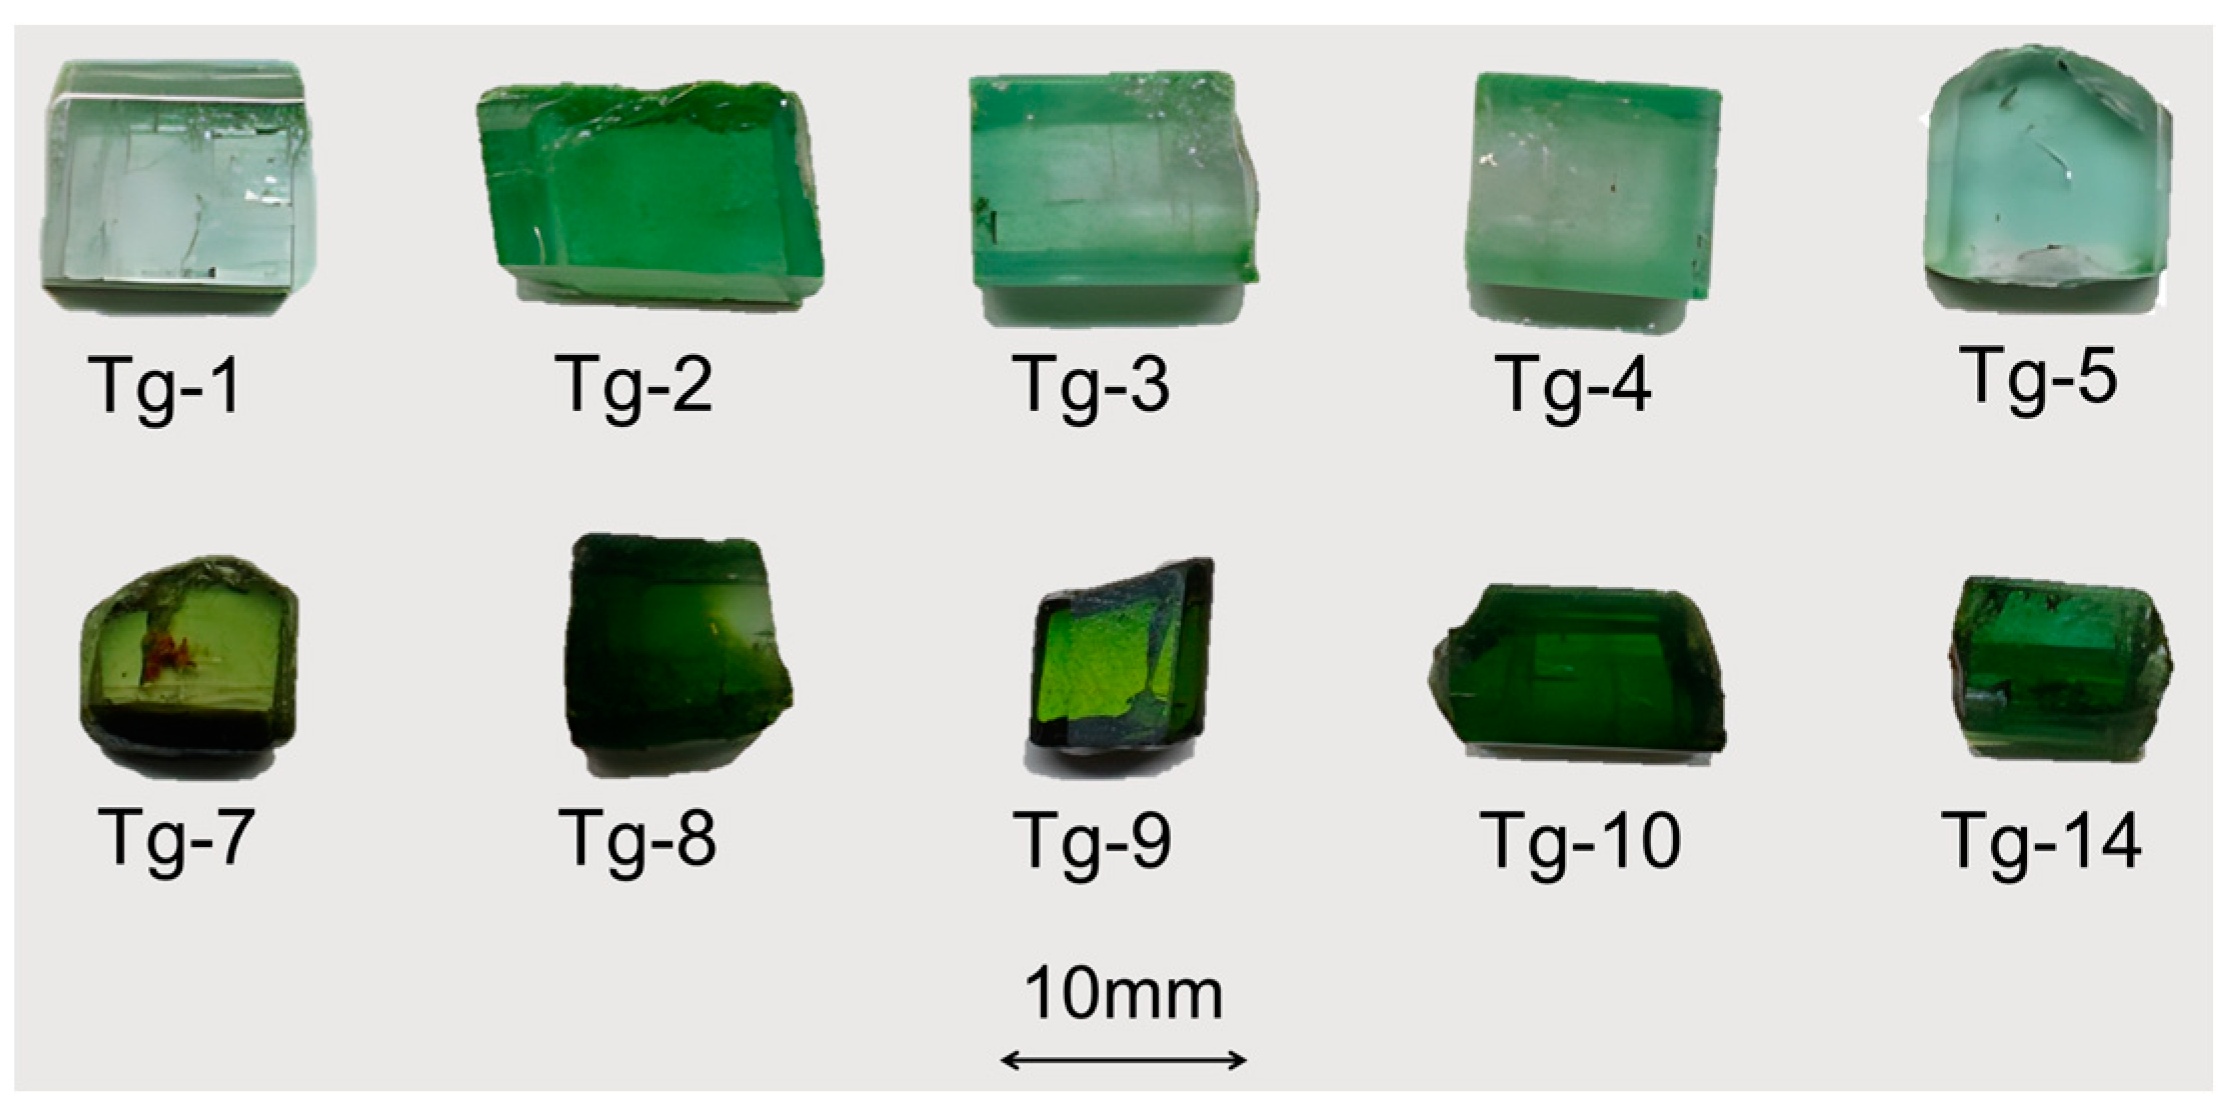
2.1. Materials
2.2. Methods
2.2.1. X-Rite SP62
2.2.2. UV–Vis Spectroscopy
2.2.3. LA-ICP-MS
2.2.4. Infrared Spectroscopy
3. Results
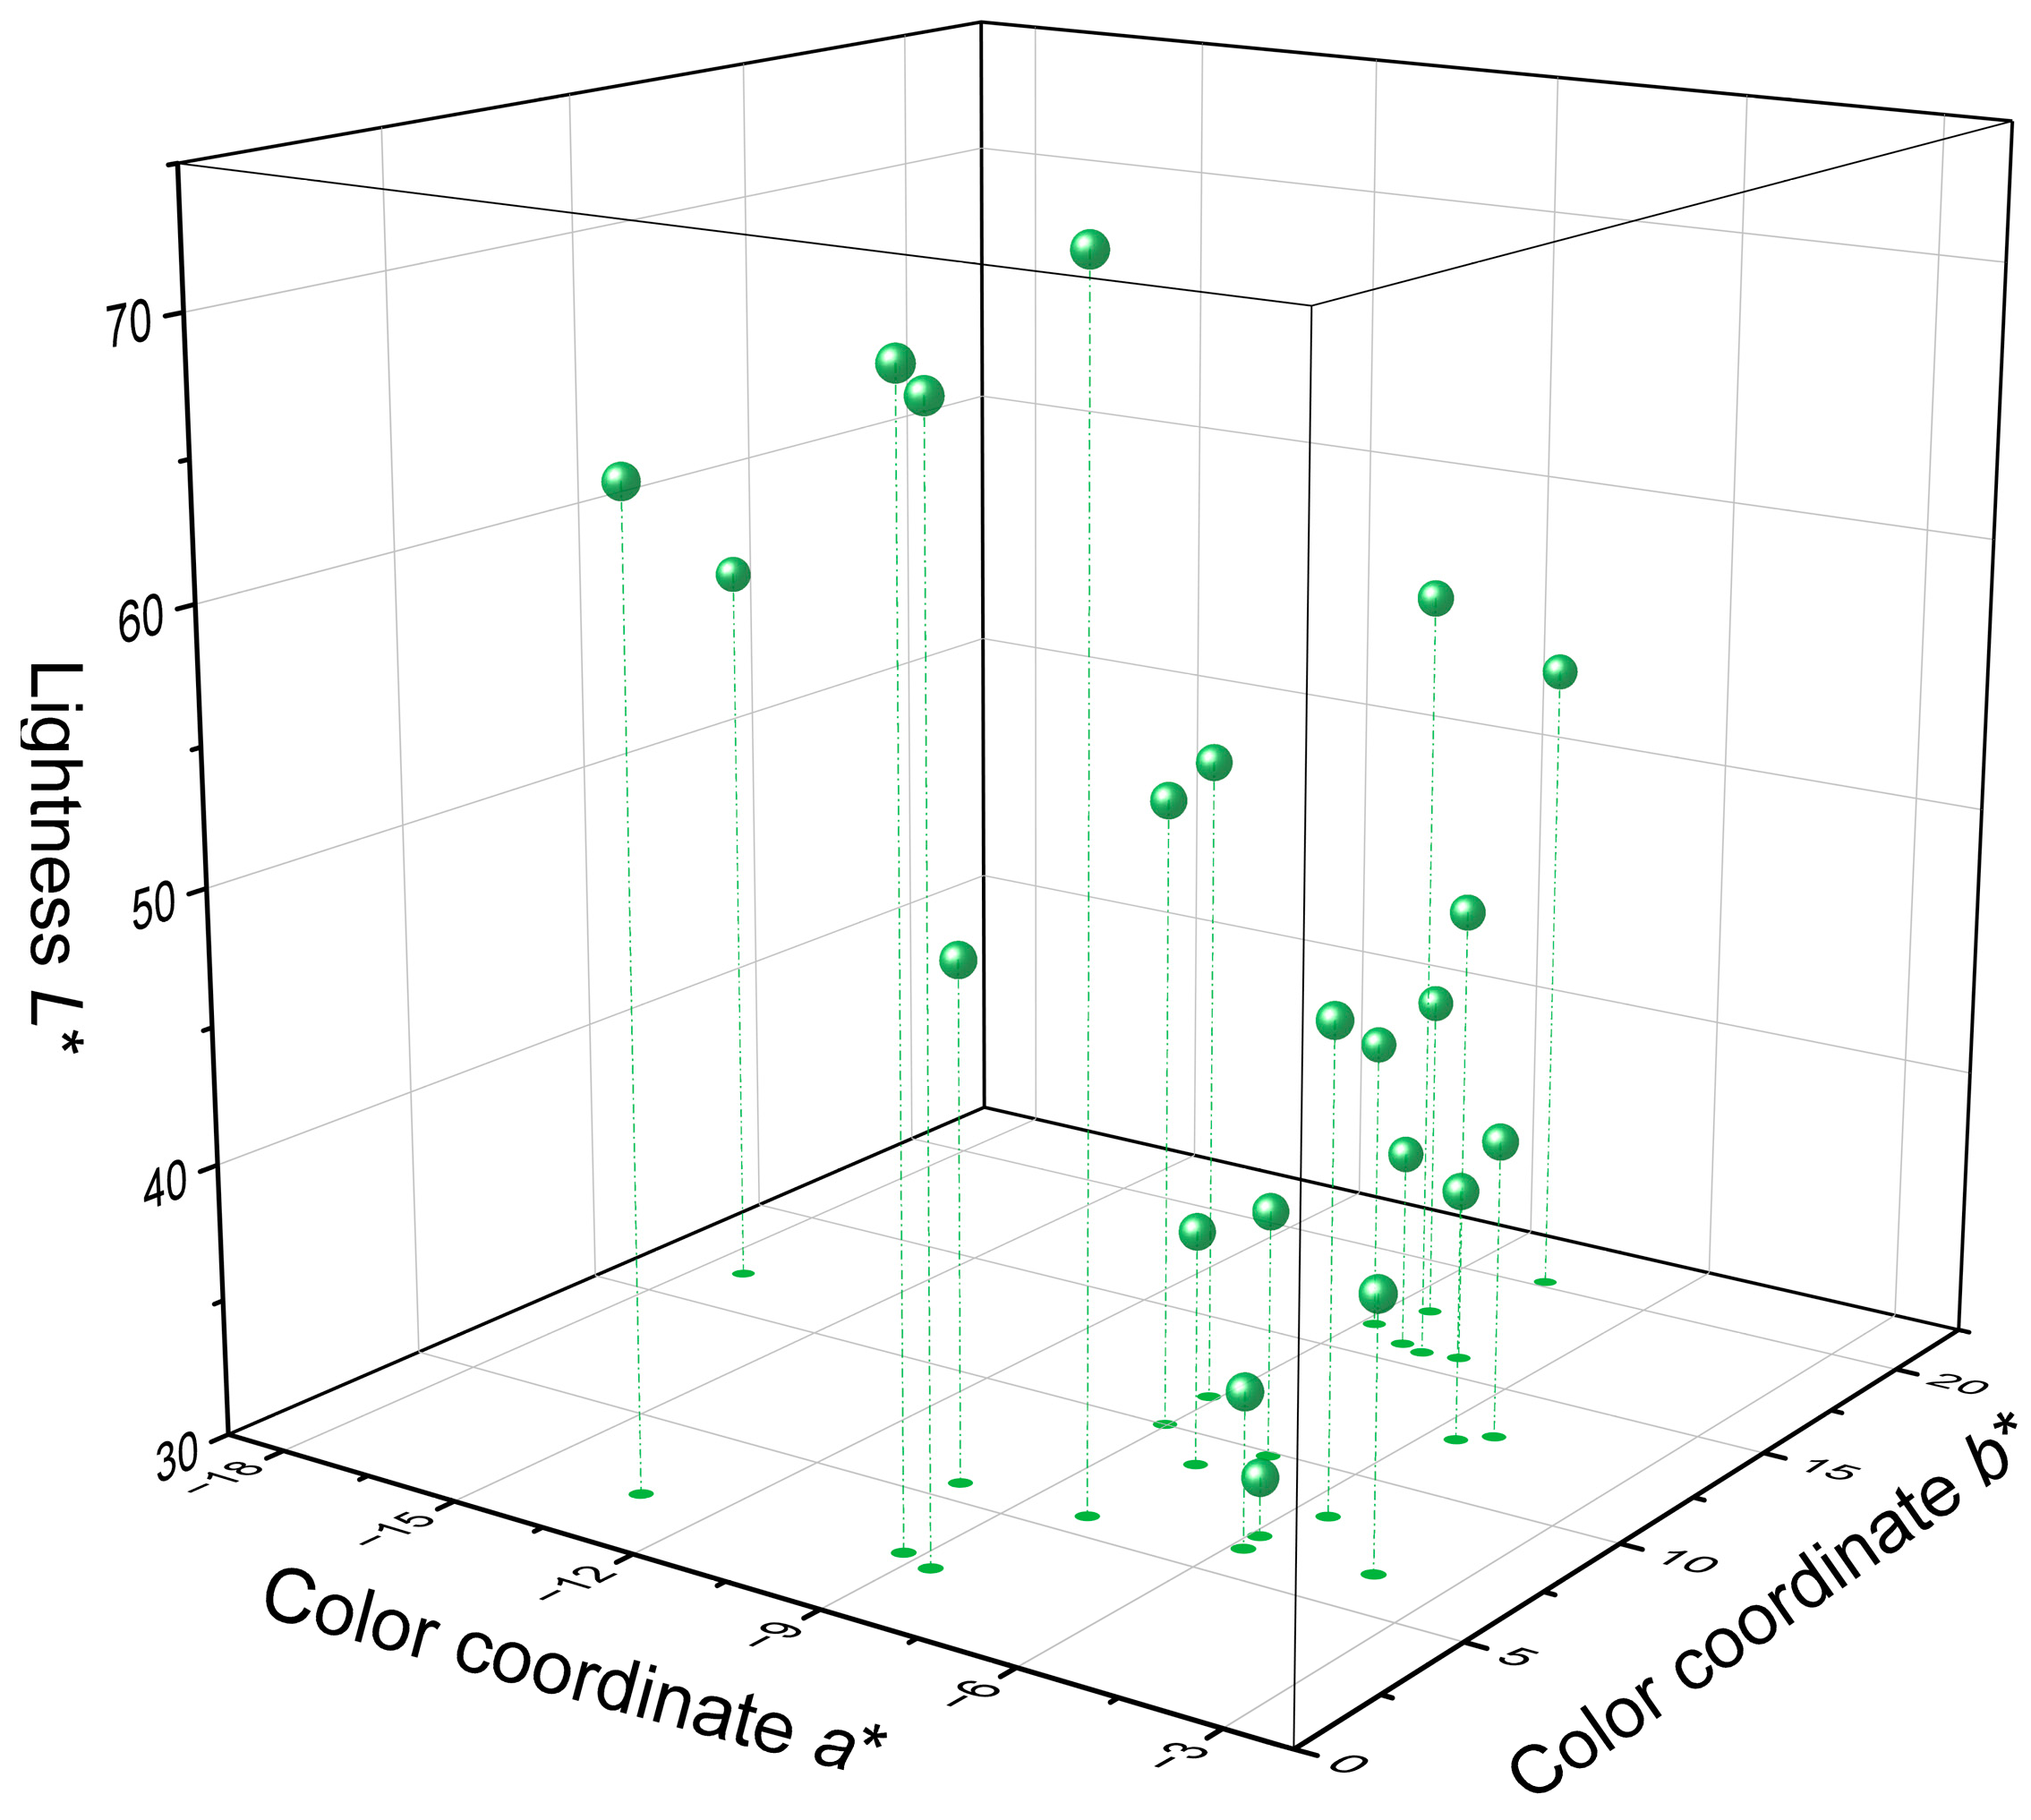
3.1. Color Analysis
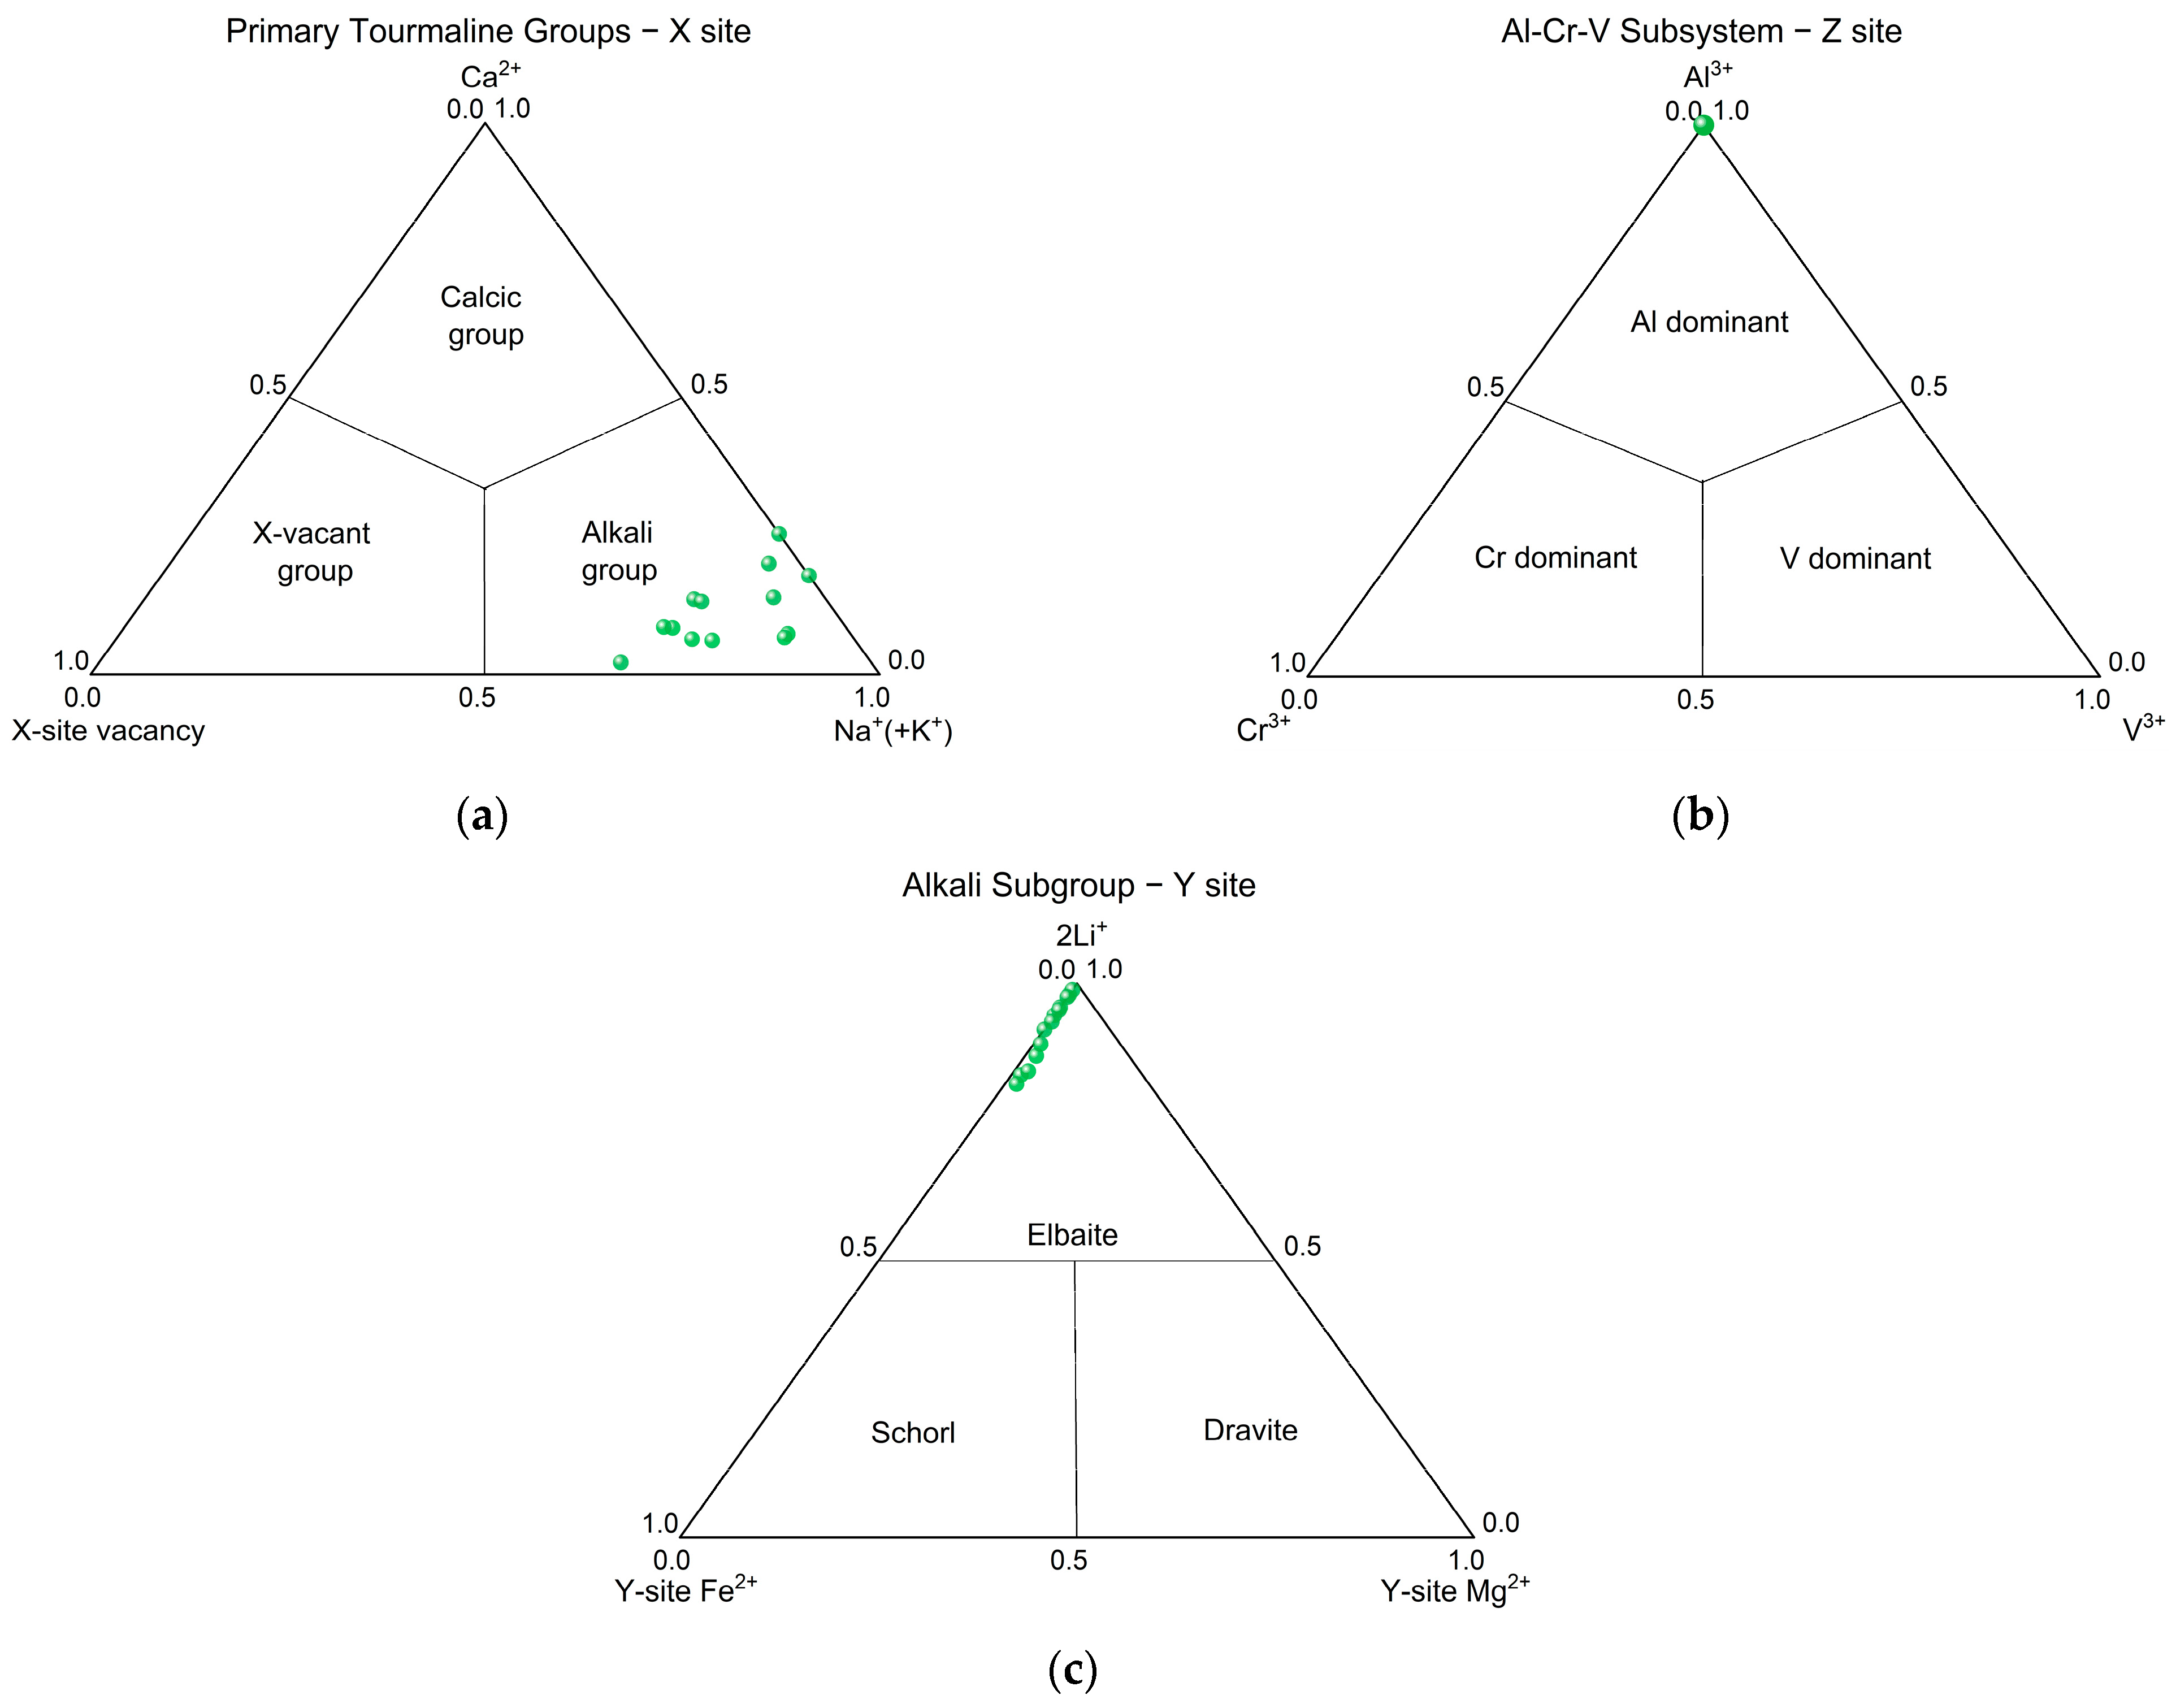
3.2. Chemical Composition
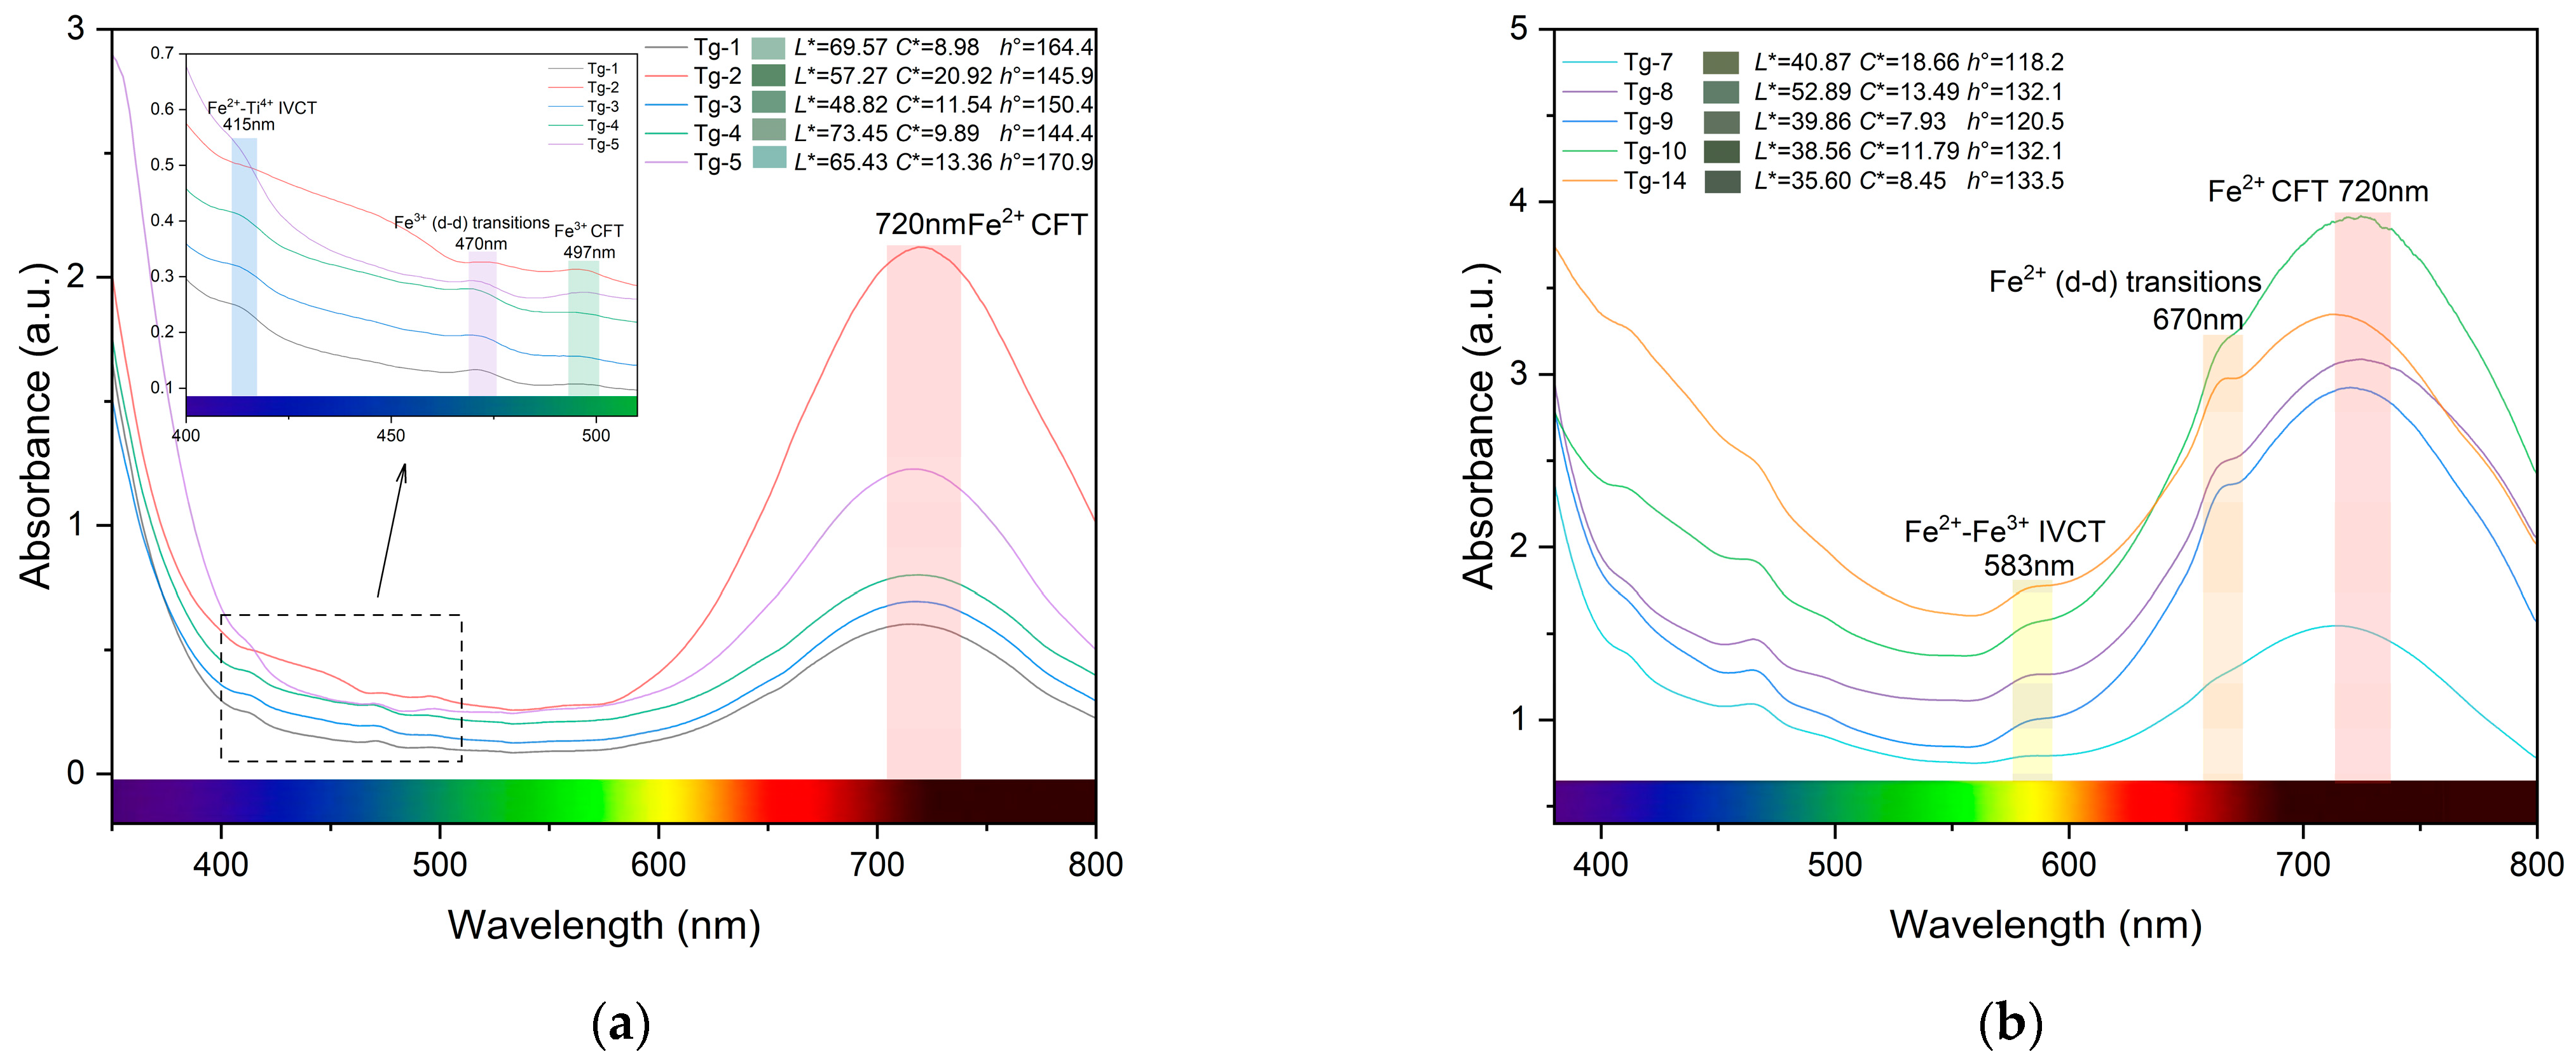
3.3. UV–Vis Spectral
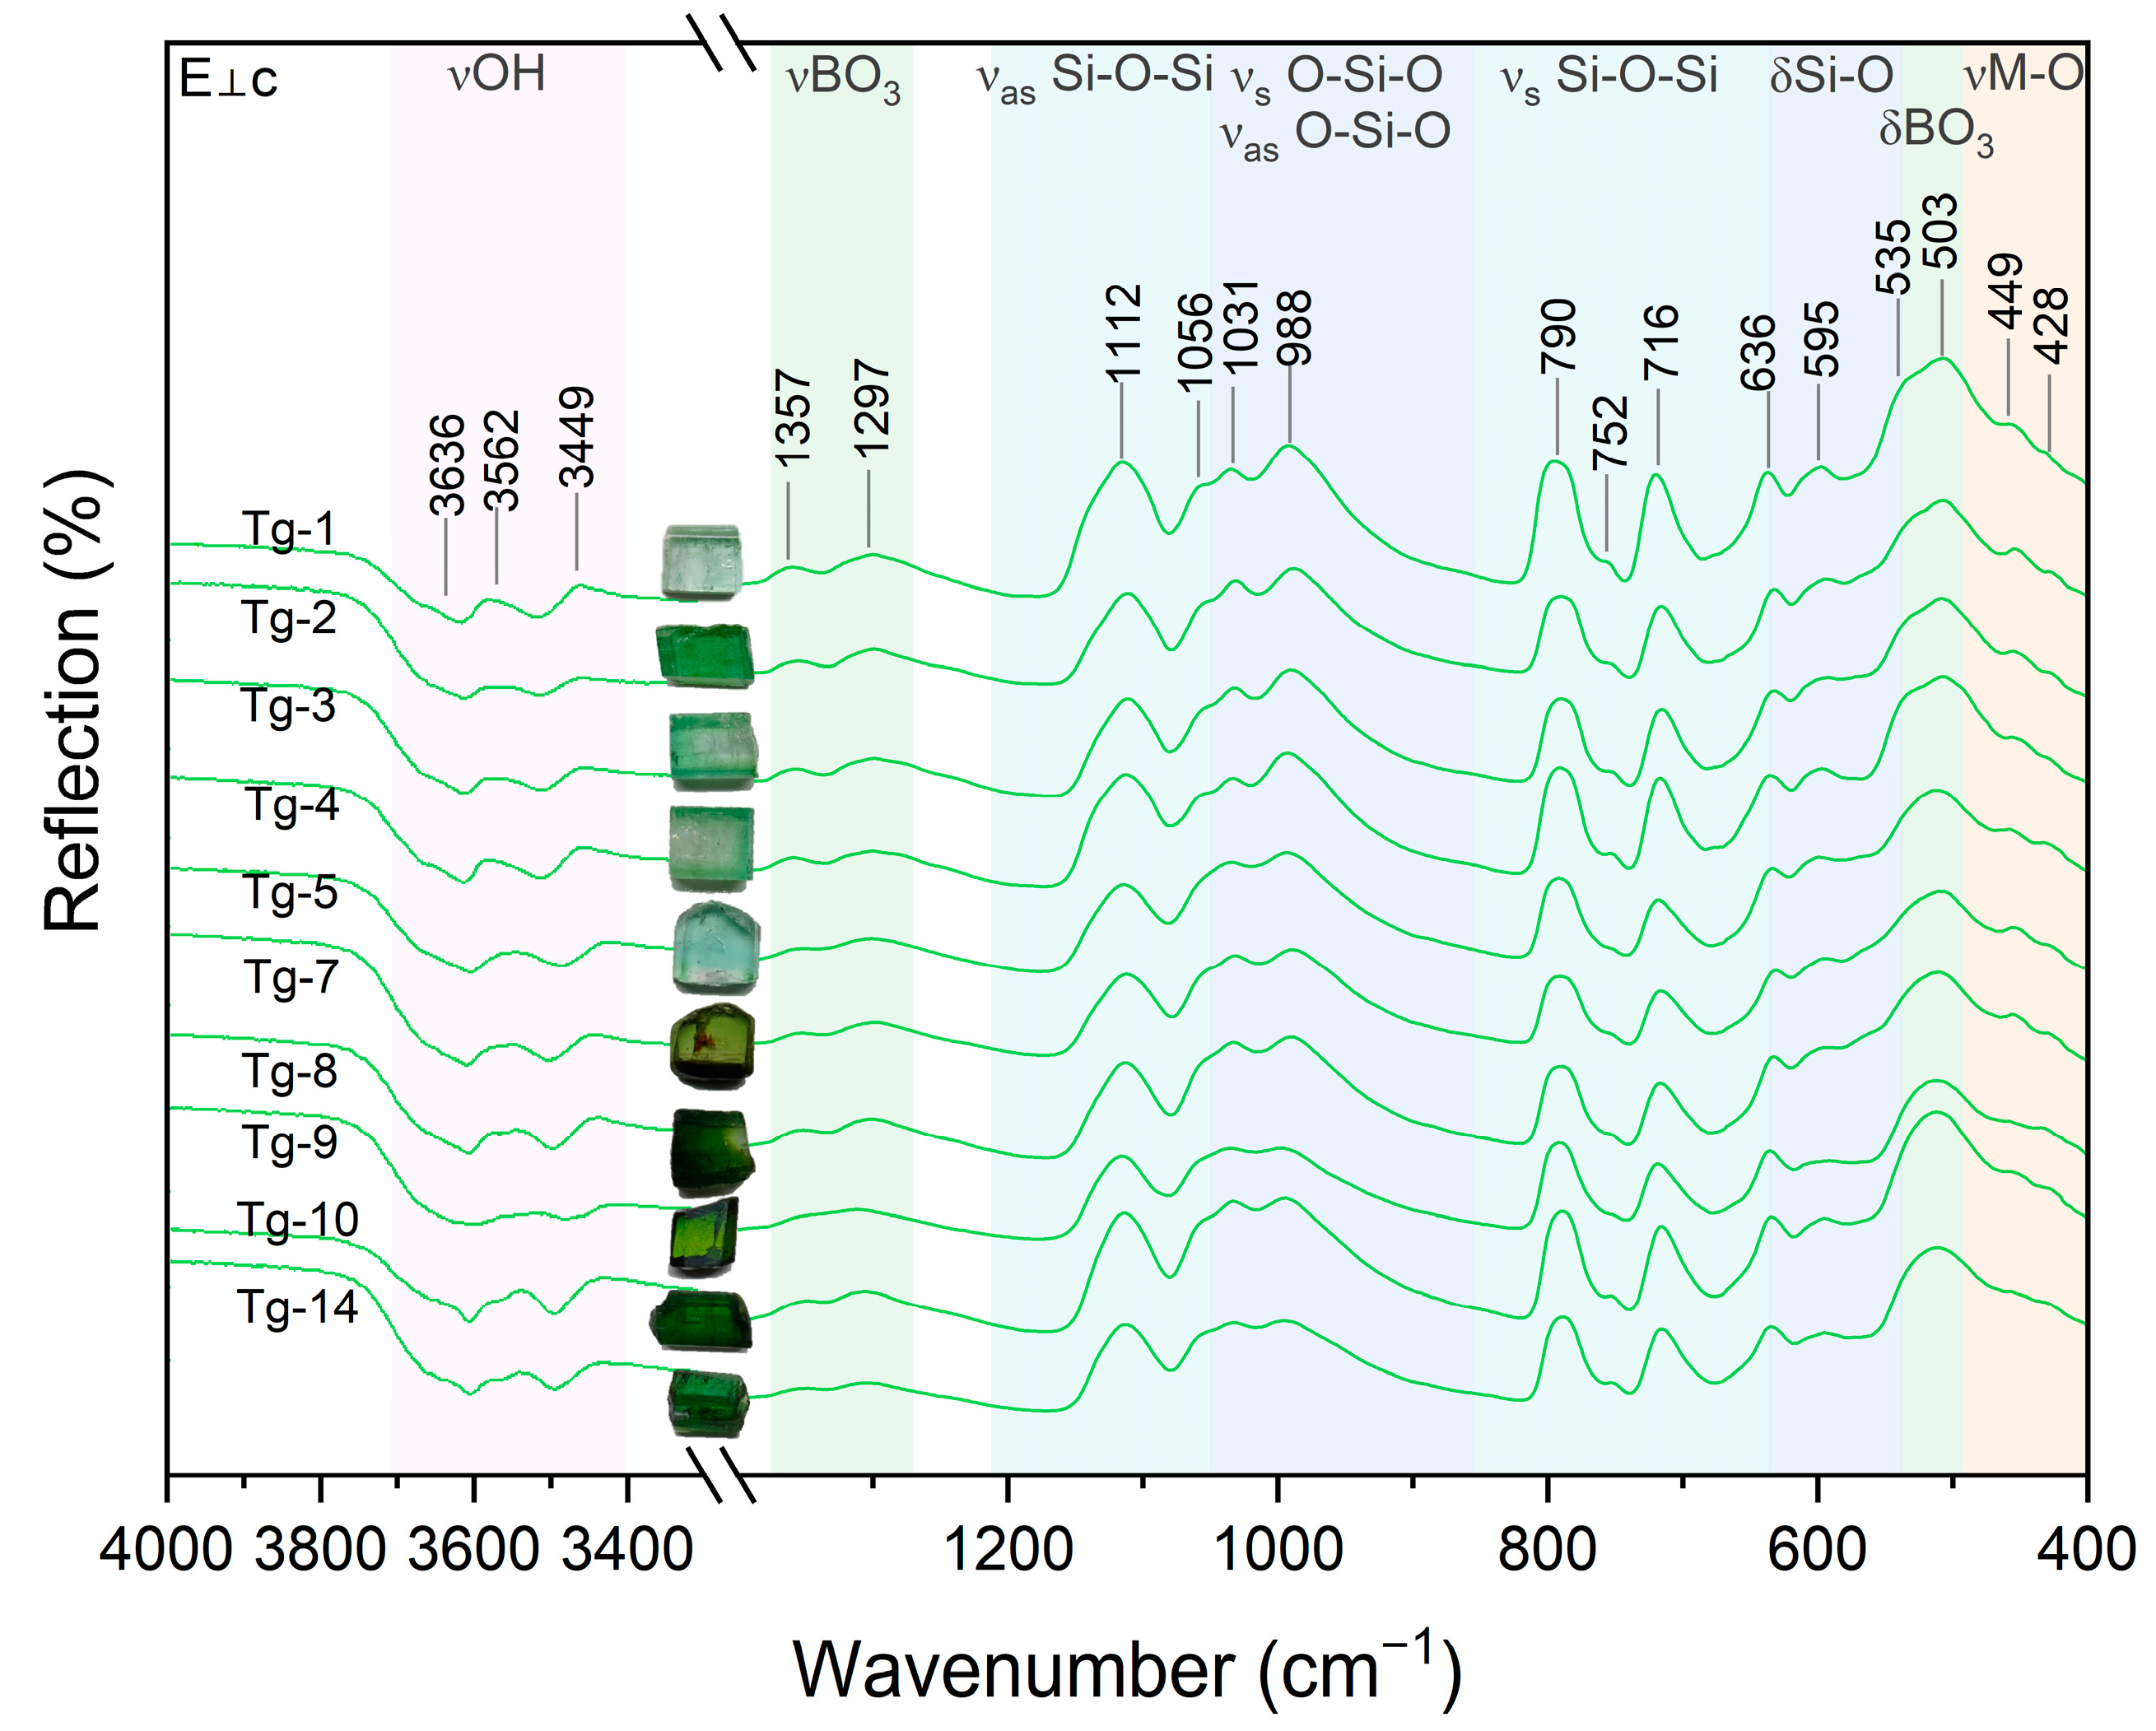
3.4. Infrared Spectral
4. Discussion
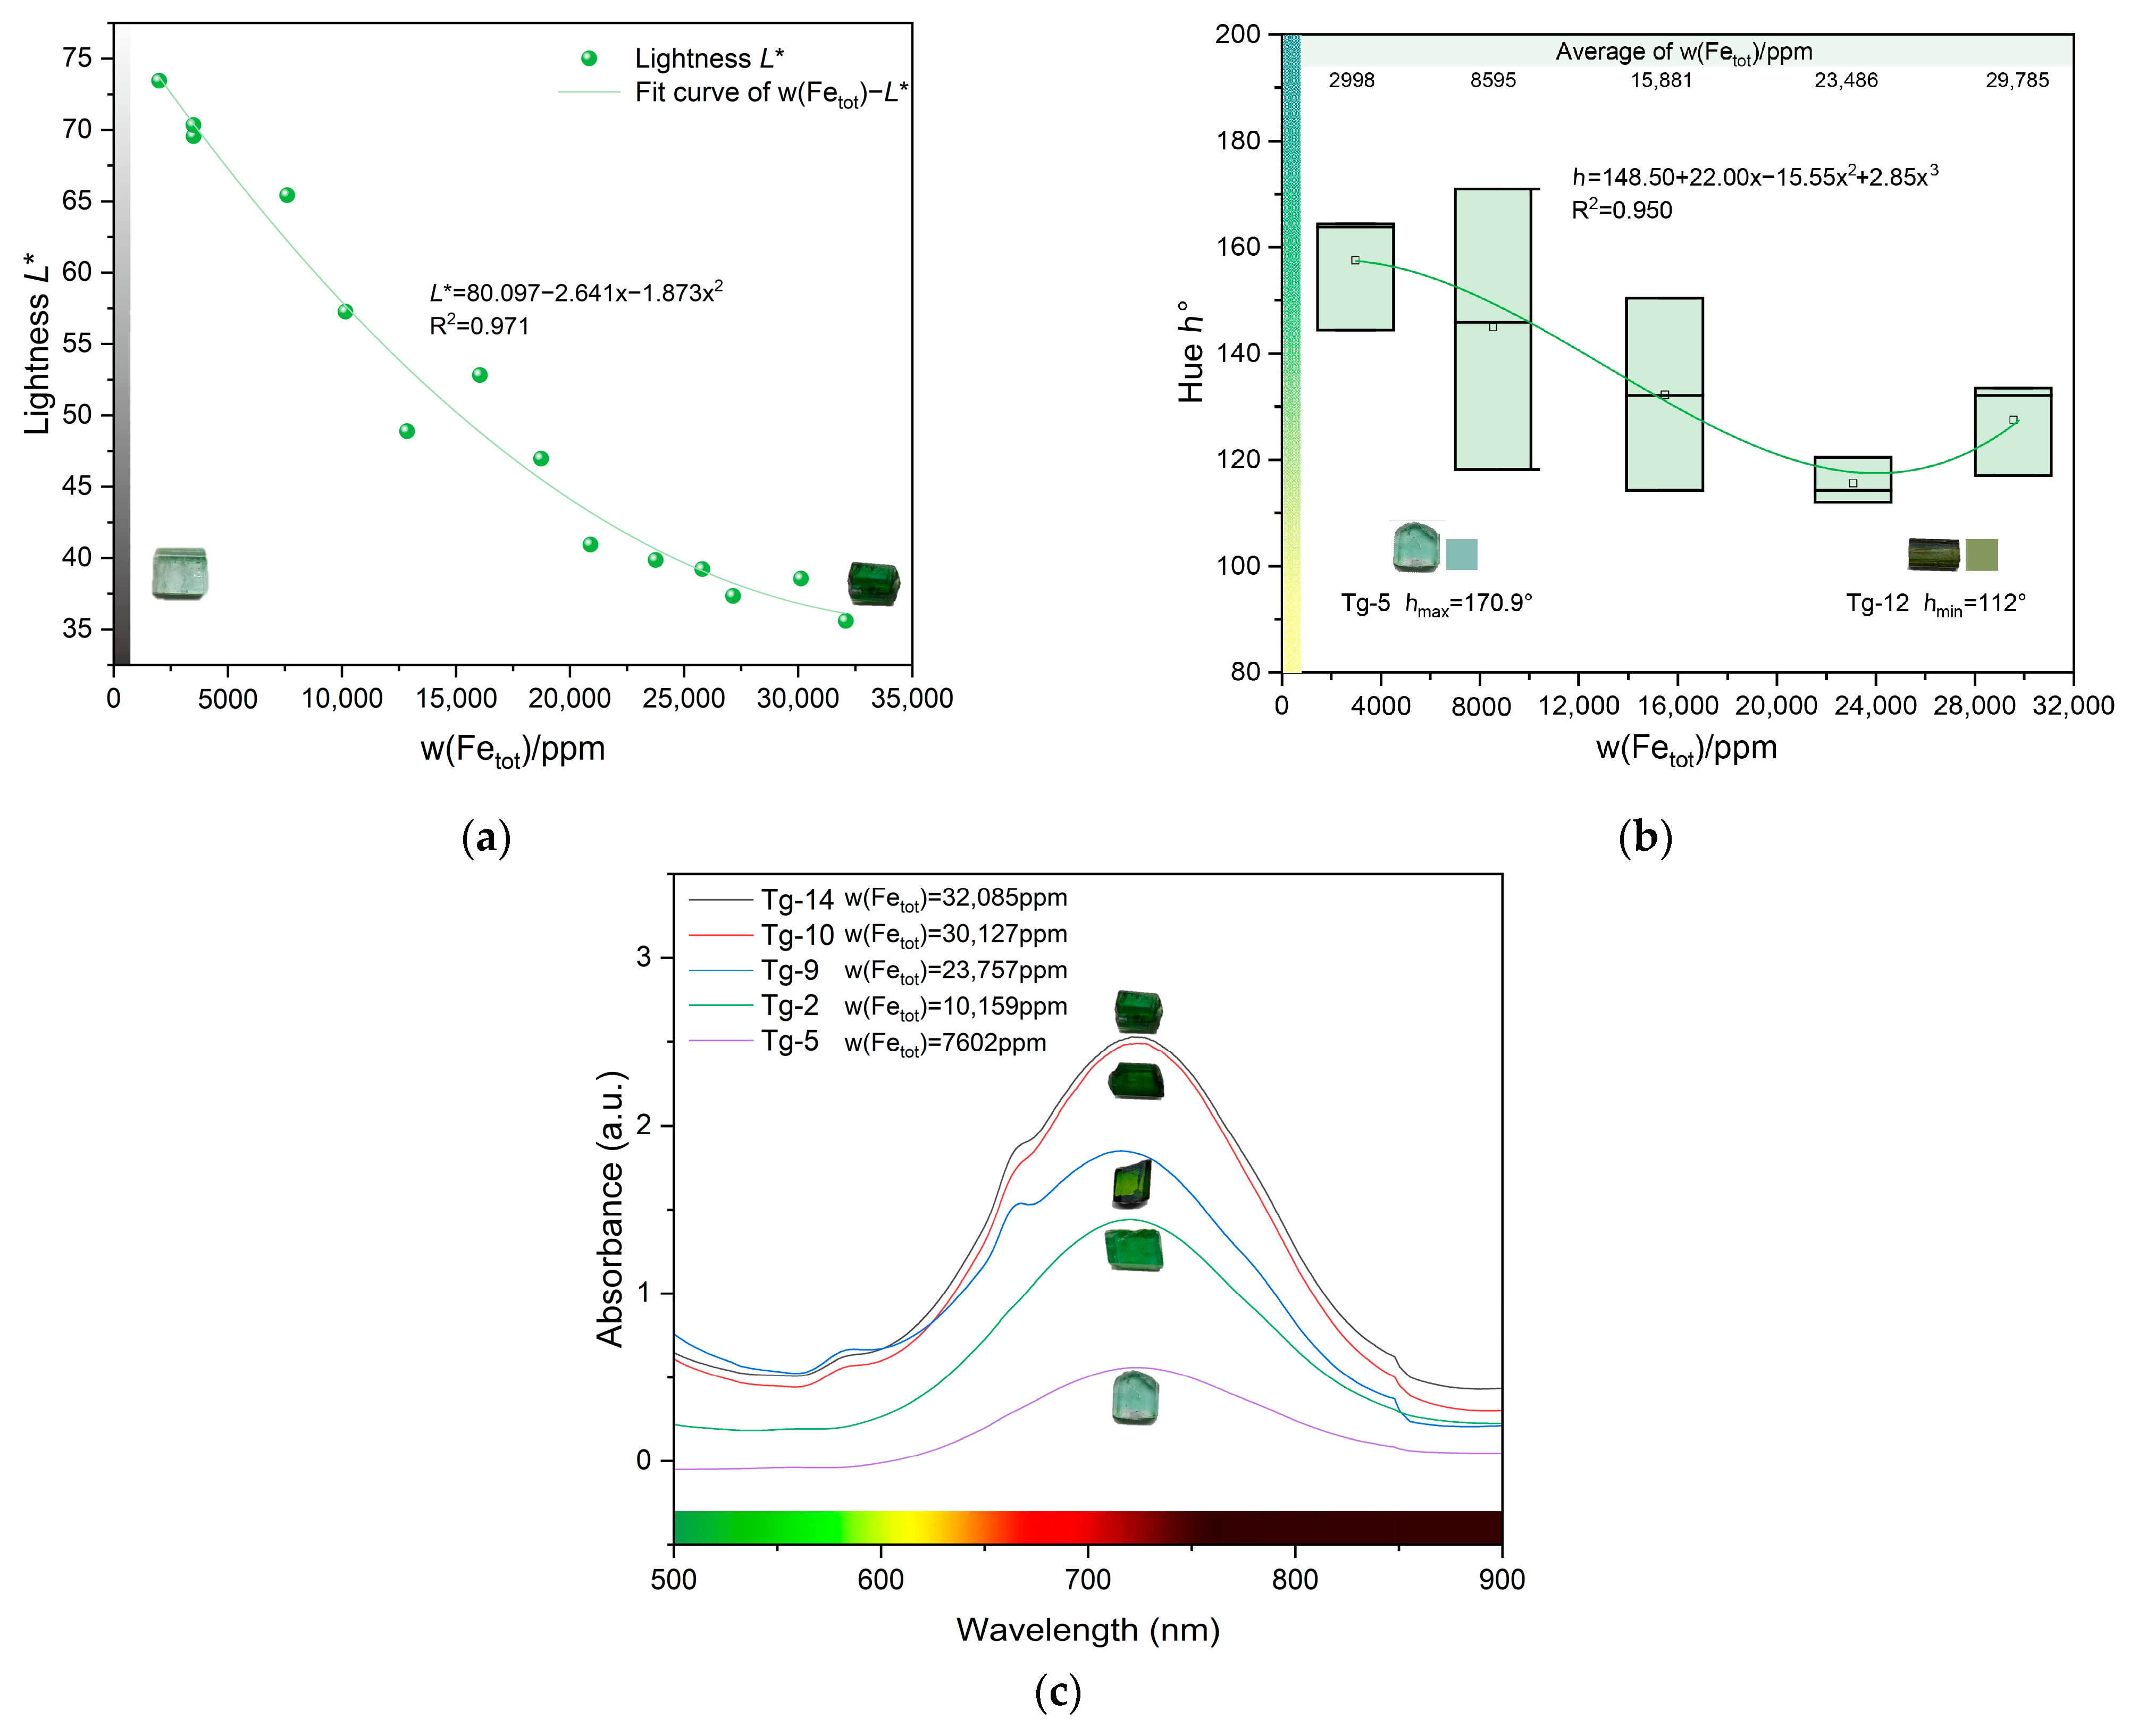
4.1. Influence of the Fe and Mn Content on Color
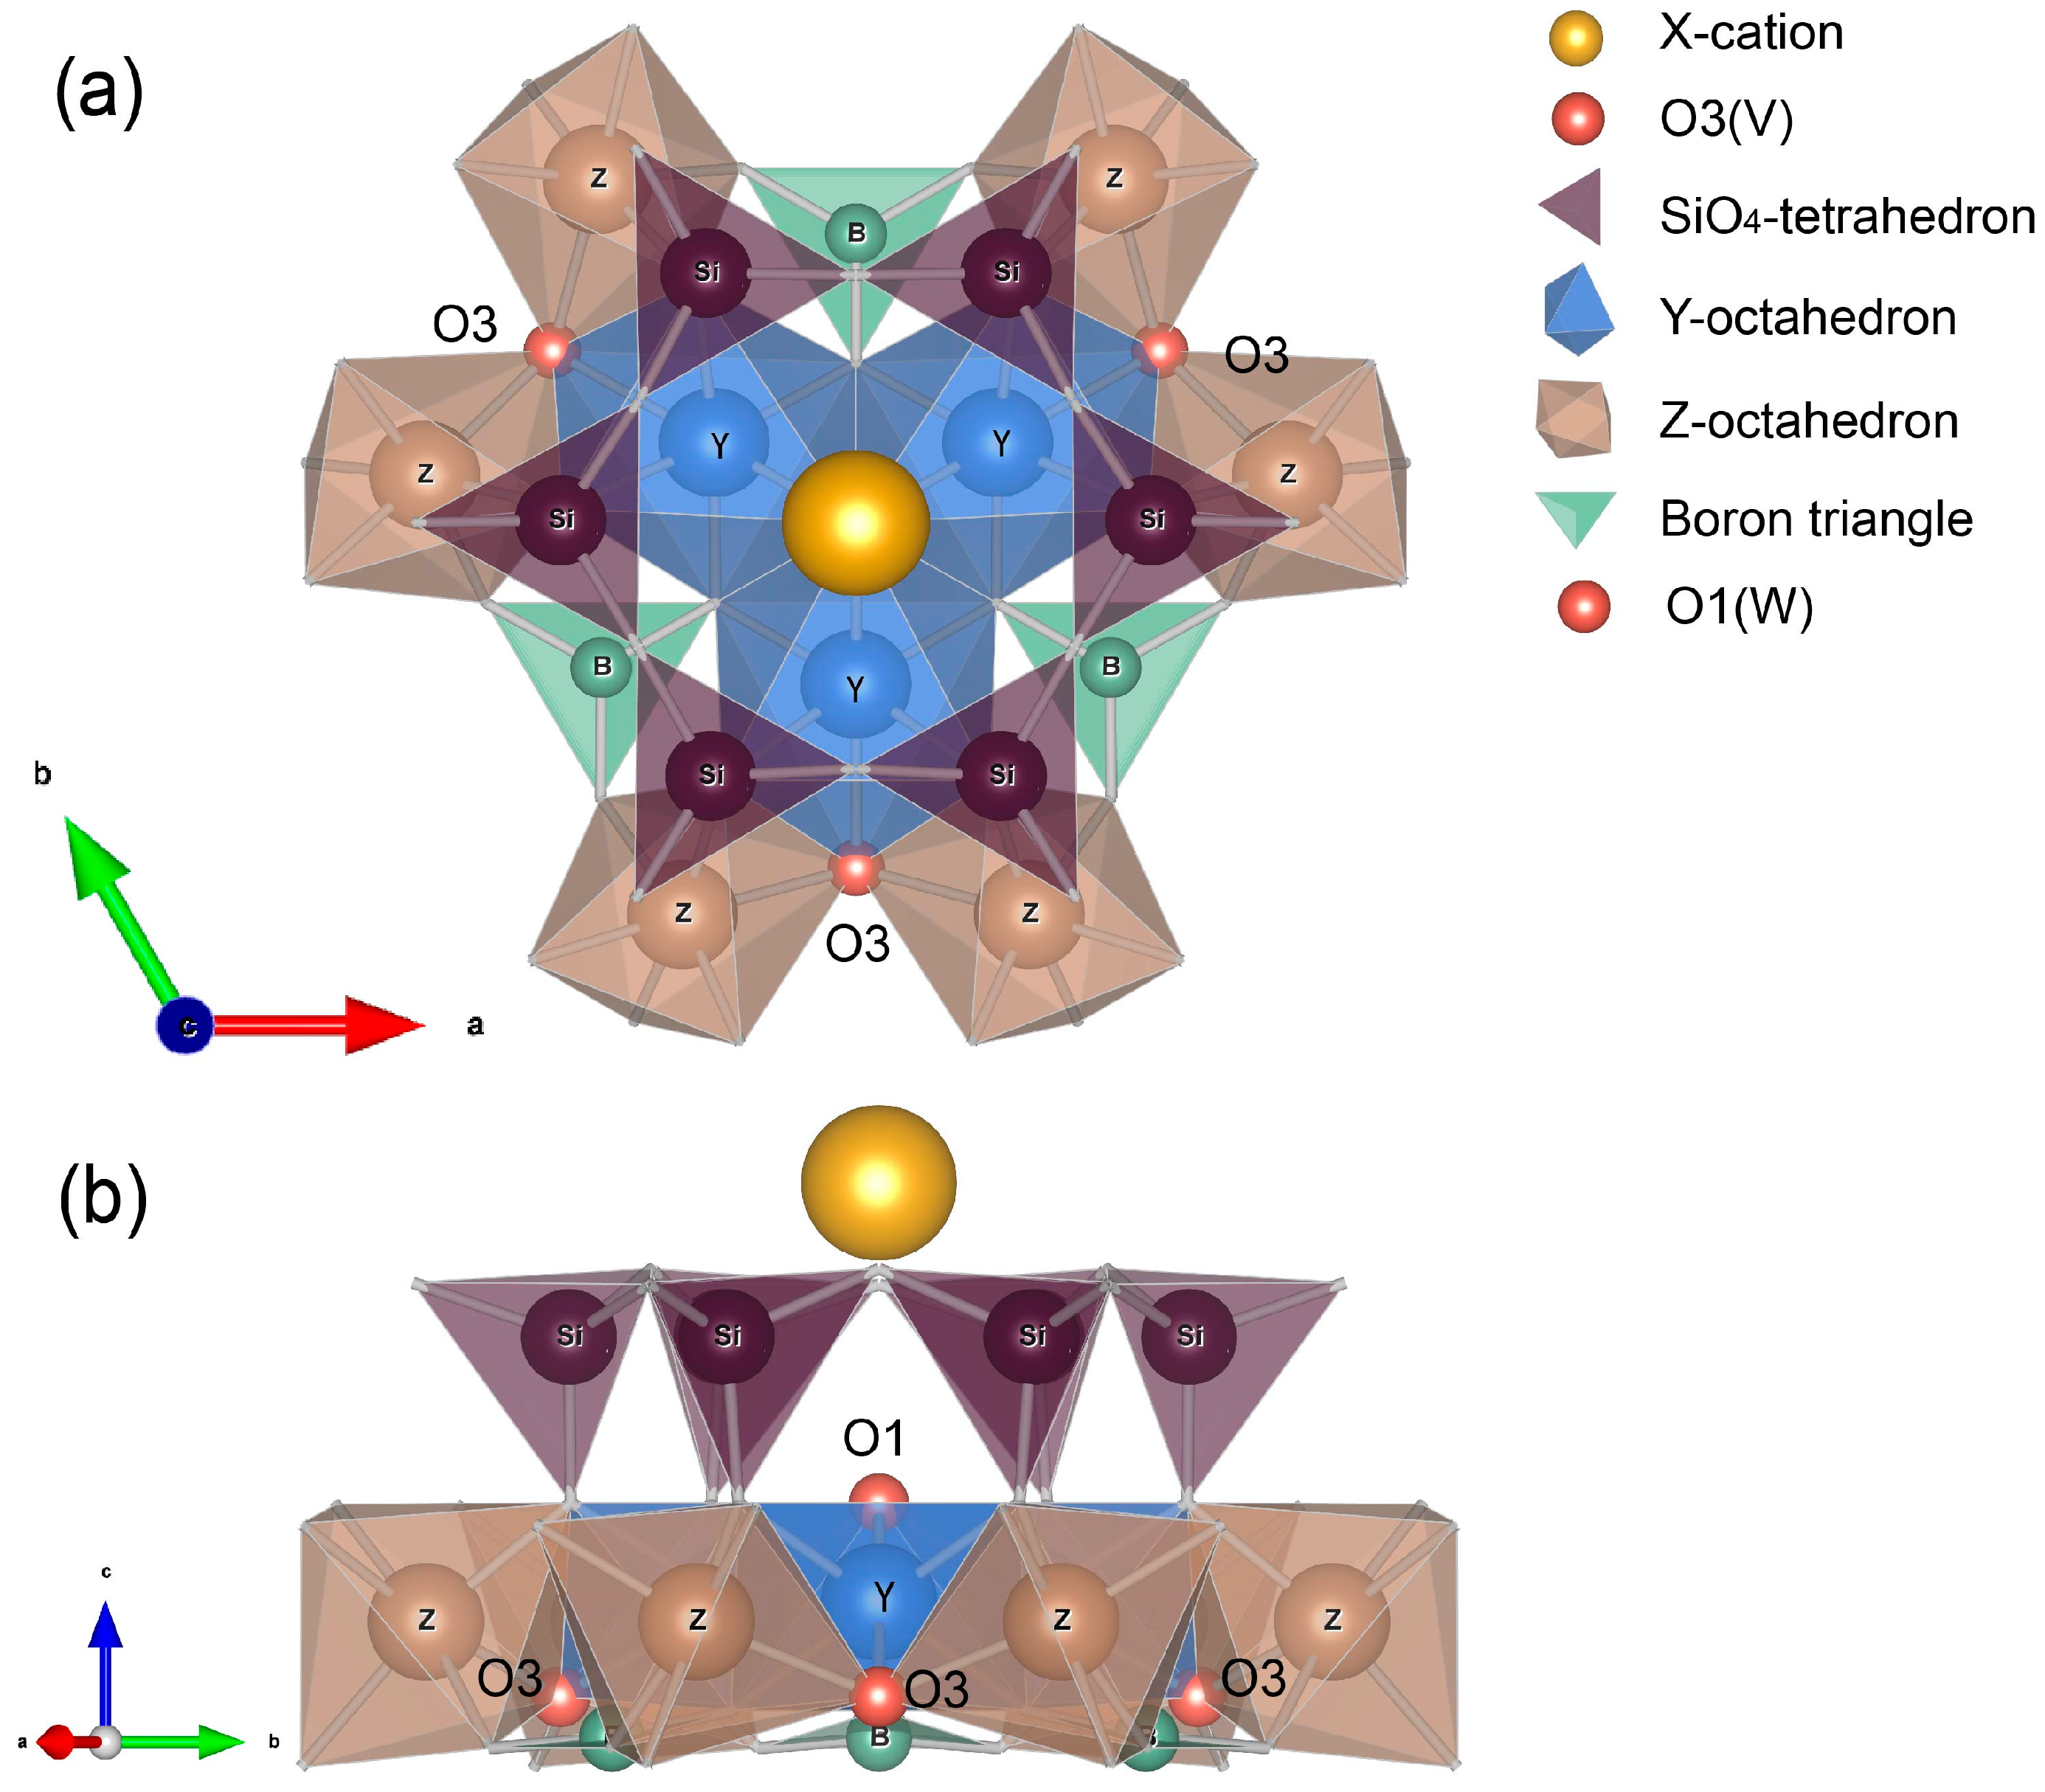
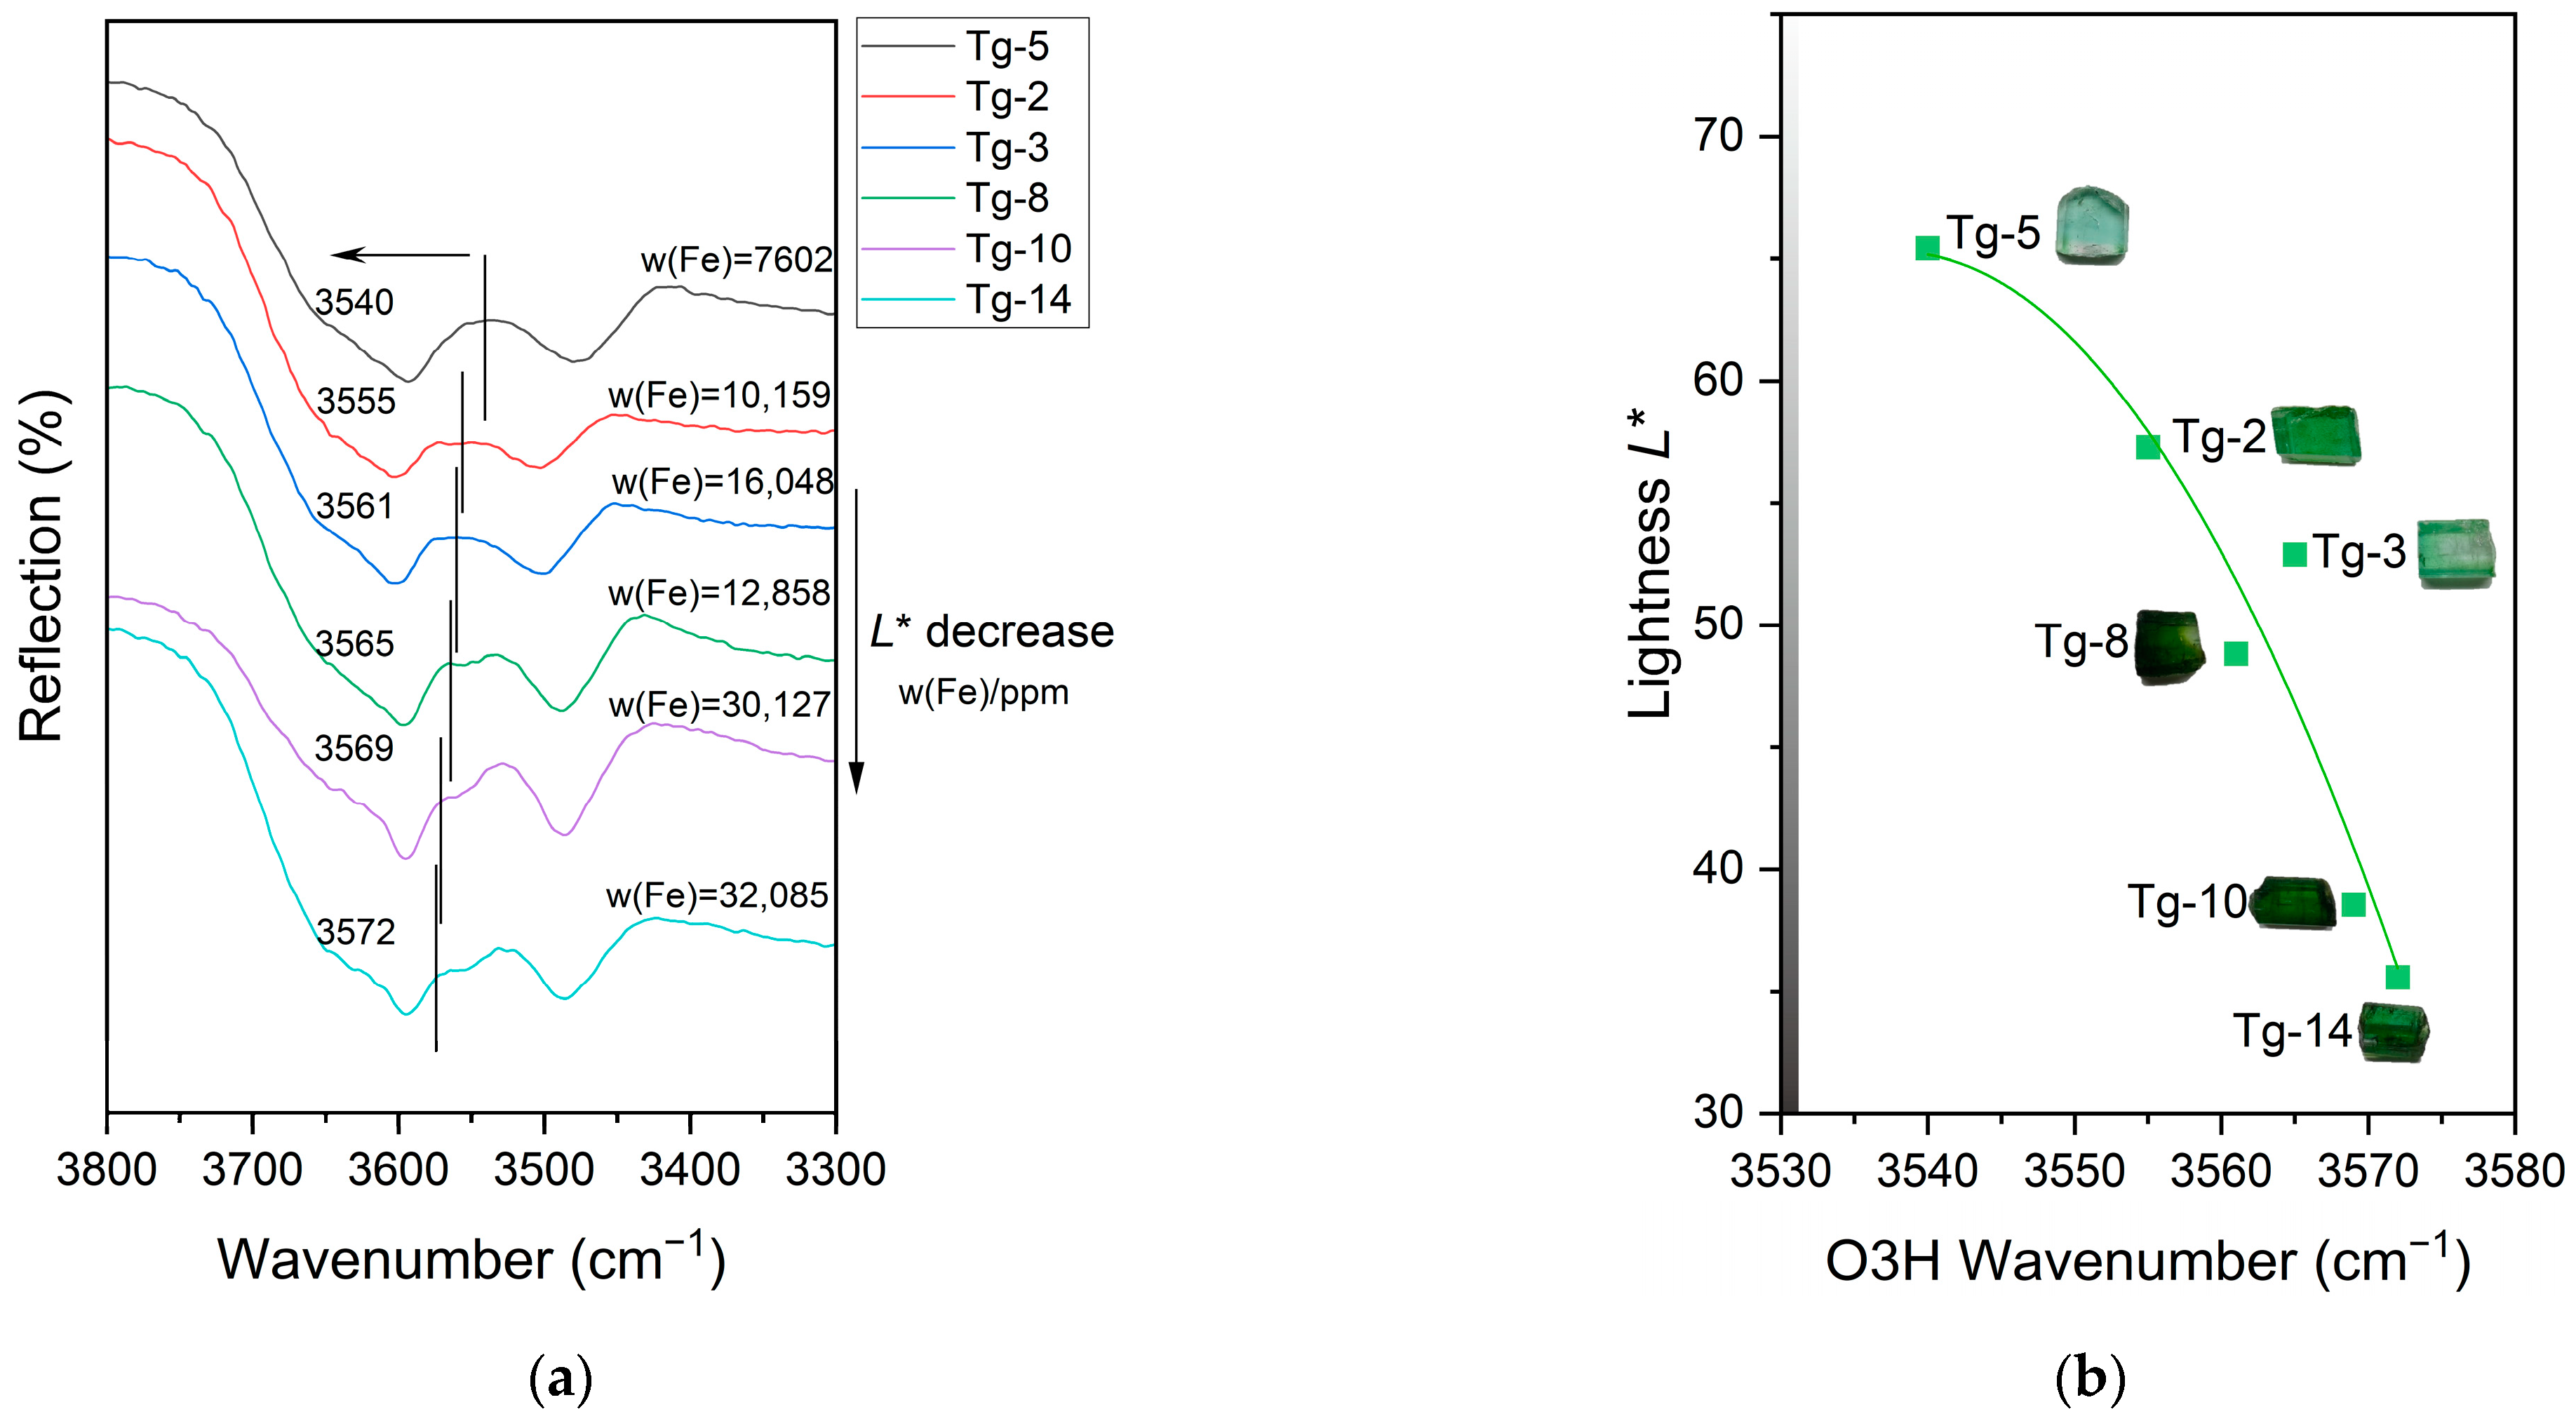
4.2. Influence of Crystal Structure on Tourmaline Color
5. Conclusions
Author Contributions
Funding
Data Availability Statement
Acknowledgments
Conflicts of Interest
References
- Larson, B. Minerals and Gemstones of East Africa. J. Gemmol. 2020, 37, 220–221. [Google Scholar] [CrossRef]
- Hawthorne, F.C.; Henry, D.J. Classification of the minerals of the tourmaline group. Eur. J. Mineral. 1999, 11, 201–215. [Google Scholar] [CrossRef]
- Henry, D.J.; Dutrow, B.L. Tourmaline crystallography, crystal chemistry and nomenclature: Current status. Natura 2021, 111, 47–48. [Google Scholar]
- Baksheev, I.A.; Prokof’ev, V.Y.; Zaraisky, G.P.; Chitalin, A.F.; Yapaskurt, V.O.; Nikolaev, Y.N.; Tikhomirov, P.L.; Nagornaya, E.V.; Rogacheva, L.I.; Gorelikova, N.V.; et al. Tourmaline as a prospecting guide for the porphyry-style deposits. Eur. J. Mineral. 2012, 24, 957–979. [Google Scholar] [CrossRef]
- Duan, Z.-P.; Jiang, S.-Y.; Su, H.-M.; Zhu, X. Tourmaline as a recorder of contrasting boron source and potential tin mineralization in the Mopanshan pluton from Inner Mongolia, northeastern China. Lithos 2020, 354–355, 105284. [Google Scholar] [CrossRef]
- Liang, Y.; Tang, X.; Zhu, Q.; Han, J.; Wang, C. A review: Application of tourmaline in environmental fields. Chemosphere 2021, 281, 130780. [Google Scholar] [CrossRef]
- He, H.; Wen, J.; Zhao, Q.; Ke, G.; Yang, H. The adsorption activity and mechanism of common tourmalines for typical anionic and cationic dyes. Chem. Phys. 2023, 571, 111938. [Google Scholar] [CrossRef]
- Bringhen, S.; Pour, L.; Benjamin, R.; Grosicki, S.; Min, C.-K.; de Farias, D.L.C.; Vorog, A.; Labotka, R.J.; Wang, B.; Cherepanov, D.; et al. Ixazomib Versus Placebo as Postinduction Maintenance Therapy in Newly Diagnosed Multiple Myeloma Patients: An Analysis by Age and Frailty Status of the TOURMALINE-MM4 Study. Clin. Lymphoma Myeloma Leuk. 2023, 23, 491–504. [Google Scholar] [CrossRef] [PubMed]
- Wang, C.; Chen, Q.; Guo, T.; Zhang, L. Preparation and adsorption properties of nano-graphene oxide/tourmaline composites. Nanotechnol. Rev. 2021, 10, 1812–1826. [Google Scholar] [CrossRef]
- Henry, D.J.; Novak, M.; Hawthorne, F.C.; Ertl, A.; Dutrow, B.L.; Uher, P.; Pezzotta, F. Nomenclature of the tourmaline-supergroup minerals. Am. Mineral. 2011, 96, 895–913. [Google Scholar] [CrossRef]
- Fritz, E.A.; Laurs, B.M.; Downs, R.T.; Costin, G. Yellowish green diopside and tremolite from Merelani, Tanzania. Gems Gemol. 2007, 43, 146–148. [Google Scholar] [CrossRef]
- Bosi, F.; Balic-Zunic, T.; Surour, A.A. Crystal structure analyses of four tourmaline specimens from the Cleopatra’s Mines (Egypt) and Jabal Zalm (Saudi Arabia), and the role of Al in the tourmaline group. Am. Mineral. 2010, 95, 510–518. [Google Scholar] [CrossRef]
- Jiang, S.Y.; Palmer, M.R. Boron isotope systematics of tourmaline from granites and pegmatites: A synthesis. Eur. J. Mineral. 1998, 10, 1253–1265. [Google Scholar] [CrossRef]
- Phichaikamjornwut, B.; Pongkrapan, S.; Intarasiri, S.; Bootkul, D. Conclusive comparison of gamma irradiation and heat treatment for color enhancement of Rubellite from Mozambique. Vib. Spectrosc. 2019, 103, 102926. [Google Scholar] [CrossRef]
- Li, M.; Sajan, D. Spectroscopic Characteristics and Color Origin of Red Tourmaline from Brazil. J. Spectrosc. 2022, 2022, 1769710. [Google Scholar] [CrossRef]
- Manning, P.G. An optical absorption study of the origin of colour and pleochroism in pink and brown tourmalines. Can. Mineral. 1969, 9, 678–690. [Google Scholar]
- Li, M.; Choudhary, R.N.P. Characterization of Blue Tourmaline from Madagascar for Exploring Its Color Origin. Adv. Condens. Matter Phys. 2022, 2022, 7167793. [Google Scholar] [CrossRef]
- Ertl, A.; Giester, G.; Schuessler, U.; Braetz, H.; Okrusch, M.; Tillmanns, E.; Bank, H. Cu- and Mn-bearing tourmalines from Brazil and Mozambique: Crystal structures, chemistry and correlations. Mineral. Petrol. 2013, 107, 265–279. [Google Scholar] [CrossRef]
- Okrusch, M.; Ertl, A.; Schüssler, U.; Tillmanns, E.; Brätz, H.; Bank, H. Major-and trace-element composition of Paraíba-type tourmaline from Brazil, Mozambique and Nigeria. J. Gemmol. 2016, 35, 120–139. [Google Scholar] [CrossRef]
- Qinjing, L.; Weizhi, H.; Qian, Z.; Jingcheng, P. Gemological and spectral characterization of brownish yellow tourmaline from Mozambique. Spectrosc. Spectr. Anal. 2019, 39, 3844–3848. [Google Scholar]
- Kaewtip, M.; Limtrakun, P. Gemological and Chemical Characteristics of Green Tourmaline from Madagascar, Mozambique, and Tanzania. Walailak J. Sci. Technol. 2016, 13, 985–992. [Google Scholar]
- Longfeng, T.; Cuiling, J.; Qianshen, Z.; Xiuli, H. Mineralogy Characteristics and Coloration Mechanism of Green Tourmaline in Tanzania. Rock Miner. Anal. 2022, 41, 324–331. [Google Scholar]
- Peipei, Z.; Xitian, S. Colour Origin of Dark Green Tourmaline from Zambia. J. Gems Gemmol. 2017, 19, 7–14. [Google Scholar]
- Kirillova, N.P.; Vodyanitskii, Y.N.; Sileva, T.M. Conversion of soil color parameters from the Munsell system to the CIE-L*a*b* system. Eurasian Soil Sci. 2015, 48, 468–475. [Google Scholar] [CrossRef]
- Jiang, Y.; Guo, Y. Genesis and influencing factors of the colour of chrysoprase. Sci. Rep. 2021, 11, 9939. [Google Scholar] [CrossRef]
- Zhao, Z.; Guo, Y. Colour Quality Evaluation of Bluish-Green Serpentinite Based on the CIECAM16 Model. Minerals 2022, 12, 38. [Google Scholar] [CrossRef]
- Tang, J.; Guo, Y.; Xu, C. Color effect of light sources on peridot based on CIE1976 L*a*b* color system and round RGB diagram system. Color Res. Appl. 2019, 44, 932–940. [Google Scholar] [CrossRef]
- Yuan, B.; Guo, Y.; Li, Y.; Jia, H. Quality Evaluation of Tourmaline Green Appearance Based on CIECAM16 Color Appearance Model. IOP Conf. Ser. Mater. Sci. Eng. 2020, 746, 012005. [Google Scholar] [CrossRef]
- Ly, A.; Marsman, M.; Wagenmakers, E.-J. Analytic posteriors for Pearson’s correlation coefficient. Stat. Neerl. 2018, 72, 4–13. [Google Scholar] [CrossRef]
- Bosi, F. Tourmaline crystal chemistry. Am. Mineral. 2018, 103, 298–306. [Google Scholar] [CrossRef]
- Sun, Z.; Palke, A.C.; Breeding, C.M.; Dutrow, B. A New Method for Determining Gem Tourmaline Species by LA-ICP-MS. Gems Gemol. 2019, 55, 2–17. [Google Scholar] [CrossRef]
- Agostinho, L.; Lima, R.; Nascimento, L.; Wegner, R.; Suassuna, J. Identification of Color Centers in Mineral Systems by Photoacustic Spectroscopy. In Proceedings of the Congresso Brasileiro de Engenharia e Ciência dos Materiais, Natal, Brazil, 9–13 November 2002. [Google Scholar]
- Fonsecazang, W.A.; Zang, J.W.; Hofmeister, W. The Ti-influence on the tourmaline color. J. Braz. Chem. Soc. 2008, 19, 1186–1192. [Google Scholar] [CrossRef]
- Wang, J.; Tao, X.; Wang, W. Color Characteristics of green tourmaline from Xinjiang. Acta Petrol. Mineral. 2005, 24, 319–323. [Google Scholar]
- Farmer, V.C. Significance of the Presence of Allophane and Imogolite in Podzol Bs Horizons for Podzolization Mechanisms—A Review. Soil Sci. Plant Nutr. 1982, 28, 571–578. [Google Scholar] [CrossRef]
- Surour, A.A.; Omar, S.M.A. Chemical and spectroscopic characterization of tourmaline from the ancient Roman mines in the Eastern Desert of Egypt. Environ. Earth Sci. 2022, 81, 78. [Google Scholar] [CrossRef]
- Makreski, P.; Jovanovski, G. Minerals from Macedonia: XXIII. Spectroscopic and structural characterization of schorl and beryl cyclosilicates. Spectrochim. Acta Part A Mol. Biomol. Spectrosc. 2009, 73, 460–467. [Google Scholar] [CrossRef]
- Gatta, G.D.; Bosi, F.; McIntyre, G.J.; Skogby, H. First accurate location of two proton sites in tourmaline: A single-crystal neutron diffraction study of oxy-dravite. Mineral. Mag. 2014, 78, 681–692. [Google Scholar] [CrossRef]
- Fantini, C.; Tavares, M.C.; Krambrock, K.; Moreira, R.L.; Righi, A. Raman and infrared study of hydroxyl sites in natural uvite, fluor-uvite, magnesio-foitite, dravite and elbaite tourmalines. Phys. Chem. Miner. 2013, 41, 247–254. [Google Scholar] [CrossRef]


| Properties | Results |
|---|---|
| Color | Light bluish green-green-yellowish green |
| Weight | 0.799~6.828 ct |
| Specific gravity | 2.99~3.19 g/cm3 |
| Refractive index | 1.618~1.663 |
| Birefringence | 0.018~0.037 |
| Transparency | Sub-transparent to transparent |
| Inclusions | Tear-shaped gas-liquid inclusions |
| Tg-1 | Tg-2 | Tg-3 | Tg-4 | Tg-5 | Tg-6 | Tg-7 | Tg-8 | Tg-9 | Tg-10 | Tg-12 | Tg-14 | Tg-18 | |
|---|---|---|---|---|---|---|---|---|---|---|---|---|---|
| Obtained and normalized from LA-ICP-MS * (ppm) | |||||||||||||
| Li | 10,705 | 10,525 | 11,140 | 10,815 | 10,720 | 8849 | 10,309 | 11,354 | 11,072 | 10,234 | 11,597 | 9823 | 9685 |
| Na | 17,895 | 18,795 | 20,469 | 17,596 | 179,44 | 17,043 | 18,245 | 19,503 | 20,249 | 21,796 | 21,158 | 21,778 | 19,539 |
| Mg | 0.6 | 14.6 | 33.6 | 0.0 | 18.7 | 1.1 | 91.5 | 220 | 1214 | 972 | 775 | 1199 | 1399 |
| Al | 228,663 | 230,511 | 228,571 | 238,938 | 215,007 | 234,878 | 215,074 | 228,060 | 219,771 | 232,427 | 233,992 | 224,552 | 215,408 |
| K | 157 | 164 | 201 | 136 | 134 | 110 | 127 | 130 | 173 | 181 | 139 | 177 | 164 |
| Ca | 3811 | 2892 | 6280 | 3884 | 6129 | 974 | 5961 | 2799 | 12,105 | 3326 | 8069 | 3025 | 9064 |
| Ti | 6.2 | 59.7 | 57.0 | 5.6 | 26.0 | 13.7 | 131 | 328 | 813 | 489 | 1318 | 521 | 912 |
| V | 0.2 | 0.1 | 0.3 | 0.2 | 0.2 | 0.2 | 0.3 | 2.7 | 5.4 | 4.5 | 16.9 | 5.0 | 5.0 |
| Cr | 9.0 | 5.0 | 6.5 | 5.5 | 3.7 | 2.8 | 3.1 | 3.4 | 6.9 | 3.5 | 4.5 | 3.8 | 1.9 |
| Mn | 10,485 | 9877 | 11,689 | 9658 | 14,064 | 4290 | 18,160 | 3639 | 8956 | 3063 | 8609 | 3085 | 8826 |
| Fe | 3504 | 10,159 | 16,048 | 1996 | 7602 | 3494 | 8024 | 12,858 | 23,757 | 30,127 | 20,899 | 32,085 | 25,801 |
| Cu | 0.3 | 4.0 | 1.5 | 1.2 | 0.1 | 4.9 | 0.4 | 9.5 | 6.6 | 4.4 | 2.5 | 3.3 | 2.7 |
| Atoms per formula unit | |||||||||||||
| Na | 0.692 | 0.726 | 0.791 | 0.680 | 0.693 | 0.659 | 0.705 | 0.754 | 0.783 | 0.842 | 0.818 | 0.842 | 0.755 |
| K | 0.004 | 0.004 | 0.005 | 0.003 | 0.003 | 0.003 | 0.003 | 0.003 | 0.004 | 0.004 | 0.003 | 0.004 | 0.004 |
| Ca | 0.085 | 0.064 | 0.140 | 0.086 | 0.136 | 0.022 | 0.132 | 0.062 | 0.269 | 0.074 | 0.179 | 0.067 | 0.201 |
| Li | 1.359 | 1.336 | 1.415 | 1.373 | 1.361 | 1.124 | 1.309 | 1.442 | 1.406 | 1.300 | 1.473 | 1.247 | 1.230 |
| Mg | 0.000 | 0.000 | 0.001 | 0.000 | 0.001 | 0.000 | 0.003 | 0.008 | 0.045 | 0.036 | 0.029 | 0.044 | 0.052 |
| Ti | 0.000 | 0.001 | 0.001 | 0.000 | 0.000 | 0.000 | 0.002 | 0.006 | 0.015 | 0.009 | 0.024 | 0.010 | 0.017 |
| Mn | 0.169 | 0.160 | 0.189 | 0.156 | 0.227 | 0.069 | 0.293 | 0.059 | 0.145 | 0.050 | 0.139 | 0.050 | 0.143 |
| Fe | 0.056 | 0.161 | 0.255 | 0.032 | 0.121 | 0.055 | 0.127 | 0.204 | 0.377 | 0.478 | 0.332 | 0.509 | 0.410 |
| Cu | 0.000 | 0.000 | 0.000 | 0.000 | 0.000 | 0.000 | 0.000 | 0.000 | 0.000 | 0.000 | 0.000 | 0.000 | 0.000 |
| Al | 7.528 | 7.589 | 7.525 | 7.866 | 7.078 | 7.733 | 7.081 | 7.508 | 7.235 | 7.652 | 7.703 | 7.393 | 7.092 |
| V | 0.000 | 0.000 | 0.000 | 0.000 | 0.000 | 0.000 | 0.000 | 0.000 | 0.000 | 0.000 | 0.000 | 0.000 | 0.000 |
| Cr | 0.000 | 0.000 | 0.000 | 0.000 | 0.000 | 0.000 | 0.000 | 0.000 | 0.000 | 0.000 | 0.000 | 0.000 | 0.000 |
| Transitional Elements | L* | C* | h° | |
|---|---|---|---|---|
| Fe | Pearson’s r | −0.882 ** | 0.229 | −0.639 ** |
| Sig. | 0.000 | 0.525 | 0.010 | |
| Mn | Pearson’s r | 0.204 | 0.312 | 0.126 |
| Sig. | 0.465 | 0.658 | 0.655 |
Disclaimer/Publisher’s Note: The statements, opinions and data contained in all publications are solely those of the individual author(s) and contributor(s) and not of MDPI and/or the editor(s). MDPI and/or the editor(s) disclaim responsibility for any injury to people or property resulting from any ideas, methods, instructions or products referred to in the content. |
© 2023 by the authors. Licensee MDPI, Basel, Switzerland. This article is an open access article distributed under the terms and conditions of the Creative Commons Attribution (CC BY) license (https://creativecommons.org/licenses/by/4.0/).
Share and Cite
Cui, L.; Guo, Y.; Tang, J.; Yang, Y. Spectroscopy Characteristics and Color-Influencing Factors of Green Iron-Bearing Elbaite. Crystals 2023, 13, 1461. https://doi.org/10.3390/cryst13101461
Cui L, Guo Y, Tang J, Yang Y. Spectroscopy Characteristics and Color-Influencing Factors of Green Iron-Bearing Elbaite. Crystals. 2023; 13(10):1461. https://doi.org/10.3390/cryst13101461
Chicago/Turabian StyleCui, Lianyi, Ying Guo, Jun Tang, and Yushu Yang. 2023. "Spectroscopy Characteristics and Color-Influencing Factors of Green Iron-Bearing Elbaite" Crystals 13, no. 10: 1461. https://doi.org/10.3390/cryst13101461
APA StyleCui, L., Guo, Y., Tang, J., & Yang, Y. (2023). Spectroscopy Characteristics and Color-Influencing Factors of Green Iron-Bearing Elbaite. Crystals, 13(10), 1461. https://doi.org/10.3390/cryst13101461