Abstract
Mixed-ligand complexes featuring a carboxylato ligand and bidentate chelate N,N′-donor ligands along with a single halogenido ligand are rarely subjected to studies despite their interesting physical, chemical and biological properties. A direct synthesis involving non-steroidal anti-inflammatory drugs flufenamic acid and niflumic acid and sterically hindering N,N′-donor ligands (neocuproine and 2,2′-biquinoline) has been used to prepare mononuclear mixed-ligand zinc complexes with a composition of [ZnCl(flu)(neo)] (1A and 1B) and [ZnCl(nif)(biq)] (2). Single-crystal X-ray diffraction data have shown that the carboxylate binding mode differs in the two polymorphs 1A and 1B, which form molecules of same composition, and the deviations in molecular geometry are further reflected in their supramolecular structures. The inter- and intramolecular interactions and their contributions to the stability of the crystal structures has been investigated by Hirshfeld surface analysis. The spectral properties of the prepared complexes in solid-state and solution have been analyzed. Additionally, the interaction with the biomacromolecules (fish sperm DNA, human and bovine serum albumins), studied by fluorescence assays, showed a stronger binding of 1A and 1B in comparison with 2.
1. Introduction
The zinc(II) complexes belong to the most studied coordination compounds for their stability and structural versatility. Since the redox-inert Zn(II) ions play an important role in living organisms as an integral part of metalloenzymes and a variety of zinc-based DNA-binding domains of proteins involved in gene regulation, known as zinc fingers [1], they are often used for preparation of biologically active complexes with organic ligands. In recent years, zinc complexes with NSAIDs have attracted much attention mostly for their anti-inflammatory, antimicrobial, antioxidant and anticancer activity [2,3,4,5,6,7,8,9,10].
Fenamates-derivatives of fenamic acid (2-Anilinobenzoic acid) are members of non-steroidal anti-inflammatory drugs (NSAIDs), widely administered for treatment of inflammation, pain, and fever [11], and due to the presence of carboxylic group in their structure, they are also suitable for the synthesis of metal complexes. Their anti-inflammatory activity is mainly based on the inhibition of cyclooxygenase enzyme (COX), which initiates the production of prostaglandins, prostacyclines and tromboxanes responsible for mediation of inflammation and pain. Inhibiting COX may have an anticancer potential because some of the products of COX activity (e.g., prostaglandin E2) are involved in tumorigenesis [12]. However, anticancer activity of NSAIDs may be induced by various molecular mechanisms involving the interaction with DNA such as apoptosis via caspase activation [13].
Therefore, the study of interaction of metal complexes with biomolecules, such as nucleic acids and proteins, is of great importance in the development of new agents for biotechnology and medicine. The introduction of additional planar aromatic ligands into the structure of complexes often enhances non-covalent binding to DNA mostly via intercalation or minor-groove binding [7,14] which may lead to lower toxicity or less pronounced adverse effects in comparison with covalent binding agents such as cisplatin. Moreover, chelating aromatic ligands can stabilize the structure of the complex due to the steric hindrance, which prevents other larger ligands from coordinating to the metal ions. On the other hand, the presence of labile halogenido ligands, which can participate in ligand exchange reactions, can also significantly improve the biological activity of the complexes [15,16].
Mononuclear mixed-ligand transition metal complexes containing one N,N′-donor ligand, one carboxylato ligand and one halogenido ligand are relatively rare, as illustrated by only 28 structurally characterized complexes listed in the CSD database (November 2022; bi-, tri-, tetra- and polynuclear complexes are not included) [17]. Zinc complexes account for nine of these structures.
In an attempt to contribute to the study of mixed-ligand complexes, we report the synthesis of zinc(II) complexes with flufenamic (Hflu) and niflumic (Hnif) acid (Scheme 1) as a carboxylate bioactive ligand and neocuproine (neo) or 2,2’-biquinoline (biq) as an auxiliary N,N′-donor co-ligands and a chlorido ligand. The compounds were characterized by elemental analysis, spectroscopic techniques (FTIR, UV-Vis, and fluorescence) and single-crystal X-ray crystallography. Furthermore, since the coordination modes of carboxylate-containing multifunctional ligands can also affect biological properties, the interaction of the complexes with fish sperm DNA (FS DNA), as well as human and bovine serum albumins (HSA and BSA), has been investigated.
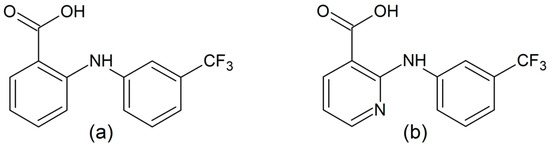
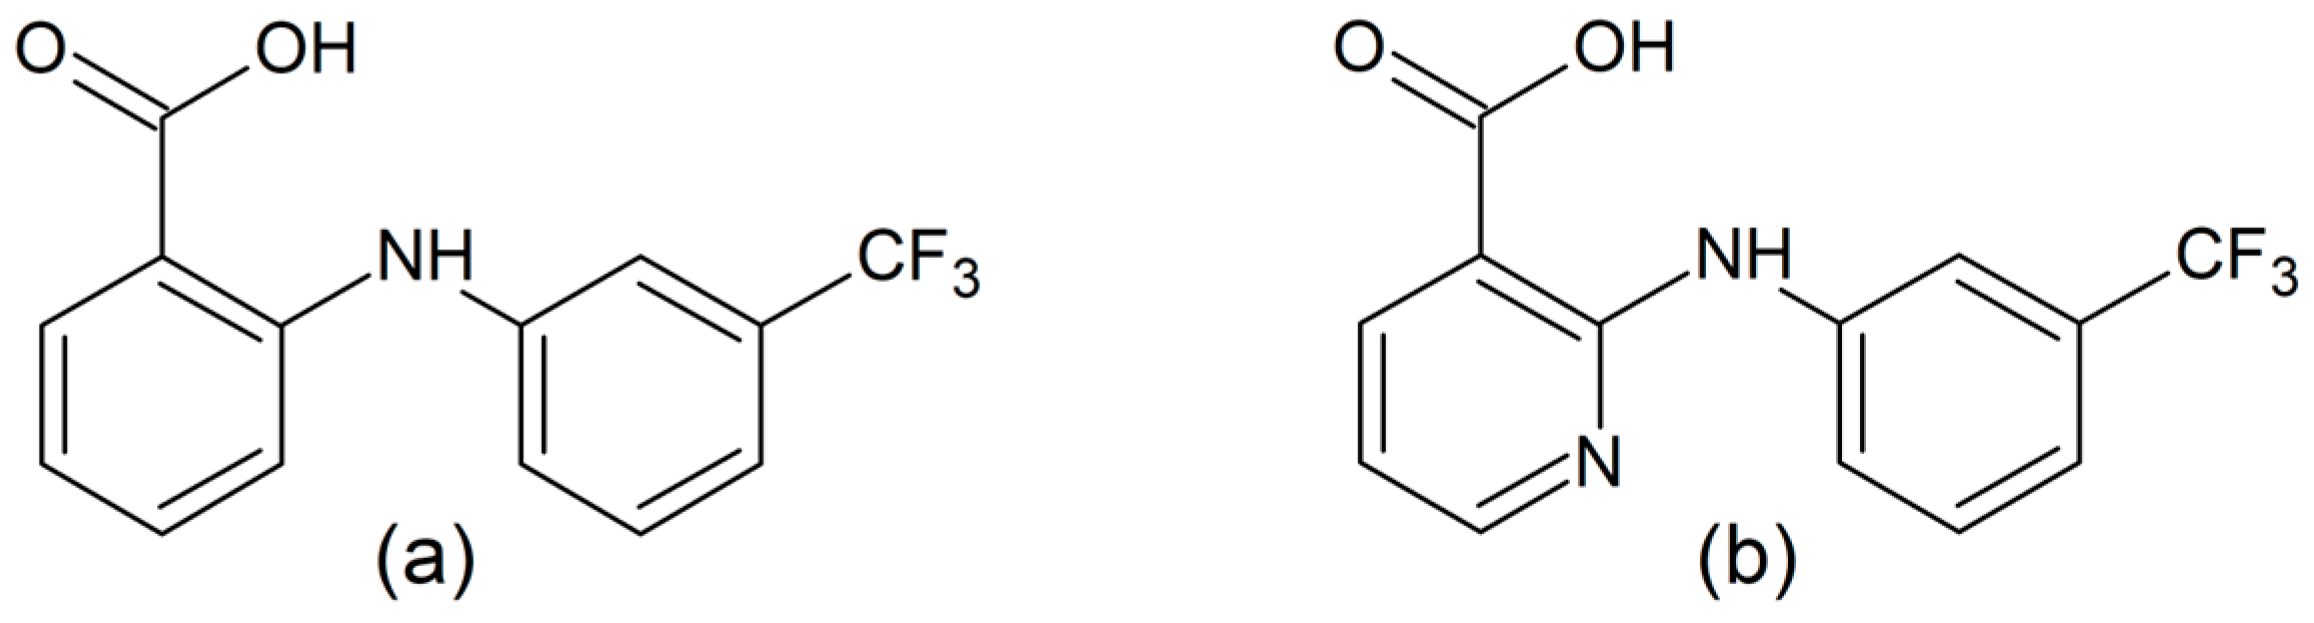
Scheme 1.
Structural formula of flufenamic (Hflu) (a) and niflumic acid (Hnif) (b).
2. Materials and Methods
2.1. Chemicals and Physical Measurements
All chemicals were acquired from commercial suppliers and used for the synthesis and spectral analyses without further purification. Elemental analysis was evaluated on the Elementar vario MICRO cube CHNS Elemental Analyzer with the use of silver boats. Infrared spectra in range of 4000–250 cm−1 were recorded on a Shimadzu IR Tracer-100 FTIR spectrophotometer equipped with a single-reflection ATR accessory (diamond crystal). Absorption spectra and full excitation-emission matrices of complex solutions in dimethyl sulfoxide (DMSO,c = 10 μM) were measured simultaneously in Hellma fluorescence cuvettes on a Horiba Dual-FL spectrofluorometer at room temperature.
2.2. Synthesis of the [ZnCl(flu)(neo)] (1A and 1B), and [ZnCl(nif)(biq)] (2)
The complexes were prepared by a similar procedure, which involved the dissolution of the respective acid (Hflu or Hnif, 0.4 mmol) in a methanolic solution of KOH (0.4 mmol), followed by the addition of a methanolic solution of ZnCl2 (0.4 mmol) at ambient room temperature. Subsequently, the reaction mixture was heated up to 60 °C and the N,N′-donor ligand, previously dissolved in methanol, was added (neo or biq, 0.4 mmol). The respective clear solutions were left to slowly evaporate at ambient laboratory conditions. Respective crystalline products were obtained from solutions after several days.
Elemental Anal. Calc. for [ZnCl(flu)(neo)] (C28H21ClF3N3O2Zn; MW = 589.32): C, 57.07%; H, 3.59%; N, 7.13%. Found for 1A: C, 56.70%; H, 3.40%; N, 7.37%; Found for 1B: C, 56.83%; H, 3.54%; N, 7.06%.
Elemental Anal. Calc. for [ZnCl(nif)(biq)] (C31H20ClF3N4O2Zn; MW = 638.35): C, 58.33%; H, 3.16%; N, 8.78%. Found for 2: C, 58.04%; H, 3.26%; N, 8.59%.
FTIR (cm−1) for 1A: 3273(w), 1584(m), 1503(s), 1462(m), 1380(m), 1337(s), 1287(s), 1236(w), 1153(s), 1111(s), 1069(m), 1040(w), 995(w), 930(m), 858(s), 812(w), 779(m), 754(s), 730(m), 694(s), 669(m), 628(m), 590(w), 550(m), 518(m), 450(m), 415(m), 360(w), 318(s), 273(m); for 1B: 3237(w), 1581(m), 1504(s), 1462(w), 1400(m), 1329(s), 1284(s), 1227(m), 1069(m), 1040(m), 999(w), 924(w), 858(s), 806(w), 781(m), 731(s), 694(s), 658(m), 551(m), 517(m), 458(s), 415(m), 310(s), 272(w), 255(w); for 2: 3271(w), 1583(s), 1508(m), 1450(w), 1400(m), 1327(s), 1254(m), 1163(m), 1117(s), 1069(s), 997(w), 943(m), 872(m), 824(s), 779(s), 746(s), 694(s), 658(m), 623(w), 592(w), 536(m), 501(w), 484(m), 457(m), 430(w), 401(m), 276(s), 255(m).
UV-VIS (c = 10 μM, DMSO) for 1A: λmax = 272 nm (ε = 71,621 dm3·mol−1·cm−1); for 1B: λmax = 272 nm (67,463 dm3·mol−1·cm−1); for 2: λmax = 300 nm (72,084 dm3·mol−1·cm−1).
2.3. Single-Crystal X-ray Crystallography
Single-crystal X-ray diffraction data for complexes 1A, 1B and 2 were collected on a SuperNova diffractometer (Rigaku-Oxford Diffraction) equipped with an Atlas S2 CCD detector using Cu Kα radiation (λ = 1.54 Å) at 95 K, and processed by CrysAlis PRO (v42) using the multi-scan absorption correction method [18]. The structural models were acquired by using the SHELXT program [19] and refined against F2 by full-matrix least-squares with the JANA2020 program [20]. Crystallographic information files (.cif) for 1A (CCDC 2290944), 1B (CCDC 2290945) and 2 (CCDC 2290946) were deposited with the Cambridge Crystallographic Data Centre, and can be obtained free of charge. We note that the cif file for 1A at 173 K (CSD refcode: YEGDIA) has been already deposited in the CCDC upon its earlier publication in 2017, but the structure has been redetermined for the purpose of this study. Molecular geometry was evaluated by SHAPE 2.1 software [21]. The PLATON program was used for the basic analysis of intermolecular interactions and crystal packing [22]. Molecular graphics were created by the Diamond 3 program (Crystal Impact) [23].
2.4. Hirshfeld Surface Analysis
Hirshfeld surface calculation for 1A, 1B and 2 was performed by CrystalExplorer program (version 17.5) [24] in standard settings (high resolution) by using crystallographic information files of complexes obtained by single-crystal X-ray diffraction analysis.
2.5. FS DNA Binding Experiments
Interaction of prepared complexes with FS DNA was performed in solution by the fluorescence competitive binding experiments with ethidium bromide (EB) dye, used as a conventional intercalation agent [25]. The aqueous solution of DNA (120 μM) was treated with EB (50 μM) to prepare the FS DNA-EB complex. The complexes were dissolved in dmso and diluted in water (<2% DMSO). The emission spectra of FS DNA-EB in the absence and presence of 1A, 1B and 2 (0–50 μM) were recorded in the range of 560–700 nm upon excitation at 520 nm. A linear Stern–Volmer equation (Equation (1)) was applied to calculate binding constants (KSV) [26].
2.6. Albumin Binding Experiments
Interaction of the complexes 1A, 1B and 2 with serum albumins (HSA and BSA) was performed by a standard tryptophan quenching assay [27]. Emission spectra of aqueous solutions of respective albumin (0.4 μM) were recorded in the range 310–500 nm upon excitation at 295 nm by the gradual addition of the corresponding solution of complexes (0–0.2 μM). Standard (Equation (1)) and modified Stern–Volmer (Equation (2)) equations were used to estimate the binding constants and the number of binding sites
where F0 represents emission maximum of FS DNA-EB complex or albumin, respectively, F represents emission maxima in the presence of quencher of respective concentrations, [Q] represents concentration of the complexes, KSV and Kb represent Stern–Volmer and association binding constants, respectively, and n represents the number of binding sites.
F0/F = 1 + KSV [Q]
log(F0 − F)/F = log[Kb] + n log[Q]
3. Results and Discussion
3.1. Preparation and Characterization of the Complexes
Zinc(II) complexes were prepared by a simple one-pot synthesis in consecutive steps: flufenamic acid (niflumic acid for 2) was dissolved in methanolic solution of potassium hydroxide followed by the metal replacement with zinc(II) chloride solution; finally, the N,N′-donor ligand (neo for 1A and 1B, biq for 2) was added (Equations (3) and (4)).
Hflu + KOH + ZnCl2 + neo → [ZnCl(flu)(neo)] + KCl + H2O
Hnif + KOH + ZnCl2 + biq → [ZnCl(nif)(biq)] + KCl + H2O
The first reaction mixture yielded two crystalline products that differed in color (yellow 1A and colorless 1B) and crystal habitus (plate 1A and prism 1B). The yellow crystals of complex 1A were the first to form in the solution and were separated from the solution by filtration after 3 days. Subsequently, the crystals of 1B crystallized from the filtrate solution after 7 days. All prepared complexes were stable in air and readily soluble in dmso. The composition of prepared compounds was verified by elemental analysis with good agreement of experimental and calculated values.
3.2. Crystal Structures
The molecular and crystal structure of 1A, 1B and 2 has been determined by single-crystal X-ray diffraction structural analysis (Table 1). The crystal structures of all three prepared complexes are composed of discrete neutral [ZnCl(L1)(L2)] complex molecules with the Zn(II) central atom pentacoordinated by two oxygen atoms of carboxylate ligand (L1 = flu in 1A and 1B; nif in 2), two nitrogen atoms of N,N′-donor ligand (L2 = neo in 1A and 1B; biq in 2), and a single chlorido ligand in a spherical square pyramidal arrangement.

Table 1.
Crystal and structure refinement data for 1A, 1B and 2.
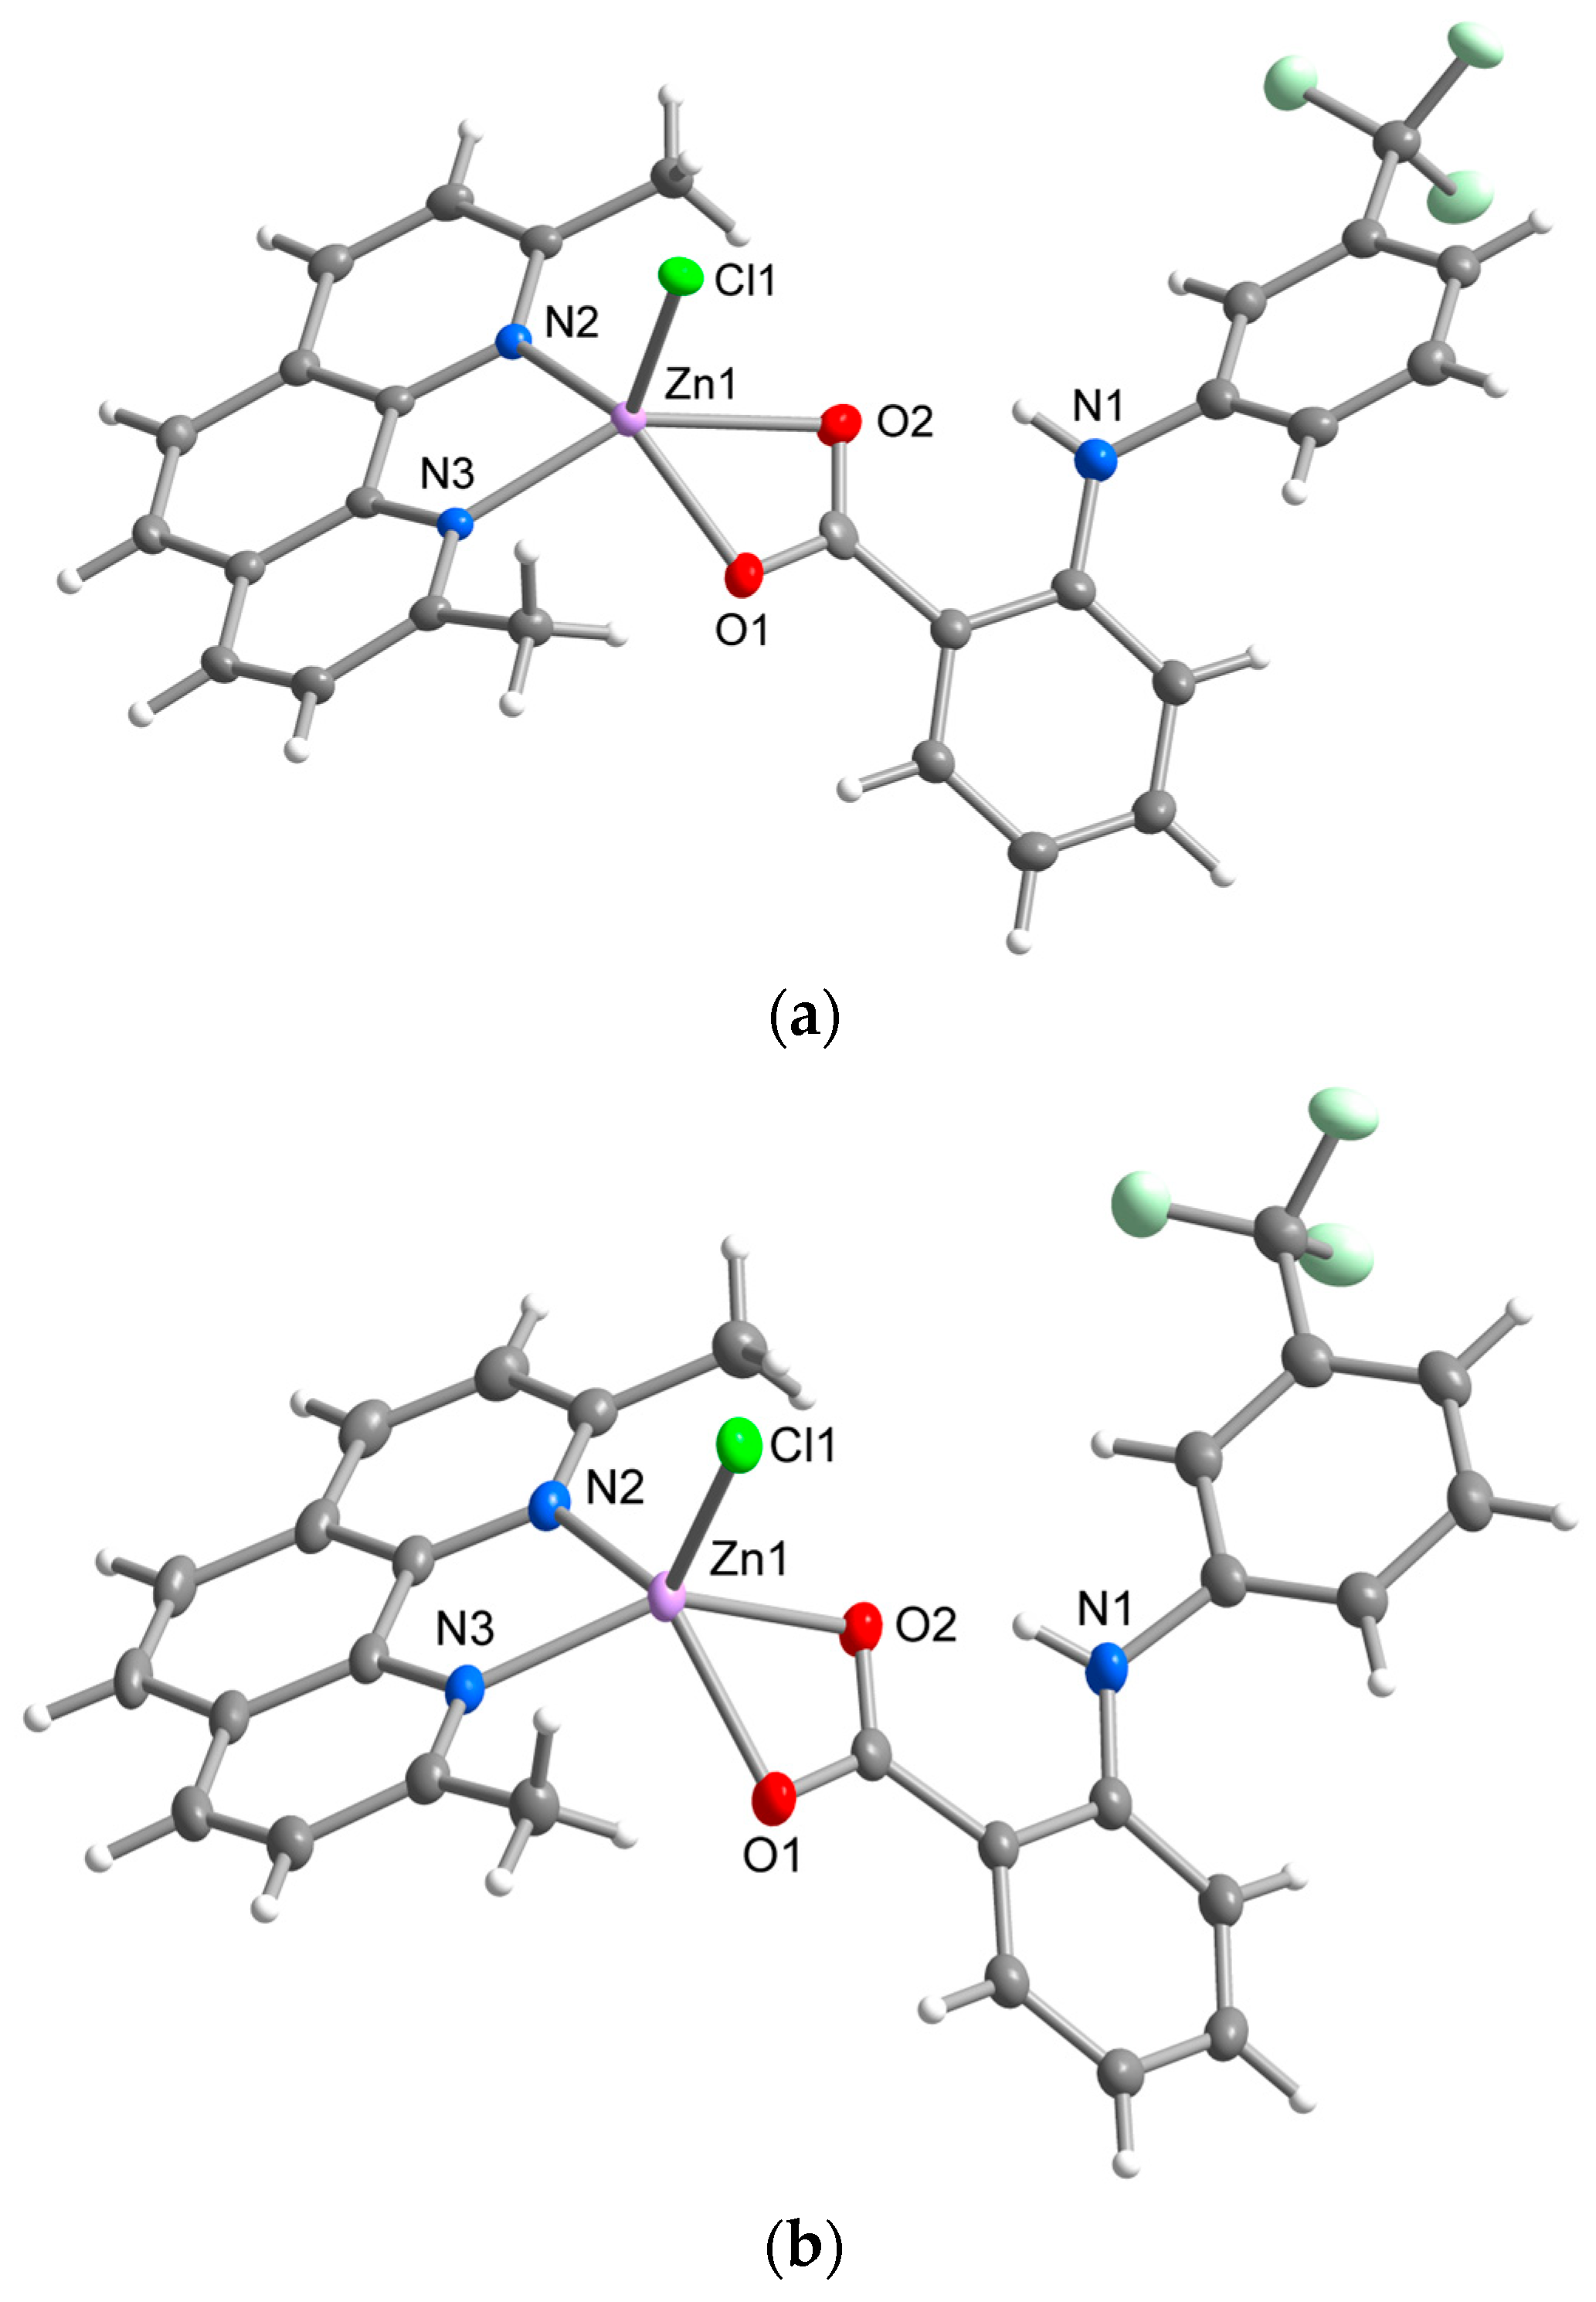
Complexes 1A and 1B represent structural polymorphs with the 1A complex already reported by our group [7]. However, for a better comparison with 1B, the structure of 1A has been redetermined under the same experimental conditions. The main structural difference between the polymorphs lies in the different length of Zn-O bonds, which is reflected in their supramolecular structures, as well as their physical properties in the solid-state. While the flufenamato ligand binds in an asymmetrical mode with a significant difference between Zn-O1 (1.987(2) Å) and Zn-O2 (2.510(2) Å) distances in the molecular structure of 1A, an almost ideally symmetrical binding of flu is observed in 1B (Zn-O1 = 2.133(1) Å, Zn-O2 = 2.179(1) Å) (Table 2, Figure 1). Neocuproine is bound through nitrogen donor atoms in an almost symmetrical bidentate chelating mode typical for neocuproine-containing complexes. Zn-N and Zn-Cl bond lengths are similar to those found in [ZnCl2(neo)] [28]. The different binding mode of carboxylate is also reflected in the dihedral angles between aromatic rings of the flu ligand 53.81(7)° in 1A; 46.92(5)° in 1B. Furthermore, a significant difference was observed in the dihedral angles between the central ring of neo and the rings of flu; the dihedral angles were 52.82(7)° and 1.79(7)°, respectively, in 1A and 57.05(7)° and 22.23(5)°, respectively, in 1B. An intramolecular N-H⋯O hydrogen bond between the secondary amino group and carboxylic group of flu ligands, typical for fenamic acid derivatives, is present within the complex molecules of both polymorphs.
Table 2.
Selected bond lengths and angles (A, °) for 1A, 1B and 2.
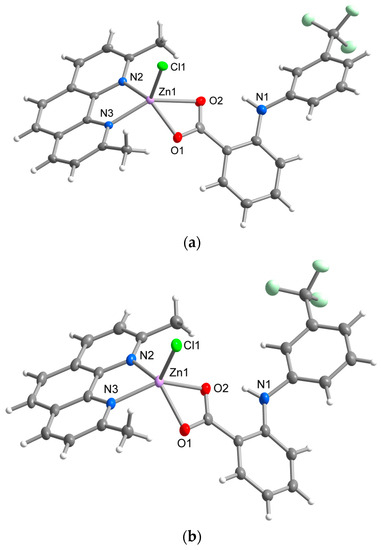
Figure 1.
Molecular structure of 1A (a) and 1B (b) showing the atom numbering scheme. Thermal ellipsoids are drawn at 50% probability level.
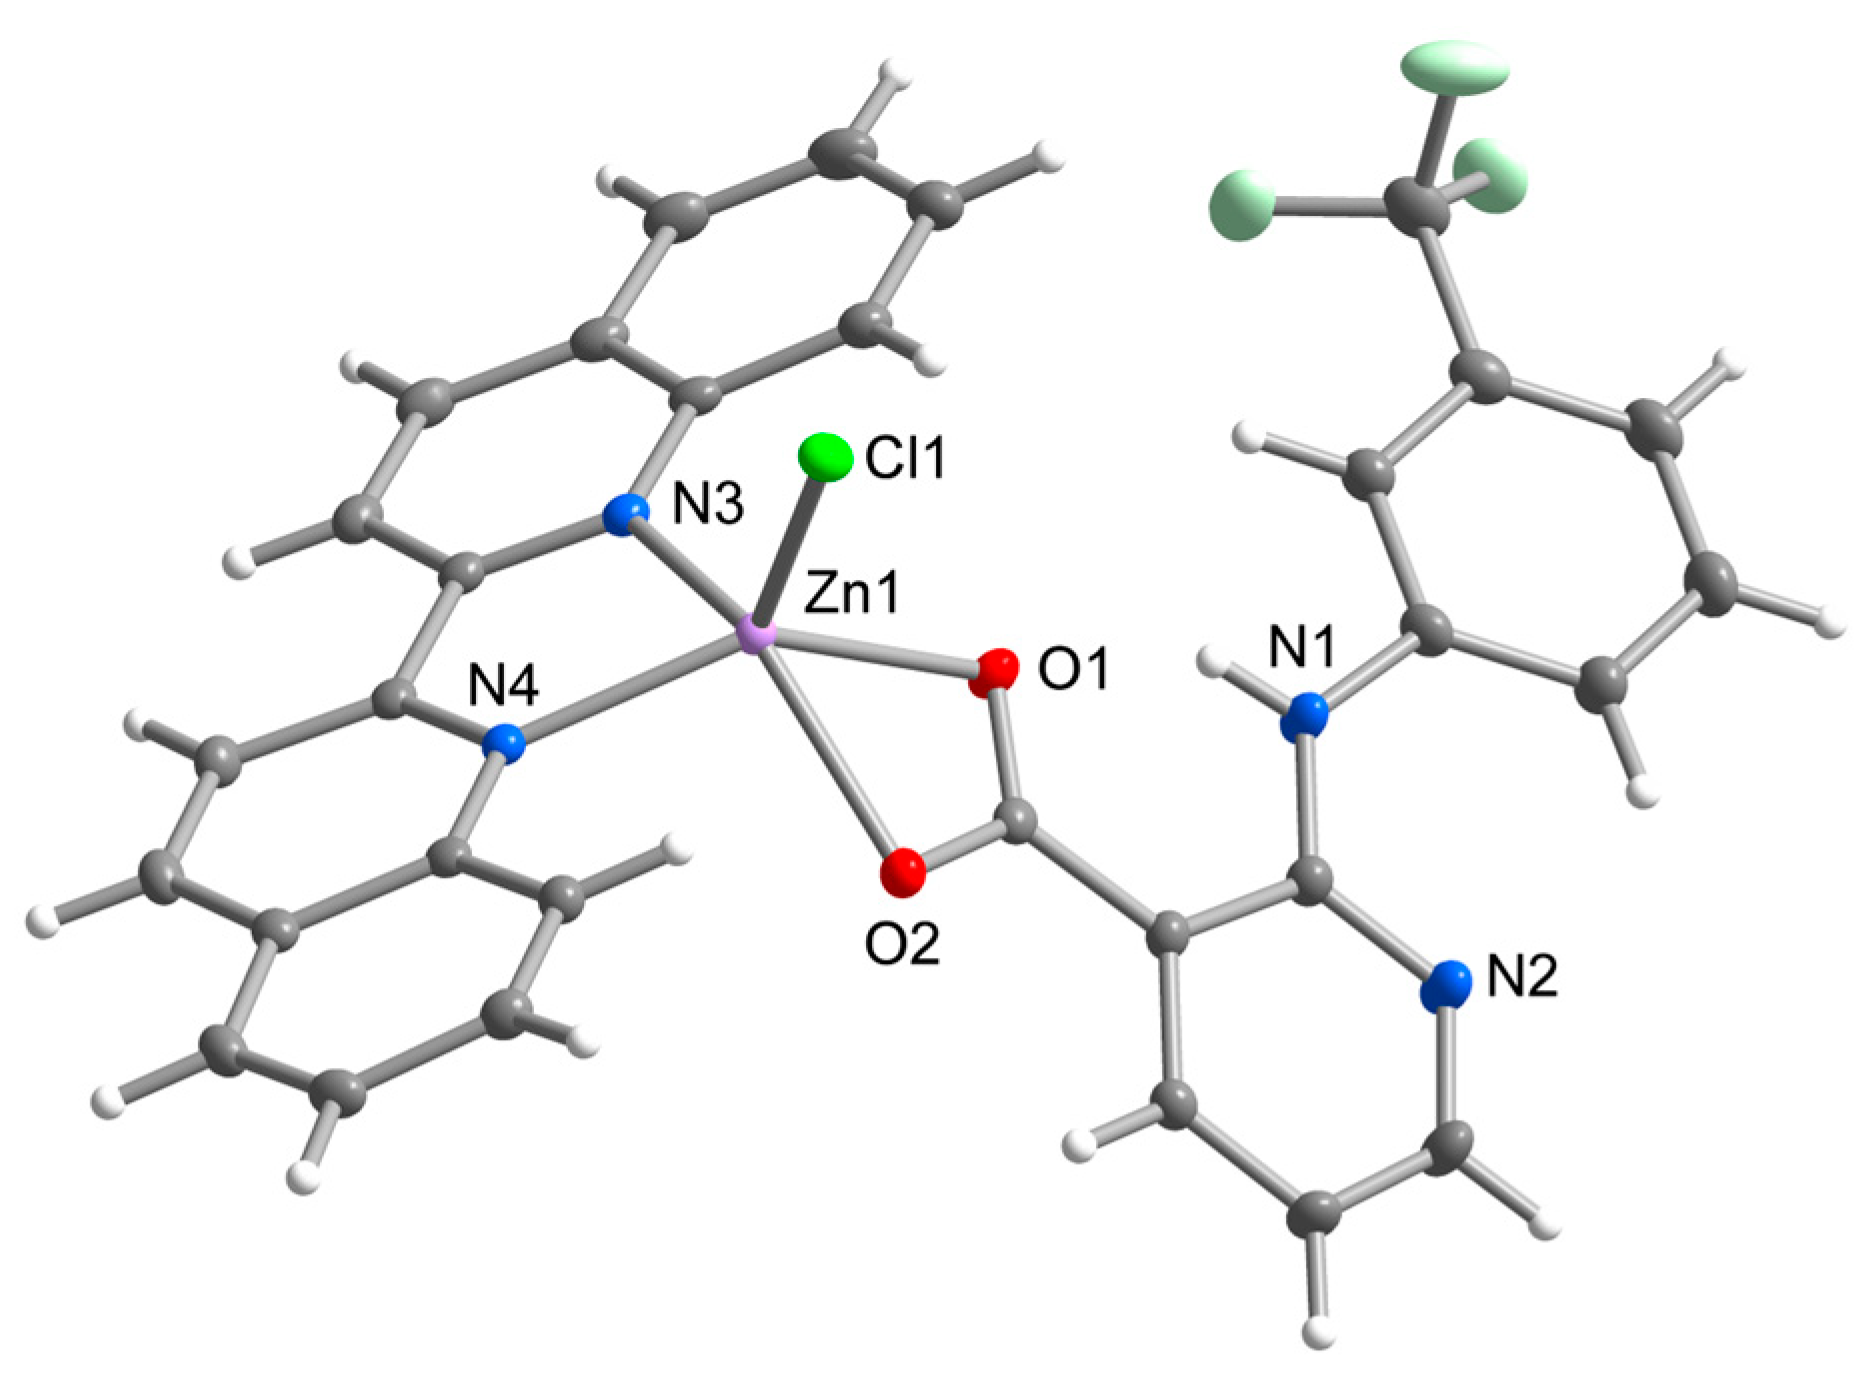
Complex 2 possesses the same chromophore of ZnClO2N2 as observed in 1A and 1B, however, it varies in both chelate ligands. The flufenamato ligand found is replaced by a niflumato ligand, which is bound to the central atom via oxygen atoms in a relatively symmetrical mode (Zn-O1 = 2.156(1) Å, Zn-O2 = 2.158(1) Å) (Figure 2). The 2,2’-biquinoline is bound in an almost symmetrical mode with the Zn-N and Zn-Cl bond lengths similar to those found in [ZnCl2(biq)] [29]. The aromatic rings of nif are fairly coplanar with the dihedral angle of 14.59(4)°, while the dihedral angles between the nif rings and biq plane (least-squares plane through pyridine rings of biq) are 56.98(4)° and 42.43(3)°, respectively. Complex 2 can be considered a structural analogue of the zinc niflumato complex with 2,2’-bipyridine [ZnCl(nif)(bpy)], with even smaller dihedral angles between the aromatic rings of nif (5.47(1)°), as well as between nif rings and bpy plane (39.26(6)° and 41.42(6)°) [30]. It can be assumed that the coplanarity of the aromatic rings in nif ligands is related to the dihedral angles between the two ligands, probably due to the stacking interactions involved in the supramolecular packing. The molecular structure of 2 is stabilized by the intramolecular N-H⋯O hydrogen bond between the secondary amino group and carboxylic group of nif ligands.

Figure 2.
Molecular structure of 2 showing the atom numbering scheme. Thermal ellipsoids are drawn at 50% probability level.
There are only nine structurally characterized zinc complexes containing carboxylate, N,N′-donor and the halogenido ligand reported in the literature so far [17]. These complexes are considered pentacoordinated or tetracoordinated based on the binding mode of deprotonated carboxylic acid by either monodentate or bidentate chelating. The main structural features of prepared complexes as well as similar mononuclear ternary compounds are summarized in Table S1. As shown in Table S1, the Zn-Cl and Zn-N bond distances differ only slightly; on the other hand, the Zn-O distances lay in wider range due to the asymmetric binding of carboxylate: Zn-O1 = 1.94–2.16 Å; Zn-O2 = 2.16–2.97 Å. Since the Zn-O2 bond lengths vary in a broad range, it proves difficult to determine the threshold for actual coordination of the second oxygen atom to the central atoms. With a bond length around 2.5 Å, the asymmetric carboxylate binding may be considered as semi-coordinated, while oxygen atoms in farther distances are generally considered non-bonded. The asymmetricity of carboxylate binding expressed by the bond lengths correlates with the decrease in the O1-Zn-O2 angle.
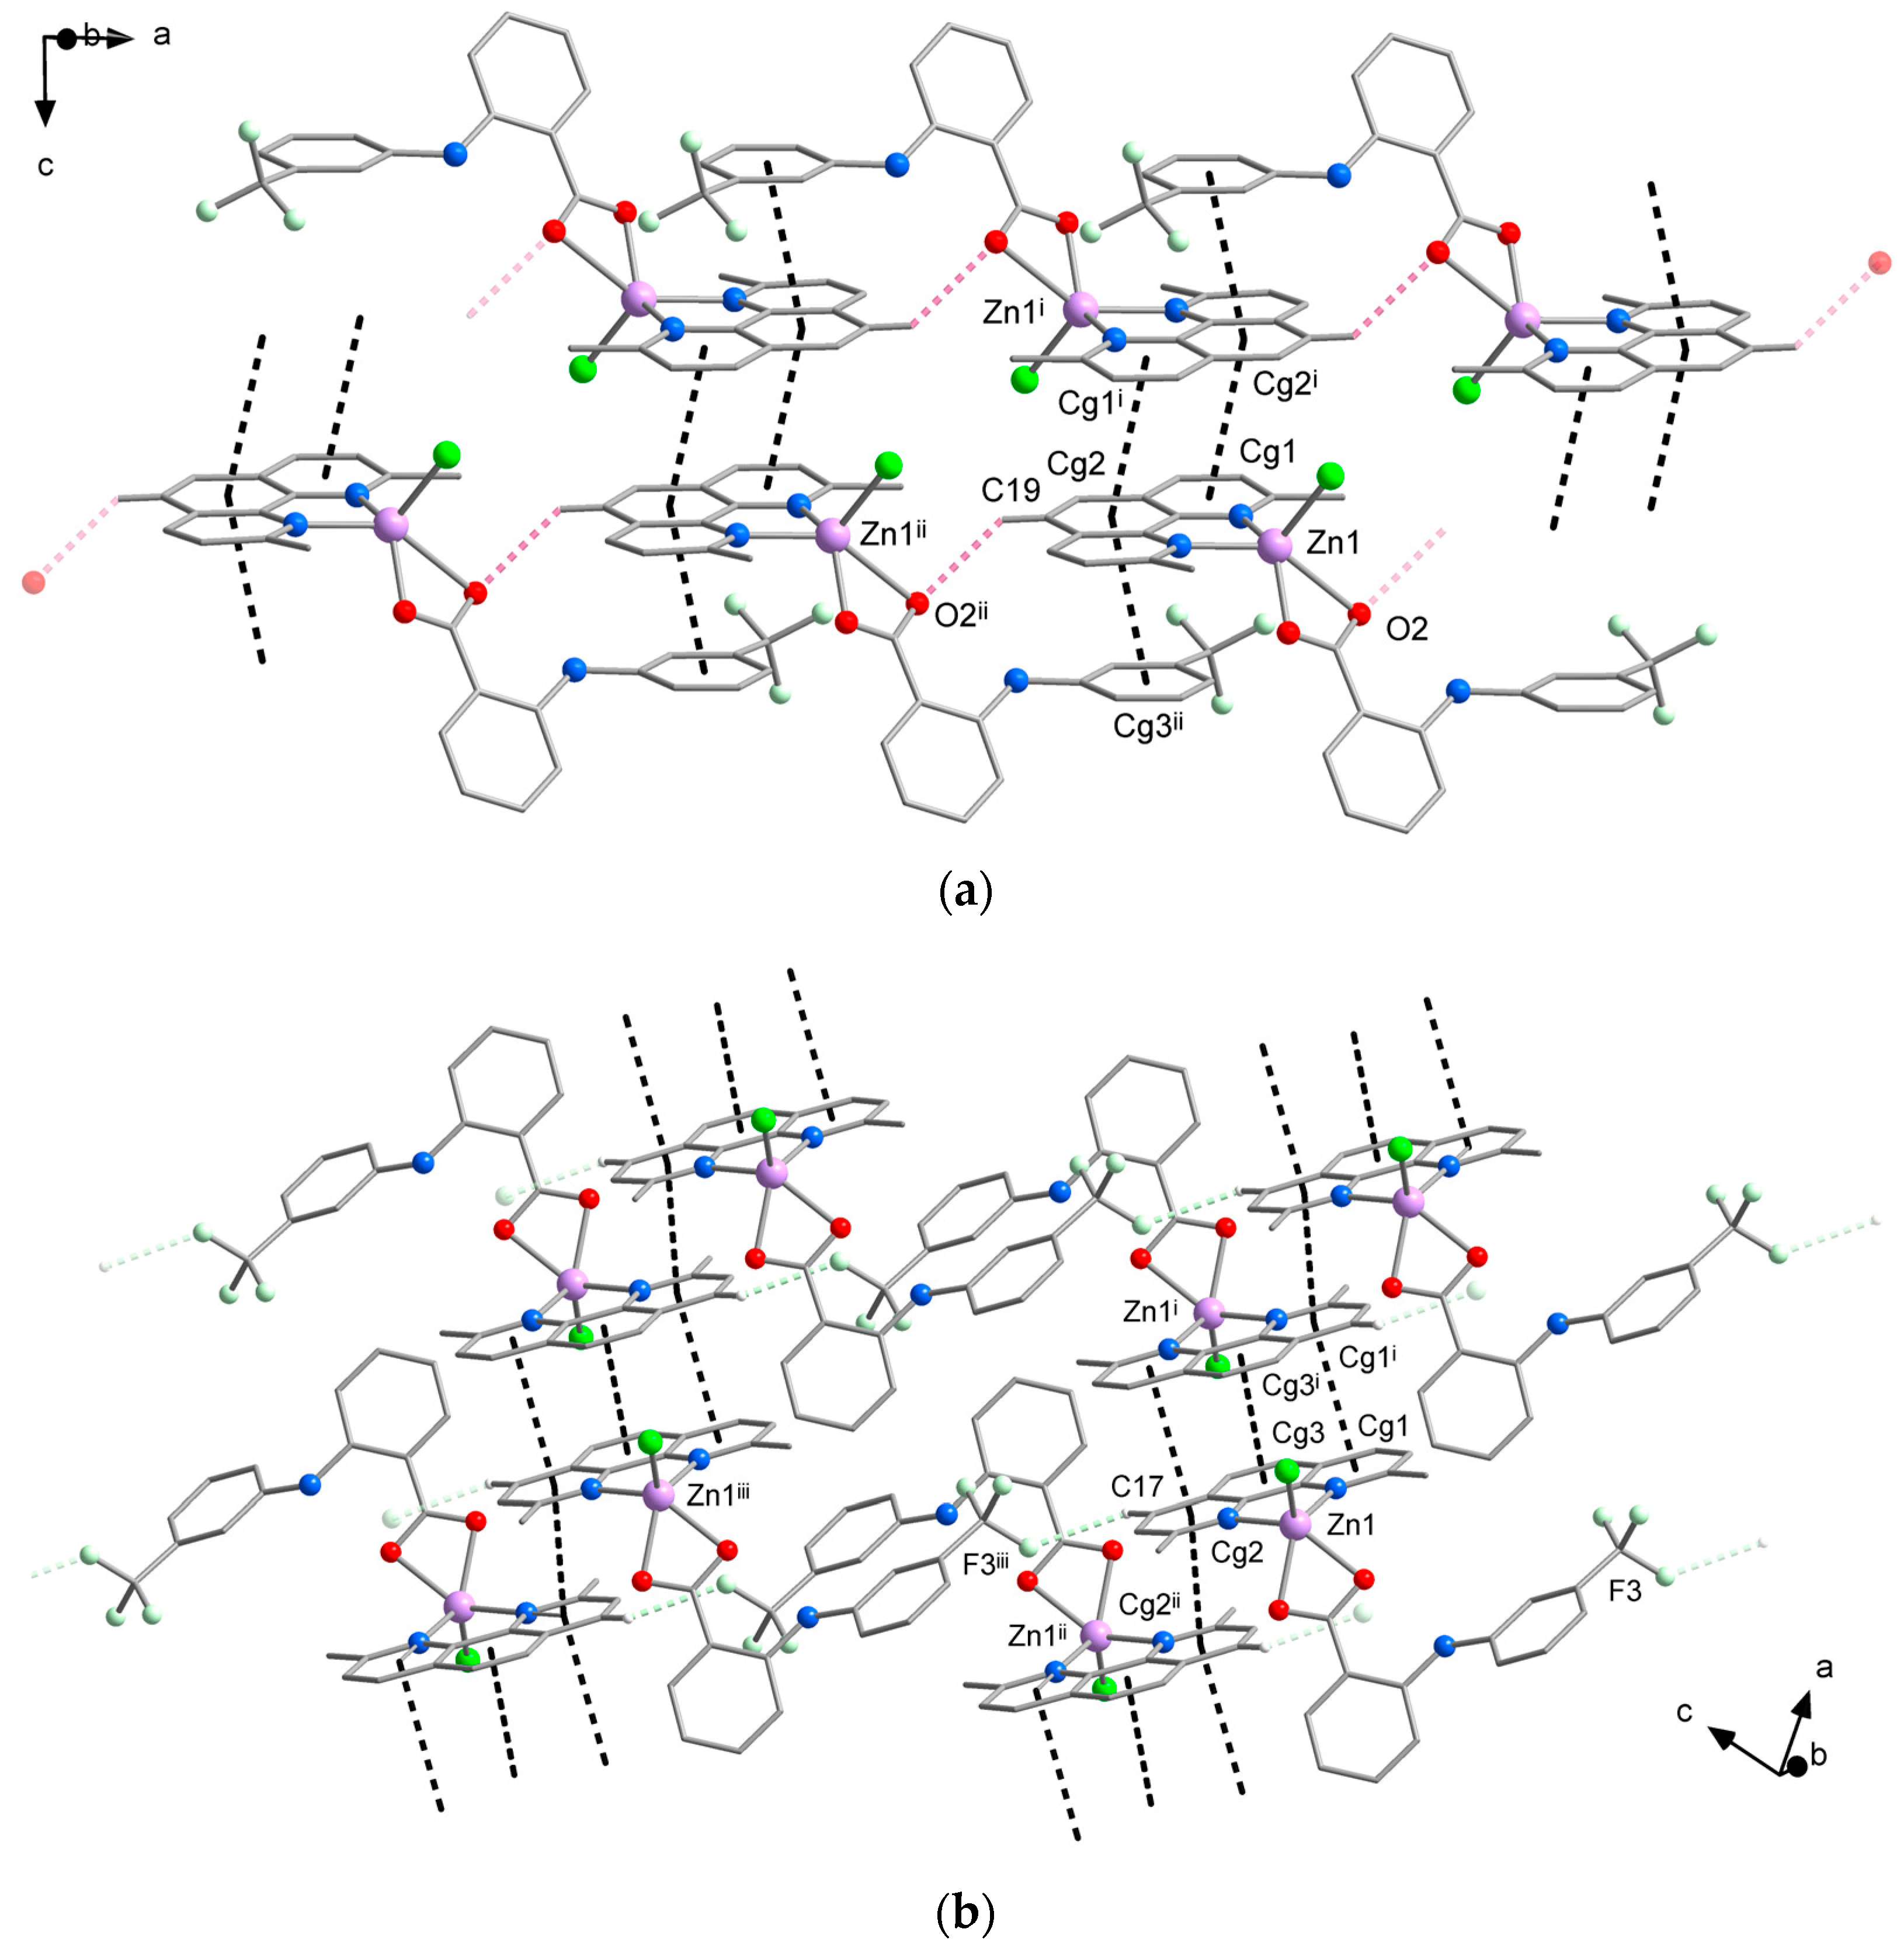
While differences in the molecular structure of complexes 1A and 1B might not be clearly visible at first sight, they create different crystal packing (Figure 3, Tables S2 and S3). The crystal structure of 1A is dominated by a system of π⋯π stacking interactions formed between the aromatic rings of neo and flu ligands (Figure 3a). The central and one lateral ring of neo ligands are involved in strong stacking interactions with the corresponding rings of neo in the adjacent molecules, thus forming supramolecular pairs with a Zn⋯Zn distance of 7.90 Å. This type of stacking is typical for metal complexes with neocuproine and it has been observed in the structure of [ZnCl2(neo)], however, with a slightly higher Zn⋯Zn separation of 7.97 Å [28]. Furthermore, the remaining lateral ring of neo ligands establishes stacking interactions with the flu ligands, which link the supramolecular pairs into chains along the a-axis. This supramolecular motif is reinforced by intermolecular C–H⋯O hydrogen bonds between the hydrogen atoms of the neo ligands and one oxygen atom of the carboxylate group of flu ligands from the adjacent molecule. Additional C–H⋯F hydrogen bonds between hydrogen atoms of the neo ligands and fluorine atoms of -CF3 groups of flu ligands are bridging the supramolecular chains into planes parallel with ab.
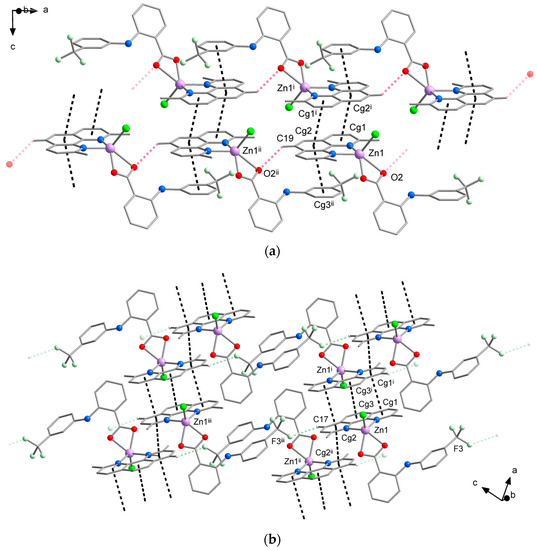
Figure 3.
Comparison of the crystal packing of 1A (a) and 1B (b) showing intermolecular C–H⋯O (pink dashed lines) C–H⋯F (pale green dashed lines) hydrogen bonding interactions and π⋯π stacking interactions (black dashed lines). Hydrogen atoms not involved in hydrogen bonds were omitted for clarity. Symmetry codes in (a): (i) −x, 1 − y, −z; (ii) − 1 + x, y, z; (b): (i) 1 − x, 1 − y, 1 − z; (ii) −x, 1 − y, 1 − z; (iii) −1 + x, y, 1 + z.
According to expectations, similar intermolecular interactions are stabilizing the crystal packing of 1B. The most prominent are π⋯π stacking interactions between the neo ligands, which connect the neighboring complex molecules into supramolecular chains along the a-axis (Figure 3b). Two different sets of π⋯π stacking interactions are formed within these chains; the closest complex molecules are linked by a stronger stacking, which involves all three aromatic rings of neo ligands, whereas the alternating weaker stacking is established between the lateral rings. As a result of different stacking pattern, the shortest intermolecular Zn⋯Zn distance of 7.80 Å is even shorter than in 1A. The intermolecular C–H⋯F hydrogen bonds similar to those observed in the crystal structure of 1A are bridging the supramolecular chains into planes parallel with ac. Moreover, weaker C–H⋯Cl hydrogen bonds also contribute to the stability of the crystal structure by linking the supramolecular planes into a 3D system.
The formation of C–H⋯O hydrogen bonds through one of the oxygen atoms of the flufenamato ligand found in the packing of 1A (but not observed in 1B) is probably responsible for the asymmetric binding mode, which is a key difference between the molecular structure of the two polymorphs of complex [ZnCl(flu)(neo)].
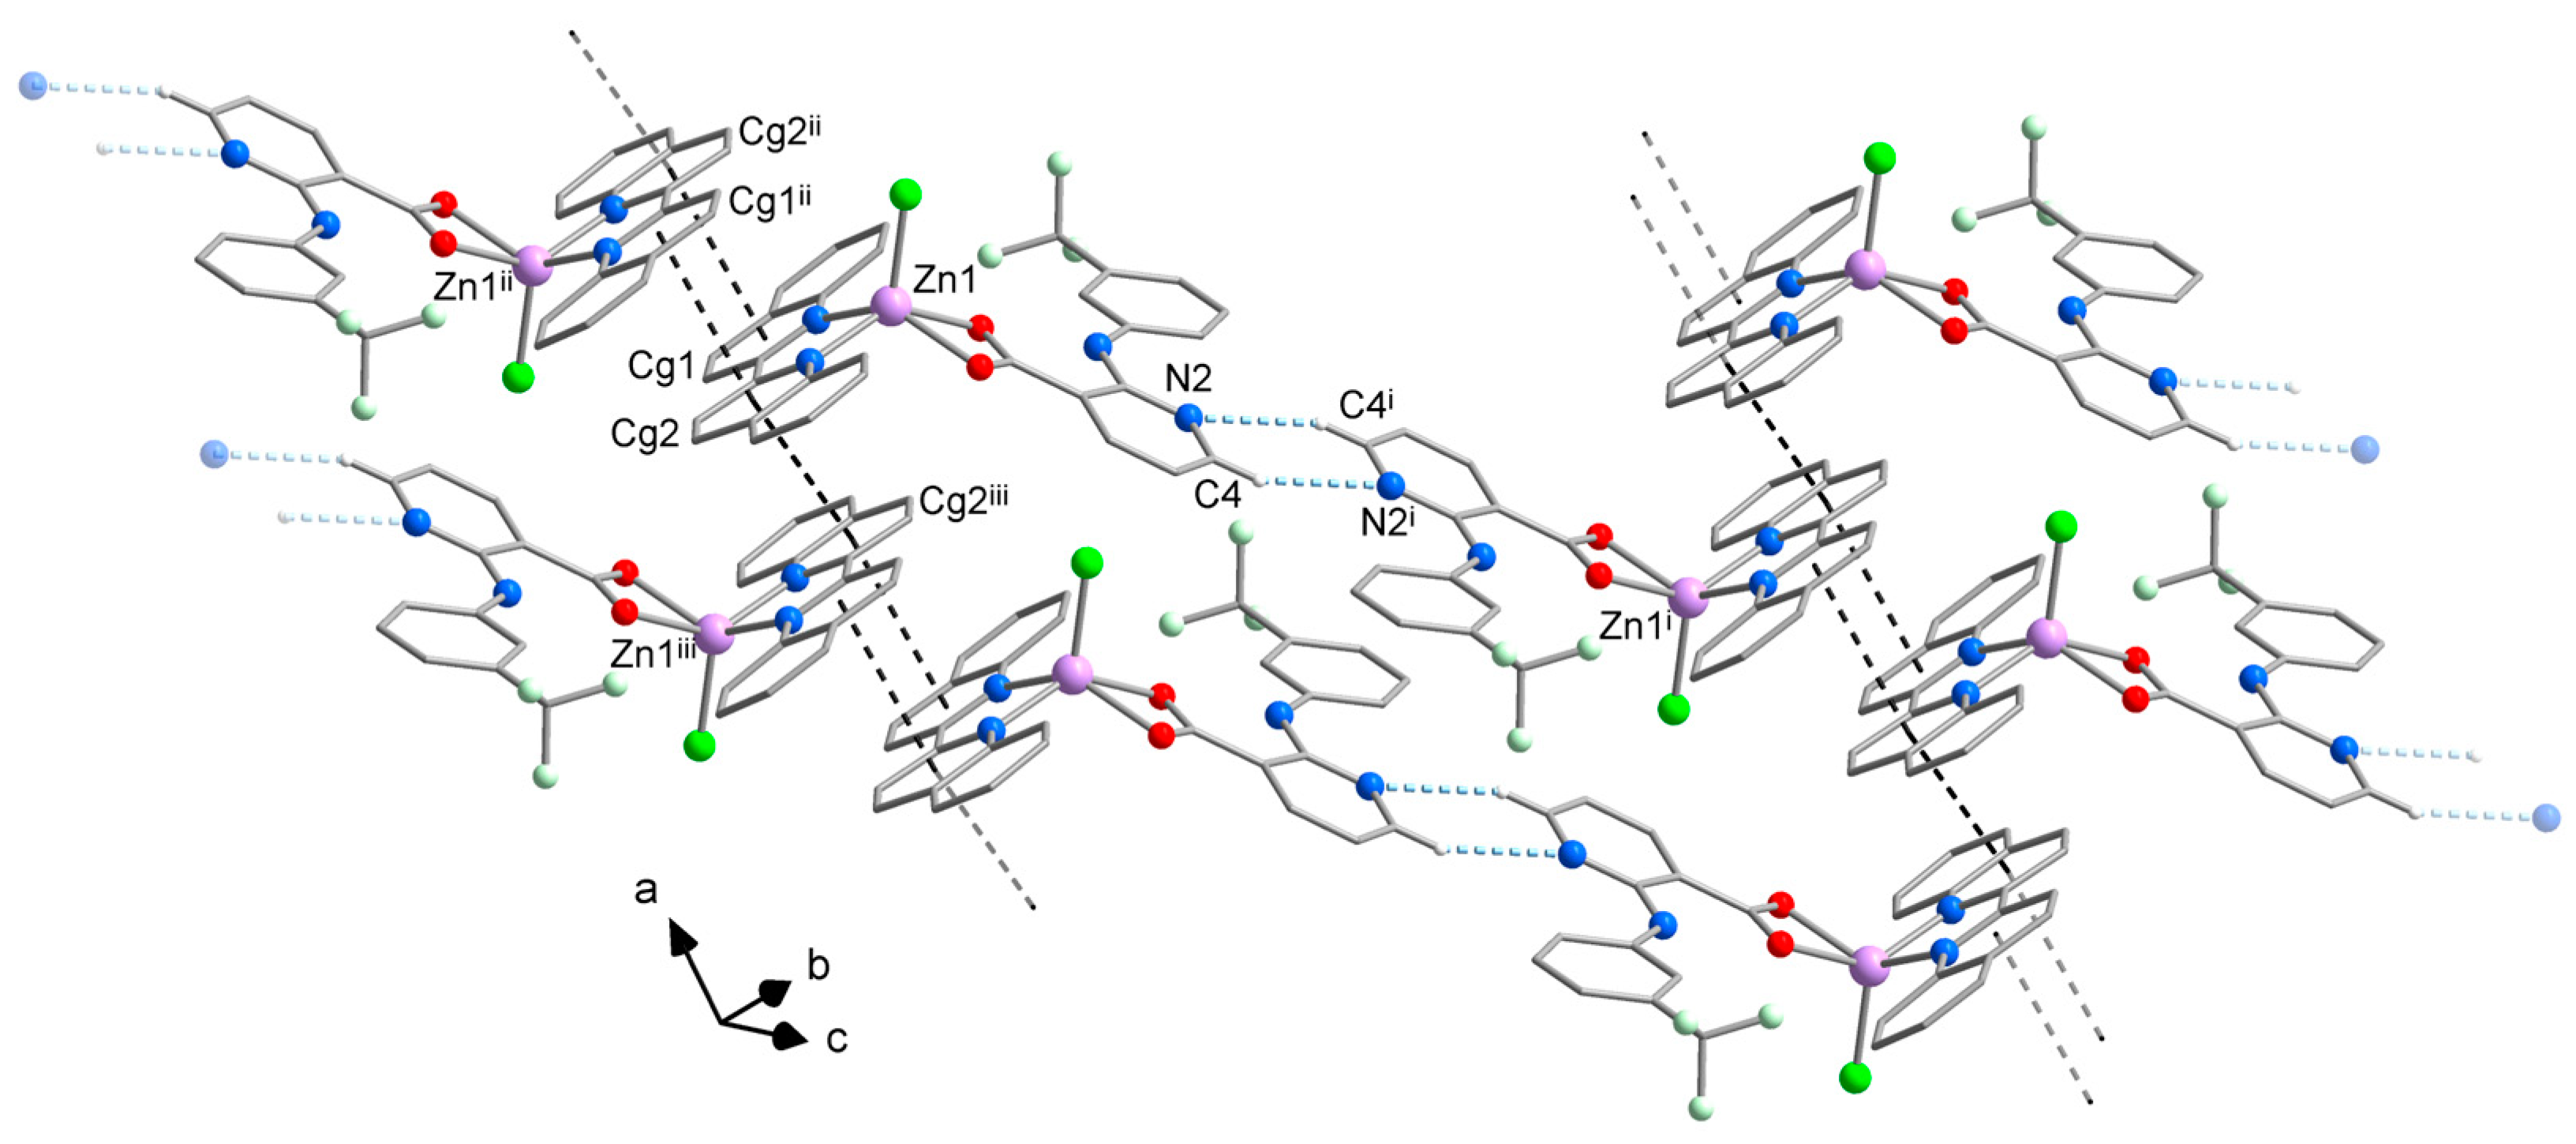
The crystal packing of 2 is likewise mainly stabilized by π⋯π stacking interactions, which are formed between the nitrogen containing aromatic rings of biq ligands and link the complexes molecules form supramolecular chains along the a-axis. The stacking is very effective with a shortest intermolecular Zn⋯Zn distance of 6.87 Å. In comparison, the previously reported [ZnCl2(biq)] complex exhibits different stacking pattern, where each half of biq ligand interacts with a different complex molecule, resulting in longer intermolecular distance of 7.47 Å between the Zn atoms [29]. Furthermore, intermolecular C–H⋯N hydrogen bonding interactions that involve the pyridine ring nitrogen atom of the niflumato ligand contribute to the stability of the crystal packing by bridging the supramolecular chains into the planes (Figure 4).

Figure 4.
View of the crystal packing of 2 showing intermolecular C–H⋯N hydrogen bonding interactions (pale blue dashed lines) and π⋯π stacking interactions (black dashed lines). Hydrogen atoms not involved in hydrogen bonds were omitted for clarity. Symmetry codes: (i) −x, 2 − y, 2 − z; (ii) 1 − x, 1 − y, 1 − z; (iii) −x, 1 − y, 1 − z.
3.3. Hirshfeld Surface Analysis
The Hirshfeld surface analysis was performed to further inspect the intermolecular interactions and evaluate the strength of the short contacts in the prepared complexes.
The analysis of close contacts in the structure of 1A illustrates the presence of strong hydrogen bonds expressed by O⋯H/H⋯O contacts (4.3% of the total surface) and π⋯π stacking interactions represented by C⋯C close contacts (8.3%) in accordance with the conventional analysis of intermolecular interactions described above. In addition, the F⋯H/H⋯F (14.3%) and Cl⋯H/H⋯Cl (9.7%) also govern large portions of the total Hirshfeld surface, thereby highlighting the importance of weaker C–H⋯Cl and C–H⋯F hydrogen bonds in the crystal packing. Surprisingly, a closer inspection uncovered the existence of relatively strong F⋯C contact, which indicates the formation of uncommon F⋯π interactions between neo and flu ligands (Figure 5a) [31].
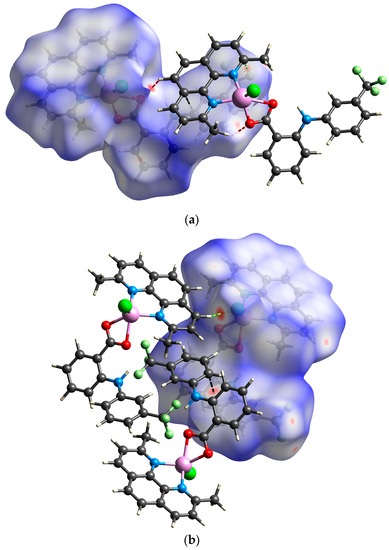
Figure 5.
View of the Hirshfeld surface of 1A ((a); −0.1307–1.4286 a.u.) and 1B ((b); −0.1919–1.5075 a.u.) plotted over dnorm showing short contacts between adjacent molecules (red = H∙∙∙O; green = H∙∙∙Cl; pale green = C∙∙∙F; black = C∙∙∙C). Surface is visualized as transparent for the sake of clarity.
In absence of intermolecular C–H⋯O hydrogen bonds, the strongest interaction found in the supramolecular structure of 1B is the H⋯Cl close contact, which confirms the importance of C–H⋯Cl hydrogen bonding interactions (Figure 5b). The Cl⋯H/H⋯Cl as well as the F⋯H/H⋯F close contacts governing similar portions of the total Hirshfeld surface (9.5% and 15.0%, respectively) as in 1A. Although the C⋯C short contacts cover only 7.7% of the total surface, the close contact between the trifluoromethylphenyl rings of the flu ligands reveal the significant contribution of π⋯π stacking interactions to the stability of the crystal structure.
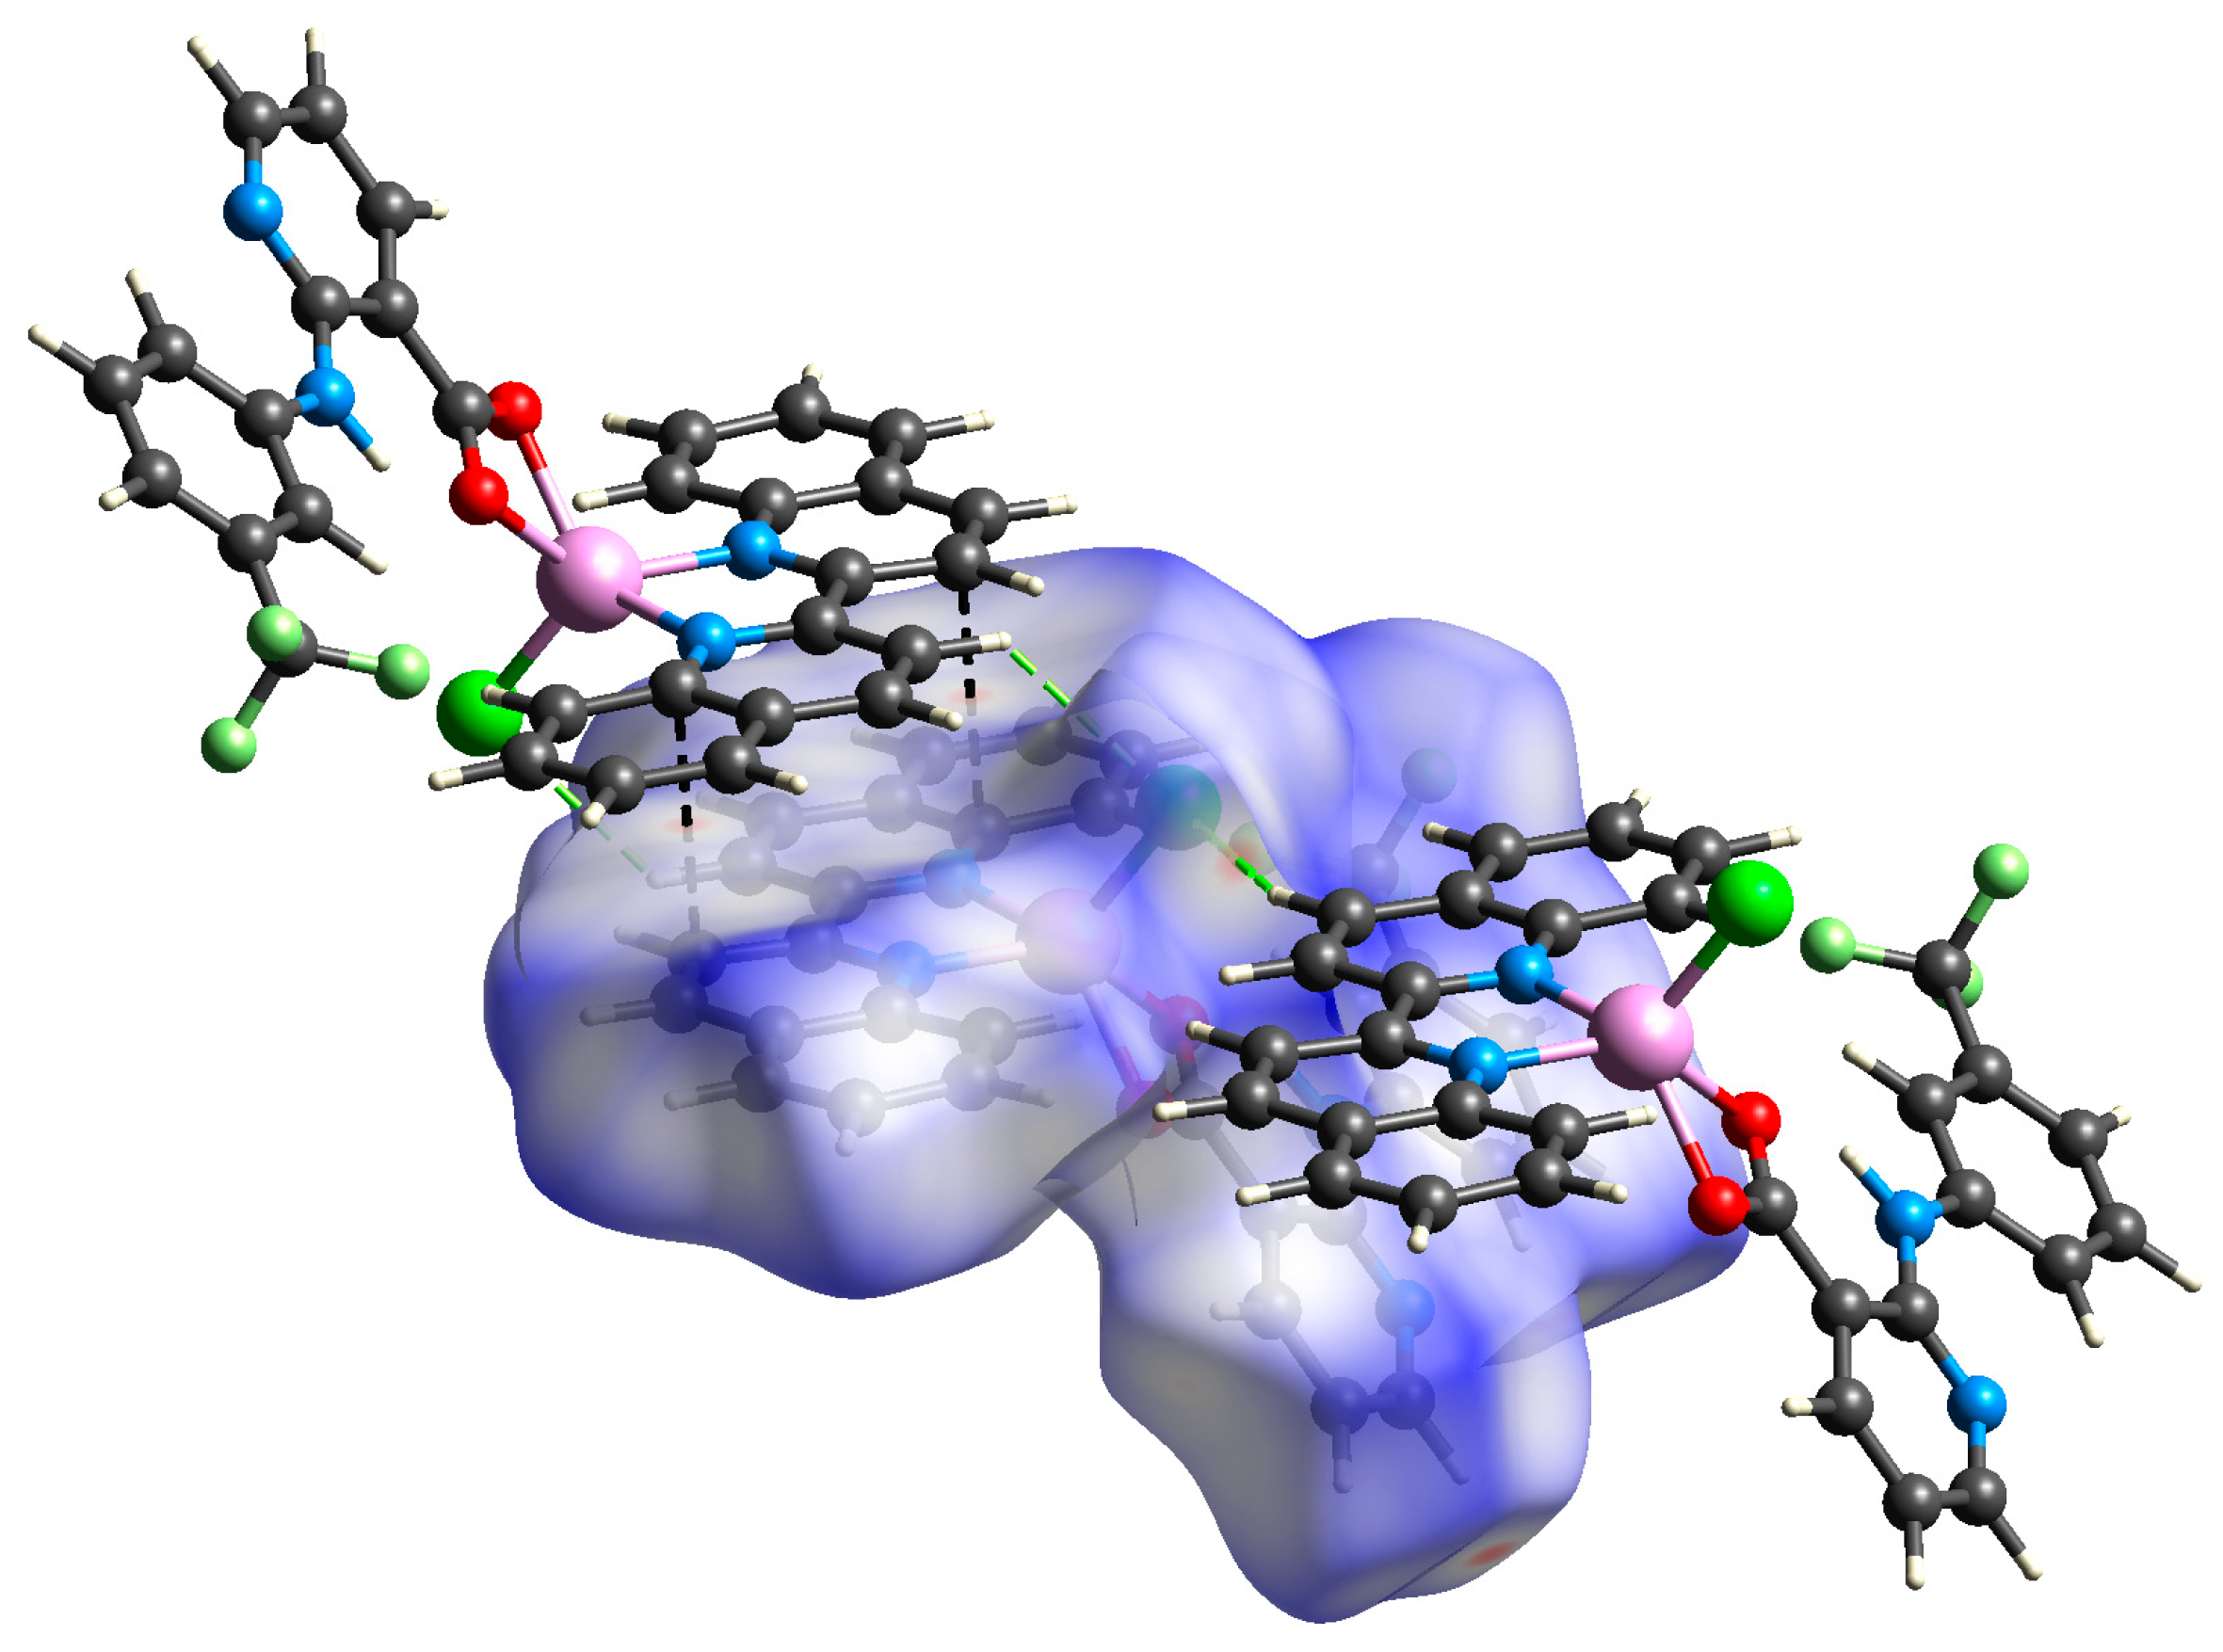
In the case of complex 2, the analysis of Hirshfeld surface confirmed the presence of strong π⋯π stacking interactions represented by C⋯C close contacts (9.1% of the total surface) as well as the C–H⋯N hydrogen bonds corresponding to H⋯N/N⋯H (3.3%). A more thorough investigation also revealed weaker C–H⋯Cl and C–H⋯F hydrogen bonding interactions that govern considerable portions of the total surface (8.9 and 10.5%, respectively) (Figure 6).

Figure 6.
View of the Hirshfeld surface of 2 (−0.2123–1.3391 a.u.) plotted over dnorm showing short contacts between adjacent molecules (green = H∙∙∙Cl; black = C∙∙∙C). Surface is visualized as transparent for the sake of clarity.
The capability of the studied complexes to create intermolecular C–H⋯Cl and C–H⋯F hydrogen bonding interactions might affect their biological activity, since even the weak non-covalent interactions can play a role in DNA and protein binding along with the π⋯π stacking interactions and conventional hydrogen bonds [32,33].
3.4. IR Spectroscopy
The solid-state FTIR spectra (Figure S1) of the prepared complexes were measured in the range of 4000–250 cm−1 to confirm the deprotonation of the carboxylic acid as well as coordination of the ligands to the central atom. The absorption bands at 1583 cm−1 (1A and 2) and 1581 cm−1 (1B) are attributable to the antisymmetric stretching vibration of carboxylate, while the band at 1400 cm−1 (1B and 2) and 1380 cm−1 (1A) correspond to the symmetric stretching vibration. The presence of carboxylate stretching vibrations in combination with absence of characteristic carboxylic stretching vibrations (ν(O-H), ν(C=O), ν(C-O)) suggest a total deprotonation of carboxylate upon its coordination to the zinc atom. The Δ separation values (Δ = ν(COO)as − ν(COO)s) (1A—203 cm−1, 1B—181 cm−1, and 2—183 cm−1) indicate bidentate cheating binding mode [30,34]. Since the separation values above 200 cm−1 imply monodentate binding, the higher value observed in the spectrum of 1A indicates a more pronounced coordination asymmetry leading to semi-coordination, as confirmed by the X-ray structural data. Stretching vibrations of the secondary amine group ν(N-H) of the flu and nif ligand in the respective complexes are observed as weak intensity bands at 3273 (1A), 3237 (1B), and 3271 cm−1 (2). The aromatic stretching vibrations (1A, 1B, 2) and aliphatic methyl vibrations (1A and 1B) are observed at lower frequencies at ~3050 cm−1 ν(C–H)ar and ~2960 cm−1 ν(C–H)Me. The coordination of the N,N′-donor ligand to the central atom may be confirmed by the presence of the ν(M-N) vibration bands at 450, 272 cm−1 (1A), 458, 276 cm−1 (1B), 457, 276 cm−1 (2), while the most prominent band in the far infrared range may be attributable to Zn-Cl stretching vibrations 318 cm−1 (1A), 310 cm−1 (1B) and 319 cm−1 (2) [35].
3.5. UV-VIS and Fluorescence Spectroscopy
The absorption spectra of the 1A and 1B in dmso solutions (10 μM) exhibit identical absorption bands, as could be expected (Figure S2). The most intense absorption band in the UV range is located at 272 nm in both spectra with a distinct shoulder around 284 nm. In contrast, there are two absorption maxima in the spectrum of complex 2 that are found at higher wavelengths of 300 and 326 nm. Zinc complexes do not exhibit d-d transitions, hence these absorption bands are only attributable to the intraligand and intramolecular charge transfer transitions [36,37].
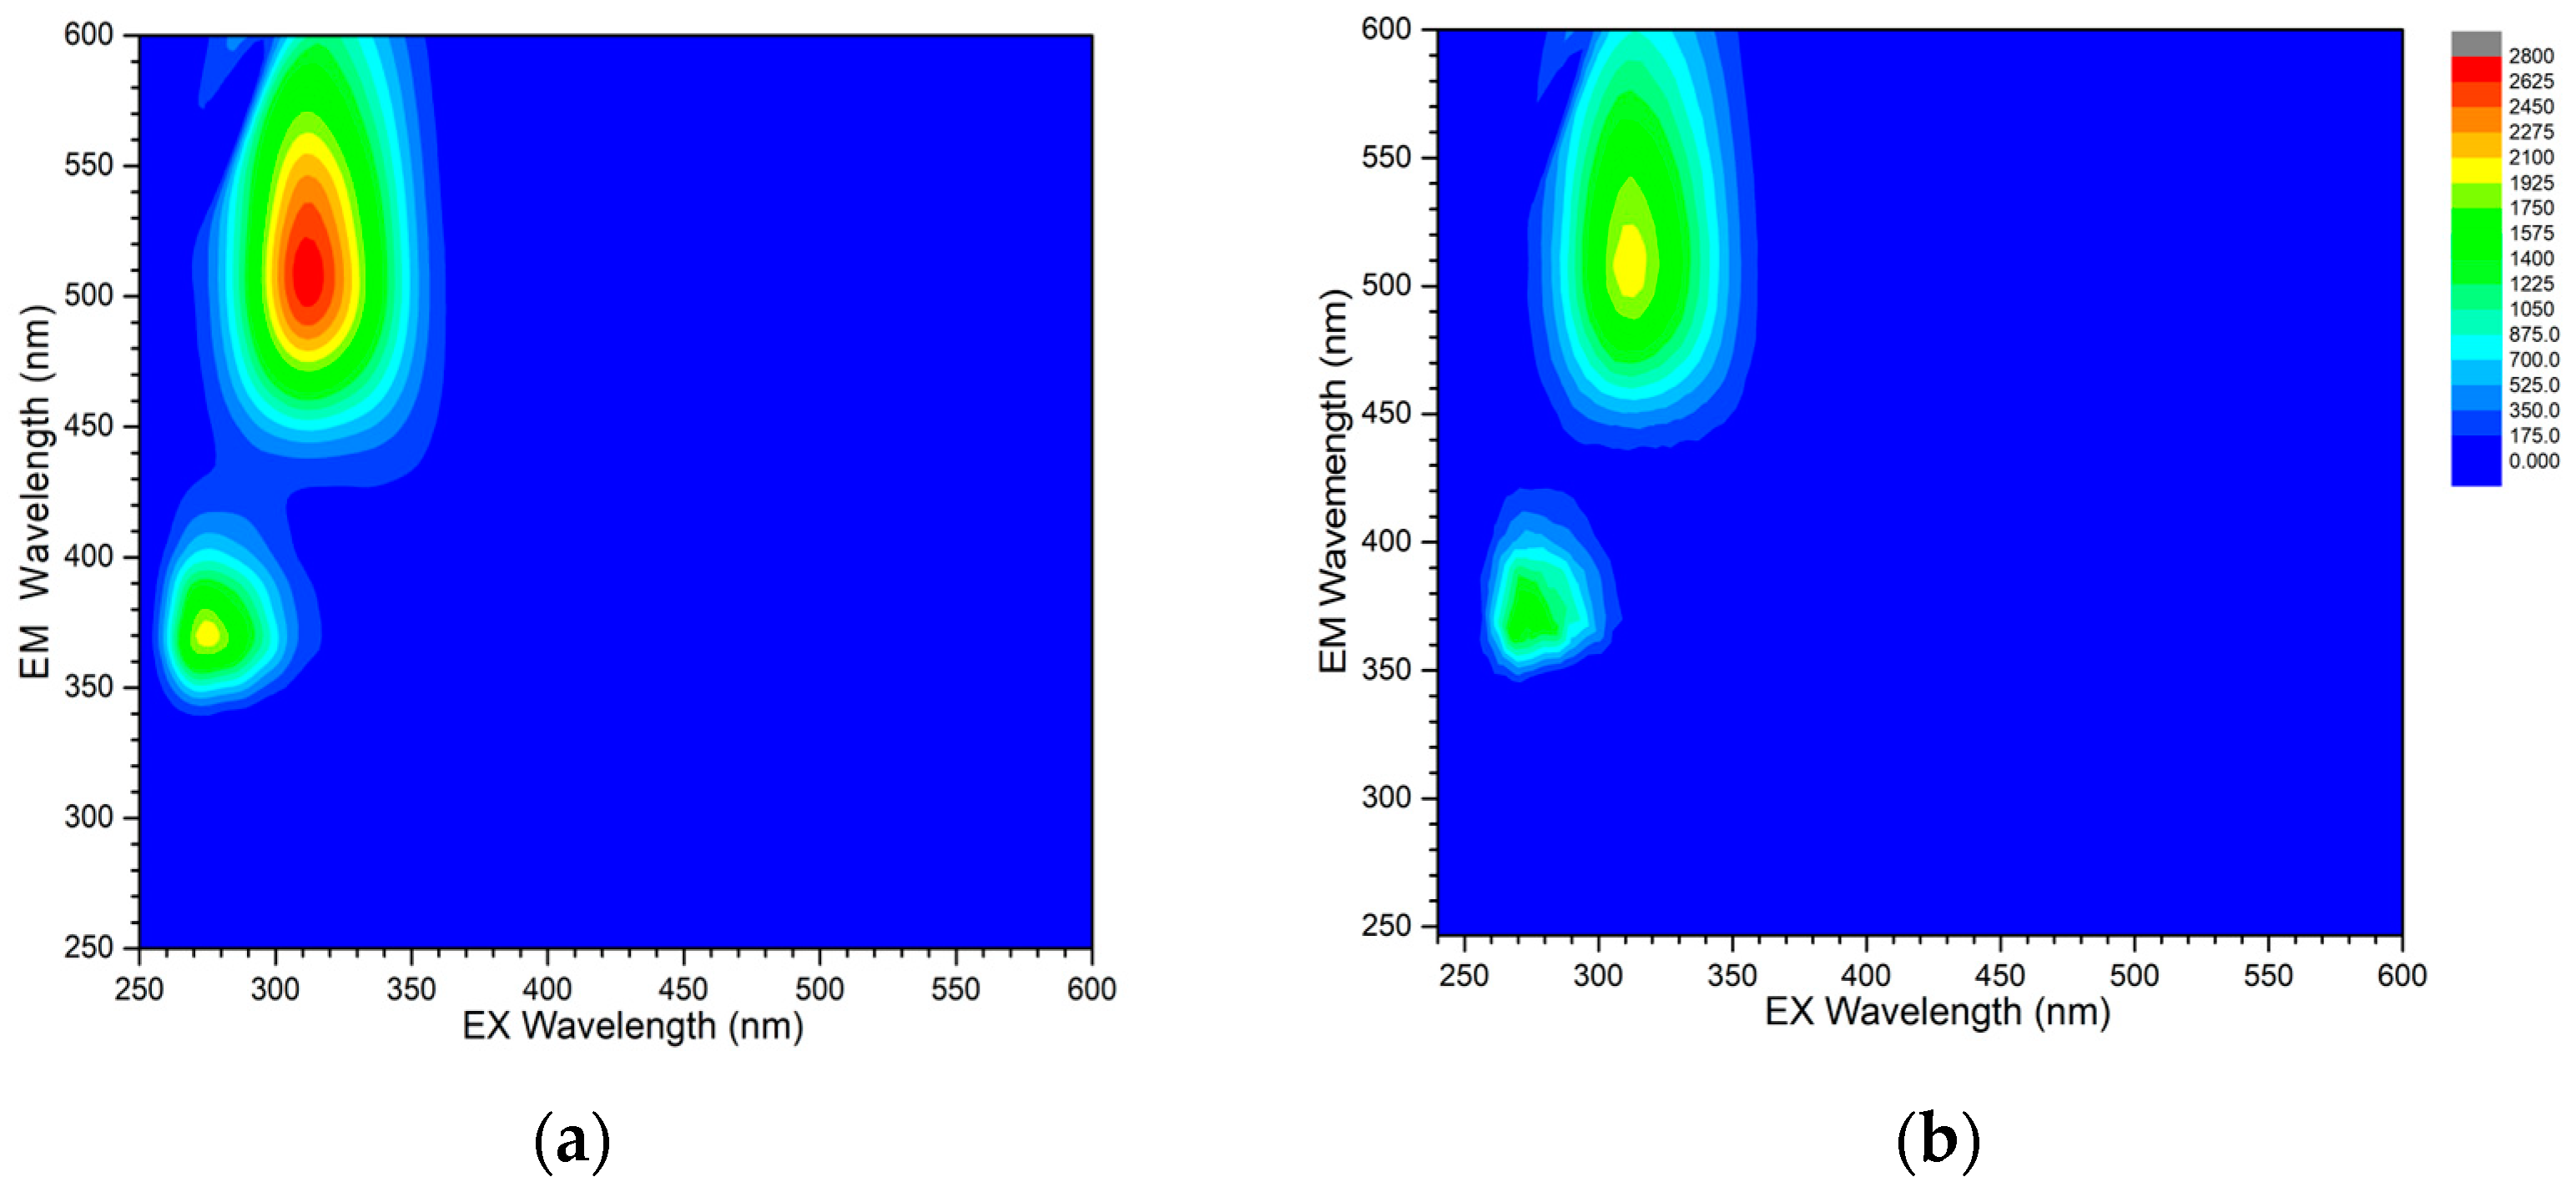
The luminescence of the studied complexes was analyzed by determination of excitation-emission matrices (EEMs) in the range of 250–600 nm. Spectra of the flufenamato complexes with neocuproine are similar and exhibit two distinct maxima located at 274/369 nm and 312/503 nm (λex/λem) in 1A and 272/369 nm and 312/503 nm (λex/λem) in 1B (Figure 7). The emission of the second maximum is placed in the visible range of the spectrum and can be observed as an intense green-emitted light upon the irradiation of the solution by a UV lamp. Similar green emission has been reported for other zinc complexes containing 1,10-phenanthroline-based ligands [38,39]. Complex 2 does not exhibit any measureable fluorescence in dmso solution under the same experimental conditions.
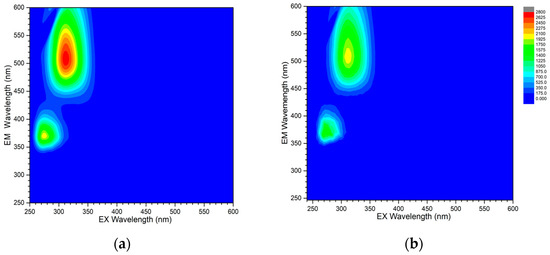
Figure 7.
Excitation-emission matrices of 10 μM solutions of 1A (a) and 1B (b) in dmso. Rayleigh and Raman scattering was masked for the sake of clarity. The color scheme is adjusted to the same intensity scale for better comparison.
Characteristic fluorescence of the complexes 1A and 1B, with a relatively high intensity at low concentrations, might find applications in the cell imaging during in vitro experiments. However, based on the presented spectral measurements, it is difficult to determine whether complexes 1A and 1B retain their solid-state structure with a different binding of the flu ligand in solutions, since there are only very slight differences in position and intensity of the absorption and fluorescence emission bands.
3.6. DNA Binding Studies
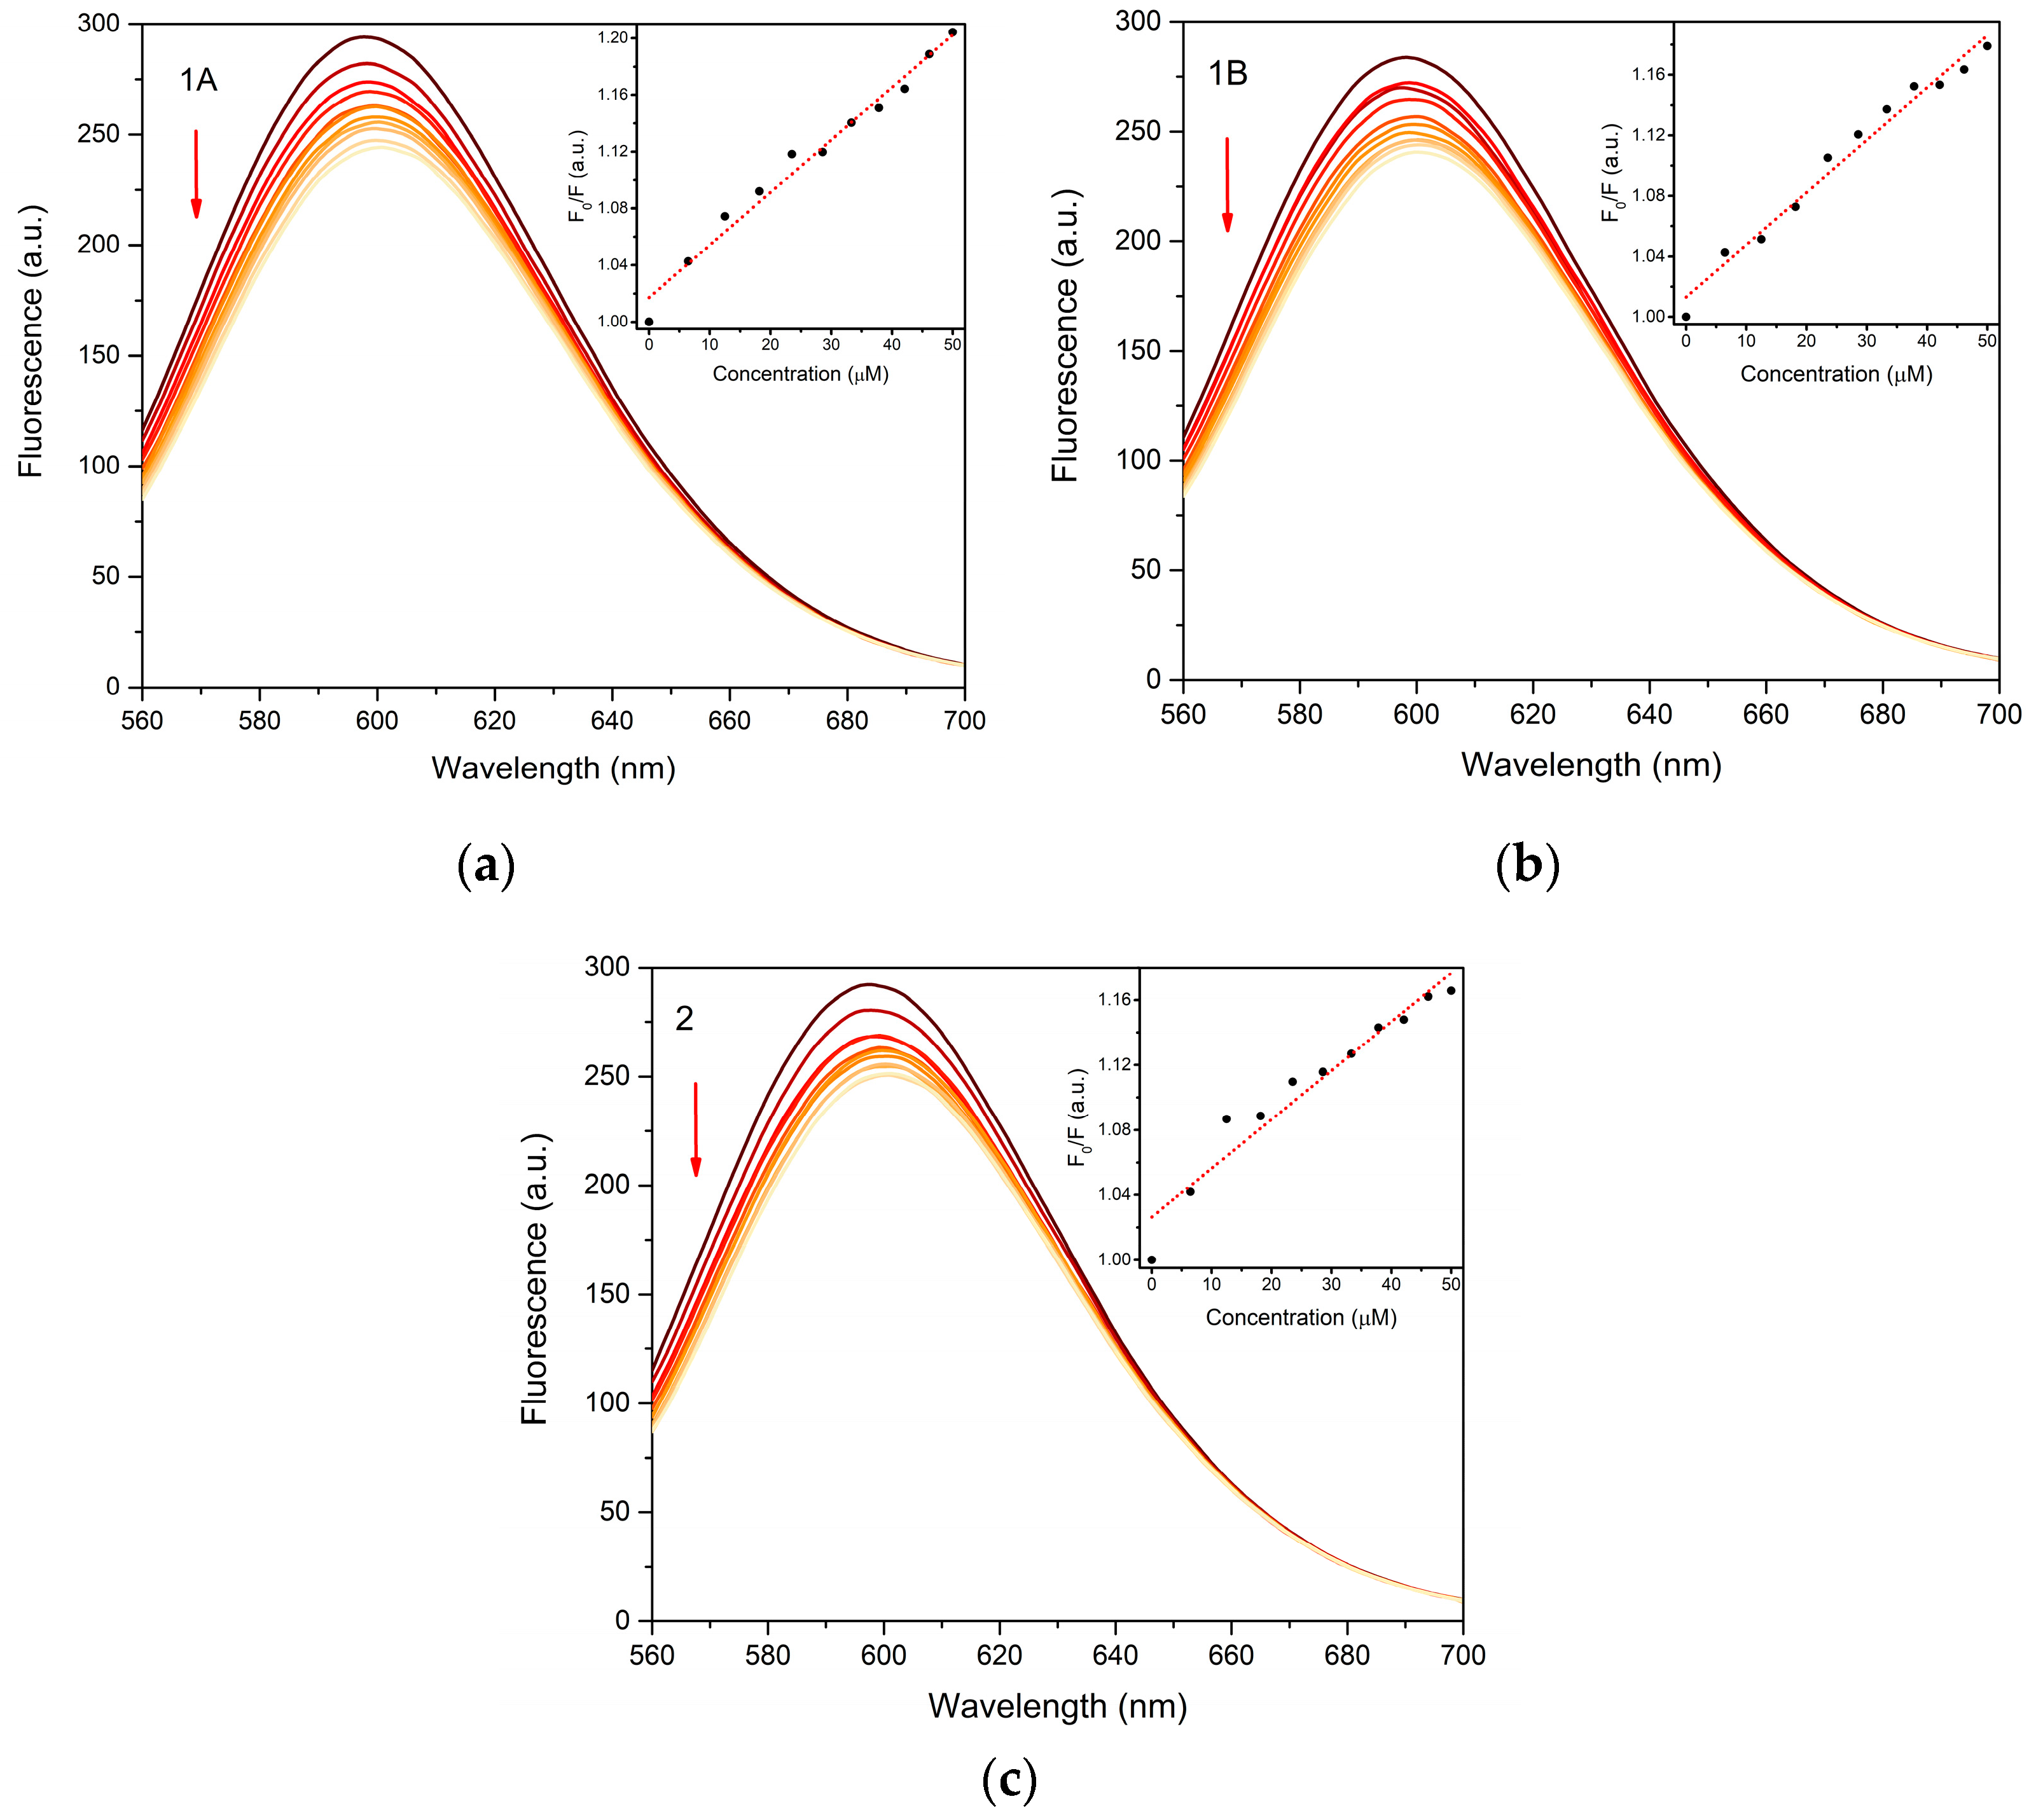
The interaction of the prepared complexes with fish sperm DNA (FS DNA) was studied by a standard fluorescence competitive binding assay with ethidium bromide (EB). The binding affinity of the studied complexes towards DNA was evaluated by Stern–Volmer binding constants (KSV) calculated from the linear Stern–Volmer plots (Figure 8) and the results are summarized in Table 3. All the tested compounds show the similar values of 3.01 × 10³–3.71 × 10³ M−1, with the highest value calculated for the 1A. However, the direct confrontation with our previous study shows a higher binding affinity of complex 1A towards CT DNA (calf thymus DNA) with KSV = 5.90 × 10⁴ M−1 [7].
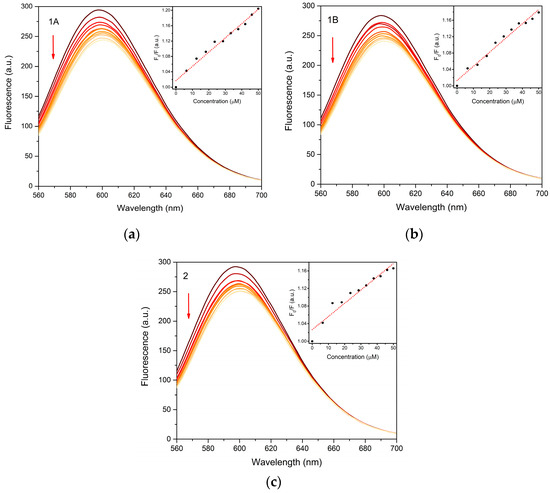
Figure 8.
Fluorescence emission plots of FS DNA-EB complex upon gradual addition of 1A (a), 1B (b) and 2 (c) in the concentration range 0–50 μM (indicated by arrow). Insets show Stern-Volmer plots used for calculation of binding constants.
Table 3.
Relative quenching ΔF and KSV values evaluated form the FS DNA binding experiments with the tested complexes.
The calculated KSV values for 1A, 1B and 2 indicate a weaker interaction of the complexes with DNA via intercalative mode, although they are within the range of 102–106 M−1 for zinc complexes with fenamic acid derivatives with FS or CT DNA previously reported in the literature [5,6,30,40,41,42].
3.7. Albumin Binding Studies
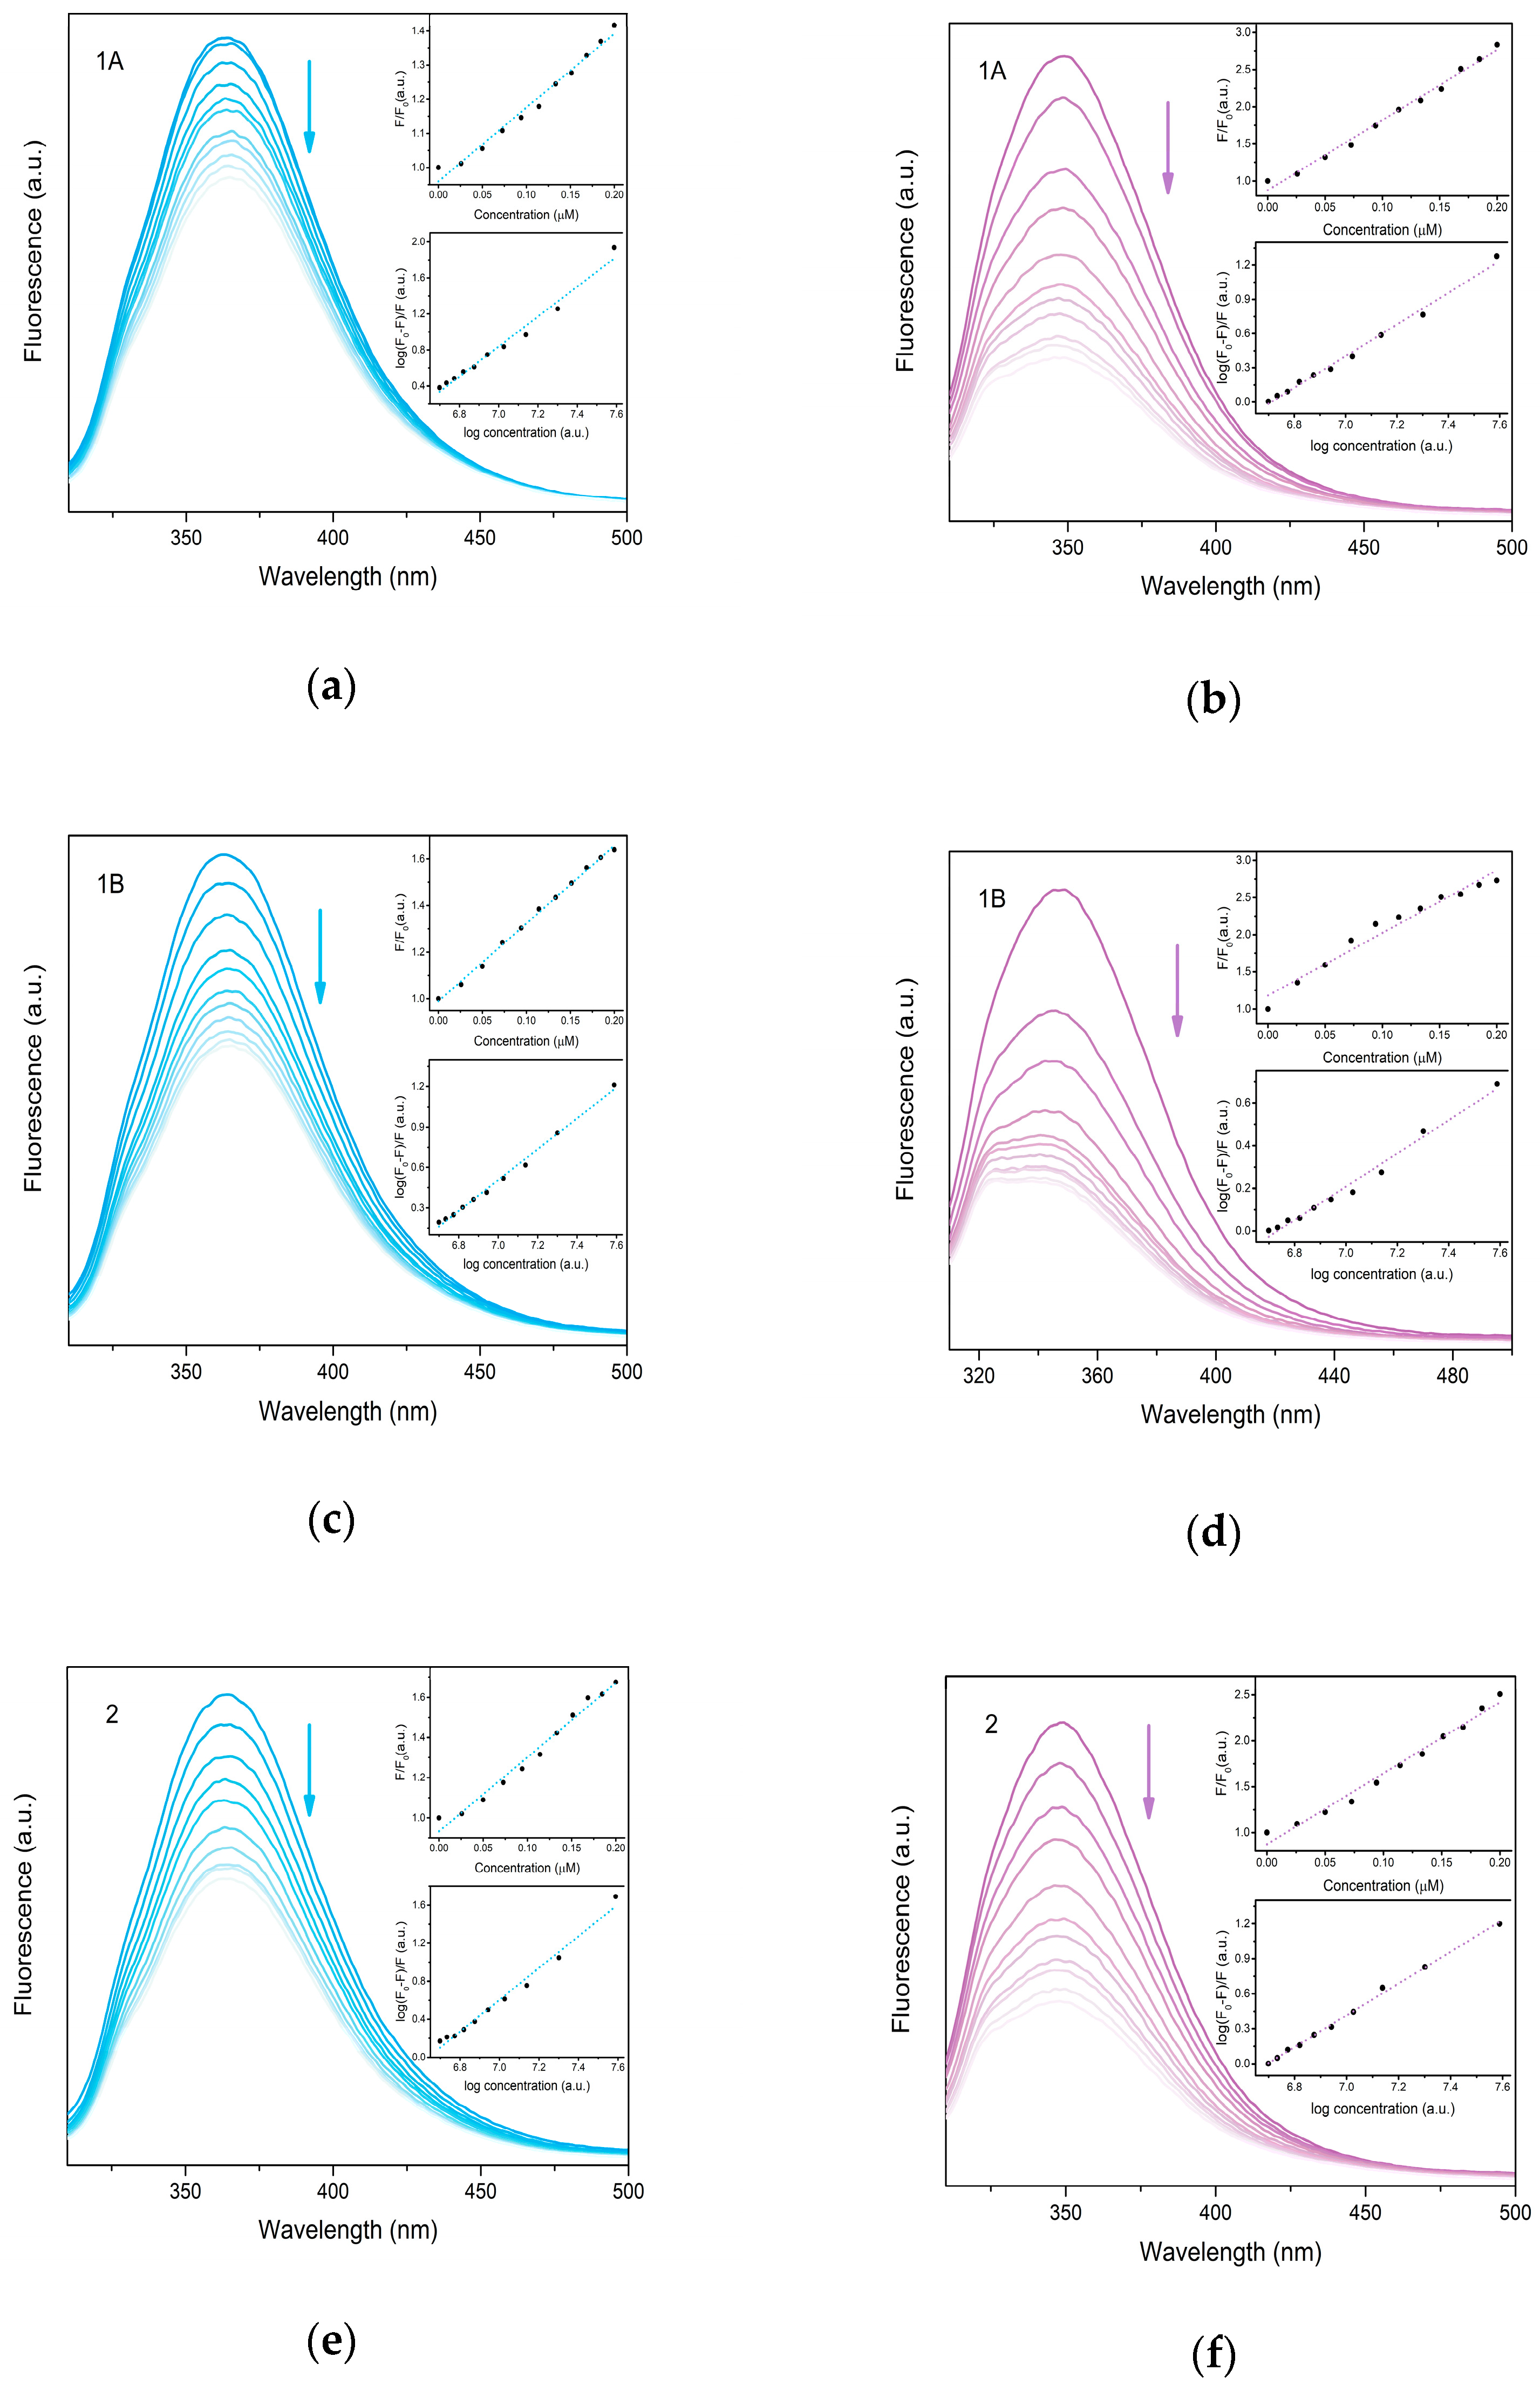
The albumin binding assay is the most frequently used method to determine the possible transport of therapeutic agents. Serum albumins represent the most abundant proteins in plasma responsible for the reversible binding of various compounds including drugs and their transport through the bloodstream to the target tissues. Human serum albumin (HSA) and bovine serum albumin (BSA) solutions exhibit an intense fluorescence emission when excited at 295 nm, due to the tryptophan residues (HSA—Trp-214, BSA—Trp-134 and Trp-212) [27]. The significant quenching of the emission maxima is observed upon the gradual addition of prepared complexes to HSA and BSA, respectively, which may be caused by the possible changes in the protein secondary structure due to non-covalent interactions of complexes with the tryptophan site residue. The enhanced BSA fluorescence quenching may be caused by the presence of two tryptophan sites in BSA instead of the only one tryptophan site present in HSA. The strength of the interactions with albumins was determined by Stern–Volmer quenching equations. The Stern–Volmer plots (Figure 9) have a linear character indicating a single quenching mechanism. The calculated KSV constants indicate the considerable strength of binding with slightly higher values calculated for BSA. The values of association binding constants (Kb) are generally high, suggesting a strong binding affinity and stable binding of complexes with albumins. The higher values of Kb as well as number of binding sites (n) observed for BSA indicate the possible binding to both tryptophan sites.
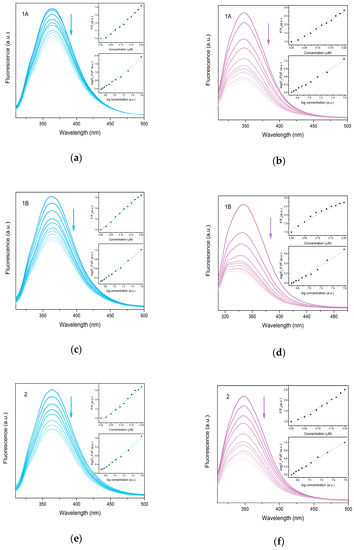
Figure 9.
Fluorescence emission plots of HSA (blue) and BSA (violet) upon gradual addition of 1A (a,b), 1B (c,d) and 2 (e,f) in the concentration range 0–0.2 μM (indicated by arrow). Insets show Stern-Volmer plots used for calculation of binding constants.
The comparison of prepared complexes clearly revealed opposite trends for HSA and BSA; 1A and 1B exhibit higher values of binding constants and the number of binding sites for BSA, whereas 2 displays higher values for HSA. The similarity of observed values of two polymorphs (1A and 1B) suggests similar structure disposition of both complexes in the solution. Generally, the suggested optimal range for binding constants of common drugs is considered to be 102–108 M−1 for HSA with higher values reported for BSA for KSV and 104 to 106 M−1 for Kb, respectively [5,7,40,43,44]. As shown in Table 4, the KSV values for the prepared complexes fall in this range, however, the values of Kb for 1A and 1B are significantly higher, thus suggesting stronger binding with albumins, and hence, a potentially lower availability for release.
Table 4.
Stern–Volmer (KSV) and binding (Kb) constants of studied complexes for HSA and BSA calculated from fluorescence quenching experiments.
4. Conclusions
In summary, presented work contributes to the study of the mixed-ligand Zn(II) complexes containing three different ligands: carboxylato, bidentate N,N′-donor ligand and a chlorido ligand. While the mixed-ligand complexes that employ different types of ligands are not yet widely studied, they could outperform the more common binary or ternary complexes in terms of their biological activity and multi-targeting character.
Interestingly, two structural polymorphs of the [ZnCl(flu)(neo)] complex were prepared by the same synthetic procedure and isolated from the same solution, thus directly illustrating the variability of carboxylate binding and subsequently crystal packing motifs formed in solid-state. Although it was not possible to conclusively prove that the different molecular structure of complexes 1A and 1B can be retained in solution, DNA and albumin binding experiments have revealed subtle differences. The binding studies also unraveled potential biological activity of the studied complexes, which could provide a basis for further in vitro cell cytotoxicity studies.
Supplementary Materials
The following supporting information can be downloaded at: https://www.mdpi.com/article/10.3390/cryst13101460/s1, Table S1: Selected bond lengths and angles (A, °) for prepared similar complexes [ZnCl(L1)(L2)]; Table S2: Possible intermolecular hydrogen bonding interactions (A, °) for the prepared complexes; Table S3: Selected intermolecular π⋯π interactions (A, °) for the prepared complexes; Figure S1: Solid-state FTIR spectra of the prepared complexes; Figure S2: UV-Vis spectra of 10 μM dmso solutions of the prepared complexes.
Author Contributions
Conceptualization, R.S. and L.S.; methodology, R.S., L.S. and E.S.; validation, E.S.; formal analysis, R.S.; investigation, R.S., L.S., M.P. and E.S.; resources, R.S. and L.S.; writing—original draft preparation, R.S. and L.S.; writing—review and editing, L.S.; visualization, R.S.; supervision, L.S.; project administration, R.S.; funding acquisition, R.S. All authors have read and agreed to the published version of the manuscript.
Funding
This research was funded by VEGA 1/0126/23 and internal grant of the P. J. Šafárik University in Košice VVGS-2022-2191. Crystallographic experiments were performed in MGML (mgml.eu), which is supported within the program of Czech Research Infrastructures (project no. LM2023065).
Data Availability Statement
Crystallographic supplementary data (.cif files) can be received at no charge from the website https://www.ccdc.cam.ac.uk/structures/ (accessed on 1 October 2023).
Acknowledgments
L.S. is thankful to M.W. Pakuła and P. Osowska for their participation and help in the DNA and albumin binding experiments.
Conflicts of Interest
The authors declare no conflict of interest.
References
- Krężel, A.; Maret, W. The biological inorganic chemistry of zinc ions. Arch. Biochem. Biophys. 2016, 611, 3–19. [Google Scholar] [CrossRef]
- Lakshman, T.R.; Deb, J.; Paine, T.K. Anti-inflammatory activity and enhanced COX-2 selectivity of nitric oxide-donating zinc(ii)-NSAID complexes. Dalton Trans. 2016, 45, 14053–14057. [Google Scholar] [CrossRef]
- Sharma, J.; Singla, A.K.; Dhawan, S. Zinc-naproxen complex: Synthesis, physicochemical and biological evaluation. Int. J. Pharm. 2003, 260, 217–227. [Google Scholar] [CrossRef]
- Santos, A.C.F.; Monteiro, L.P.G.; Gomes, A.C.C.; Martel, F.; Santos, T.M.; Ferreira, B.J.M.L. NSAID-Based Coordination Compounds for Biomedical Applications: Recent Advances and Developments. Int. J. Mol. Sci. 2022, 23, 2855. [Google Scholar] [CrossRef]
- Smolková, R.; Zeleňák, V.; Gyepes, R.; Hudecová, D. Biological Activity of Two Novel Zinc(II) Complexes with NSAID Mefenamic Acid. Chem. Pap. 2019, 74, 1525–1540. [Google Scholar] [CrossRef]
- Smolková, R.; Zeleňák, V.; Gyepes, R.; Sabolová, D.; Imrichová, N.; Hudecová, D.; Smolko, L. Synthesis, Characterization, DNA Binding, Topoisomerase I Inhibition and Antimicrobial Activity of Four Novel Zinc(II) Fenamates. Polyhedron 2018, 141, 230–238. [Google Scholar] [CrossRef]
- Smolková, R.; Zeleňák, V.; Smolko, L.; Sabolová, D.; Kuchár, J.; Gyepes, R. Novel Zn(II) Complexes with Non-Steroidal Anti-Inflammatory Ligand, Flufenamic Acid: Characterization, Topoisomerase I Inhibition Activity, DNA and HSA Binding Studies. J. Inorg. Biochem. 2017, 177, 143–158. [Google Scholar] [CrossRef]
- Psomas, G. Copper(II) and Zinc(II) Coordination Compounds of Non-Steroidal Anti-Inflammatory Drugs: Structural Features and Antioxidant Activity. Coord. Chem. Rev. 2020, 412, 213259. [Google Scholar] [CrossRef]
- Lakshman, T.R.; Deb, J.; Ghosh, I.; Sarkar, S.; Paine, T.K. Combining Anti-Inflammatory and Anti-Proliferative Activities in Ternary Metal-NSAID Complexes of a Polypyridylamine Ligand. Inorg. Chim. Acta 2019, 486, 663–668. [Google Scholar] [CrossRef]
- Deb, J.; Lakshman, T.R.; Ghosh, I.; Jana, S.S.; Paine, T.K. Mechanistic Studies of in Vitro Anti-Proliferative and Anti-Inflammatory Activities of the Zn(ii)–NSAID Complexes of 1,10-Phenanthroline-5,6-Dione in MDA-MB-231 Cells. Dalton Trans. 2020, 49, 11375–11384. [Google Scholar] [CrossRef]
- Graham, G.G. Fenamates. In Compendium of Inflammatory Diseases; Springer: Basel, Switzerland, 2016; pp. 477–482. [Google Scholar] [CrossRef]
- Greenhough, A.; Smartt, H.J.M.; Moore, A.E.; Roberts, H.R.; Williams, A.C.; Paraskeva, C.; Kaidi, A. The COX-2/PGE2 Pathway: Key Roles in the Hallmarks of Cancer and Adaptation to the Tumour Microenvironment. Carcinog. 2009, 30, 377–386. [Google Scholar] [CrossRef]
- Zappavigna, S.; Cossu, A.M.; Grimaldi, A.; Bocchetti, M.; Ferraro, G.A.; Nicoletti, G.F.; Filosa, R.; Caraglia, M. Anti-Inflammatory Drugs as Anticancer Agents. Int. J. Mol. Sci. 2020, 21, 2605. [Google Scholar] [CrossRef]
- Porchia, M.; Pellei, M.; Del Bello, F.; Santini, C. Zinc Complexes with Nitrogen Donor Ligands as Anticancer Agents. Molecules 2020, 25, 5814. [Google Scholar] [CrossRef]
- Karges, J.; Stokes, R.W.; Cohen, S.M. Metal Complexes for Therapeutic Applications. Trends Chem. 2021, 3, 523–534. [Google Scholar] [CrossRef]
- Renfrew, A.K. Transition Metal Complexes with Bioactive Ligands: Mechanisms for Selective Ligand Release and Applications for Drug Delivery. Metallomics 2014, 6, 1324–1335. [Google Scholar] [CrossRef]
- Groom, C.R.; Bruno, I.J.; Lightfoot, M.P.; Ward, S.C. The Cambridge Structural Database. Acta Crystallog. B Struct. Sci. Cryst. Eng. Mater. 2016, 72, 171–179. [Google Scholar] [CrossRef]
- Oxford Diffraction, CrysAlis PRO, Version 1.171.38.43; Oxford Diffraction Ltd., Yarnton, Oxfordshire: Oxford, UK, 2015.
- Sheldrick, G.M. Crystal Structure Refinement with SHELXL. Acta Crystallogr. C Struct. Chem. 2015, 71, 3–8. [Google Scholar] [CrossRef]
- Petříček, V.; Palatinus, L.; Plášil, J.; Dušek, M. Jana2020—A New Version of the Crystallographic Computing System Jana. Z. Krist—Cryst. Mater. 2023, 238, 271–282. [Google Scholar] [CrossRef]
- Química Inorganica. SHAPE 2.1 Software; Universitat de Barcelona: Barcelona, Spain, 2013. [Google Scholar]
- Spek, A.L. Single-Crystal Structure Validation with the ProgramPLATON. J. Appl. Crystallogr. 2003, 36, 7–13. [Google Scholar] [CrossRef]
- DIAMOND, Version 3.2 k; Crystal Impact GbR: Bonn, Germany, 2014.
- Spackman, P.R.; Turner, M.J.; McKinnon, J.J.; Wolff, S.K.; Grimwood, D.J.; Jayatilaka, D.; Spackman, M.A. CrystalExplorer: A Program for Hirshfeld Surface Analysis, Visualization and Quantitative Analysis of Molecular Crystals. J. Appl. Crystallogr. 2021, 54, 1006–1011. [Google Scholar] [CrossRef]
- Galindo-Murillo, R.; Cheatham, T.E., III. Ethidium Bromide Interactions with DNA: An Exploration of a Classic DNA–Ligand Complex with Unbiased Molecular Dynamics Simulations. Nucleic Acids Res. 2021, 49, 3735–3747. [Google Scholar] [CrossRef]
- The IUPAC Compendium of Chemical Terminology; Royal Society of Chemistry: Cambridge, UK, 2019. [CrossRef]
- Lakowicz, J.R. Principles of Fluorescence Spectroscopy, 3rd ed.; Springer: Boston, MA, USA, 2006; ISBN 978-0-387-31278-1. [Google Scholar]
- Preston, H.S.; Kennard, C.H.L. Stereochemistry of Rigid Chelate–Metal Complexes. Part I. The Crystal Structure of Dichloro-(2,9-Dimethyl-1,10-Phenanthroline)Zinc(II). J. Chem. Soc. A 1969, 1969, 1956–1961. [Google Scholar] [CrossRef]
- Muranishi, Y.; Wang, Y.; Odoko, M.; Okabe, N. (2,2′-Biquinoline-κ2N,N′)Dichloropalladium(II), -Copper(II) and -Zinc(II). Acta Crystallogr. C 2005, 61, m307–m310. [Google Scholar] [CrossRef]
- Tarushi, A.; Raptopoulou, C.P.; Psycharis, V.; Kessissoglou, D.P.; Papadopoulos, A.N.; Psomas, G. Interaction of Zinc(II) with the Non-Steroidal Anti-Inflammatory Drug Niflumic Acid. J. Inorg. Biochem. 2017, 176, 100–112. [Google Scholar] [CrossRef]
- Li, P.; Maier, J.M.; Vik, E.C.; Yehl, C.J.; Dial, B.E.; Rickher, A.E.; Smith, M.D.; Pellechia, P.J.; Shimizu, K.D. Stabilizing Fluorine–π Interactions. Angew. Chem. Int. Ed. 2017, 56, 7209–7212. [Google Scholar] [CrossRef]
- Panigrahi, S.K.; Desiraju, G.R. Strong and Weak Hydrogen Bonds in Drug-DNA Complexes: A Statistical Analysis. J. Biosciences 2007, 32, 677–691. [Google Scholar] [CrossRef]
- Pietruś, W.; Kafel, R.; Bojarski, A.J.; Kurczab, R. Hydrogen Bonds with Fluorine in Ligand–Protein Complexes-the PDB Analysis and Energy Calculations. Molecules 2022, 27, 1005. [Google Scholar] [CrossRef]
- Tarushi, A.; Totta, X.; Raptopoulou, C.P.; Psycharis, V.; Psomas, G.; Kessissoglou, D.P. Structural Features of Mono- and Tri-Nuclear Zn(Ii) Complexes with a Non-Steroidal Anti-Inflammatory Drug as Ligand. Dalton Trans. 2012, 41, 7082. [Google Scholar] [CrossRef]
- Hadjiivanov, K.I.; Panayotov, D.A.; Mihaylov, M.Y.; Ivanova, E.Z.; Chakarova, K.K.; Andonova, S.M.; Drenchev, N.L. Power of Infrared and Raman Spectroscopies to Characterize Metal-Organic Frameworks and Investigate Their Interaction with Guest Molecules. Chem. Rev. 2020, 121, 1286–1424. [Google Scholar] [CrossRef]
- Feng, J.; Su, B.; Yi, X.; Kong, Z.; Chang, L. Two New Zinc(Ii) Coordination Complexes Constructed by Phenanthroline Derivate: Synthesis and Structure. Main. Group. Met. Chem. 2023, 46, 20228042. [Google Scholar] [CrossRef]
- Diana, R.; Panunzi, B. The Role of Zinc(II) Ion in Fluorescence Tuning of Tridentate Pincers: A Review. Molecules 2020, 25, 4984. [Google Scholar] [CrossRef]
- Smolko, L.; Špaková, I.; Klepcová, Z.; Dubayová, K.; Samoľová, E.; Rabajdová, M.; Mareková, M. Zinc(II) Niflumato Complex with Neocuproine: Synthesis, Crystal Structure, Characterization and Cytotoxic Effects on Human Endometrial Cell Lines. J. Mol. Struct. 2021, 1237, 130312. [Google Scholar] [CrossRef]
- Tian, G.; Han, Y.-Z.; Yang, Q. 1, 10-Phenanthroline Derivative as Colorimetric and Ratiometric Fluorescence Probe for Zn2+ and Cd2+. Results Chem. 2023, 5, 100899. [Google Scholar] [CrossRef]
- Smolková, R.; Smolko, L.; Zeleňák, V.; Kuchár, J.; Gyepes, R.; Talian, I.; Sabo, J.; Biščáková, Z.; Rabajdová, M. Impact of the Central Atom on Human Genomic DNA and Human Serum Albumin Binding Properties in Analogous Zn(II) and Cd(II) Complexes with Mefenamic Acid. J. Mol. Struct. 2019, 1188, 42–50. [Google Scholar] [CrossRef]
- Tarushi, A.; Karaflou, Z.; Kljun, J.; Turel, I.; Psomas, G.; Papadopoulos, A.N.; Kessissoglou, D.P. Antioxidant Capacity and DNA-Interaction Studies of Zinc Complexes with a Non-Steroidal Anti-Inflammatory Drug, Mefenamic Acid. J. Inorg. Biochem. 2013, 128, 85–96. [Google Scholar] [CrossRef]
- Tarushi, A.; Kastanias, P.; Raptopoulou, C.P.; Psycharis, V.; Kessissoglou, D.P.; Papadopoulos, A.N.; Psomas, G. Zinc Complexes of Flufenamic Acid: Characterization and Biological Evaluation. J. Inorg. Biochem. 2016, 163, 332–345. [Google Scholar] [CrossRef]
- Zheng, X.; Li, Z.; Podariu, M.I.; Hage, D.S. Determination of Rate Constants and Equilibrium Constants for Solution-Phase Drug–Protein Interactions by Ultrafast Affinity Extraction. Anal. Chem. 2014, 86, 6454–6460. [Google Scholar] [CrossRef]
- Varshney, A.; Sen, P.; Ahmad, E.; Rehan, M.; Subbarao, N.; Khan, R.H. Ligand Binding Strategies of Human Serum Albumin: How Can the Cargo Be Utilized? Chirality 2010, 22, 77–87. [Google Scholar] [CrossRef]

Disclaimer/Publisher’s Note: The statements, opinions and data contained in all publications are solely those of the individual author(s) and contributor(s) and not of MDPI and/or the editor(s). MDPI and/or the editor(s) disclaim responsibility for any injury to people or property resulting from any ideas, methods, instructions or products referred to in the content. |
© 2023 by the authors. Licensee MDPI, Basel, Switzerland. This article is an open access article distributed under the terms and conditions of the Creative Commons Attribution (CC BY) license (https://creativecommons.org/licenses/by/4.0/).