Communication

A Machine Learning Approach for Segmentation and Characterization of Microtextured Regions in a Near-α Titanium Alloy

1
School of Materials Science and Engineering, Northwestern Polytechnical University, Xi’an 710072, China
2
Jiangsu Longda Superalloy Material Company Limited, Wuxi 214105, China
*
Author to whom correspondence should be addressed.
Crystals 2023, 13(10), 1422; https://doi.org/10.3390/cryst13101422
Submission received: 28 August 2023 / Revised: 14 September 2023 / Accepted: 19 September 2023 / Published: 25 September 2023
(This article belongs to the Special Issue Microstructure and Deformation of Advanced Alloys)

Abstract

:
The development of automated segmentation and quantitative characterization of microtextured regions (MTRs) from the complex heterogeneous microstructures is urgently needed, since MTRs have been proven to be the critical issue that dominates the dwell-fatigue performance of aerospace components. In addition, MTRs in Ti alloys have similarities to microstructures encountered in other materials, including minerals and biomaterials. Meanwhile, machine learning (ML) offers new opportunities. This paper addresses segmentation and quantitative characterization of MTRs, where an ML approach, the Gaussian mixture models (GMMs) coupled with density-based spatial clustering of applications with noise (DBSCAN) clustering algorithms, was employed in order to process the orientation data acquired via EBSD in the Matlab environment. Pixels with orientation information acquired through electron backscatter diffraction (EBSD) are divided and colored into several “classes” (MTRs) within the defined c-axis misorientations (i.e., 25°, 20°, 15°, 10°, and 5°), the precision and efficacy of which are verified by the morphology and pole figure of the segmented MTR. An appropriate range of c-axis misorientations for MTR segmentation was derived, i.e., 15~20°. The contribution of this innovative technique is compared with previous studies. At the same time, the MTRs were statistically characterized in the global region.

1. Introduction

A heterogeneous microstructure that consists of microtextured regions (MTRs) in near-α titanium alloys is hard to characterize, but microtextured regions are believed to be the prominent issue determining the dwell-fatigue performance of aerospace components [1,2,3]. MTRs are characterized as regions where the majority of α particles share similar crystallographic orientations, facilitating the nucleation and propagation of dwell-fatigue cracks [4,5,6]. Accordingly, it is essential to correlate the MTRs’ factors (i.e., size, morphology, orientation, etc.) with the dwell-fatigue performance [7]. Therefore, the precise quantitative characterization of MTRs should be developed urgently and has been the primary focus of existing research.
A general and global method for the characterization of microstructures containing MTRs was a rough approach to analyzing MTRs which was applied in the early decades of this area of research [8,9]. This process yields statistical results on the crystallographic orientation for the α phase over the global region, which, however, cannot effectively feature the local MTRs. Therefore, the method of rectangulating the regions with MTRs on the global region was developed to describe and analyze MTRs more precisely [10,11,12]. Germain et al. investigated the formation mechanism of macrozones (i.e., MTRs framed by rectangles) in near-α titanium alloys during the manufacturing process, and various band-like macrozones with different orientations were observed [11]. The developed method was able to characterize the orientation of MTRs, but it cannot identify information about the morphology and size of MTRs. Then, a more precise and detailed solution to segmenting MTRs from the obtained electron backscatter diffraction (EBSD) data was devised, based on inverse pole figure maps [13,14,15]. These studies lacked a clear basis for segmenting MTRs and relied on manual selection of MTRs, which cannot characterize MTRs quantitatively, automatically, and precisely. Additionally, the latest studies have introduced an essential criteria for defining MTRs, where the α particles in an MTR should have their c-axis orientation alignment within a specific angle of ~25°, i.e., the c-axis misorientations of the α particles in an MTR are less than ~25° [16,17]. However, the suitable range of c-axis misorientations for MTR segmentation has not been derived. Machine learning (ML) has demonstrated its capability for heterogeneous image segmentation, but it has yet to make a breakthrough in materials science [18,19,20,21]. Unsupervised ML applied in heterogeneous image segmentation is usually more scalable and adaptable, i.e., Gaussian mixture models (GMMs) coupled with density-based spatial clustering of applications with noise (DBSCAN) clustering algorithms are the common methods that can be adapted and optimized according to defined materialogical criteria (i.e., c-axis misorientations in this case) [22,23,24].
The present study addresses the segmentation and characterization of MTRs in a near-α titanium alloy, where Ti6242 was employed as the object, based on the ML approach using the updated crystallographic criteria cited above. The ML approach, the GMMs coupled with DBSCAN, was employed to process the orientation data acquired by EBSD in a Matlab environment. The effects of segmentation at different c-axis misorientations (i.e., 25°, 20°, 15°, 10°, and 5°) were compared, and an appropriate range of c-axis misorientations for MTR segmentation was determined. The precision of the segmentation technique using the ML approach proposed here is compared with previous studies that segmented manually. Finally, the MTRs were statistically characterized in the global region (i.e., 3 mm × 3 mm).

2. Experiments and Methods

The as-received Ti6242 (Ti-6.02Al-2.11Sn-4.14Zr-2.03Mo-0.12O-0.08Si-0.02Fe) was sampled at the center of a billet. The sampled region was mechanically polished and then electro-polished in a solution (HClO4: C4H9OH: CH3OH = 3:15:32 in volume). EBSD analysis was performed on a section parallel to the rolling direction using the EDAX-TSL, USA, Oxford Nordlys X-max and Oxford Instruments HKL A/S 2007. The step size for the EBSD scan was 2 μm, and the scan performed at a 20 kV accelerating voltage with an inclination angle of 70 degrees.
Then, the data acquired through EBSD were processed for MTR segmentation in the Matlab environment with Matlab software version R2020b, as shown in Figure 1, and the details are described as follows: The crystallographic orientation of each pixel is specified by three Euler Bunge angles φ 1 , Φ , φ 2 . The third Euler, φ 2 , relates only to orientation about the hexagonal crystal c-axis, the direction of which is determined from Euler angles φ 1 and Φ , and the corresponding rotation matrix g relates the crystal reference orientation to the specimen coordinate system:
g = cos φ 1 sin φ 1 cos Φ sin φ 1 sin Φ sin φ 1 cos φ 1 cos Φ cos φ 1 sin Φ 0 sin Φ cos Φ
Then, the input c-axis orientation x can be characterized as:
x = g · C 0
where C 0 is 0 ,   0 ,   1 T , which is parallel to the z-axis of the specimen coordinate system. The x is a standard unit vector typically consistent with a Gaussian mixture distribution. In MTR segmentation, x is employed as the observation vector. The segmented region can be viewed as a single Gaussian model of the same form, with each model being independent of the others. The entire global region is a GMM fused by multiple single Gaussian models of varying weight.
P x | w k , μ k , k = k = 1 K w k f x | μ k , k
where K denotes the number of GMM components and w k is the mixture weight, which indicates the proportion of the single Gaussian model in the mixture model. f x | μ k , k is the distribution of the Gaussian component k , whose function expression is shown in Formula (4):
f x | μ k , k = 1 2 π 3 k e 1 2 x μ k T k 1 x     μ k
where μ k is the mean vector, k is the covariance matrix, and k 1 is the inverse matrix of k . Thus, the GMM is constructed. Thereafter, the DBSCAN clustering algorithm is used for classification under the defined threshold (i.e., c-axis misorientation here), initializing the GMM, and determining the value of K in the GMM as well. The Euclidean distance in DBSCAN between any two neighboring vectors, x i and x j , is given by Formula (5). When defining various c-axis misorientations θ (i.e., 25°, 20°, 15°, 10°, and 5°) and the corresponding critical Euclidean distance D θ (shown in Formula (6)), the number of components in the GMM ( K , i.e., the number of “classes”) can be determined.
D x i , x j = n = 1 3 x i n x j n 2 1 / 2
D θ = 2 sin θ 2
The expectation maximization (EM) algorithm is then used to maximize the likelihood function L w k , μ k , k and estimate the other parameters (i.e., w k , μ k , and k ) in the GMM to obtain the probability that each pixel belongs to each “class”. Eventually, the category with the highest probability is chosen to be the “class” to which the pixel belongs. This process is repeated until all pixels are classified into various “classes”. In other words, pixels in a featured zone with c-axis misorientations within the defined θ were classified as an MTR. Each MTR was then colored and visualized to be distinguished from the others. Consequently, the MTRs were segmented and characterized. The likelihood function is shown in Formula (7).
L w k , μ k , k = ln k = 1 K P x | w k , μ k , k

3. Results and Discussion

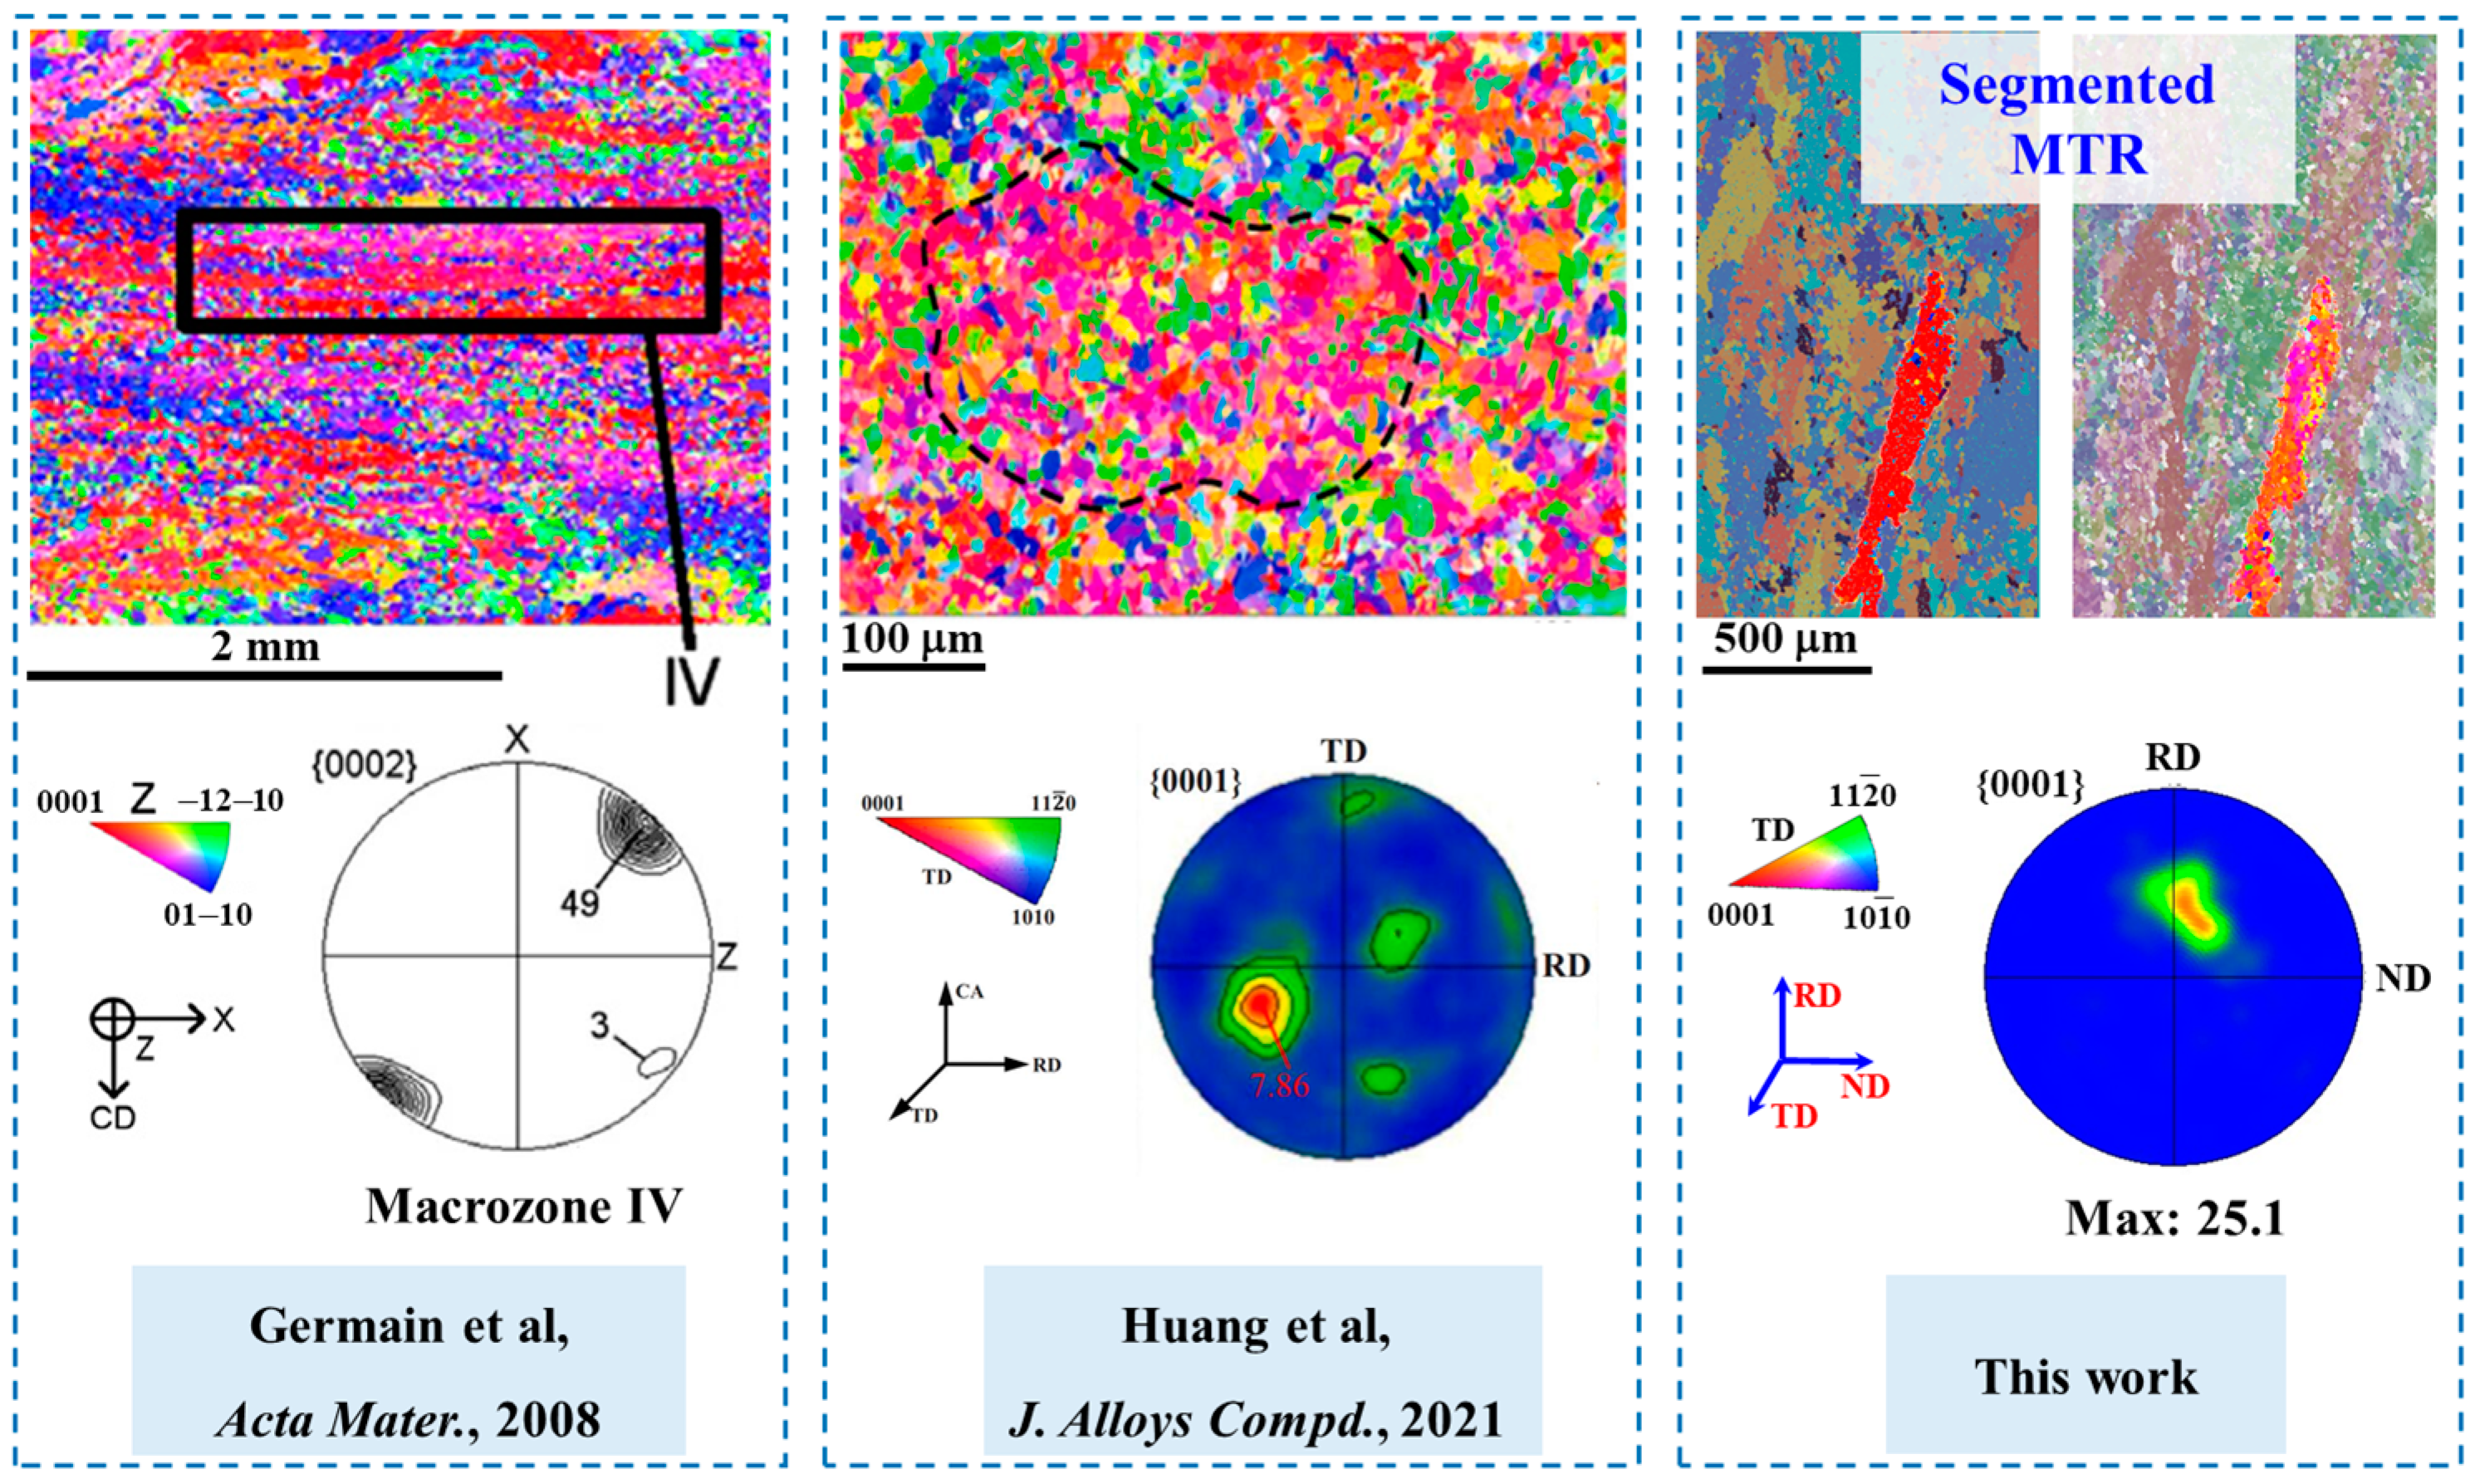
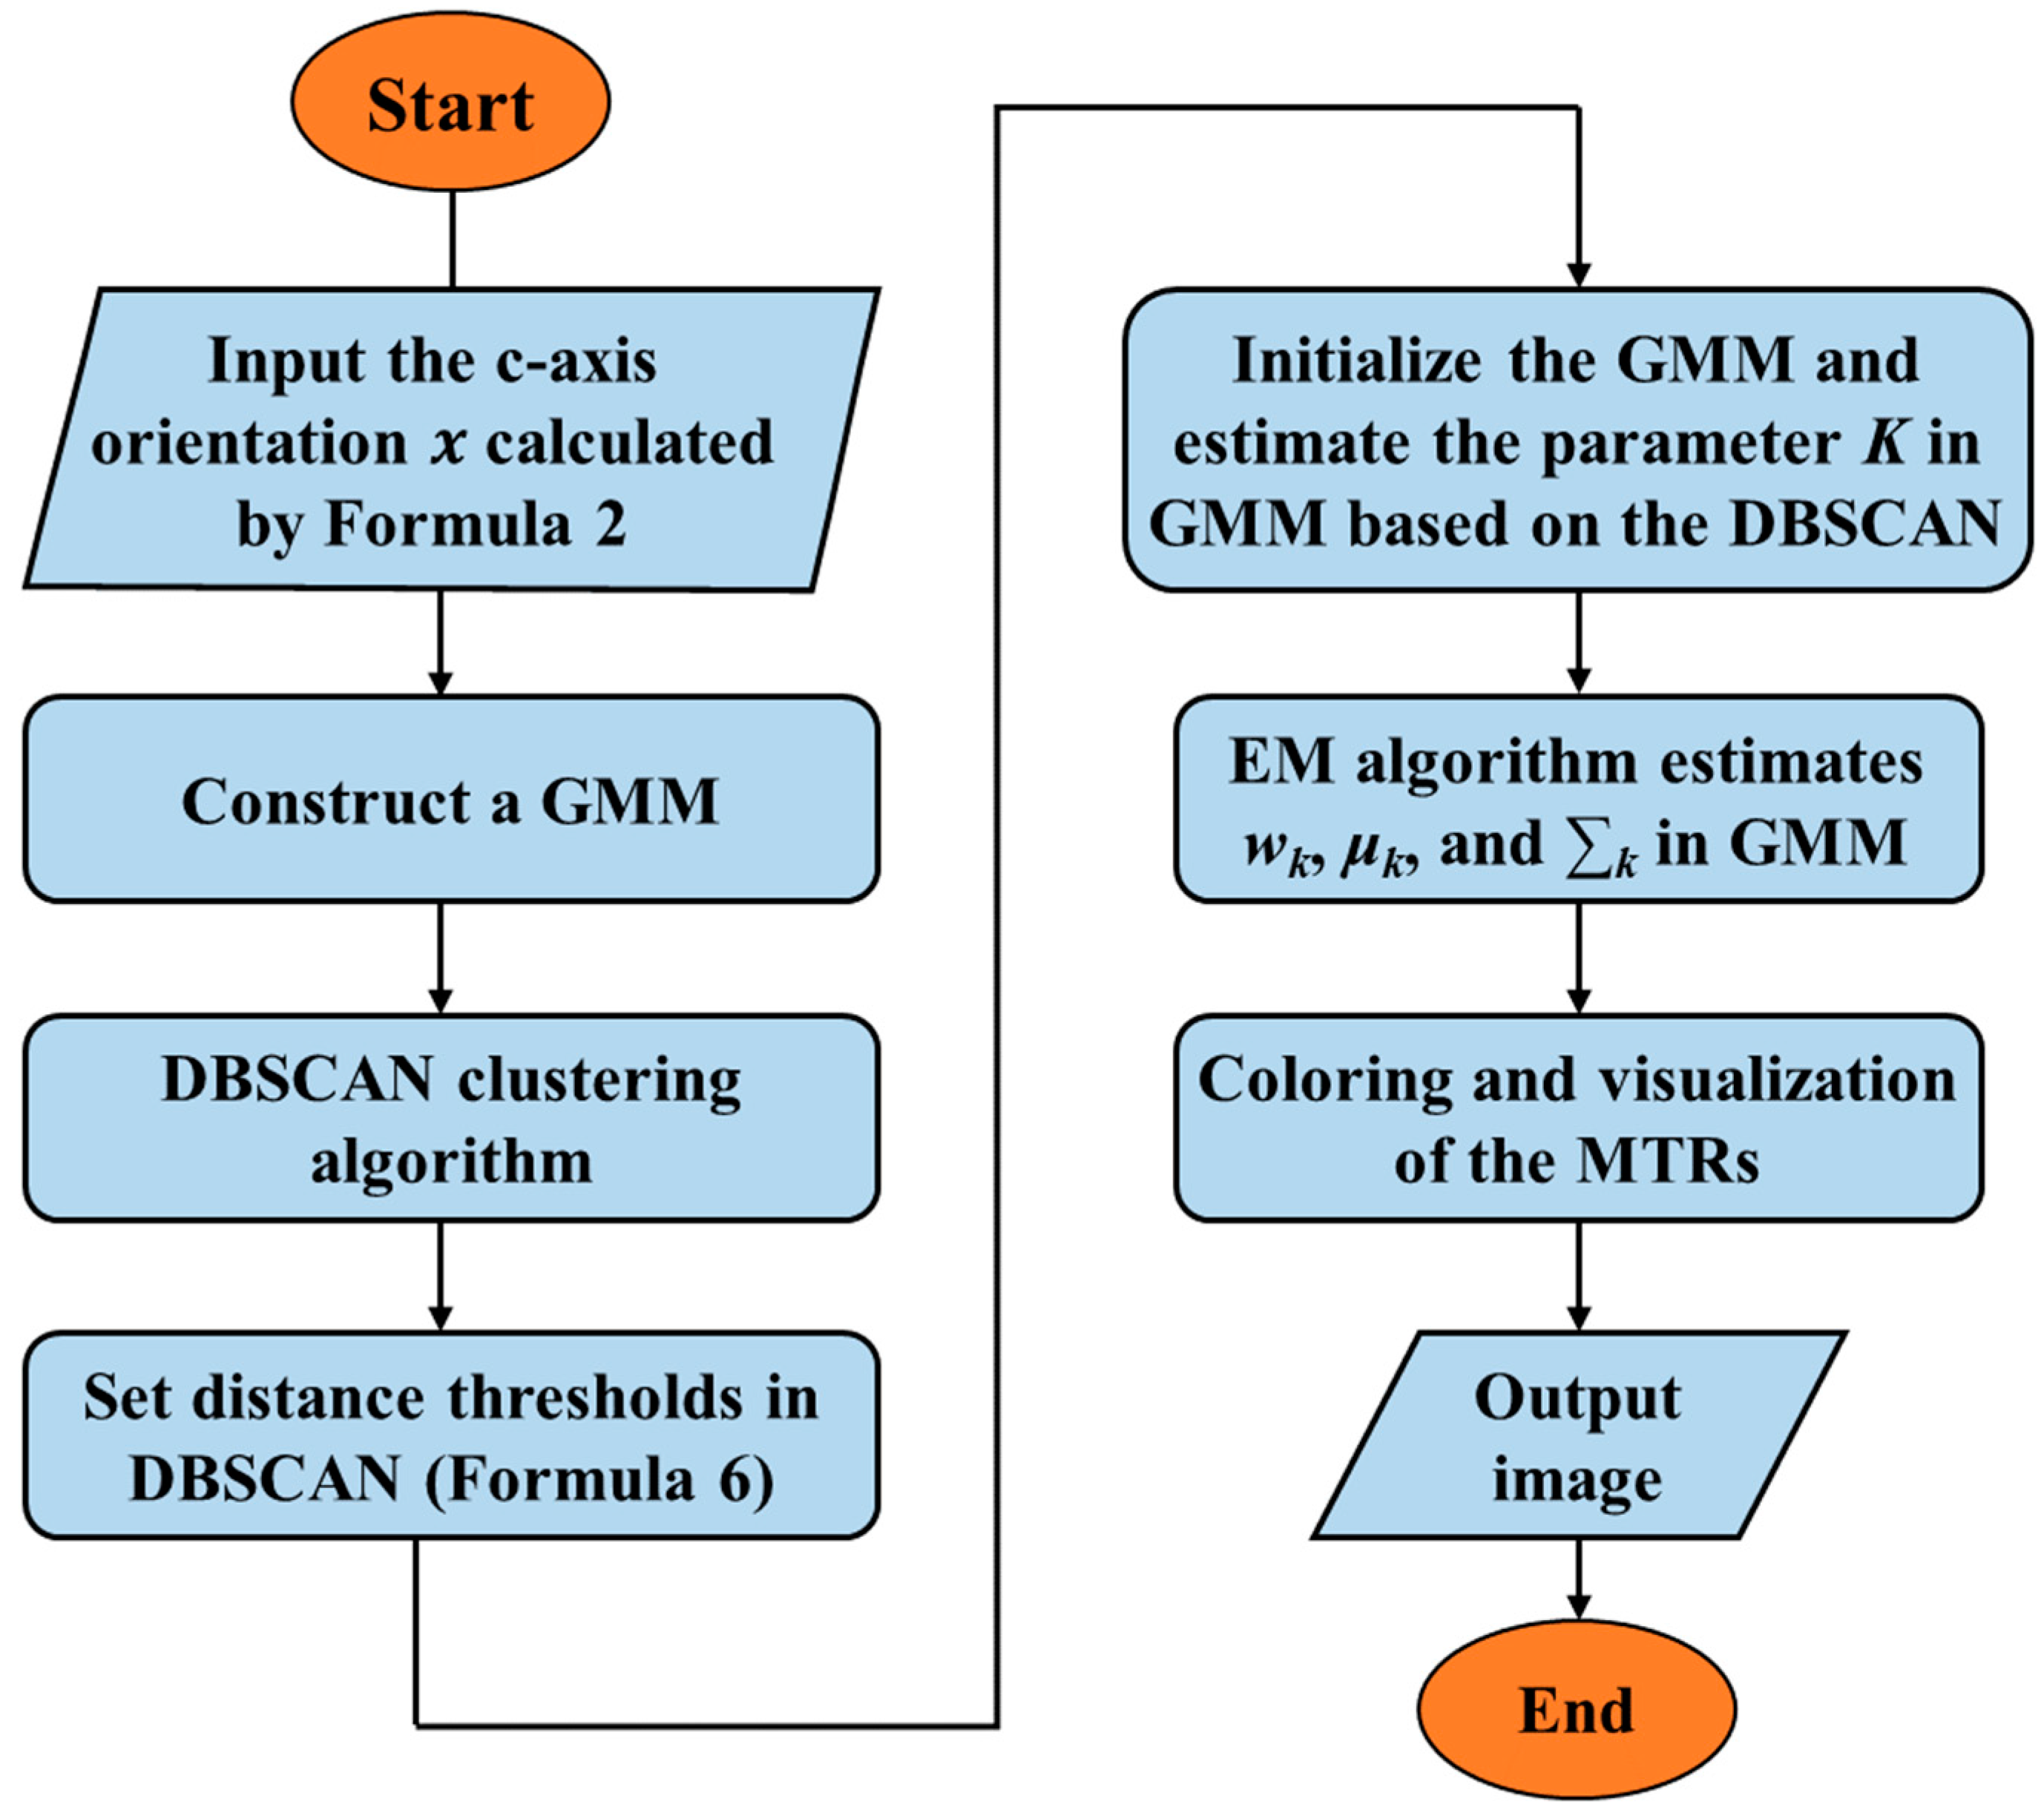
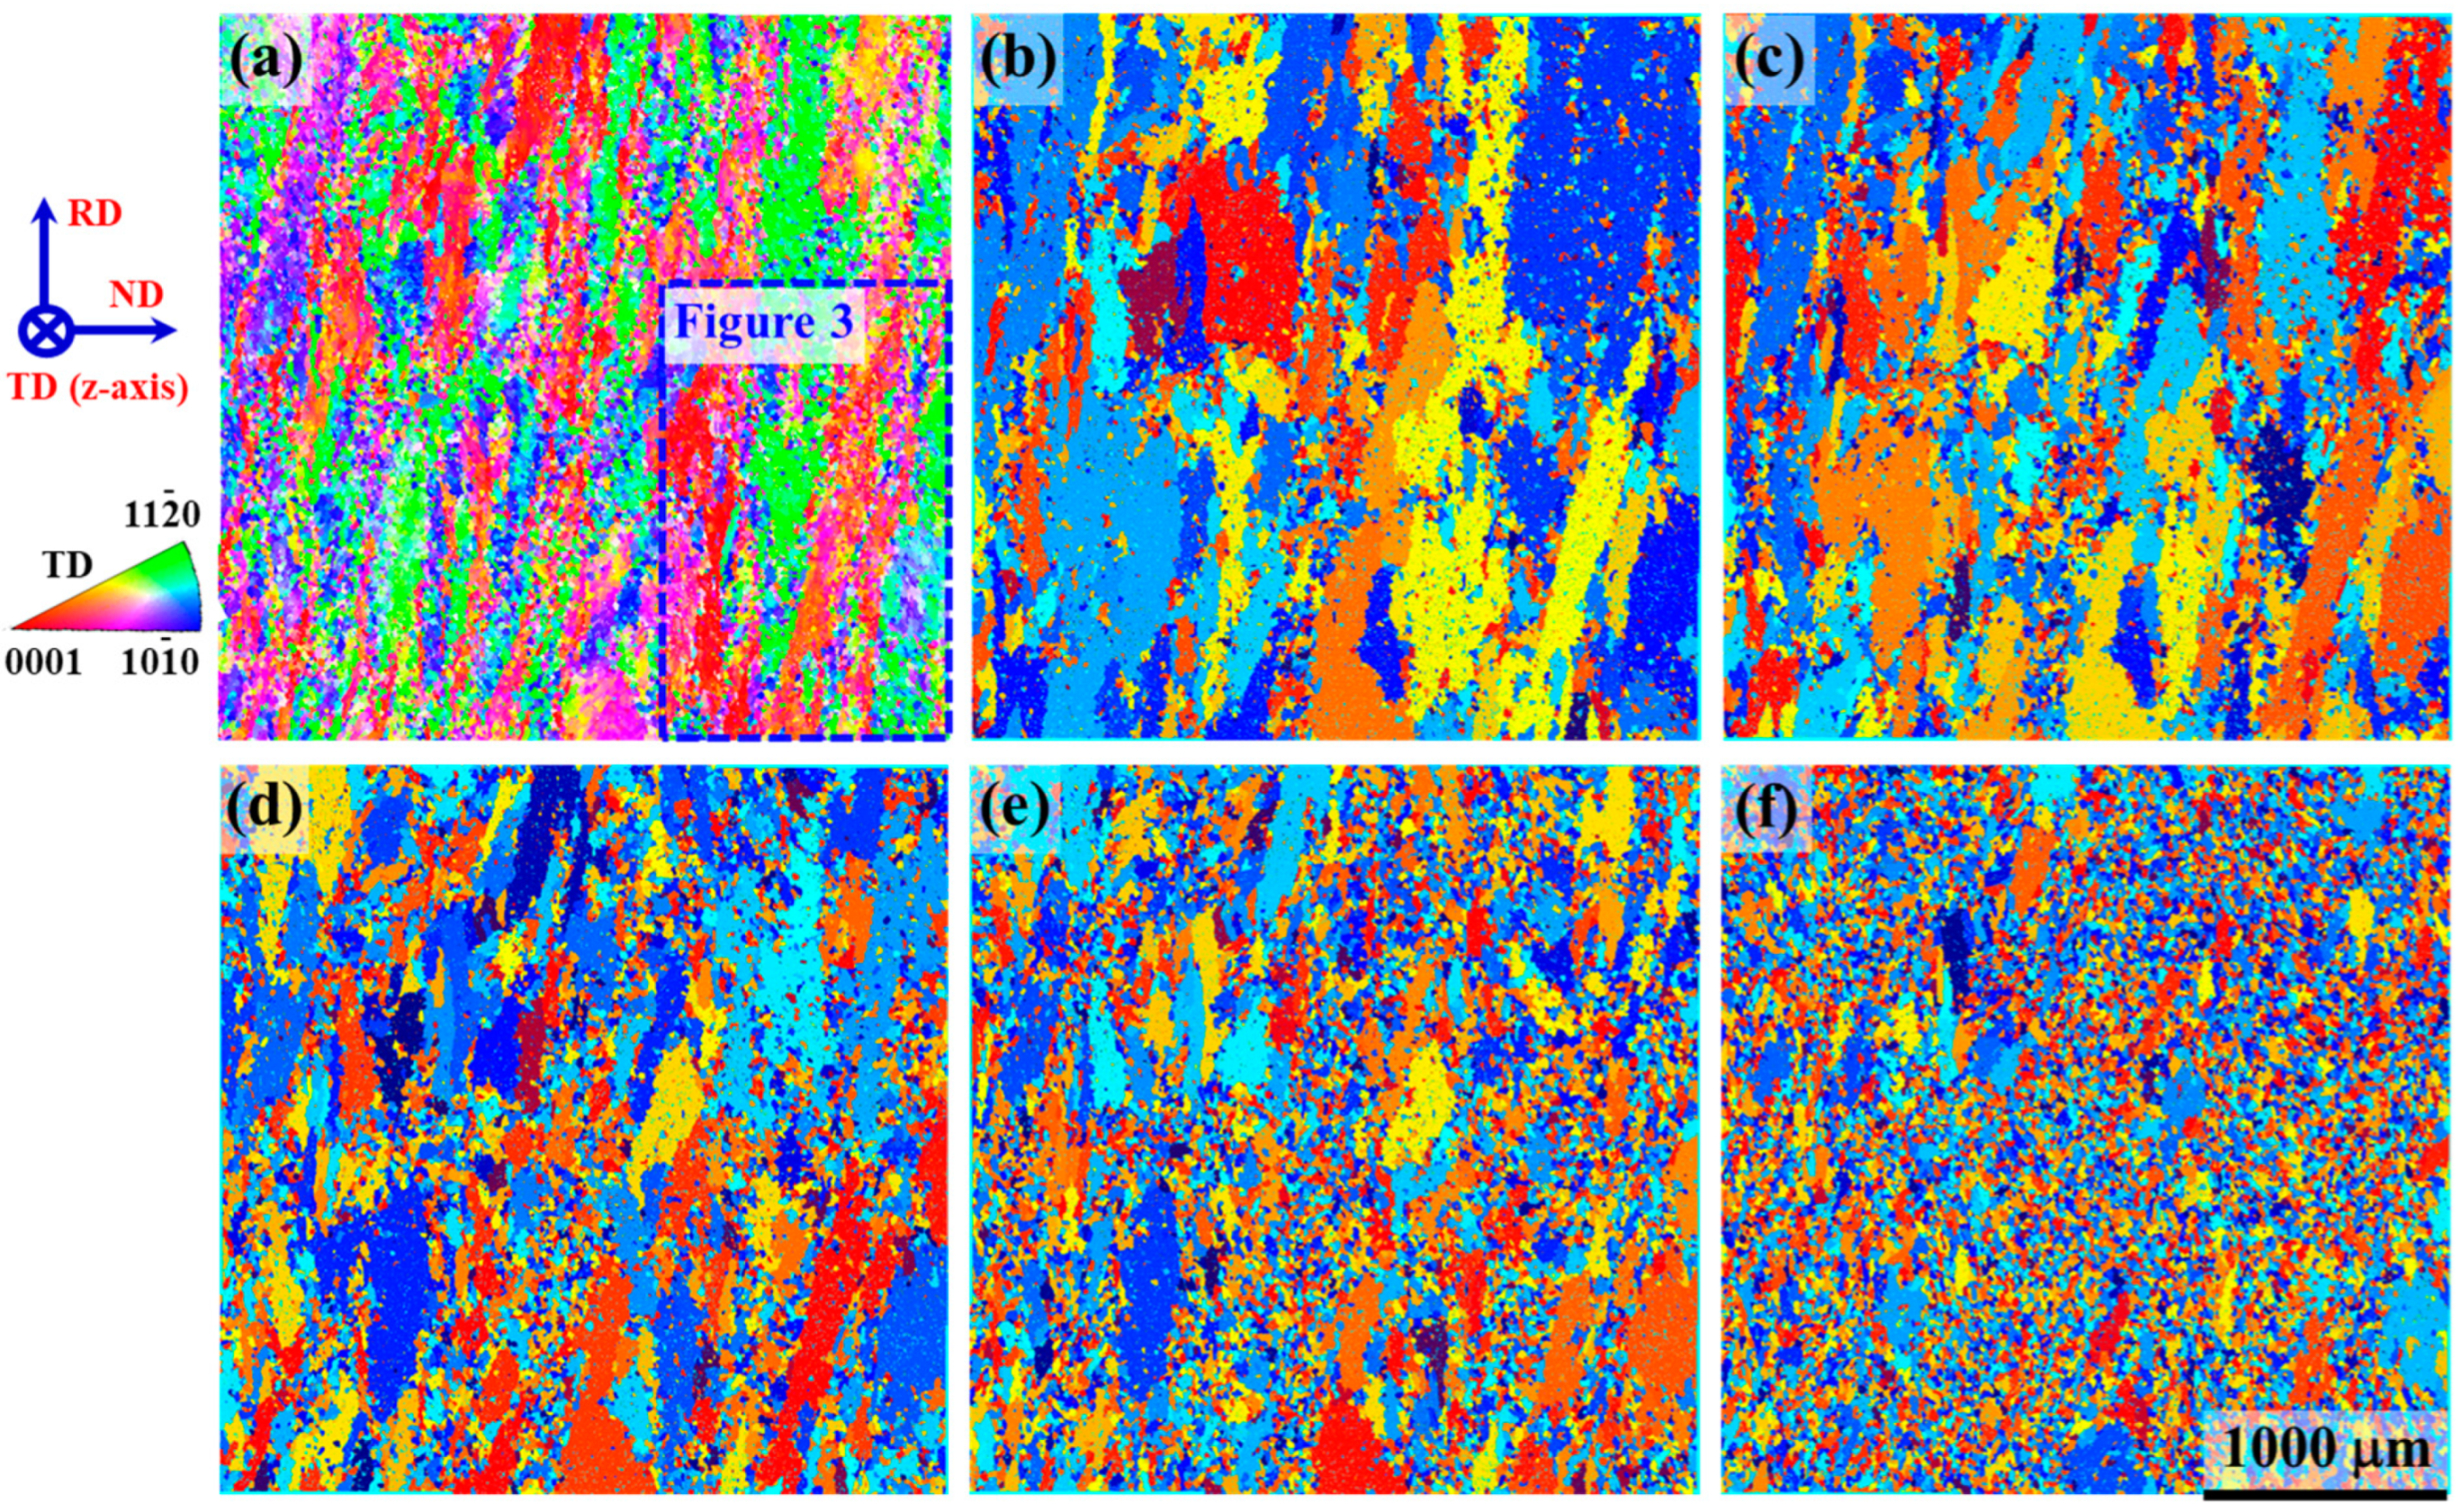
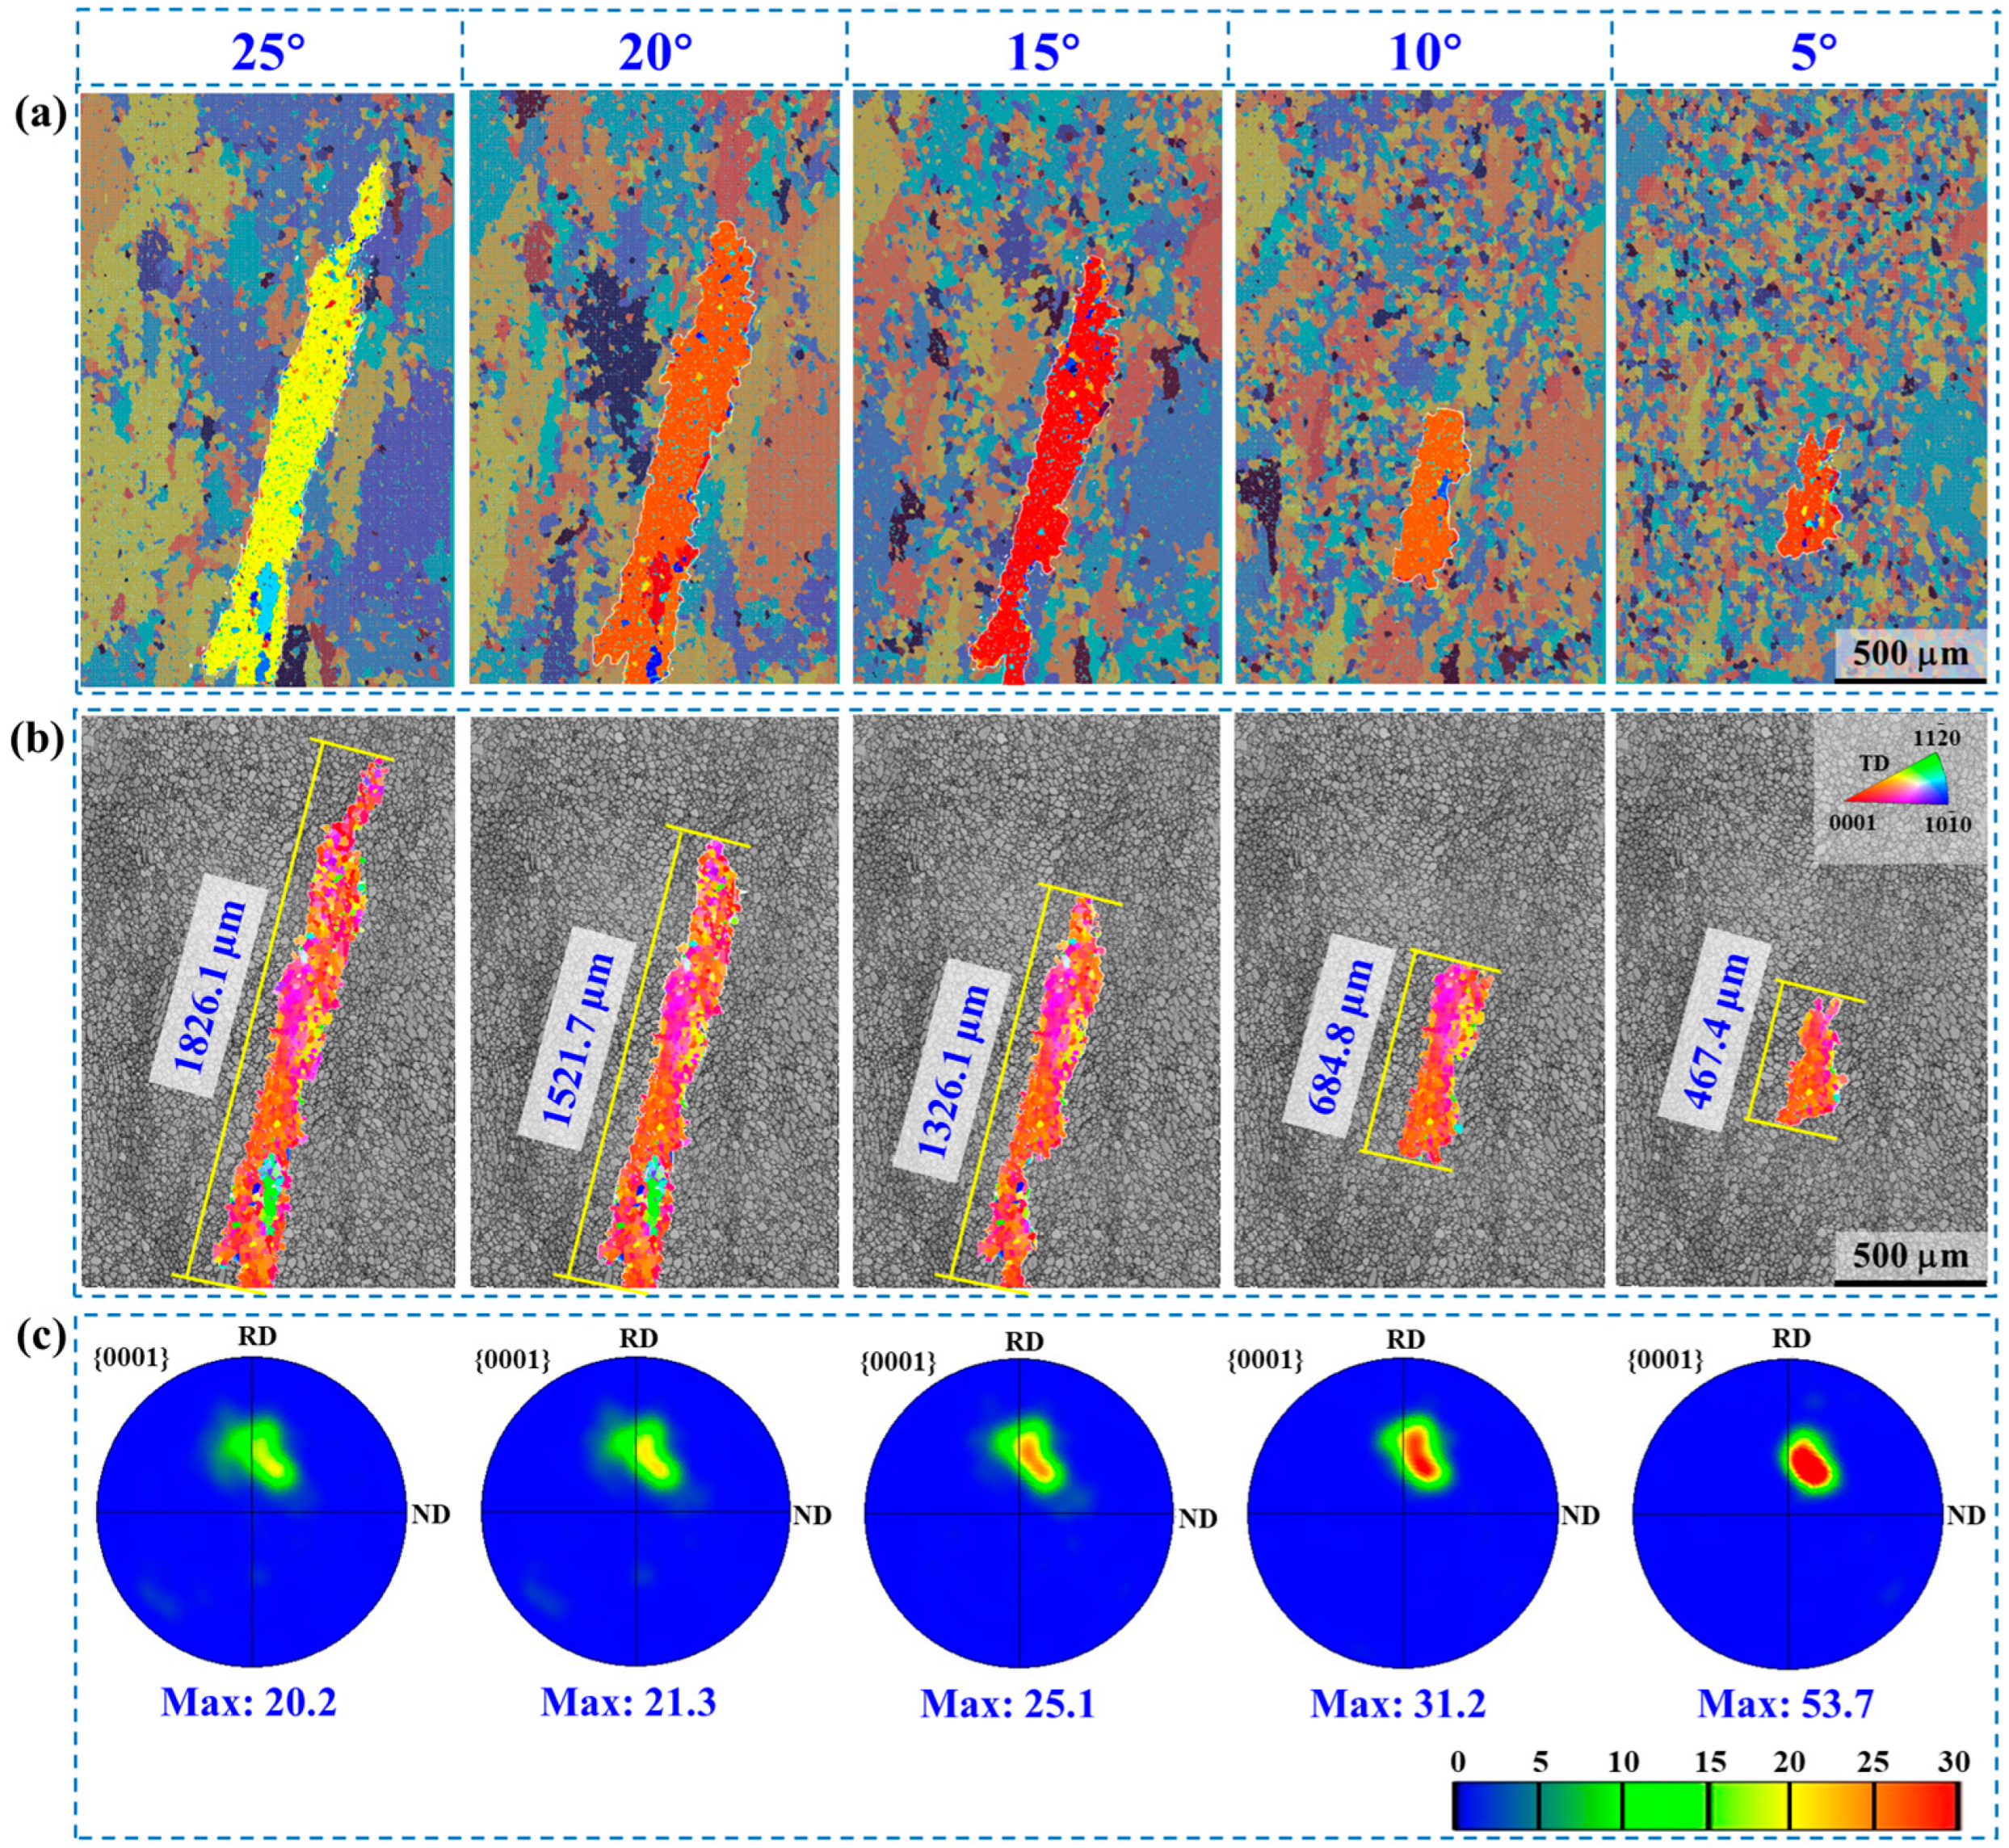
3.1. MTR Segmentation

Figure 2 shows the colored and segmented MTRs of the Ti6242 sample according to the defined c-axis misorientations using the ML approach, where Figure 2a shows the IPF map of MTRs obtained via EBSD and Figure 2b–f depict the segmented MTRs based on the GMMs coupled with DBSCAN within the defined c-axis misorientation, i.e., 25°, 20°, 15°, 10°, and 5°. Figure 2a displays the sampled region with significant band-like MTRs along the RD direction, which are, however, difficult to differentiate and characterize. Figure 2b–f show the segmentation and coloring results of Ti6242 MTRs according to the defined c-axis misorientation. From the segmented results, the morphology of MTRs within the c-axis misorientation of 25° is rough (i.e., Figure 2b); it is too refined within 10° and 5° (i.e., Figure 2e,f), however. The morphology of segmented MTRs within the c-axis misorientations of 20° and 15° shown in Figure 2c,d is appropriate compared with the morphology in Figure 2a. To further compare and quantify the effect of segmentation, as well as to get an effective range of c-axis misorientations for MTR segmentation, a small featured zone, framed by the blue dotted line shown in Figure 3a, was measured in detail.
Figure 3 measures a representative MTR segmented under various c-axis misorientations, where Figure 3a,b show the morphology of the segmented MTR, and Figure 3c presents the pole figures. The results show that when the c-axis misorientation decreases from 25° to 5°, the length (of the long axis) of the MTR decreases from ~1800 μm to ~400 μm. The strength of the microtexture, on the other hand, increases from ~20.2 to ~53.7. As one may have noticed, 15° is a threshold, beyond which (i.e., at 15° or 20°) the length of the MTR and microtexture strength start to vary gently with c-axis misorientations. Therefore, 15~20° could be employed as an appropriate range of c-axis misorientations for MTR segmentation.
The contribution of the segmentation technique using the ML approach here is compared with previous studies, which segmented manually [11,14]. In this study, MTRs were segmented according to the c-axis misorientation (i.e., 15° in Figure 4), where the ML approach, the GMMs coupled with DBSCAN, was employed to process the orientation data acquired via EBSD in the Matlab environment. In terms of the segmentation effect, the MTRs segmented using the ML approach (this work) has a more precise morphology and a clearer boundary. As reflected in the pole figure, a single, strong texture peak of the MTR is obtained in this work, compared with the multiple peaks of various intensities obtained in previous studies [11,14], which conducted the segmentation manually. In summary, the segmentation technique using the ML approach here is more effective.

3.2. Characterization of MTRs

After segmenting the MTRs, statistical characterization of the MTRs’ features (i.e., length, high aspect ratio, and orientation) in Ti6242 was conducted, which will provide essential data when investigating dwell-fatigue [4,5,6,7]. Figure 5a depicts the segmentation of MTRs from the global region, and Figure 5c depicts MTRs with long-axis lengths exceeding 200 μm (approximately 10 average alpha particles) being separated. Figure 5d,e show the statistical results of the length and high aspect ratio of the MTRs presented in Figure 5c, where the mean value of length is 581.9 μm and the mean value of the high aspect ratio is 2.8. Furthermore, the c-axis orientation of each MTR is determined by solving the mean vector μ k in the GMM of the ML approach, as shown in Figure 5c. Additionally, the statistical distribution of angles of the MTRs’ c-axis to RD is described (Figure 5f).

4. Conclusions

This work proposes a novel automatic approach for segmenting MTRs in a Ti6242 billet based on c-axis misorientation, where an ML approach, the GMMs coupled with DBSCAN, was employed to process the orientation data acquired via EBSD in the Matlab environment. Millions of pixels with orientation information are divided and colored into several “classes” within the defined c-axis misorientation (i.e., 25°, 20°, 15°, 10°, and 5°), the precision and efficacy of which are verified by the morphology and pole figure of the segmented MTR. An appropriate range of c-axis misorientations for MTR segmentation was derived, i.e., 15~20°. Compared with the approaches employed in previous studies, the segmentation technique using the ML approach proposed here is more effective. In terms of segmentation effect, the MTR segmented using this ML approach has a more precise morphology and a clearer boundary. As shown in the pole figure, a single, strong texture peak of an MTR is obtained in this work, compared with the multiple peaks of various intensities obtained in previous studies. At the same time, the MTRs were statistically characterized in the global region to provide essential data for investigating dwell-fatigue.

Author Contributions

Conceptualization, H.R. and D.L.; methodology, N.L. and J.N.; software, F.J. and H.W.; formal analysis, H.R. and J.W.; writing—original draft preparation, H.R.; writing—review and editing, F.J. and Y.Y.; visualization, D.L.; funding acquisition, J.W. All authors have read and agreed to the published version of the manuscript.

Funding

This research was funded by the National Natural Science Foundations of China (Grant No. 52101052) and the Natural Science Foundation of Chongqing, China (No. cstc2020jcyj-msxmX0046).

Institutional Review Board Statement

Not applicable.

Informed Consent Statement

Not applicable.

Data Availability Statement

All data-supported results are available from the first author.

Acknowledgments

Thanks to Feng Jin for polishing the article.

Conflicts of Interest

The authors declare no conflict of interest.

References

  1. Bache, M. A review of dwell sensitive fatigue in titanium alloys: The role of microstructure, texture and operating conditions. Int. J. Fatigue 2003, 25, 1079–1087. [Google Scholar] [CrossRef]
  2. Sinha, V.; Mills, M.J.; Williams, J.C.; Spowart, J.E. Observations on the faceted initiation site in the dwell-fatigue tested ti-6242 alloy: Crystallographic orientation and size effects. Met. Mater. Trans. A 2006, 37, 1507–1518. [Google Scholar] [CrossRef]
  3. Cappola, J.; Stinville, J.-C.; Charpagne, M.-A.; Callahan, P.G.; Echlin, M.P.; Pollock, T.M.; Pilchak, A.; Kasemer, M. On the Localization of Plastic Strain in Microtextured Regions of Ti-6Al-4V. Acta Mater. 2020, 204, 116492. [Google Scholar] [CrossRef]
  4. Kasemer, M.; Echlin, M.P.; Stinville, J.C.; Pollock, T.M.; Dawson, P. On slip initiation in equiaxed α/β Ti-6Al-4V. Acta Mater. 2017, 136, 288–302. [Google Scholar] [CrossRef]
  5. Zhang, K.; Yang, K.V.; Lim, S.; Wu, X.; Davies, C.H.J. Effect of the presence of macrozones on short crack propagation in forged two-phase titanium alloys. Int. J. Fatigue 2017, 104, 1–11. [Google Scholar] [CrossRef]
  6. Zhang, K.; Wu, X.; Davies, C.H.J. Effect of microtexture on short crack propagation in two-phase titanium alloys. Int. J. Fatigue 2017, 104, 206–220. [Google Scholar] [CrossRef]
  7. Nait-Ali, A.; Hémery, S.; Gueguen, M. How macrozone size and morphology influence yield in titanium alloys investigated using fast Fourier transform-based crystal plasticity simulations. Int. J. Solids Struct. 2021, 216, 1–16. [Google Scholar] [CrossRef]
  8. Bieler, T.R.; Semiatin, S.L. The origins of heterogeneous deformation during primary hot working of Ti–6Al–4V. Int. J. Plast. 2002, 18, 1165–1189. [Google Scholar] [CrossRef]
  9. Glavicic, M.G.; Bartha, B.B.; Jha, S.K.; Szczepanski, C.J. The origins of microtexture in duplex Ti alloys. Mater. Sci. Eng. A 2009, 513–514, 325–328. [Google Scholar] [CrossRef]
  10. Germain, L.; Gey, N.; Humbert, M.; Bocher, P.; Jahazi, M. Analysis of sharp microtexture heterogeneities in a bimodal IMI 834 billet. Acta Mater. 2005, 53, 3535–3543. [Google Scholar] [CrossRef]
  11. Germain, L.; Gey, N.; Humbert, M.; Vo, P.; Jahazi, M.; Bocher, P. Texture heterogeneities induced by subtransus processing of near α titanium alloys. Acta Mater. 2008, 56, 4298–4308. [Google Scholar] [CrossRef]
  12. Zhao, Z.B.; Wang, Q.J.; Liu, J.R.; Yang, R. Characterizations of microstructure and crystallographic orientation in a near-α titanium alloy billet. J. Alloys Compd. 2017, 712, 179–184. [Google Scholar] [CrossRef]
  13. Roy, S.; Suwas, S. Orientation dependent spheroidization response and macro-zone formation during sub β-transus processing of Ti-6Al-4V alloy. Acta Mater. 2017, 134, 283–301. [Google Scholar] [CrossRef]
  14. Huang, L.; Sun, Z.; Cao, J.; Yin, Z. The formation and evolution of macrozone in Ti-6242S alloy during thermo-mechanical processing. J. Alloys Compd. 2021, 861, 158533. [Google Scholar] [CrossRef]
  15. Hu, Z.; Zhou, X.; Liu, H.; Yi, D. The formation of microtextured region during thermo-mechanical processing in a near-β titanium alloy Ti-5Al-5Mo-5V-1Cr-1Fe. J. Alloys Compd. 2020, 853, 156964. [Google Scholar] [CrossRef]
  16. Ozturk, D.; Pilchak, A.L.; Ghosh, S. Experimentally validated dwell and cyclic fatigue crack nucleation model for α–titanium alloys. Scr. Mater. 2017, 127, 15–18. [Google Scholar] [CrossRef]
  17. Liu, Y.; Dunne, F.P.E. The mechanistic link between macrozones and dwell fatigue in titanium alloys. Int. J. Fatigue 2021, 142, 105971. [Google Scholar] [CrossRef]
  18. Ramprasad, R.; Batra, R.; Pilania, G.; Mannodi-Kanakkithodi, A.; Kim, C. Machine learning in materials informatics: Recent applications and prospects. NPJ Comput. Mater. 2017, 3, 54. [Google Scholar] [CrossRef]
  19. Morgan, D.; Jacobs, R. Opportunities and Challenges for Machine Learning in Materials Science. Annu. Rev. Mater. Res. 2020, 50, 71–103. [Google Scholar] [CrossRef]
  20. Schneider, Y.; Prabhu, V.; Höss, K.; Wasserbäch, W.; Schmauder, S.; Zhou, Z. Many-Scale Investigations of the Deformation Behavior of Polycrystalline Composites: I-Machine Learning Applied for Image Segmentation. Materials 2022, 15, 2486. [Google Scholar] [CrossRef]
  21. Staub, A.; Brunner, L.; Spierings, A.B.; Wegener, K. A Machine-Learning-Based Approach to Critical Geometrical Feature Identification and Segmentation in Additive Manufacturing. Technologies 2022, 10, 102. [Google Scholar] [CrossRef]
  22. Nguyen, T.M.; Wu, Q.M.J. Fast and Robust Spatially Constrained Gaussian Mixture Model for Image Segmentation. IEEE Trans. Circuits Syst. Video Technol. 2013, 23, 621–635. [Google Scholar] [CrossRef]
  23. Riaz, F.; Rehman, S.; Ajmal, M.; Hafiz, R.; Hassan, A.; Aljohani, N.R.; Nawaz, R.; Young, R.; Coimbra, M. Gaussian Mixture Model Based Probabilistic Modeling of Images for Medical Image Segmentation. IEEE Access 2020, 8, 16846–16856. [Google Scholar] [CrossRef]
  24. Hanafi, N.; Saadatfar, H. A fast DBSCAN algorithm for big data based on efficient density calculation. Expert Syst. Appl. 2022, 203, 117501. [Google Scholar] [CrossRef]
Figure 1. Workflow of the data processing for MTR segmentation.
Crystals 13 01422 g001
Figure 2. IPF map of EBSD zone (a), segmentation and coloring results of Ti6242 MTRs according to the defined c-axis misorientations: 25° (b), 20° (c), 15° (d), 10° (e), and 5° (f). The blue dotted frame is a feature zone, shown in detail in Figure 3.
Crystals 13 01422 g002
Figure 3. A representative MTR segmented under different c-axis misorientations: segmented MTR (a), the MTR in IPF (b), and pole figures (c).
Crystals 13 01422 g003
Figure 4. Comparison of the effectiveness and precision of MTR characterization between previous studies and this work [11,14]. The macrozone IV is an MTR framed with rectangles.
Crystals 13 01422 g004
Figure 5. Statistical characterization of MTRs: segmentation and coloring of “classes” (a), non-MTR regions (b), schematic of orientation in each MTR (c), statistics and fitting of length (d) and high aspect ratio (e) of MTRs, and distribution of angles of MTRs’ c-axis to RD (f). The grey hexagonal prism in (c) represents the orientation of each MTR, and W1 and L1 represent the width and length of the MTR, respectively.
Crystals 13 01422 g005
Disclaimer/Publisher’s Note: The statements, opinions and data contained in all publications are solely those of the individual author(s) and contributor(s) and not of MDPI and/or the editor(s). MDPI and/or the editor(s) disclaim responsibility for any injury to people or property resulting from any ideas, methods, instructions or products referred to in the content.

