Abstract
Electrode degradation in the continuous resistance spot-welding process of baked hardening (BH) 220 steel was evaluated by an electrode life test, and weldability tests were conducted by geometry feature measurement, mechanical property analysis, and electrode diameter measurement with 88 or 176 weld intervals. The analysis of weld geometry shows that the heat-affected zone (HAZ) width, nugget diameter, and nugget area tend to decrease rapidly, while the nugget height tends to increase with the weld repetitions until the welding heat input becomes too small to form an effective nugget. The maximum displacement and failure energy of the welded joints show a decreasing trend during the welding electrode failure process, while the peak load increases slightly until the 88th weld and then decreases. The cavities and pores in the nugget mainly appear after the 176th spot weld. The electrode diameter increases during welding. The reason for the increase in electrode diameter may be that the contact area between the electrode and the BH 220 steel sheets becomes smaller in the welding process, which causes the continuous sticking phenomenon between the electrode and the BH 220 steel sheets. In the absence of alloying, the edge of the electrode is geometrically deformed, while Cu–Zn–Fe alloying occurs in the area in contact with the BH 220 steel sheet.
1. Introduction
In recent years, the automotive industry has developed various joining technologies, such as friction stir welding, laser welding, and self-pierce reverting [1]. However, resistance spot welding (RSW) is the main welding technique. Multiple pieces of metals are pressed by the electrodes in the welding process. Simultaneously, the welding current passes through the electrodes and the metal plates, generating welding heat in accordance with Joule’s law. In this case, the contact surface of the metal plates is locally melted to connect these workpieces [2]. This welding process has the advantages of economic feasibility, simple operation, and a high degree of automation [3].
Hot-rolled steel is often used in automobile bodies, mechanical structures, railways, and other industrial fields because of its good corrosion resistance. As a typical hot-rolled steel, galvanized baked hardening (BH) steel is an essential material for automotive manufacturers to enhance corrosion resistance and overall service life. BH steel is a high-strength ultra-low carbon steel that is heated in an oven between 150 °C and 200 °C for about 20 min [4]. After this process, its strength, weldability, formability, and other properties have been greatly improved. Welding galvanized BH steel is a big challenge and requires a more precise pre-design of the welding schedules. In fact, the larger welding current, longer welding time, and higher electrode pressure are beneficial because of the shunt effect caused by the galvanized coating. Too high welding parameters will lead to early failure of electrodes, which are the basic consumables of the RSW. In addition, under this welding operation condition [5], welding defects (expulsion, cracks, and so on) easily occur. These problems stem from the fact that the physical, mechanical, and electrical properties of zinc coatings are completely different from those of the base metal (BM).
The welding quality of the welded joints produced by BH steel has been evaluated by some researchers. Pawar et al. [6] studied the influence of microstructure characteristics on the uneven hardness distribution of welded joints made by 340 BH steel. The results implied that, for the austenite matrix, the child laths followed the Kurdjumov–Sachs orientation relation but deviated slightly from the conventional Kurdjumov–Sachs orientation relation (about 3° angle deviation). The authors also found that the microhardness of martensite formed during RSW was strongly dependent on its grain size. Hayat [7] studied the resistance spot weldability of BH 180 steel and interstitial free (IF) 7123 steel. The microstructure, hardness, tensile-shear properties, and failure modes of the welded joints were studied. The test results showed that, with the extension of welding time, the tensile shear capacity of the specimen increased gradually until 25 cycles of welding. The specimens appeared in two failure modes. It was also determined that the failure occurred on the IF side of the BH180+IF7123 welded joint. Alenius et al. [8] examined the spot weldability of stainless steels (AISI 304 and AISI 301 LN) and 260 BH steel. The failure load of cross-tensile specimens was about 72~78% of that of lap-shear specimens. The weld nugget was full of martensite, but it had enough toughness. The failure type in the shear test and cross-tensile test was plug failure. The experimental results revealed that the welded joint of AISI 301 LN steel and galvanized 260 BH steel was prone to hydrogen embrittlement in a 3.5% sodium chloride solution at room temperature. The reason for hydrogen embrittlement was that the weld nugget was full of martensite that had low corrosion potential due to galvanization. Mirzaei et al. [9] used the finite element method to model the weld nugget geometry and tensile shear strength in the RSW process of galvanized IF and BH steel plates. The results showed that welding current was the most influential parameter affecting welding performance. Increasing welding current and welding time, and, meanwhile, decreasing electrode force, would increase weld nugget size and joint strength. Although increasing the nugget size initially increased the joint strength, after the maximum strength was reached, increasing the nugget size caused the joint strength to decrease. Hamidinejad et al. [10] modelled and optimized the resistance welding process of IF steel and BH steel. The welding experiments were arranged by the welding parameters with several levels. An artificial neural network model was presented to quantify the relationship between welding parameters and weld strength. The genetic algorithm was then used to solve the optimal welding parameters. Yurci et al. [11] established the relationship between welding parameters (welding time, welding current, and electrode force) and the welding quality indexes (nugget diameter, weld strength) using mathematical formulas. The welding material was 220 BH steel with a thickness of 1.6 mm. The signal-to-noise (SN) ratios and analysis of variance (ANOVA) test showed that the influence of the electrode force on the tensile strength was very low, while the most crucial factor was the welding current. As for the welding of galvanized steel, the Zn coating will be pressed out of the contact surface of the metal sheets, which gives rise to higher temperature distributions in the contact area [12]. In addition, its electrical resistance is much lower, and higher welding heat input should be employed to generate a weld nugget with the acceptable size. In this case, the mechanical properties of the welded joints can be guaranteed.
Continuous welding is usually performed in a real production line. The electrodes repeatedly heat and press the welded metal plates. In this case, they are prone to deterioration, especially when the coated metal sheets are welded [13]. It is discovered that the deterioration of the electrode has an unfavourable effect on the welding quality of the welded joint when the coated or uncoated metal sheets are continuously welded [14]. The standard for electrode life assessment is the number of welds that can be performed repeatedly until the critical acceptable nugget size is impossible to achieve [15]. Electrode life is an important limiting factor to improve welding efficiency on the welding production line [16]. Electrodes have a short life and require frequent trimming and replacement, resulting in reduced productivity and increased costs. In addition, at the end of the electrode life, the welding quality changes more significantly, especially when welding coated metals. Electrode deterioration leads to an increase in electrode diameter, which has a considerable effect on the welding quality [17].
Compared with the bare metal plate, when welding galvanized metal plates, the electrode surface will be contaminated with zinc or zinc-based alloy. The alloyed surface on the electrode changes its structure as well as its mechanical and physical properties. The electrode made of copper alloy reacts with the zinc coating on the steel sheets to be welded to form new alloys with a brass phase, which has a lower hardness, melting point, and poorer electrical conductivity [18]. The produced layers can damage the life of the electrodes. However, electrode life plays a significant role in assembling car bodies using the RSW technique. The electrode life is short and needs to be trimmed and updated, resulting in slower production efficiency and higher production costs [19].
Although a large amount of literature exists on the welding quality assessment of BH steels for spot-welding processes based on the microstructure and mechanical properties of welded joints, many challenges remain. Many of the above-mentioned investigations have some disadvantages, which are listed as follows.
- Most of the previous work on BH steels only deals with welded joint properties such as tensile strength, microhardness, weld geometry, and microstructure. During continuous welding of galvanized BH steel, the relationship between the electrode deterioration process and the welding quality of welded joints has not been studied in detail.
- The nugget diameter, heat-affected zone (HAZ) width, HAZ height, peak load, failure energy, maximum displacement, and failure mode of the weld are the main quality characteristics of the welded joint [20]. During the electrode degradation process, material properties such as hardness, tensile strength, and toughness change. Weld quality is a function of electrode life. Therefore, establishing an accurate prediction model is crucial for welding quality evaluation in the process of electrode deterioration.
The purpose of this study is to cope with these issues. With the increase in the number of spot welds, the alloying and deterioration of the electrode become worse. In particular, we intend to analyze the effect of electrode alloying and its geometry change on the spot-welding quality. The paper is organised as follows:
- Section 2 details the experiments and tests, as well as the hardware required for the experiments, measurements, and processing of the data.
- Section 3.1 discusses the microstructure and mechanical properties of the welded joints obtained by the new electrodes. Section 3.2.1 introduces the mechanical performance and geometry of the welded joints with the increasing number of welding operations. Section 3.2.2 and Section 3.2.3 respectively, study the geometry and alloying process of the electrodes with the increasing number of welding operations. Furthermore, the effects of these changes on the welding quality are also discussed in this section.
- Section 4 displays the most significant conclusions of this manuscript.
2. Experimental Detail
The material used in this experiment was galvanized BH 220 steel with a thickness of 1.5 mm. The chemical composition, mechanical attributes, and composition of the coating are shown in Table 1 and Table 2. The data were provided by the company of Magnitogorsk Iron and Steel Works.

Table 1.
Chemical compositions (wt. %) of the BH 220 steel.
Table 2.
Mechanical and coating attributes of the BH 220 steel.
An alternating current resistance spot-welding machine was used for the welding experiments. Cu–Cr domed electrodes with a diameter of 5 mm were used. The bottom electrode was fixed and both electrodes were filled with cold water for the cooling stage of the spot-welding process. The water was 25 °C and its water flow was 4 L/min for cooling the electrodes [21,22,23]. Before the welding experiments, the metal surface to be welded was cleaned with alcohol to remove the impurities.
The welding current of 8.4 kA, the welding time of 20 cycles (1 cycle = 0.02 s), and the electrode force of 0.3 MPa were employed to join the steel sheets. In order to determine the suitable welding process parameters, we performed some trial experiments, as shown in Table 3. It can be seen from this table that the welding process parameters selected in this study can produce welded joints with maximum mechanical properties. Two large steel plates with the size of 800 mm × 1200 mm were used, on which 88 welded joints were made. A total of 8 pairs of BH 220 steel sheets with such dimensions were welded, and 704 welds were made. Since the deteriorated electrodes could not be collected and observed in a single weld experiment, the alloying and deterioration characteristics of the electrodes were respectively checked when 176, 352, 528, and 704 welded joints were continuously welded under the same welding conditions. The deteriorated electrodes with these numbers of welds were selected to study their alloying and geometry changes. Welding samples of 120 mm × 40 mm (as displayed in Figure 1) were welded at the intervals of 88, 176, 352, 440, 528, 616, and 704 welds, respectively, to investigate the effect of electrode deterioration on the welding quality. In order to prevent extreme degradation of the electrodes caused by continuous welding, the welding operation was carried out at a rate of 5 welds per minute.
Table 3.
The results of the trial experiments.
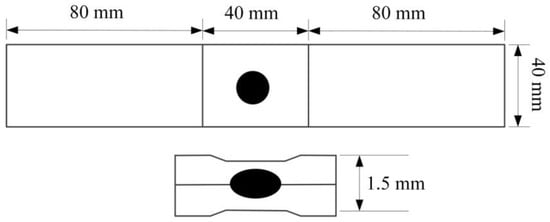
Figure 1.
The design of the welded joint.
The welding specimens were cut near the centre line of the weld, and their geometries and microstructure were measured. The welded joints were placed into the mounting resin. Using a few sheets of metallographic sandpaper, between 800 and 4000 grains, the welded joints were ground and polished with a suspension solution. A 2% solution of nitric acid with ethyl alcohol (Nital) [24] was used to etch the welded samples and reveal their microstructure. The microstructure of the welded joints was observed by optical microscope (OM) and scanning electron microscope (SEM). ImageJ software was used to measure the weld geometries such as weld nugget diameter, nugget height, and nugget area. The mechanical properties and failure modes of the welded joints were tested on a universal tensile test machine with a loading speed of 5 mm/min. The test conditions were accomplished as stated by AWS D8.9 standard [25]. After continuous welding, the contour of each electrode was obtained by processing the electrode image with a 100-times magnification. In addition, with the intention of analyzing the alloy phenomena, line scanning was achieved by SEM.
3. Results and Discussion
3.1. The Characteristics of the Welded Joints Obtained by the 1st Welding Operation
The carbon equivalent (CE) of the BM was calculated to determine the relationship between the chemical compositions and hardenability. The value of CE can be obtained via the formula listed as follows [26],
where the values of the chemical symbols can be found in Table 1. Based on this equation, the value of CE is 0.083. The higher this value is, the harder this steel is to be welded. The carbon content of this steel is low, indicating that the hardness of the weld zone will not be so high.
CE = C + Mn/6 + (Cu + Ni)/15 + (Cr + Mo + V)/5
The temperatures of Ac1, Ac3, Ms, and Bs can be computed by the following equations [27].
where Ac1 is the starting temperature for the transformation of austenite, while Ac3 is the temperature for the complete transformation of austenite. Bs is the bainite onset temperature; Ms is the martensite start temperature. The values of Ac1 and Ac3 are, respectively, 743 °C and 866 °C after calculation. Bs is 808 °C and Ms is 498 °C.
Ac1 (°C) = 751 − 16.3 C − 27.5 Mn − 5.5 Cu − 5.9 Ni + 34.9 Si + 12.7 Cr + 3.4 Mo
Ac3 (°C) = 881 − 206 C − 15 Mn − 26.5 Cu − 20.1 Ni + 53.1 Si − 0.7 Cr + 41.7 V
Ms (°C) = 512 − 453 C−16.9 Ni + 15 Cr − 9.5 Mo + 217 C2 − C (71.5 Mn − 67.6 Cr)
Bs (°C) = 839 − 270 (1−exp(−1.33 C)) − 86 Mn − 23 Si − 67 Cr − 33 Ni − 75 Mo
The microscopic photos of the BM obtained by the OM and SEM are described in Figure 2a,b. The BM is made up of ferrite gains and dispersed carbides. The length of the ferrite is about 15 µm.
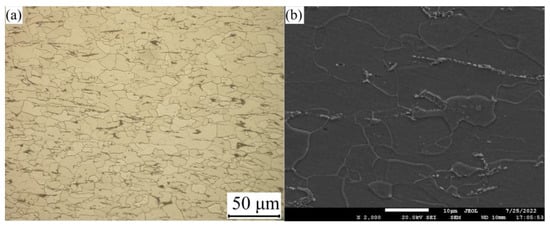
Figure 2.
The microstructure of the BM: (a) OM; (b) SEM.
The cross-section of a typical welded joint is shown in Figure 3, which is distinguished by three zones: BM, HAZ, and fusion zone (FZ). The thermal history, peak temperature, chemical composition, and cooling speed control the produced phases and microstructure of the welds.
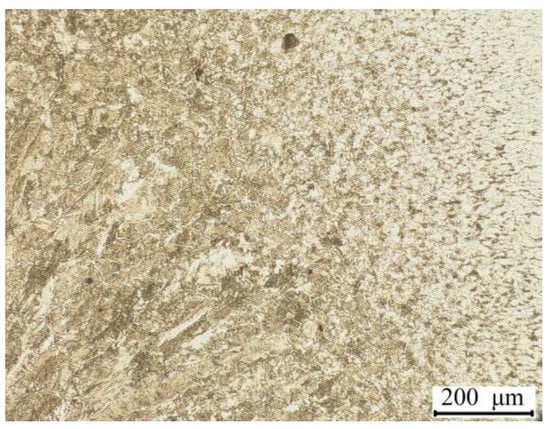
Figure 3.
The cross-section of a welded sample.
The grain size of the HAZ is far smaller than that of the BM. The peak temperature of the HAZ is higher than 550 °C, which is lower than the melting point of the BM [28]. In the welding process, the welding heat input radiates from the weld centre to its outer part. In this case, the grains of the FZ appear columnar. While in the HAZ, the peak temperature gradient is huge, so the grains display in different forms. The area immediately next to the FZ undergoes a very high temperature and its duration is so long that the transformed austenite has enough time to grow up, leading to a rather coarse structure. As for the part adjacent to the BM, the peak temperature is low and only a small fraction of the BM is transformed. Thus, its grain size is similar to that of the BM. In terms of the maximum temperature and its duration time, the HAZ further consists of three regions, namely coarse grain HAZ (CGHAZ), fine coarse HAZ (FGHAZ), and inter-critical HAZ (ICHAZ).
Figure 4 indicates that the CGHAZ is packed with coarse martensite, grain-boundary ferrite, and Widmanstatten ferrite. The maximum temperature of the CGHAZ is within the limit of Ac3 (866 °C) [29] and the melting point of the BM (about 1500 °C). Therefore, complete austenitizing occurs. In addition, the temperature is also higher than that of the austenite grain coarsening. In this case, coarse-grained austenite is produced. The grain growth degree in this region is controlled by the factors of maximum temperature and the duration that is higher than the austenitizing temperature. Since the CGHAZ is just next to the weld interface, the high cooling speed results in martensite.
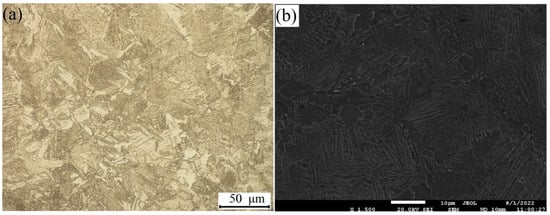
Figure 4.
The microstructure of the CGHAZ: (a) OM; (b) SEM.
Although BH steel has a rather low carbon percentage, martensite is spotted in the CGHAZ. The transition into martensite is usually owing to the high cooling speed during the RSW process. The copper electrodes full of cooling water and short welding time are the roots for the rather high cooling rate. The cooling speed in the welding process can be roughly predicted by an established model. The cooling rate for the metal sheet with a thickness of 1.5 mm is around 4600 °C/s [30]. The critical cooling rate to produce the martensite can be computed by the following equation [31].
where v (°C/h) is the critical cooling speed, while the values of the chemical compositions can be found in Table 1. The actual cooling speed is higher than the critical value of 3976 °C/s, thus, it is expected to find martensite in the CGHAZ.
lgv = 7.42 − 3.13 C − 0.71 Mn − 0.37 Ni − 0.34 Cr − 0.45 Mo
The temperature in the FGHAZ is between Ac3 (866 °C) and the austenite grain coarsening point. Therefore, small-sized austenite appears under the effect of the welding heat. After that, the austenite partly transfers into fine-grained martensite thanks to the exceedingly high cooling speed. Besides martensite, grain boundary ferrite, Widmanstätten ferrite, and bainite are spotted, as demonstrated in Figure 5.
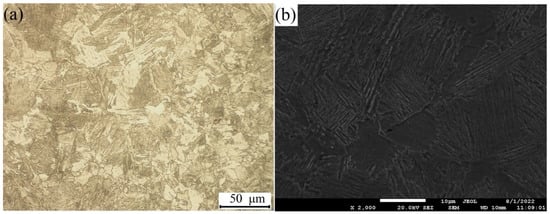
Figure 5.
The microstructure of the FGHAZ: (a) OM; (b) SEM.
The peak temperature of ICHAZ is in the range of Ac1 (743 °C) and Ac3 (866 °C). In this case, a part of the microstructure in the BM changes into austenite. Depending on the different cooling speeds and carbon contents, the produced austenite may transform into martensite, bainite, or pearlite. As for the low carbon percentage of BH steel, it produces fine ferrite and pearlite (Figure 6). As the temperature decreases with the distance from the weld centre to BM, the closer to the weld centre, the higher the temperature will be. Thus, the fraction of pearlite in ICHAZ decreases when approaching the BM.
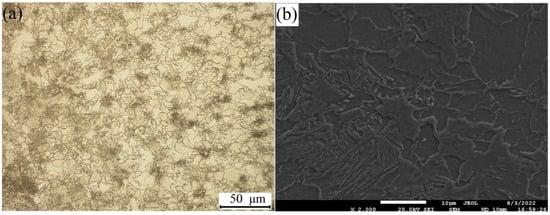
Figure 6.
The microstructure of the ICHAZ: (a) OM; (b) SEM.
The microstructure of the FZ is revealed in Figure 7. The produced phases of the FZ are determined by the factors of thermal history, peak temperature, and chemical compositions of the BM. The FZ is heated above the melting point of the BM in the welding process, and then it cools swiftly and solidifies under the effect of the cooling water in the electrodes. The heat transfer path is from the weld centreline to the electrodes. Based on these factors, the microstructure in the FZ may consist of lath martensite, polygonal ferrite, grain boundary ferrite, Widmanstatten ferrite, and bainite. As for steel sheets with a thickness of 1.5 mm, the cooling speed is about 4600 °C/s. Even though the carbon percentage of the BM is rather low, the cooling speed of the spot weld is rather high. This is due to the cooling water in the electrodes and the short welding time. The critical martensite production cooling speed is 3976 °C/s, which is far lower than the real cooling speed of the FZ in the welding process. In this case, it is expected that the martensite is in the FZ.
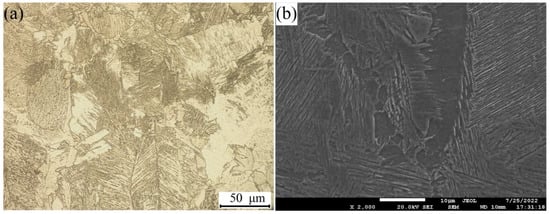
Figure 7.
The microstructure of the FZ: (a) OM; (b) SEM.
During the RSW process, the cooling rate of the nugget is a lot higher than that in equilibrium conditions, causing increasing subcooling and cooling speeds. The martensite in the FZ relies on the produced austenite because of the welding heat input. In such a swift cooling process, the time to transform from ferrite to austenite is rather short. Hence, a certain amount of untransformed ferrite remains in the FZ. As a matter of fact, grain boundary ferrite forms at the boundary of the austenite when it cools from the high temperature. It appears at the grain boundaries of austenite grain and develops as stated by the diffusion mechanism [32]. This diffusion decreases as the temperature declines and the diffusion-less transformation becomes dominant. Plate-like and lath-like Widmanstatten ferrite develops at temperatures in the range of Ac3 (866 °C) and Bs (808 °C), and this structure is owing to diffusive transformation [28]. Widmanstatten ferrite grains appear via a displacive mechanism at comparatively low degrees of undercooling. Widmanstatten ferrite is not able to dissolve more carbon under its equilibrium situation when austenite changes into ferrite. A possible formation mechanism of the acicular bainite is owing to the fact that it forms at a temperature slightly above the temperature of Ms (498 °C) [28]. Bainite then forms, following the same mechanism as Widmanstatten ferrite, with needles appearing when it further supercools.
3.2. Electrode Life Assessment
3.2.1. Changes in Welding Properties with the Increasing Number of Welding Operations
In this section, the electrode life assessment will be investigated by performing several welds. The welding operation will not be stopped until the produced welded samples have developed an interfacial failure (IF) mode and highly undersized weld nuggets. In this case, the effect of electrode deterioration on mechanical properties is so great that the failure mode of the welded joint generated by the same welding parameters changes from pull-out failure (PF) mode to IF mode.
Figure 8 shows the variation of the geometric profile of the welded samples obtained with 88 or 176 weld intervals in the continuous welding experiments. Geometric features include HAZ width, nugget diameter, nugget height, and nugget area. The nugget diameter observed from the first weld was 5.83 mm. After 176 welds, the nugget diameter decreased to 5.53 mm. With the rise in the number of welds, the nugget diameter decreased. After 352 repetitions of welding, the nugget diameter reduced to 4.44 mm. After 528 welds, the diameter of the weld nugget basically remained stable at 3.92 mm. The HAZ width and nugget area had similar tendencies as the nugget diameter with the increase of the welding repetitions. The HAZ width reduced from 6.62 mm to 5.23 mm, while the nugget area decreased from 11.58 mm2 to 0 mm2. It can be inferred that welding heat input decreased in the electrode failure process. When welding the 704th weld, the welding heat was so slight that it hardly formed a valid nugget. Meanwhile, its HAZ width was 5.23 mm.
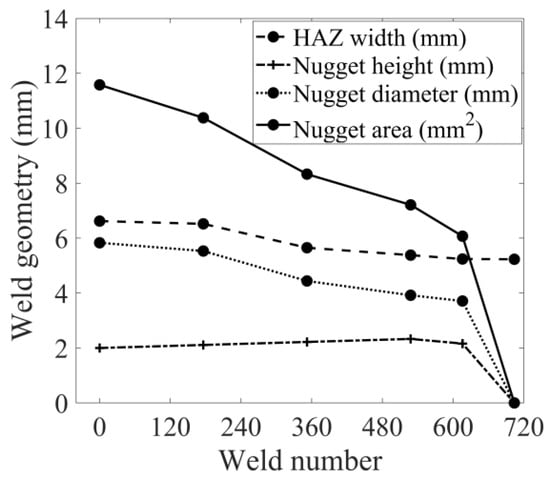
Figure 8.
The geometries of the welded joints in the electrode failure process.
The height of the nugget grew with the increase of the welds. The nugget height increased when molten steel in the FZ expanded due to low electrode pressure. In this case, the ratio of nugget height and steel thickness varied with the number of spot welds, reflecting the BM’s heating characteristics and capacity. If the ratio becomes higher, it means that the melting area is adjacent to the surface of the metal sheet. In this case, the cooling capacity of the electrode is low, the net welding heat becomes relatively greater, and the molten metal can approach the boundary of the welded plate. With the increase in the number of welded samples, the value gradually increases and approaches 0.78 after 528 welds. The regression models qualifying the relationship among the weld number and weld geometries (HAZ width, nugget height, nugget diameter, and nugget area) are listed as follows,
where N denotes the weld number, W represents the HAZ width, H stands for the nugget height, D is the nugget diameter, and A is the nugget area. Adj R2 is the adjusted coefficient of determination for the established models, and it is in the range of 0 and 1. It should be as close to 1 as possible. The range of N is given as follows,
W = −0.0023 N + 6.67 (Adj R2 = 0.9087)
H = 0.000000047 N3 + 0.000039 N2 − 0.0066 N + 2.07 (Adj R2 = 0.7401)
D = −0.000015 N2 + 0.0039 N + 5.56 (Adj R2 = 0.7302)
A = −0.000024 N2 + 0.0039 N + 11.06 (Adj R2 = 0.8204)
0 ≤ N ≤ 704
It can be inferred that, unlike mild steel, when welding BH 220 steel, because the plate and electrode contact was not uniform, the locally-generated heat was different. If this local heat on the surface continued, it was likely that plate surface melting would also occur locally. This is in good accordance with the ratio of nugget height and steel thickness value resulting in close to 1 according to Figure 9b. The mechanism of forming the nugget with high height was (1) in the process of the nugget formation, due to high current density, the electrode surface melts, (2) part of the molten metal is transferred to the electrode through fusion phenomenon, forming a thicker nugget, and (3) finally, because the molten pool extends toward the electrodes, it further deepens the electrode surface alloying process [33]. In addition, in the welding process after 616 points (Figure 9b), different from Figure 9a, there was almost no HAZ between the electrode and the welded steel, and the nugget was exposed near the surface. The nugget height was very large, and there were pores in the nugget. During the initial pressurization process, local contact failure occurred between the metal sheets and the electrode. Once the welding current turned on, local heat was generated due to the high current density at the electrode edge in contact with the welding steel sheets. Finally, local alloying via fusion is thought to have occurred.
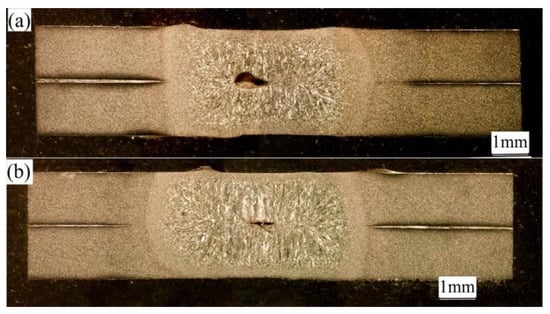
Figure 9.
The geometric properties of the welded joints in the electrode failure process: (a) the 528th weld; (b) the 616th weld.
The size of the nugget had a profound influence on the strength of welded joints. The peak load of welded joints obtained from tensile shear tests stayed above 12 kN until the 352nd weld, as revealed in Figure 10. The results in Figure 10 were obtained by averaging the data of each test, and three welded samples were performed for each tensile shear test. The tensile shear test result of the welded joints produced by the set welding parameters is presented in Figure 11a. The average mechanical properties of the welded joints were a peak load of 12.43 kN, a maximum displacement of 5.36 mm, and a failure energy of 56.39 J. The load firstly rose with the displacement in a linear manner and then nonlinearly increased until reaching its peak. When arriving at the peak, the crack appeared and extended, and in this case, the load decreased slowly. The load–displacement curves display a long tail with the increase of the displacement. The PF mode happened when the crack completely spread to the vicinity of the nugget. This was caused by the fact that the BM will bear the loads after pulling out the welded joints. In this case, the BM will be torn, and the welded joints will be fully broken. The fracture morphology of the welded joint shows that it reached the expected PF mode, which also indicates that the selected welding process parameters are appropriate. The peak load of the 704th weld reduced to 41.19% of the strength of the 1st welded joint, as shown in Figure 11b. With the increase in the number of welds, the failure mode changed from PF to IF. The critical number of welds was 352, which means that the welded joints undergo IF mode after the increasing number of welded joints is higher than this critical number. It should be pointed out that the 176th weld displayed a little higher peak load than the 1st weld. Its peak load was 12.56 kN. However, as for the 1st weld, its peak load was 12.43 kN. Their difference was within 10%, indicating that it was caused by random errors. It was considered that welding defects and decreasing nugget diameter were the root causes of failure mode transition. To sum up, the nugget diameter decreased, and the welding defects occurred as the number of welds increased. Therefore, the higher stress concentration effect caused by welding defects and lower bearing capacity caused by the smaller nugget diameter led to the poor mechanical properties of welded joints. The nugget diameter decreased with the increase of welding repetitions. The regression models correlating the weld number with the mechanical performance of the welded joints are given as follows,
where L symbolizes the maximum displacement, p is the peak load, and E is the failure energy.
L = −0.0000094 N2 − 0.00049 N + 5.27 (Adj R2 = 0.9897)
p = −0.000027 N2 + 0.0105 N + 11.96 (Adj R2 = 0.9329)
E = −0.0805 N + 61.78 (Adj R2 = 0.9414)
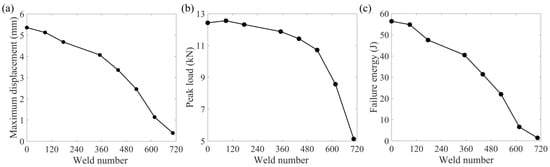
Figure 10.
The mechanical attributes of the welded joints during the failure process of the electrodes. (a) maximum displacement; (b) peak load; (c) failure energy.
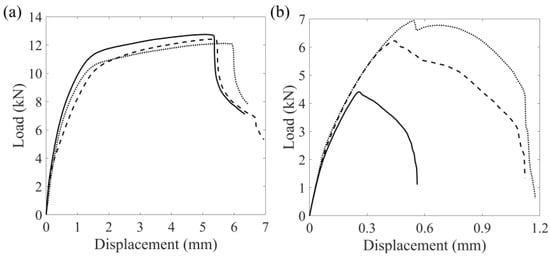
Figure 11.
The tensile-shear properties of the welded joints: (a) the 1st weld; (b) the 704th weld.
Figure 12 shows the average standard deviation of the peak load, maximum displacement, and failure energy of the welded joints as the number of welding repetitions increases. As the number of welds increases from 1 to 352, the mean standard deviation remains stable at around 1. It suddenly rises to 4.73 and continues to increase until it reaches a peak of 6.02. The accordance weld number is 528. However, as the welding operation continues, the mean standard deviation drops again, and its final value is 0.92, which is comparable to its initial value. In fact, the failure mode of all the weld joints in the range from 1st to 352nd is PF, while it is IF after the 616th weld. However, for the welds in the range of the 352nd and 616th weld, the failure mode is in the transition from PF to IF. At this stage, some welds undergo IF mode while others undergo PF mode. The percentage of welded joints experiencing PF decreases with repetition of the welding operation, while the fraction of welds with IF mode increases until all welds fail in IF mode.
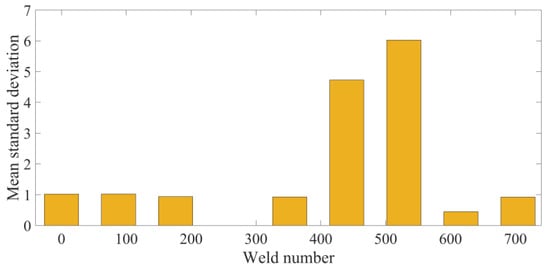
Figure 12.
The average standard deviation of peak load, maximum displacement, and failure energy of the welded joints during the failure process of the electrodes.
3.2.2. Evaluation of the Changes in Electrode Diameter with the Increasing Number of Welding Operations
The geometrical change of the electrodes during the failure process has an important influence on the welding quality. Changes in electrode geometry as the number of welds increases will be analyzed in this section. Figure 13 shows changes in the electrode diameter at intervals of 88 or 176 welds after the measurement. Measurements were done by carbon imprinting. The carbon imprint represents the contact area between the steel sheets and the electrode under a preset electrode force. It can roughly determine the initial contact area before the welding current begins. In the continuous welding process, the curvature radius of the electrode surface increases significantly. In addition, no pitting and cavitation phenomena in the non-contact area of the carbon imprint were observed in the continuous welding process. The regression model to quantify the relationship between electrode diameter and weld number is given as follows,
where DE is electrode diameter.
DE = −0.000017 N2 + 0.021 N + 5.03 (Adj R2 = 0.9855)
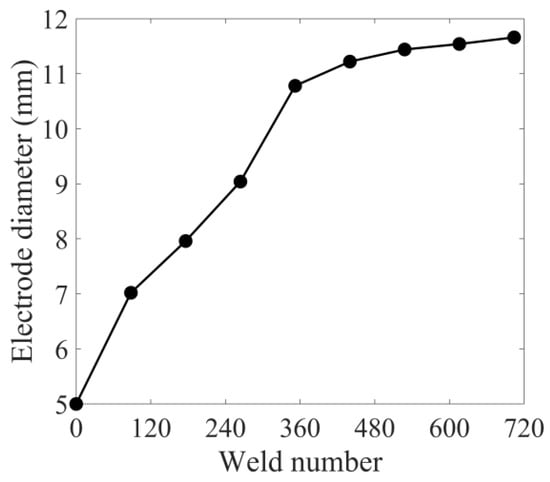
Figure 13.
Changes in the electrode diameter during its failure process.
When the number of welds increases from 0 to 176, the electrode diameter increases, and its value is 7.02 mm. After the 352nd weld, the diameter of the diameter basically remains stable. The welding heat input provided to the weld zone can be expressed by the following formula:
where Q is the welding heat input, I is the welding current, R(t) is the dynamic resistance between the two electrodes, and t is the duration of the welding current. As can be obtained from Equation (15), welding heat input Q is determined by current, time, and resistance. According to Joule’s law, Q is proportional to welding time and the square of welding current. In this study, resistance is the only factor that changes the welding heat input because the same spot-welding process conditions are employed for all the welding experiments. The resistance is affected by the cross-sectional area of the welding current. In other words, when evaluating the electrode life for continuous welding of BH 220 steel, the contact area between the electrode and the welded metal sheet improves by increasing the electrode diameter, and the current density between the contact interfaces reduces. As a result, the nugget of the weld decreases, leading to some welding defects.
Q = I2 R(t)t
3.2.3. Electrode Degradation Behaviour and Alloy Layer Analysis with the Increasing Number of Welding Operations
The alloying of the electrode surface was characterized by SEM-energy dispersive X-ray spectroscopy (EDS), and the results are revealed in Figure 14. After the 704th weld, the surface of the copper electrode was contaminated by galvanized Fe–Zn alloy. The chemical composition of the electrode surface after the 704th weld detected by SEM-EDS analysis is also shown in Table 4. During the welding process, Zn, Fe, and O were observed at the contact surface between the electrode and the welded plates, but little Cu was detected. It can be realized that the degraded electrode surface is mainly composed of ZnO and α-Fe(Zn). As demonstrated in Table 4, the distribution of elements in the centre and the edge of the electrode is different, indicating that the centre temperature during welding is lower than the edge temperature [33].
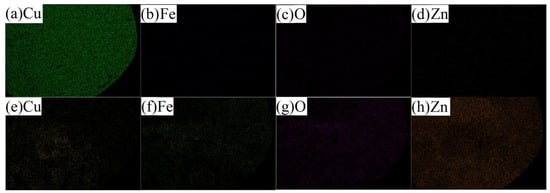
Figure 14.
SEM-EDS measurements of the elements on the electrode surface: (a–d) the 1st weld; (e–h) the 704th weld.
Table 4.
The element distributions on the surface of the electrode.
Through the analysis of element distribution, it is confirmed that, due to the reaction among the Cu electrode, Zn alloy coating, and the BM, there are various alloy layers with certain Fe–Zn–Cu phases on the electrode surface. The outer layer consists of ZnO and α-Fe(Zn) phases, the inner layer consists of the β-CuZn phase, and the middle layer consists of the Γ-ZnFe or γ-CuZn phase [33]. During the continuous welding process, the galvanized layer of the interface between the electrode and the steel sheet melts due to the high temperature. When the copper electrode is exposed to molten zinc–iron, different copper-zinc–iron alloy layers are formed according to different levels of temperature and durations [33]. In addition, during continuous welding, zinc diffuses from the outer layer of the electrode surface to the inner layer, forming β-CuZn, γ-CuZn, and α-CuZn phases [33]. The thickness of the alloy is 11 μm for the electrode for the 176th weld, its thickness is 17 μm for the 352nd weld, and its value is 24 μm for the 704th weld. Finally, during the continuous welding process, the surface of the Cu electrode is transformed into an alloy layer composed of various Cu–Zn–Fe phases, as illustrated in Figure 15.
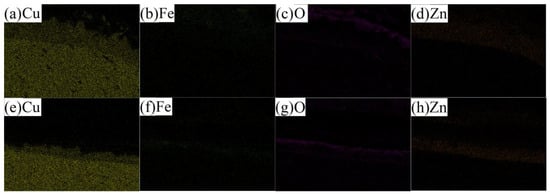
Figure 15.
EDS measurements of the elements on the electrode cross-section: (a–d) the 176th weld; (e–h) the 704th weld.
In conclusion, it is determined that continuous alloying reactions lead to a thermal increase of the electrode surface, and it also leads to metallographic deformation of the electrode. Since it is not clear which factor (metallurgical or geometric degradation) is more responsible for the deterioration of welding quality, the effects of metallurgical and geometric degradation on the various properties of RSW should be cautiously explored. The electrodes’ electrical and thermal properties change with their metallurgical degradation process, which greatly impacts the electro-thermal mechanical properties of the contact surface between the electrode and the metal sheets [34]. The Cu–Zn–Fe phase has higher resistivity and lower thermal conductivity than Cu [18]. It leads to an increase in resistivity and a decrease in the thermal conductivity of the electrodes under continuous welding conditions. Therefore, the temperature at the contact surface between the electrode and the metal sheets should increase.
In contrast, geometric degradation also affects the physical and mechanical characteristics of the contact surface between the electrode and the metal sheets, such as contact area, contact pressure, etc. [18]. As the effective heat input decreases, the contact surface temperature between the electrode and the metal sheets decreases. Geometric degradation and metallurgical degradation occur on the electrode surface when continuous welding is performed. As mentioned by Mahmudet et al. [18], with the development of the Cu–Zn–Fe alloy layer on the electrode surface, the resistivity of the electrode increases, while the thermal conductivity of the electrode decreases. This means that metallurgical degradation increases welding heat input. Thus, there is competition between geometric and metallurgical degradation of the electrode in determining the effective heat input and temperature.
After 704 consecutive welds, additional welds were performed by the deteriorated electrodes with welding currents of 9 kA and 9.6 kA, welding time of 20 cycles, and electrode pressure of 0.3 MPa. The geometric features and mechanical properties of the welded joints produced by the higher welding currents are given in Table 5. The weld attributes of the welded joints generated by the welding current of 9 kA are similar to those of the 440th welded joint, while the welding quality of the weld produced by the welding current of 9.6 kA is comparable to that of the 1st weld. This means that the effective heat input of 9.6 kA is similar to that of 1st welded joint. Similarly, the welding heat generated by the welding current of 9 kA is close to that of the 440th welded joint. These results further indicate that the effective heat input gradually decreases with the deterioration of the electrodes.
Table 5.
The geometries and mechanical properties of the additional welded joints produced by the higher welding currents of 9 kA and 9.6 kA.
4. Conclusions
- (1)
- The 1st welded joint is produced by the welding current of 8.4 kA with the welding time of 20 cycles, and electrode pressure of 0.3 MPa displays good welding quality. Its peak load is 12.43 kN, the maximum displacement is 5.36 mm, and the failure energy is 56.39 J. Its HAZ width is 6.62 mm, with the nugget height of 2 mm, the nugget diameter of 5.83 mm, and nugget area of 11.58 mm2. The microstructure in the FZ consists of lath martensite, polygonal ferrite, grain boundary ferrite, Widmanstatten ferrite, and bainite.
- (2)
- The obtained regression models correlating the weld number with the mechanical properties of the welded joints indicate that they also decrease with the weld numbers. The peak load of the 704th weld reduces to 41.19% of the initial strength.
- (3)
- The electrode diameter displays a parabolic functional relationship with the weld number and its Adj R2 is 0.9855. The percentage of Cu on the surface of the electrode decreases from 97.51% to 28.44%, while the percentages of O, Fe, and Zn increase a lot.
- (4)
- The weld attributes of the welded joints produced by the welding current of 9 kA and the deteriorated electrodes are close to those of the 440th welded joint, while the welding quality of the weld produced by the welding current of 9.6 kA with the deteriorated electrodes is comparable to that of the 1st weld.
Author Contributions
Conceptualization, D.Z.; data curation, L.G. and Y.B.; formal analysis, N.V.; funding acquisition, D.Z.; investigation, L.R. and Y.B.; methodology, L.R.; validation, L.G.; writing—original draft, D.Z.; writing—review and editing, N.V. and Y.B.; All authors have read and agreed to the published version of the manuscript.
Funding
This investigation is supported by the Russian Science Foundation (22-29-20095).
Institutional Review Board Statement
Not applicable.
Informed Consent Statement
Not applicable.
Data Availability Statement
Not applicable.
Conflicts of Interest
The authors state no conflict of interest among each other.
References
- Zhao, D.; Ivanov, M.; Wang, Y. An investigation of the laser welding process for dual-phase steel via regression analysis. IOP Conf. Ser. Mater. Sci. Eng. 2020, 969, 012094. [Google Scholar] [CrossRef]
- Mathiszik, C.; Zschetzsche, E.; Reinke, A.; Koal, J.; Zschetzsche, J.; Füssel, U. Magnetic characterization of the nugget microstructure at resistance spot welding. Crystals 2022, 12, 1512. [Google Scholar] [CrossRef]
- Đurić, A.; Milčić, D.; Burzić, Z.; Klobčar, D.; Milčić, M.; Marković, B.; Krstić, V. Microstructure and fatigue properties of resistance element welded joints of DP500 steel and AW 5754 H22 aluminum alloy. Crystals 2022, 12, 258. [Google Scholar] [CrossRef]
- Funakawa, Y.; Nagataki, Y. High strength steel sheets for weight reduction of automotives. JFE Tech. Rep. 2019, 24, 1–5. [Google Scholar]
- Yaacoubi, S.; Dahmene, F.; El Mountassir, M.; Bouzenad, A.E. A novel AE algorithm-based approach for the detection of cracks in spot welding in view of online monitoring: Case study. Int. J. Adv. Manuf. Technol. 2021, 117, 1807–1824. [Google Scholar] [CrossRef]
- Pawar, S.; Singh, A.K.; Kaushik, L.; Park, K.S.; Shim, J.; Choi, S.H. Characterizing local distribution of microstructural features and its correlation with microhardness in resistance spot welded ultra-low-carbon steel: Experimental and finite element characterization. Mater. Charact. 2022, 194, 112382. [Google Scholar] [CrossRef]
- Hayat, F. Resistance spot weldability of dissimilar materials: BH180-AISI304L steels and BH180-IF7123 steels. J. Mater. Sci. Technol. 2011, 27, 1047–1058. [Google Scholar] [CrossRef]
- Alenius, M.; Pohjanne, P.; Somervuori, M.; Hanninen, H. Exploring the mechanical properties of spot welded dissimilar joints for stainless and galvanized steels. Weld. J. 2006, 85, 305–313. [Google Scholar]
- Mirzaei, F.; Ghorbani, H.; Kolahan, F. Numerical modeling and optimization of joint strength in resistance spot welding of galvanized steel sheets. Int. J. Adv. Manuf. Technol. 2017, 92, 3489–3501. [Google Scholar] [CrossRef]
- Hamidinejad, S.M.; Kolahan, F.; Kokabi, A.H. The modeling and process analysis of resistance spot welding on galvanized steel sheets used in car body manufacturing. Mater. Des. 2012, 34, 759–767. [Google Scholar] [CrossRef]
- Yurci, C.; Akdogan, A.; Durakbasa, M.N. Determination of Resistance Spot Welding Parameters to Guarantee Certain Strength Values Including Regression Analysis; Lecture Notes in Mechanical Engineering; Springer: Cham, Switzerland, 2019; pp. 62–73. [Google Scholar]
- Soomro, I.A.; Pedapati, S.R.; Awang, M. A review of advances in resistance spot welding of automotive sheet steels: Emerging methods to improve joint mechanical performance. Int. J. Adv. Manuf. Technol. 2022, 118, 1335–1366. [Google Scholar] [CrossRef]
- Enrique, P.D.; Al Momani, H.; Di Giovanni, C.; Jiao, Z.; Chan, K.R.; Zhou, N.Y. Evaluation of electrode degradation and projection weld strength in the joining of steel nuts to galvanized advanced high strength steel. J. Manuf. Sci. Eng. 2019, 141, 104501. [Google Scholar] [CrossRef]
- Kiselev, A.S.; Slobodyan, M.S. Effects of electrode degradation on properties of small-scale resistance spot welded joints of E110 alloy. Mater. Sci. Forum 2019, 970, 227–235. [Google Scholar] [CrossRef]
- Mathiszik, C.; Köberlin, D.; Heilmann, S.; Zschetzsche, J.; Füssel, U. General approach for inline electrode wear monitoring at resistance spot welding. Processes 2021, 9, 685. [Google Scholar] [CrossRef]
- Das, T.; Paul, J. Interlayers in resistance spot-welded lap joints: A critical review. Metallogr. Microstruct. Anal. 2021, 10, 3–24. [Google Scholar] [CrossRef]
- Emre, H.E.; Bozkurt, B. Effect of Cr-Ni coated Cu-Cr-Zr electrodes on the mechanical properties and failure modes of TRIP800 spot weldments. Eng. Fail. Anal. 2020, 110, 104439. [Google Scholar] [CrossRef]
- Mahmud, K.; Murugan, S.P.; Cho, Y.; Ji, C.; Nam, D.; Park, Y.D. Geometrical degradation of electrode and liquid metal embrittlement cracking in resistance spot welding. J. Manuf. Process. 2021, 61, 334–348. [Google Scholar] [CrossRef]
- Malmir, M.; Sheikhi, M.; Mazaheri, Y.; Elmkhah, H.; Usefifar, G.R. Substantial electrode life enhancement in resistance spot welding of galvanised steels through nanolayered multi-layer CrN/(Cr, Al) N coating. Surf. Eng. 2021, 37, 1163–1175. [Google Scholar] [CrossRef]
- Zhao, D.; Wang, Y.; Liang, D.; Zhang, P. Modeling and process analysis of resistance spot welded DP600 joints based on regression analysis. Mater. Des. 2016, 110, 676–684. [Google Scholar] [CrossRef]
- Böhne, C.; Meschut, G.; Biegler, M.; Rethmeier, M. Avoidance of liquid metal embrittlement during resistance spot welding by heat input dependent hold time adaption. Sci. Technol. Weld. Join. 2020, 25, 617–624. [Google Scholar] [CrossRef]
- Ashiri, R.; Marashi, S.P.H.; Park, Y.D. Weld processing and mechanical responses of 1-GPa TRIP steel resistance spot welds. Weld. J. 2018, 97, 157–169. [Google Scholar]
- Böhne, C.; Meschut, G.; Biegler, M.; Frei, J.; Rethmeier, M. Prevention of liquid metal embrittlement cracks in resistance spot welds by adaption of electrode geometry. Sci. Technol. Weld. Join. 2020, 25, 303–310. [Google Scholar] [CrossRef]
- Sravanthi, S.S.; Acharyya, S.G.; Phani Prabhakar, K.V.; Padmanabham, P.; Padmanabham, G. Integrity of 5052 Al-mild steel dissimilar welds fabricated using MIG-brazing and cold metal transfer in nitric acid medium. J. Mater. Process. Technol. 2019, 268, 97–106. [Google Scholar]
- American Welding Society (AWS) D8 Committee on Automotive Welding AWS D8.9M. Test Methods for Evaluating the Resistance Spot Welding Behavior of Automotive Sheet Steel Materials, 3rd ed.; American Welding Society (AWS): Miami, FL, USA, 2012.
- Zhao, D.; Vdonin, N.; Radionova, L.; Glebov, L.; Bykov, V. Optimization of post-weld tempering parameters for HSLA 420 steel in resistance spot welding process. Int. J. Adv. Manuf. Technol. 2022, 123, 1811–1823. [Google Scholar] [CrossRef]
- Trzaska, J. Calculation of critical temperatures by empirical formulae. Arch. Metall. Mater. 2016, 61, 981–986. [Google Scholar] [CrossRef]
- Salimi Beni, S.; Atapour, M.; Salmani, M.R.; Ashiri, R. Resistance spot welding metallurgy of thin sheets of zinc-coated interstitial-free steel. Metall. Mater. Trans. A 2019, 50, 2218–2234. [Google Scholar] [CrossRef]
- Zhao, D.; Bezgans, Y.; Vdonin, N.; Kvashnin, V. Mechanical performance and microstructural characteristic of gas metal arc welded A606 weathering steel joints. Int. J. Adv. Manuf. Technol. 2022, 119, 1921–1932. [Google Scholar] [CrossRef]
- Hajiannia, I.; Shamanian, M.; Atapour, M.; Ashiri, R.; Ghassemali, E. The assessment of second pulse effects on the microstructure and fracture behavior of the resistance spot welding in advanced ultrahigh-strength steel TRIP1100. Iran. J. Mater. Sci. Eng. 2019, 16, 79–88. [Google Scholar]
- Valizadeh, B.; Mansouri, M. Dissimilar DP780/DP980 resistance spot welded joints: Microstructure, mechanical properties and critical diameter. J. Adv. Mater. Process. 2021, 9, 3–10. [Google Scholar]
- Ravi, A.M.; Kumar, A.; Herbig, M.; Sietsma, J.; Santofimia, M.J. Impact of austenite grain boundaries and ferrite nucleation on bainite formation in steels. Acta Mater. 2020, 188, 424–434. [Google Scholar] [CrossRef]
- Kim, J.W.; Murugan, S.P.; Kang, N.H.; Park, Y.D. Study on the effect of the localized electrode degradation on weldability during an electrode life test in resistance spot welding of ultra-high strength steel. Korean J. Met. Mater. 2019, 57, 715–725. [Google Scholar] [CrossRef]
- Ibáñez, D.; García, E.; Soret, J.; Martos, J. Real-time condition monitoring system for electrode alignment in resistance welding electrodes. Sensors 2022, 22, 8412. [Google Scholar] [CrossRef] [PubMed]


Disclaimer/Publisher’s Note: The statements, opinions and data contained in all publications are solely those of the individual author(s) and contributor(s) and not of MDPI and/or the editor(s). MDPI and/or the editor(s) disclaim responsibility for any injury to people or property resulting from any ideas, methods, instructions or products referred to in the content. |
© 2022 by the authors. Licensee MDPI, Basel, Switzerland. This article is an open access article distributed under the terms and conditions of the Creative Commons Attribution (CC BY) license (https://creativecommons.org/licenses/by/4.0/).