Abstract
Hexagonal close-packed (HCP) magnesium alloys are widely used in automotive and aerospace industries due to their low density and high specific-strength. Their applicability is mainly restricted due to poor formability and pronounced plastic anisotropy. The formability is usually improved by altering the chemistry (adding rare-earth elements like Y) or modulating the microstructure (e.g., grain refinement). However, grain refinement alone cannot yield the desired ductility, and the scarcity of rare-earth elements also limits the extent to which the alloying strategy can be used. To overcome these issues, in this work, it is proposed that the formability of Mg alloys can be improved by combining the grain refinement and alloying approaches. To quantitively explore this possibility, a crystal-plasticity-based constitutive model, which is sensitive to both alloying concentration and grain sizes, is developed. To demonstrate, the model is applied to study the combined effect of Y content and grain size on the mechanical responses of Mg alloy. The calculations are used to build maps of plastic anisotropy measures, such as tension–compression asymmetry ratio and Lankford coefficients, for a wide range of Y content and grain sizes. From these maps, the grain size that would yield the desired performance of Mg alloy for a fixed Y content can be identified. This work provides an accelerated pathway to optimize both the microstructure and chemistry simultaneously to achieve formability and to reduce the dependence on alloying.
1. Introduction
Magnesium alloys are of great significance to automotive and aerospace industries owing to their exceptionally low density and high specific strength [1,2,3,4,5]. However, the low ductility and poor formability of Mg alloys at room temperature limit their widespread applicability [6,7]. The poor formability is a consequence of intrinsic plastic anisotropy of magnesium alloys, and it is mainly governed by the following: (1) the low symmetry hexagonal close-packed (HCP) crystal structure enforces the activation of slip in the crystallographic planes and directions with significantly different atomic (packing) densities. In HCP Mg, basal , prismatic and pyramidal slip modes are commonly activated [8,9]. The activation barrier or critical resolved shear stress (CRSS) for these slip modes is significantly different [10,11,12]. For instance, the CRSS value for the activation of basal , prismatic , and pyramidal in pure Mg is 3.3 MPa, 35.7 MPa, and 86.2 MPa, respectively [13]. Thus, the plastic response of a crystal oriented for a particular slip mode, say basal , will be significantly different compared to other crystal orientations, for example, a crystal oriented for pyramidal slip activity. This disparity in the CRSS values among the slip modes yields a noticeable anisotropy in the macroscopic responses. (2) Due to low symmetry, the slip modes alone cannot accommodate any arbitrary deformation and thus leads to the activation of deformation twinning [8,14,15,16,17,18,19,20,21,22,23,24]. Unlike slip, deformation twins are direction-dependent, and thus their participation can enhance plastic anisotropy of the material [12]. (3) Commonly, thermo-mechanical processes, e.g., hot rolling and extrusion, are used to shape Mg alloys. These wrought processes improve the strength compared to cast alloys. At the same time, the thermo-mechanical processes develop strong basal texture, thus elevating plastic anisotropy [25,26,27,28,29]. Understanding and developing an approach to reduce plastic anisotropy is critical to advancing the applicability of Mg alloys.
The above-mentioned underlying reasons (1–3) suggest that the formability of magnesium alloys can be improved by reducing the dissimilarities in the CRSS among slip modes and suppressing twinning. Many efforts have been made over a few decades by material scientists to reduce the plastic anisotropy of Mg alloys [27,30,31,32,33,34,35,36,37,38,39,40,41,42,43,44]. Grain refinement, texture modification, and alloying are the most commonly used techniques to control the plastic anisotropy.
Reducing the grain size has been found to suppress twinning activity and aid in developing a homogeneous microstructure and improving formability [30,31,32,45,46]. For example, Zeng et al. [32] showed that room temperature formability could be improved significantly when the grain size is reduced from tens of microns to the sub-micron range. Grain refinement of magnesium alloys has been studied for several decades [47,48,49,50,51,52,53,54]. For the most part, grain refinement in Mg alloys has been achieved via controlling the cooling rate in the casting process since it modulates the grain nucleation kinetics, adding grain refiners like carbon inoculation, and alloying with elements such as strontium and calcium. In addition, an appropriate combination of severe plastic deformation and heat treatments, such as equal channel angular extrusion (ECAE) and subsequent annealing and aging, can help modulate grain sizes and ultimately improve ductility [33,34,35]. However, achieving polycrystalline magnesium alloys with sub-micron grain sizes can be challenging. Recently it was shown that spark plasma sintering can successfully make pure nanocrystalline Mg and the reported large strain to failure from compression testing (>120%) at least suggests that greater formability is possible with very fine grain sizes [55].
The crystallographic texture modification, specifically texture weakening, via alternative metal processing techniques, such as asymmetric rolling and equal channel angular pressing, have been shown to improve the formability by reducing the twinning activity [26,56]. Lastly, the alloying, notably the addition of rare-earth elements (Y, Ce, Nd, La, etc.), has been reported to lower plastic anisotropy significantly [12,27,36,37,38,57,58]. The addition of rare-earth elements weakens the crystallographic texture of the alloy [38,39,40,41,42,43,44] and enhances the activation of non-basal dislocations [42,43,59,60,61]. Specifically, the addition of Y facilitates the dissociation of dislocations on the type-II pyramidal plane. It increases the range of the potential energy surface and provides different gliding pathways for dislocation motion [62]. Moreover, the addition of Y increases the CRSS for basal slip more than that of non-basal slip modes. This reduces the dissimilarities in the CRSS among slip modes [63,64,65]. Further, the addition of rare-earth elements suppresses twinning and thus helps to control the plastic anisotropy [39,57,58,66,67,68,69].
Among these three strategies (i.e., grain refinement, texture control, and alloying), the alloying addition is known to be a viable way to improve the formability. However, the rare-earth elements are not abundant and thus limit the applicability of Mg alloys. To overcome this issue, this work hypothesizes that the improved formability of Mg alloys can be realized readily by combining the alloying method with the grain refinement strategy. That is, the minimum alloying concentration needed to improve the formability of Mg alloys can be reduced by properly tuning the grain size. To validate the proposed hypothesis, a crystal plasticity based constitutive model is developed, which directly account for the effects of grain size and alloying on the plastic deformation of crystals. The effect of grain sizes on slip and twinning is modeled through directional-dependent micro-Hall–Petch equations [70]. Following the classical works of [71,72,73], the alloying concentration is directly related to the strength terms for each slip and twinning mode. It allows us to directly capture the role of alloying on dislocation slip motion and deformation twinning. This constitutive model is implemented within the visco-plastic self-consistent (VPSC) crystal plasticity framework [74]. Using this model, plastic response of Mg-Y binary alloy is calculated for tension and compression for a wide range of Y content and grain sizes. From those model calculations, maps of plastic anisotropy measures such as tension–compression asymmetry and Lankford coefficients are built in Y-content and grain-size space. These maps enable selection of the grain size for a fixed Y content that would provide the desired performance.
The article is structured as follows: In Section 2.1, the constitutive model that is sensitive to the alloying concentration and grain size is presented. Experimental data for model calibration and model setup are discussed in Section 2.2 and Section 2.3. The model-predicted stress–strain response and twin volume fraction of Mg-Y alloys are presented in Section 3.1 along with the experimental values from the literature. The maps of tension–compression asymmetry and Lankford coefficient are developed in Section 3.2 and Section 3.3. The effect of loading direction and initial texture on these maps are investigated in Section 3.4 and Section 3.5. The implications of this work are discussed in Section 3.6. Finally, the key findings are summarized in Section 4.
2. Crystal Plasticity Modeling
In this work, computationally efficient visco-plastic self-consistent (VPSC) modeling framework is employed [74]. A comprehensive description of the VPSC model can be found in [75]. The VPSC modeling framework describes the polycrystal as a collection of orientations (grains) with associated volume fractions chosen to represent the initial texture of the aggregate. Each grain is regarded as a visco-plastic inclusion embedded in, and interacting with, a “homogeneous effective medium”, which has the average properties of the polycrystalline aggregate. The macroscopic response of the polycrystal results from the contribution of each grain, and the visco-plastic compliance of the homogeneous effective medium are given by a self-consistent condition applied on the grain averages.
At the single crystal level, the plastic strain rate is assumed to be accommodated by individual shear contributions of all active slip and twinning systems in the grain, and thus, it is written as:
Here, is the symmetric Schmid tensor, and is the shear rate on system . The denotes a normalized shear rate, is the inverse strain-rate sensitivity, and is the critical resolved shear stress (CRSS) required to activate system . Following the works of [70,76,77], the uncoupled twin-matrix version of the composite grain (CG) model is considered for the simulation of deformation twinning. Unlike the predominant twin reorientation (PTR) scheme, the CG model accounts for the parent matrix and twin domain volume fractions, their interaction, and evolution with plastic deformation. Furthermore, the CG model will help to capture the effect of directional dislocation/twin boundary interactions on strain hardening responses.
2.1. Constitutive Model Sensitive to Microstructure and Alloying
The initial CRSS value and its evolution for an individual slip system is explicitly expressed in terms of microstructure and alloying. Here, the microstructure refers to the grain size and dislocation densities. Accordingly, the CRSS value for each slip system is expressed as
where is the initial intrinsic slip resistance (Peierls stress). The and are the strengthening terms due to the presence and interactions of forest dislocations and dislocation substructures, respectively. (We refer the reader to [78] for a detailed description of these two strengthening terms.) We only briefly summarized here the model here so this paper is self-contained. Following the classical Taylor law, the strength due to forest dislocations is written as
where and are the Burgers vector magnitude and forest dislocation density of slip system , respectively. The is the effective isotropic shear modulus of the material. The coefficient is a scalar dislocation-interaction parameter, and it commonly ranges between [79]. In this work, it is assumed to be 0.9. The term is a latent hardening matrix for the interactions between dislocations from different slip systems s and s′. Following the work [80], the strength due to dislocation substructures is written as
Here, represents the dislocation density in the sub-grain structures. Both and evolve through thermally activated generation and recovery processes, and debris creation. Appendix A contains a comprehensive description of the dislocation density evolution laws.
The term in Equation (2) quantifies the resistance to dislocation motion imposed by internal boundaries and here, follows the Hall–Petch effect, which states that the resistance is inversely related to the square root of the spacing between boundaries. In HCP Mg polycrystals, the mean free path for dislocation motion defined between boundaries can be constrained by not only grain boundaries but also twin boundaries. Average grain sizes and twin thicknesses are related to the mean free path of dislocations. Based on this, the resistance is expressed as
In twin-free grains, the average grain size is used as a mean free path for dislocation motion, whereas in the twinned grains, following the works of [70,76,77] for the employed CG model, directional mean free path is used. The distance is calculated based on the specific twin variant and slip system s. Detailed description of the term can be found in [76]. Finally, the and denote the Hall–Petch coefficients of slip system s, for the grain and twin boundaries, respectively.
The term in Equation (2) represents the solid solution strengthening term. Here, this term specifically quantifies the increase in strength due to the addition of Y to the host Mg matrix. Several seminal works have been reported in the literature on the topic of solid solution strengthening, namely from Fleischer [81], Friedel [82], Mott and Nabarro [73,83], and Labusch [71]. The most common observation is that, in a dilute limit, the increase in strength is proportional to the solute concentration with a power exponent of n, which depends on the representation of solute atoms and their interaction with dislocations. Two theories, i.e., strong and weak pinning, are proposed to represent the solutes and their interactions. The first strong-pinning theory is proposed by Friedel and Fleischer, in which solute atoms are treated as independent point obstacles, and thus leads to a power of ½. On the other hand, Mott and Labusch proposed a weak-pinning model that considers the collective interaction of many solutes around the dislocation, which relates the solute concentration to the strength with a power of 2/3. Several studies critically analyzed and discussed the limits and suitability of both theories [84,85,86,87,88,89]. It has been well reported that the weak-pinning model with an exponent of 2/3 describes better the solute effect on strength in magnesium alloys with the additions of Al, Zr, Cd, and Y [87,89]. Further, the solute strengthening is anisotropic, i.e., the effect of a particular solute atom is likely to be different for basal, prismatic, and pyramidal slip systems [89,90,91,92,93,94]. Thus, in this work, the solid solution strengthening term is calculated for each slip mode separately. Based on these observations, the is expressed as
Here, is the atomic concentration of Y, and is the pre-factor for solute strengthening of slip system s.
Similar to slip, the CRSS for the twinning process also accounts for the effect of grain size and solute concentration along with intrinsic internal resistance. The CRSS for twin system t is written as
Here, is the intrinsic barrier for twin nucleation and growth. and are the strength due to Hall–Petch effect and solid solution strengthening defined in Equations (5) and (6), respectively.
2.2. Experimental Data for Model Calibration
The experimental measurements reported in [69] for Mg-Y binary alloys with four different Y content are used to calibrate the model parameters. In [69], Mg alloys with 0.2, 0.6, 1.0, and 3.0 wt.%Y are prepared from high-purity Mg. The equivalent Y content in the atomic concentration percentage is 0.05%, 0.16%, 0.28%, and 0.84%. Hereafter, these alloys are referred as Mg-0.05Y, Mg-0.16Y, Mg-0.28Y, and Mg-0.84Y. In [69], the prepared alloys are homogenized and hot-rolled at 500 °C. To achieve a similar grain size in all four alloys, the recrystallization heat treatment process was performed at different temperatures and duration. Specifically, Mg-0.05Y, Mg-0.16Y, Mg-0.28Y, and Mg-0.84Y alloys were recrystallized at 400 °C for 5 min, 400 °C for 10 min, 400 °C for 10 min, and 450 °C for 10 min, respectively. It leads to an average grain size of 35, 21, 22, and 26 in Mg-0.05Y, Mg-0.16Y, Mg-0.28Y, and Mg-0.84Y alloys, respectively. A previous detailed microstructural analysis [69] confirms that the second-phase precipitates are not present in these alloys, and thus the added Y is only distributed in the form of solid solution. Accordingly, these Mg-Y alloys are suitable for studies on the effect of Y through solid solution. As expected, the addition Y weakens the rolling basal texture. The initial texture is presented in Figure 2 of [69] and is not repeated here for the sake of compactness. The initial textures for each Mg-Y alloy are, however, different and the initial basal texture weakens with an increase in Y content. In their work, all four alloys are subjected to compression along the rolling (RDC) and normal (NDC) directions, and tension along the rolling direction (RDT). Cuboidal compression samples with the dimensions of mm, and dog-bone shaped tensile samples with a gauge length of 20 mm and a rectangular cross-section of mm were machined from the hot rolled sheets using Electrical Discharge Machining (EDM) process. In the compression sample, the long dimension aligns with the compression axis (RD or ND). Using a servo-hydraulic universal testing machine, the uniaxial tensile and compressive tests are performed at a constant strain rate of s−1. To measure the twin volume fraction, mechanical tests were interrupted at 5% strain for microstructural analysis. The macroscopic stress–strain response and twin volume fraction at 5% strain are measured for all three loading conditions and are shown in Figure 3 and Table 4, respectively, of [69]. These experimental measurements are used here for the model calibration.
2.3. Model Setup
Alloying addition has been shown to alter the elastic moduli and lattice parameters of Mg alloys [95,96,97,98,99]. Since this work aims to capture the effect of Y content on the deformation behavior of Mg alloys, one needs to use the appropriate material properties. Accordingly, the following expressions are derived in terms of Y content from the work of Peng et al. [99]: , , and . Here, refers to the Y concentration in at.%. E is the Youngs modulus in GPa. and are the lattice parameters of HCP crystal. By assuming the Poisson ratio is 0.3, the μ is calculated for every Y content, and will be used in Equations (3)–(5).
In the model calculations, plasticity is assumed to be accommodated by basal , prismatic , and pyramidal slip modes along tensile twinning. The actual initial texture and the grain sizes reported in [69] is used in the model calculations. The experimentally reported stress–strain response and twin volume fraction data of Mg-0.16Y and Mg-0.84Y alloys are used to calibrate the dislocation-density-based strain hardening model parameters and the coefficients for the Hall–Petch type strength equations and solute strengthening. The experimental data for other two alloys, i.e., Mg-0.05Y and Mg-0.28Y, are reserved for testing the ability of the model to extrapolate from and interpolate between the regimes. The calibrated model parameters are listed in Table 1. Note that, since the constitutive model is directly expressed in terms of Y content, a single parameter set is obtained for all four alloy systems.

Table 1.
Calibrated and validated parameters of the employed dislocation-density-based hardening model with explicit grain size and Y-content dependence. Here, is the initial resistance (Equations (2) and (7)). , , and are the dislocation generation rate (Equation (A3)), drag stress (Equation (A2)), and normalized activation enthalpy (Equation (A2)). and are the Hall–Petch coefficients for grain and twin boundaries, respectively (Equation (5)). is the solute strengthening coefficient (Equation (6)). is the pre-factor twin-induced reduction in dislocation trapping rate (Equation (A3)).
3. Results and Discussion
3.1. Model Parameter Calibration and Validation
Figure 1 shows the model-predicted stress–strain responses for all four alloy systems along with the experimental data from [69]. Here, the solid lines are the model predictions, and the lines with symbols the experiments. Figure 1 clearly shows that the model correctly captures the experimental observations for all three loading conditions and, in particular, the two cases Mg-0.05Y and Mg-0.28Y, not used in the calibration. More importantly, the model captures the sudden increase in the strain hardening rate seen in the rolling direction compression test, which is due to twinning. The model-calculated evolution of twin volume fraction is shown in Figure 2. As expected, due to the initial basal texture, the twinning is profound in the rolling direction compression test compared to other loading scenarios. Also, the increase in Y content decreases the twinning activity, which is consistent with the experimental literature [40,95,100,101,102,103]. For a quantitative comparison, the experimentally measured twin volume fraction at 5% strain is also shown in Figure 2. The model predicted the twin volume fraction agrees with the experimental values for all four Mg-Y alloys.
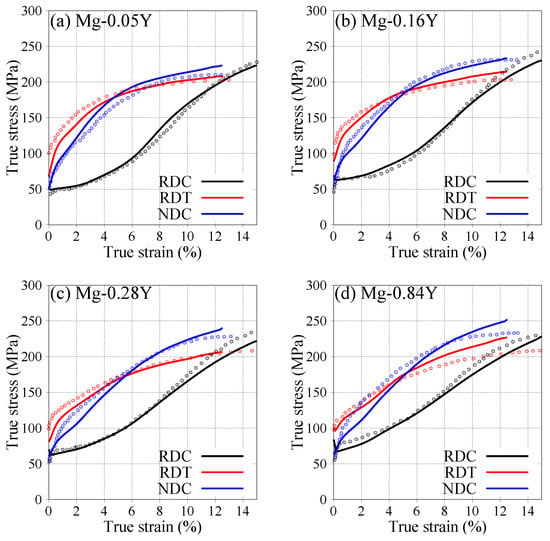
Figure 1.
Model (solid)-predicted stress–strain response for all three loadings (RDC, RDT, and NDC) along with the experimental data (symbols) for (a) Mg-0.05%Y, (b) Mg-0.16%Y, (c) Mg-0.28%Y, and (d) Mg-0.84%Y alloy. Here, RDC, RDT, and NDC refer to the rolling direction compression, rolling direction tension, and normal direction compression, respectively. Experimental values are taken from [69]. Only Mg-0.16Y and Mg-0.84Y alloys are used for model calibration and other two cases are used for model validation.
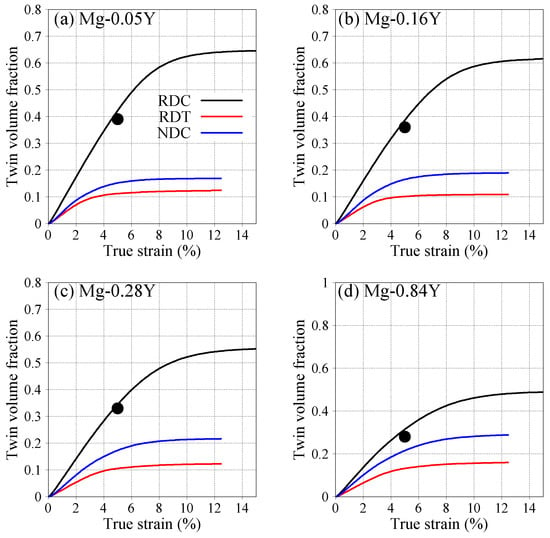
Figure 2.
Evolution of twin volume fraction as a function of imposed strain for all three loading (RDC, RDT and NDC) for (a) Mg-0.05%Y, (b) Mg-0.16%Y, (c) Mg-0.28%Y, and (d) Mg-0.84%Y alloy. Here, RDC, RDT, and NDC refer to the rolling direction compression, rolling direction tension, and normal direction compression, respectively. The symbols (black dot) correspond to the experimentally measured twin area fraction from [69].
The employed crystal plasticity model provides the relative contribution of each slip and twin mode to the macroscopic response of the material. For the sake of compactness, the evolution of relative activities of basal , prismatic and pyramidal slip modes and tensile twinning are shown only for the Mg-0.05Y case in Figure 3. The subfigures (a) and (b) correspond to the matrix grain and twin domains, respectively. Here, different colors represent different loading conditions (black: RDC; red: RDT; blue: NDC), and the different line/symbol types refer to different deformation modes. For all three loading conditions (RDC, RDT, and NDC), basal slip dominates in the early stages of deformation. At the same time, in RDC, tensile twin activity is also significant along with basal slip. This leads to a gradual increase in the fraction twin domains in the polycrystal. At higher strain, the pyramidal starts to contribute to the deformation along with basal slip. In the newly formed twin domains also, basal slip dominates. In the case of RDT, the contribution of prismatic gradually increases with strain. For instance, at 12% strain, the prismatic accommodates around 60% of the imposed deformation. The formation of tensile twin in this case is not significant. Finally, in the case of NDC, the pyramidal slip contribution increases with strain. At 12% strain, around 50% of the imposed strain is accommodated by pyramidal slip along with basal . Similar observations were found for the other Mg-Y alloy systems. Furthermore, the observed effect of Y content on the mechanical responses is primarily due to the solid solution strengthening term (Equation (6)). These Y-content-induced changes in the lattice constants (c and a) and elastic moduli do not play a significant role on the overall mechanical responses and twinning activity.
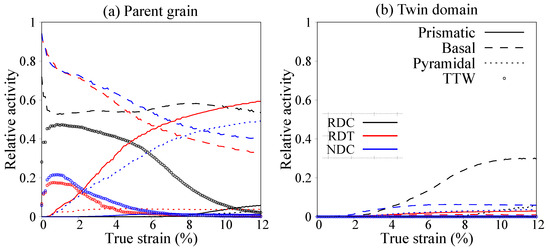
Figure 3.
Relative contribution of basal, prismatic, and pyramidal slip modes, and tensile twinning in the (a) parent grain and (b) newly formed twinned grains for Mg-0.05%Y alloy. Here, the color scheme represents the loading condition, and curve symbols denote different deformation modes. For example, the black, red, and blue curves correspond to RDC, RDT, and NDC, respectively. The solid, dashed, dotted, and circles correspond to prismatic, basal, pyramidal, and tensile twins.
Overall, the model developed here correctly predicts the effect of texture, grain size, and Y content on the stress–strain response and twin volume fraction. Since a single parameter set is used for all four alloys, one can directly employ this model to predict the mechanical response of Mg-Y binary alloys for a wide range of Y content and grain sizes.
3.2. Mapping of Tension–Compression Asymmetry
Tension–compression asymmetry at the yield point is widely considered as one measure of plastic anisotropy and, relatedly, the formability of the material. In this section, the effect of Y content and grain size on the yield stress tension–compression (TC) asymmetry is studied. First, the model is used to simulate the tensile and compressive responses of Mg-Y binary alloy for a wide range of Y content, varying from 0.0 to 1.5 at.% in steps of 0.05 at.%, and of the grain sizes, 0.5 to 30 in steps of 0.5 . These ranges lead to a total of 1800 combinations of Y content and grain sizes. Note that the considered Y-content range is insufficient for developing second-phase precipitates in the Mg-Y alloy [104,105]. In the calculations, a typical strong rolling basal texture is selected as an initial texture (see the first row of Figure 4). We note the addition of Y weakens the commonly observed strong basal texture and improves the performance of the material [38,39,40,41,42,43,44]. However, to best isolate grain size and Y-content effects, the same basal texture for pure Mg is used for all cases. Since this basal texture used is stronger than that typical of an Mg-Y alloy, it will provide a lower bound in the performance measures we calculate. Here, the calculations are performed for rolling direction tension (RDT) and compression (RDC).
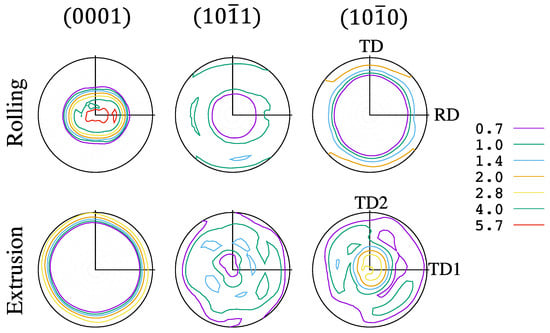
Figure 4.
Considered initial rolling and extrusion texture for the calculations.
From the model calculations, the ratio between the yield strengths of RDT and RDC, referred to as tension–compression (TC) asymmetry, is calculated and plotted in Figure 5. A few contour lines of TC asymmetry are also plotted. The TC asymmetry for the full range of Y content and grain size considered ranges from ~1.0 to ~1.52. As one expects, for a fixed grain size, the TC asymmetry decreases with an increase in the Y content. For example, for the grain size of 20 , the TC asymmetry reduces from 1.43 to 1.18 for an increase in Y content from 0.0 to 1.5 at.%. A similar effect is observed when the grain size is varied. The TC asymmetry decreases with grain size. For example, at 0.3 at.%Y content, the TC asymmetry decreases from ~1.47 to ~1.05 for a reduction in grain size from 30 to 0.5 . The distribution shown in Figure 5 suggests that both the grain size and Y content significantly affect the TC asymmetry of Mg-Y alloys.
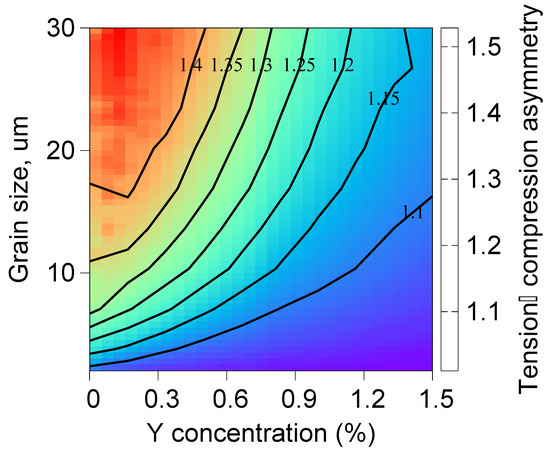
Figure 5.
Distribution of rolling direction (RD) yield stress tension–compression asymmetry in the grain size and Y-content space.
The TC asymmetry discussed above only provides partial information, i.e., only the anisotropy in the yield stress. The plastic anisotropy, however, can evolve with the strain, as seen for instance in Figure 1. At times, the anisotropy in strain hardening rate is considered as a measure to quantify the anisotropic-deformation-mechanisms-induced rapid strain hardening or softening. In addition, the differences in ductility are employed as a measure to discuss the role of anisotropic plastic deformation on the formability of the HCP metals. To combine both, i.e., strain hardening and ductility, here, the product of strength and elongation (PSE) is calculated. This PSE is simply the toughness of the material, given by the area under the stress–strain curve. Figure 6 shows the TC asymmetry in the calculated PSE for the first 10% in macroscopic strain. The PSE TC asymmetry varies from ~1.05 to ~1.65. Similar to the TC asymmetry in yield stress, the Y content and grain size affect the TC asymmetry in PSE in a nonlinear fashion. Increases in Y content and reductions in grain size both significantly lower the PSE TC asymmetry.
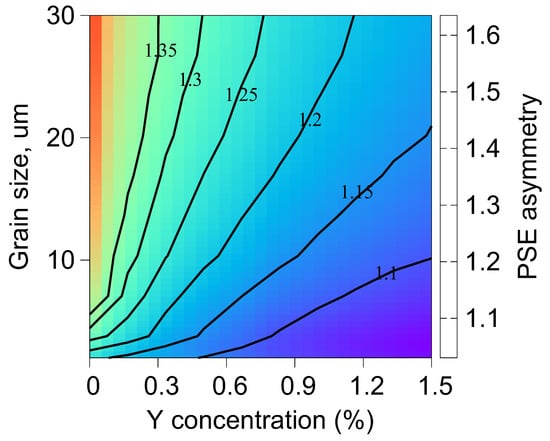
Figure 6.
Model calculated asymmetry in the product of strength and elongation (PSE) between tension and compression as a function of grain size and Y content. Here, the deformation is imposed along the rolling direction (RD), and PSE is calculated until 10% strain.
3.3. Formability: Planar Anisotropy
In addition to the TC asymmetry, the Lankford coefficient is also widely used to quantify the plastic anisotropy and the formability of rolled plates or sheet metals. For uniaxial tensile loading, the Lankford coefficient is defined as the ratio of the in-plane strain (i.e., strain in the width direction) to through-thickness strain at a particular longitudinal strain. Here, the Lankford coefficient for tensile loading along the rolling direction is considered and determined using the strain in the transverse direction and plate normal direction. In practice, the Lankford coefficient is commonly calculated at a macroscopic strain of 10 to 20%. Here, it is calculated at 10% macroscopic-imposed strain in the rolling direction. Figure 7 shows the Lankford coefficient map in Y-content and grain size space. The Lankford coefficient ranges from ~1.0 to ~1.45, and its distribution across the space is similar to that in TC asymmetry. The Lankford coefficient decreases with increasing Y content and decreasing grain sizes. Here, again, we find that plastic anisotropy and formability of Mg alloys can be improved significantly by altering Y content and grain size.
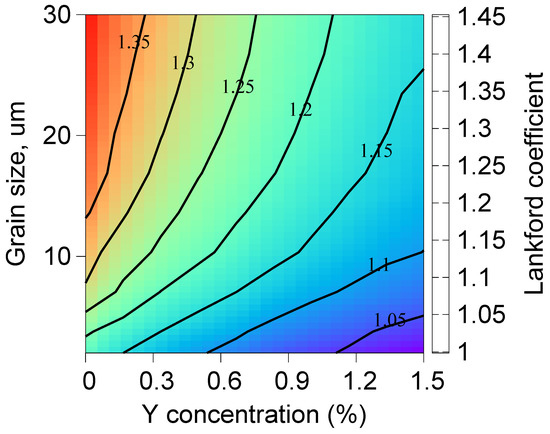
Figure 7.
The model-calculated distribution of the Lankford coefficient for tension along the rolling direction (RD) in the grain size and Y-content space.
3.4. Effect of Loading Direction on Plastic Anisotropy
In the previous sections, the RD is chosen as a loading direction to quantify the effects of Y content and grain size on plastic anisotropy. Due to the intrinsic non-symmetric nature of the crystallographic texture (see Figure 4), the loading directions can alter the plastic anisotropy measure maps. To assess the difference, in this section, maps of the plastic anisotropy measures for loading along the transverse direction (TD) are presented. Figure 8a,b show the TC asymmetry and Lankford coefficient maps, respectively, in the Y-content and grain size space for macroscopic loading along the TD for the initial rolled basal texture given in Figure 4. Qualitatively, the distributions of plastic anisotropic measures for TD loading exhibit a similar trend as observed for RD loading. However, the magnitude of the plastic anisotropy is less for the transverse direction loading compared to the rolling direction loading. TC asymmetry in TD ranges from ~1.0 to ~1.35, whereas TC asymmetry in RD ranges from ~1.0 to ~1.52.
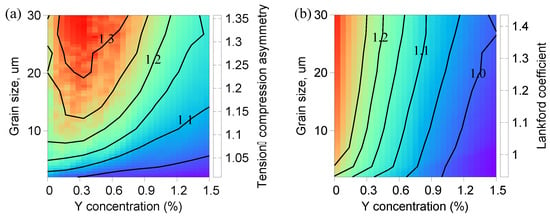
Figure 8.
Effect of grain size and Y content on (a) tension–compression asymmetry and (b) Lankford coefficient for transverse direction (TD) loading in Mg-Y alloys.
The underlying reason for the observed differences in the plastic anisotropy measures between the RD and TD loading is associated with the differences in the activation of deformation twinning. For example, the twin volume fraction at 10% macroscopic strain for pure Mg (i.e., 0% Y content) with a 10 micron grain size is 49.6% for RD compression and 43.0% for TD compression. This notable difference in the twinning activity is due to the slight differences in the initial orientation of grains with respect to loading direction (see Figure 4). Towards quantifying the effect, the maximum Schmid factor for tensile twinning among all six possible twin variants is calculated for both loading directions in Figure 9. It clearly reveals that the number of grains suitable for twinning is lower for TD compression than RD compression. Thus, we can expect less plastic anisotropy in TD loading than RD loading direction.
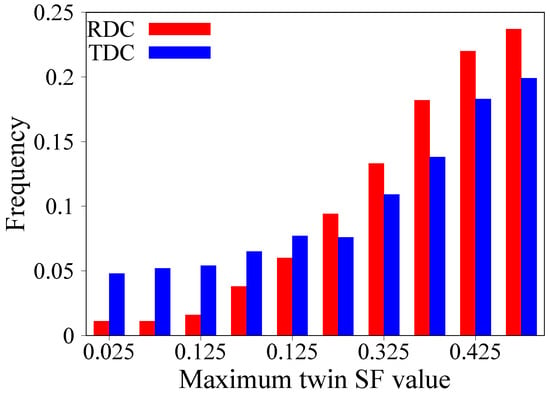
Figure 9.
The distribution of the maximum twin Schmid factor for compression along the rolling (RDC) and transverse (TDC) direction of the initial rolling texture is plotted in Figure 4.
3.5. Role of Texture on the Combined Y and Size Effect
Here, the role of initial texture on the foregoing anisotropy and formability maps is investigated. Like the rolling process, the extrusion process is also a commonly used metal-forming process. Thus, here, the typical extrusion-process-induced texture is selected, and it is shown in the bottom row of Figure 4. Because the initial texture is almost symmetric about the out-of-plane direction, the model calculations are performed for the loading direction TD1 only. Figure 10 presents the calculated TC asymmetry for the initial extrusion texture. First, the TC asymmetry distribution for the extrusion texture is very similar to that of the rolling texture given in Figure 5. The TC asymmetry similarly ranges from ~1.0 to ~1.55 and the trends are nearly the same with the TC asymmetry decreasing with increasing Y content and decreasing grain size. Second, the effect of grain size is relatively stronger for the extrusion texture compared to the rolling texture. This slight difference is also due to the differences in the twinning. For instance, at 10% macroscopic strain, the twin volume fraction for pure Mg with a 10 micron grain size is 59.0% for the extrusion texture, whereas it is 49.6% for the rolling texture. Thus, the effect of grain size on plastic anisotropy is stronger for the extrusion texture compared to the rolling texture.
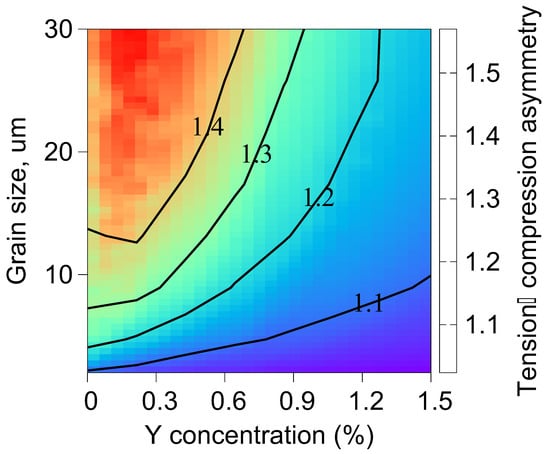
Figure 10.
The distribution of tension–compression asymmetry for the TD1 direction loading of the initial extrusion texture is given in Figure 4.
3.6. Implications of This Study
The common finding from this study on Mg-Y reveals that the plastic anisotropy decreases with an increase in Y content and a reduction in grain size. As mentioned in Section 1, it is often the case that the Y content cannot be increased significantly due to the limited availability of Y. On the other hand, the reduction in grain size alone may not be sufficient for achieving better performance. For example, to get TC asymmetry of, say, 1.1 in pure Mg, the grain size is supposed to be less than 0.5 micron. Achieving magnesium alloys with sub-micron-sized grains is highly challenging. The plastic anisotropy measures distribution shown in the Y-content and grain size space allows one to select a reasonable Y content and practically feasible grain size. For instance, the following combinations of Y content and grain sizes can yield 1.1 TC asymmetry: 0.6 at.% and 5.7 micron, 0.5 at.% and 4.8 micron, 0.3 at.% and 4.0 micron, and 0.2 at.% and 3.1 micron.
In this work, the added Y is assumed to be distributed homogeneously in Mg in solid solution. However, Y content is adjusted and heat treatments are often applied to form second-phase precipitates [102,106,107]. In that situation, part of the Y content will be segregated at the precipitates, and the remaining will be distributed in the Mg lattice as solutes. These precipitates will provide an additional strengthening mechanism to the material and also greatly affects the twinning process [108,109]. Thus, for such precipitate-strengthening alloys, one needs to explicitly account for the precipitates in the constitutive model, and the solute concentration used in Equation (6) needs to be corrected appropriately.
4. Conclusions
In this work, to capture the effect of grain size and Y content on mechanical responses, a constitutive model that is sensitive to the Y content and microstructure is developed within the visco-plastic self-consistent (VPSC) crystal plasticity framework. The stress–strain responses and twin volume fraction values reported in [69] for different Y content are used to calibrate and validate the model. The new model is shown to correctly capture the experimental measurements for four different Mg-Y alloys deformed under rolling direction tension (RDT) and compression (RDC), and normal direction compression (NDC). Notably, the model correctly captures the twinning signature and the complex dependence of Y content on slip and twinning activity. Using the model, the maps of tension–compression asymmetry and Lankford coefficient are developed as a function of Y content and grain sizes. These maps suggest that plastic anisotropy decreases with an increase in Y content and a reduction in grain sizes. Furthermore, the distributions indicate that the Y content can be reduced significantly with a slight-to-moderate decrease in grain sizes to achieve similar mechanical performance. Overall, this work establishes a plausible framework for optimizing the microstructure (grain size) and Y content to achieve desired structural properties such as strength and asymmetry.
Author Contributions
M.A.K.: Conceptualization, investigation, methodology, formal analysis, visualization, writing—original draft preparation, funding acquisition; M.W.: methodology, investigation, writing—review and editing, funding acquisition; I.J.B.: writing—review and editing, funding acquisition. All authors have read and agreed to the published version of the manuscript.
Funding
This work was funded by the US Department of Energy, Office of Basic Energy Sciences (OBES) FWP-06SCPE401. M.W. was supported by the program “Excellence initiative-research University” for the AGH University of Science and Technology. I.J.B. is grateful for support by the National Science Foundation under Grant Number 2051390.
Data Availability Statement
The data that support the findings of this study are available from the corresponding author, [M.A.K.], upon reasonable request.
Conflicts of Interest
The authors declare no conflict of interest.
Appendix A. Evolution of Dislocation Densities
Following the work of [78], the density of forest dislocations, , used in Equation (3), and debris, , used in Equation (4), are evolved. For the sake of completeness, here it is briefly summarized. The stored forest dislocation densities evolve via a competition between a dislocation generation term, , that describes the storage of dislocations by statistical trapping of gliding dislocations by forest dislocations and a thermally controlled annihilation term, , for dynamic recovery of stored dislocations:
The annihilation term, , in the above equation is given as:
where k, , , and is the Boltzmann’s constant, plastic strain rate, reference strain rate (taken as 1/s), drag stress, and normalized activation energy of slip system s. In HCP magnesium, deformation twin boundaries act as a dislocation sink. That is, interacting matrix slip dislocations are absorbed by the migrating twin boundary. To account for this process, i.e., reduction in the dislocation generation rate by twin growth, recently, Wang et al. [69] proposed a twin affected dislocation generation rate and it is given as
Here, is the initial dislocation generation rate in the twin free grain. is the pre-factor, which depends on the reference shear and twin characteristic shear, S. The term is the twin growth rate in the employed CG model. The generation of is assumed to equal the sum of debris contributed by each slip system and is written as:
where q is set equal to 4 and defines the rate coefficient for how debris grows from point defects. The density is the population of dislocations from each slip system that contribute to the formation of debris and is a term that relates to the temperature dependency of dislocation interactions.
References
- Kim, N.J. Critical Assessment 6: Magnesium sheet alloys: Viable alternatives to steels? Mater. Sci. Technol. 2014, 30, 1925–1928. [Google Scholar] [CrossRef]
- Kulekci, M.K. Magnesium and its alloys applications in automotive industry. Int. J. Adv. Manuf. Technol. 2008, 39, 851–865. [Google Scholar] [CrossRef]
- Musfirah, A.; Jaharah, A. Magnesium and aluminum alloys in automotive industry. J. Appl. Sci. Res. 2012, 8, 4865–4875. [Google Scholar]
- Pollock, T.M. Weight Loss with Magnesium Alloys. Science 2010, 328, 986–987. [Google Scholar] [CrossRef]
- Shu, D.W.; Ahmad, I.R. Magnesium alloys: An alternative for aluminium in structural applications. Adv. Mater. Res. Trans Tech. Publ. 2011, 168, 1631–1635. [Google Scholar] [CrossRef]
- Suh, B.C.; Shim, M.S.; Shin, K.S.; Kim, N.J. Current issues in magnesium sheet alloys: Where do we go from here? Scr. Mater. 2014, 84–85, 1–6. [Google Scholar] [CrossRef]
- Yang, Z.; Li, J.; Zhang, J.; Lorimer, G.; Robson, J. Review on research and development of magnesium alloys. Acta Metall. Sin. 2008, 21, 313–328. [Google Scholar] [CrossRef]
- Yoo, M.H. Slip, Twinning, and Fracture in Hexagonal Close-Packed Metals. Metall. Trans. A-Phys. Metall. Mater. Sci. 1981, 12, 409–418. [Google Scholar] [CrossRef]
- Partridge, P.G. The crystallography and deformation modes of hexagonal close-packed metals. Metall. Rev. 1967, 12, 169–194. [Google Scholar] [CrossRef]
- Nie, J.; Shin, K.; Zeng, Z. Microstructure, deformation, and property of wrought magnesium alloys. Metall. Mater. Trans. A 2020, 51, 6045–6109. [Google Scholar] [CrossRef]
- Hutchinson, W.; Barnett, M. Effective values of critical resolved shear stress for slip in polycrystalline magnesium and other hcp metals. Scr. Mater. 2010, 63, 737–740. [Google Scholar] [CrossRef]
- Kumar, M.A.; Beyerlein, I.J.; Tome, C.N. A measure of plastic anisotropy for hexagonal close packed metals: Application to alloying effects on the formability of Mg. J. Alloys Compd. 2017, 695, 1488–1497. [Google Scholar] [CrossRef]
- Beyerlein, I.J.; McCabe, R.J.; Tome, C.N. Effect of microstructure on the nucleation of deformation twins in polycrystalline high-purity magnesium: A multi-scale modeling study. J. Mech. Phys. Solids 2011, 59, 988–1003. [Google Scholar] [CrossRef]
- Beyerlein, I.J.; Capolungo, L.; Marshall, P.E.; McCabe, R.J.; Tome, C.N. Statistical analyses of deformation twinning in magnesium. Philos. Mag. 2010, 90, 2161–2190. [Google Scholar] [CrossRef]
- El Kadiri, H.; Barrett, C.D.; Wang, J.; Tome, C.N. Why are {10(1)over-bar2} twins profuse in magnesium? Acta Mater. 2015, 85, 354–361. [Google Scholar] [CrossRef]
- Kumar, M.A.; McCabe, R.; Tomé, C.; Capolungo, L. Geometric compatibility measure m’for twin transmission: A predictor or descriptor? Mater. Today Commun. 2022, 33, 104634. [Google Scholar] [CrossRef]
- Wang, Y.N.; Huang, J.C. The role of twinning and untwinning in yielding behavior in hot-extruded Mg-Al-Zn alloy. Acta Mater. 2007, 55, 897–905. [Google Scholar] [CrossRef]
- Yablinsky, C.A.; Cerreta, E.K.; Gray, G.T.; Brown, D.W.; Vogel, S.C. The effect of twinning on the work-hardening behavior and microstructural evolution of hafnium. Metall. Mater. Trans. A 2006, 37, 1907–1915. [Google Scholar] [CrossRef]
- Yin, S.M.; Yang, F.; Yang, X.M.; Wu, S.D.; Li, S.X.; Li, G.Y. The role of twinning-detwinning on fatigue fracture morphology of Mg-3%Al-1%Zn alloy. Mater. Sci. Eng. A-Struct. Mater. Prop. Microstruct. Process. 2008, 494, 397–400. [Google Scholar] [CrossRef]
- Kumar, M.A.; McCabe, R.J.; Taupin, V.; Tomé, C.N.; Capolungo, L. Statistical characterization of twin transmission across grain boundaries in magnesium. Mater. Charact. 2022, 194, 112457. [Google Scholar] [CrossRef]
- Yaddanapudi, K.; Kumar, M.A.; Wang, J.; Wang, X.; Rupert, T.J.; Lavernia, E.J.; Schoenung, J.M.; Beyerlein, I.J.; Mahajan, S. Local hardening and asymmetric twin growth by twin-twin interactions in a Mg alloy. J. Magnes. Alloy. 2022, in press. [CrossRef]
- Yaddanapudi, K.; Leu, B.; Kumar, M.A.; Wang, X.; Schoenung, J.M.; Lavernia, E.J.; Rupert, T.J.; Beyerlein, I.J.; Mahajan, S. Accommodation and formation of {1¯ 012} twins in Mg-Y alloys. Acta Mater. 2021, 204, 116514. [Google Scholar] [CrossRef]
- Kumar, M.A.; Beyerlein, I.J.; McCabe, R.J.; Tome, C.N. Grain neighbour effects on twin transmission in hexagonal close-packed materials. Nat. Commun. 2016, 7, 13826. [Google Scholar] [CrossRef]
- Kumar, M.A.; Clausen, B.; Capolungo, L.; McCabe, R.J.; Liu, W.; Tischler, J.Z.; Tome, C.N. Deformation twinning and grain partitioning in a hexagonal close-packed magnesium alloy. Nat. Commun. 2018, 9, 4761. [Google Scholar] [CrossRef]
- Wu, L.; Agnew, S.R.; Ren, Y.; Brown, D.W.; Clausen, B.; Stoica, G.M.; Wenk, H.R.; Liaw, P.K. The effects of texture and extension twinning on the low-cycle fatigue behavior of a rolled magnesium alloy, AZ31B. Mater. Sci. Eng. A-Struct. Mater. Prop. Microstruct. Process. 2010, 527, 7057–7067. [Google Scholar] [CrossRef]
- Kim, W.; Hong, S.; Kim, Y.; Min, S.; Jeong, H.; Lee, J. Texture development and its effect on mechanical properties of an AZ61 Mg alloy fabricated by equal channel angular pressing. Acta Mater. 2003, 51, 3293–3307. [Google Scholar] [CrossRef]
- Al-Samman, T.; Li, X. Sheet texture modification in magnesium-based alloys by selective rare earth alloying. Mater. Sci. Eng. A 2011, 528, 3809–3822. [Google Scholar] [CrossRef]
- Nienaber, M.; Kurz, G.; Letzig, D.; Kainer, K.U.; Bohlen, J. Effect of Process Temperature on the Texture Evolution and Mechanical Properties of Rolled and Extruded AZ31 Flat Products. Crystals 2022, 12, 1307. [Google Scholar] [CrossRef]
- Tolouie, E.; Jamaati, R. Effect of asymmetric cold rolling on the microstructure, texture, and mechanical properties of the AZ91 alloy. Mater. Res. Express 2018, 6, 036501. [Google Scholar] [CrossRef]
- Yu, Q.; Qi, L.; Mishra, R.K.; Li, J.; Minor, A.M. Reducing deformation anisotropy to achieve ultrahigh strength and ductility in Mg at the nanoscale. Proc. Natl. Acad. Sci. USA 2013, 110, 13289–13293. [Google Scholar] [CrossRef]
- Agnew, S.R.; Duygulu, O. Plastic anisotropy and the role of non-basal slip in magnesium alloy AZ31B. Int. J. Plast. 2005, 21, 1161–1193. [Google Scholar] [CrossRef]
- Zeng, Z.; Nie, J.-F.; Xu, S.-W.; HJ Davies, C.; Birbilis, N. Super-formable pure magnesium at room temperature. Nat. Commun. 2017, 8, 972. [Google Scholar] [CrossRef]
- Mehrotra, P.; Lillo, T.; Agnew, S. Ductility enhancement of a heat-treatable magnesium alloy. Scr. Mater. 2006, 55, 855–858. [Google Scholar] [CrossRef]
- Del Valle, J.; Ruano, O.A. Effect of annealing treatments on the anisotropy of a magnesium alloy sheet processed by severe rolling. Mater. Lett. 2009, 63, 1551–1554. [Google Scholar] [CrossRef]
- Xu, S.; Liu, T.; Chen, H.; Miao, Z.; Zhang, Z.; Zeng, W. Reducing the tension–compression yield asymmetry in a hot-rolled Mg–3Al–1Zn alloy via multidirectional pre-compression. Mater. Sci. Eng. A 2013, 565, 96–101. [Google Scholar] [CrossRef]
- Chakkedath, A.; Bohlen, J.; Yi, S.; Letzig, D.; Chen, Z.; Boehlert, C.J. The effect of Nd on the tension and compression deformation behavior of extruded Mg-1Mn (wt pct) at temperatures between 298 K and 523 K (25 C and 250 C). Metall. Mater. Trans. A 2014, 45, 3254–3274. [Google Scholar] [CrossRef]
- Chino, Y.; Sassa, K.; Mabuchi, M. Texture and stretch formability of a rolled Mg–Zn alloy containing dilute content of Y. Mater. Sci. Eng. A 2009, 513, 394–400. [Google Scholar] [CrossRef]
- Ding, H.; Shi, X.; Wang, Y.; Cheng, G.; Kamado, S. Texture weakening and ductility variation of Mg–2Zn alloy with CA or RE addition. Mater. Sci. Eng. A 2015, 645, 196–204. [Google Scholar] [CrossRef]
- Stanford, N.; Barnett, M.R. The origin of “rare earth” texture development in extruded Mg-based alloys and its effect on tensile ductility. Mater. Sci. Eng. A-Struct. Mater. Prop. Microstruct. Process. 2008, 496, 399–408. [Google Scholar] [CrossRef]
- Stanford, N.; Marceau, R.K.W.; Barnett, M.R. The effect of high yttrium solute concentration on the twinning behaviour of magnesium alloys. Acta Mater. 2015, 82, 447–456. [Google Scholar] [CrossRef]
- Stanford, N.; Sha, G.; Xia, J.H.; Ringer, S.P.; Barnett, M.R. Solute segregation and texture modification in an extruded magnesium alloy containing gadolinium. Scr. Mater. 2011, 65, 919–921. [Google Scholar] [CrossRef]
- Sandlöbes, S.; Friák, M.; Neugebauer, J.; Raabe, D. Basal and non-basal dislocation slip in Mg–Y. Mater. Sci. Eng. A 2013, 576, 61–68. [Google Scholar] [CrossRef]
- Sandlöbes, S.; Friák, M.; Zaefferer, S.; Dick, A.; Yi, S.; Letzig, D.; Pei, Z.; Zhu, L.-F.; Neugebauer, J.; Raabe, D. The relation between ductility and stacking fault energies in Mg and Mg–Y alloys. Acta Mater. 2012, 60, 3011–3021. [Google Scholar] [CrossRef]
- Luo, K.; Zhang, L.; Wu, G.; Liu, W.; Ding, W. Effect of Y and Gd content on the microstructure and mechanical properties of Mg–Y–RE alloys. J. Magnes. Alloy. 2019, 7, 345–354. [Google Scholar] [CrossRef]
- Kumar, M.A.; Beyerlein, I.J.; Tome, C.N. Grain size constraints on twin expansion in hexagonal close packed crystals. J. Appl. Phys. 2016, 120, 155105. [Google Scholar] [CrossRef]
- Kumar, M.A.; Beyerlein, I.J. Influence of plastic properties on the grain size effect on twinning in Ti and Mg. Mater. Sci. Eng. 2020, 771, 138644. [Google Scholar] [CrossRef]
- StJohn, D.H.; Qian, M.; Easton, M.A.; Cao, P.; Hildebrand, Z. Grain refinement of magnesium alloys. Metall. Mater. Trans. A 2005, 36, 1669–1679. [Google Scholar] [CrossRef]
- Cao, P.; Qian, M.; StJohn, D.H. Native grain refinement of magnesium alloys. Scr. Mater. 2005, 53, 841–844. [Google Scholar] [CrossRef]
- Karakulak, E. A review: Past, present and future of grain refining of magnesium castings. J. Magnes. Alloy. 2019, 7, 355–369. [Google Scholar] [CrossRef]
- Qian, M.; Das, A. Grain refinement of magnesium alloys by zirconium: Formation of equiaxed grains. Scr. Mater. 2006, 54, 881–886. [Google Scholar] [CrossRef]
- Lee, Y.; Dahle, A.; StJohn, D. The role of solute in grain refinement of magnesium. Metall. Mater. Trans. A 2000, 31, 2895–2906. [Google Scholar] [CrossRef]
- Chang, T.-C.; Wang, J.-Y.; Chia-Ming, O.; Lee, S. Grain refining of magnesium alloy AZ31 by rolling. J. Mater. Process. Technol. 2003, 140, 588–591. [Google Scholar] [CrossRef]
- StJohn, D.; Easton, M.; Qian, M.; Taylor, J. Grain refinement of magnesium alloys: A review of recent research, theoretical developments, and their application. Metall. Mater. Trans. A 2013, 44, 2935–2949. [Google Scholar] [CrossRef]
- Tiner, N. Superheating of magnesium alloys. AIME Tech. Pub. 1945, 12, 1–19. [Google Scholar]
- Wang, X.; Jiang, L.; Zhang, D.; Rupert, T.J.; Beyerlein, I.J.; Mahajan, S.; Lavernia, E.J.; Schoenung, J.M. Revealing the deformation mechanisms for room-temperature compressive superplasticity in nanocrystalline magnesium. Materialia 2020, 11, 100731. [Google Scholar] [CrossRef]
- Kim, W.; Lee, J.; Kim, W.; Jeong, H.; Jeong, H. Microstructure and mechanical properties of Mg–Al–Zn alloy sheets severely deformed by asymmetrical rolling. Scr. Mater. 2007, 56, 309–312. [Google Scholar] [CrossRef]
- Kumar, M.A.; Beyerlein, I.J.; Lebensohn, R.A.; Tome, C.N. Modeling the Effect of Alloying Elements in Magnesium on Deformation Twin Characteristics. Magnes. Technol. 2017, 2017, 159–165. [Google Scholar]
- Kumar, M.A.; Beyerlein, I.J.; Lebensohn, R.A.; Tome, C.N. Role of alloying elements on twin growth and twin transmission in magnesium alloys. Mater. Sci. Eng. A-Struct. Mater. Prop. Microstruct. Process. 2017, 706, 295–303. [Google Scholar] [CrossRef]
- Maldar, A.; Wang, L.; Liu, B.; Liu, W.; Jin, Z.; Zhou, B.; Zeng, X. Activation of< c> dislocations in Mg with solute Y. J. Magnes. Alloy. 2021, in press.
- Wu, Z.; Ahmad, R.; Yin, B.; Sandlöbes, S.; Curtin, W. Mechanistic origin and prediction of enhanced ductility in magnesium alloys. Science 2018, 359, 447–452. [Google Scholar] [CrossRef]
- Wang, F.; Sandlöbes, S.; Diehl, M.; Sharma, L.; Roters, F.; Raabe, D. In situ observation of collective grain-scale mechanics in Mg and Mg–rare earth alloys. Acta Mater. 2014, 80, 77–93. [Google Scholar] [CrossRef]
- Ding, Z.; Liu, W.; Sun, H.; Li, S.; Zhang, D.; Zhao, Y.; Lavernia, E.J.; Zhu, Y. Origins and dissociation of pyramidal< c + a> dislocations in magnesium and its alloys. Acta Mater. 2018, 146, 265–272. [Google Scholar]
- Kim, K.-H.; Jeon, J.B.; Kim, N.J.; Lee, B.-J. Role of yttrium in activation of< c + a> slip in magnesium: An atomistic approach. Scr. Mater. 2015, 108, 104–108. [Google Scholar]
- Wu, J.; Si, S.; Takagi, K.; Li, T.; Mine, Y.; Takashima, K.; Chiu, Y.L. Study of basal< a> and pyramidal< c + a> slips in Mg-Y alloys using micro-pillar compression. Philos. Mag. 2020, 100, 1454–1475. [Google Scholar]
- Wang, L.; Huang, Z.; Wang, H.; Maldar, A.; Yi, S.; Park, J.-S.; Kenesei, P.; Lilleodden, E.; Zeng, X. Study of slip activity in a Mg-Y alloy by in situ high energy X-ray diffraction microscopy and elastic viscoplastic self-consistent modeling. Acta Mater. 2018, 155, 138–152. [Google Scholar] [CrossRef]
- Wang, J.; Kumar, M.A.; Beyerlein, I.J. Investigation of crossed-twin structure formation in magnesium and magnesium alloys. J. Alloys Compd. 2023, 935, 168094. [Google Scholar] [CrossRef]
- Lentz, M.; Klaus, M.; Coelho, R.S.; Schaefer, N.; Schmack, F.; Reimers, W.; Clausen, B. Analysis of the Deformation Behavior of Magnesium-Rare Earth Alloys Mg-2 pct Mn-1 pct Rare Earth and Mg-5 pct Y-4 pct Rare Earth by In Situ Energy-Dispersive X-ray Synchrotron Diffraction and Elasto-Plastic Self-Consistent Modeling. Metall. Mater. Trans. A-Phys. Metall. Mater. Sci. 2014, 45, 5721–5735. [Google Scholar] [CrossRef]
- Somekawa, H.; Kinoshita, A.; Kato, A. Effect of alloying elements on room temperature stretch formability in Mg alloys. Mater. Sci. Eng. A 2018, 732, 21–28. [Google Scholar] [CrossRef]
- Wang, J.; Wang, X.; Yu, K.; Rupert, T.J.; Mahajan, S.; Lavernia, E.J.; Schoenung, J.M.; Beyerlein, I.J. Manipulating deformation mechanisms with Y alloying of Mg. Mater. Sci. Eng. A 2021, 817, 141373. [Google Scholar] [CrossRef]
- Proust, G.; Tome, C.N.; Jain, A.; Agnew, S.R. Modeling the effect of twinning and detwinning during strain-path changes of magnesium alloy AZ31. Int. J. Plast. 2009, 25, 861–880. [Google Scholar] [CrossRef]
- Labusch, R. A statistical theory of solid solution hardening. Phys. Status Solidi (B) 1970, 41, 659–669. [Google Scholar] [CrossRef]
- Fleisgher, R.L. Solution hardening. Acta Metall. 1961, 9, 996–1000. [Google Scholar] [CrossRef]
- Nabarro, F. The theory of solution hardening. Philos. Mag. 1977, 35, 613–622. [Google Scholar] [CrossRef]
- Lebensohn, R.A.; Tome, C.N. A Self-Consistent Anisotropic Approach for the Simulation of Plastic-Deformation and Texture Development of Polycrystals-Application to Zirconium Alloys. Acta Metall. Et Mater. 1993, 41, 2611–2624. [Google Scholar] [CrossRef]
- Lebensohn, R.; Tomé, C.; Castaneda, P.P. Self-consistent modelling of the mechanical behaviour of viscoplastic polycrystals incorporating intragranular field fluctuations. Philos. Mag. 2007, 87, 4287–4322. [Google Scholar] [CrossRef]
- Proust, G.; Tome, C.N.; Kaschner, G.C. Modeling texture, twinning and hardening evolution during deformation of hexagonal materials. Acta Mater. 2007, 55, 2137–2148. [Google Scholar] [CrossRef]
- Kaschner, G.C.; Tome, C.N.; Beyerlein, I.J.; Vogel, S.C.; Brown, D.W.; McCabe, R.J. Role of twinning in the hardening response of zirconium during temperature reloads. Acta Mater. 2006, 54, 2887–2896. [Google Scholar] [CrossRef]
- Beyerlein, I.J.; Tome, C.N. A dislocation-based constitutive law for pure Zr including temperature effects. Int. J. Plast. 2008, 24, 867–895. [Google Scholar] [CrossRef]
- Lavrentev, F. The type of dislocation interaction as the factor determining work hardening. Mater. Sci. Eng. 1980, 46, 191–208. [Google Scholar] [CrossRef]
- Madec, R.; Devincre, B.; Kubin, L.P. From dislocation junctions to forest hardening. Phys. Rev. Lett. 2002, 89, 255508. [Google Scholar] [CrossRef]
- Fleischer, R.L. Substitutional solution hardening. Acta Metall. 1963, 11, 203–209. [Google Scholar] [CrossRef]
- Friedel, J. Les Dislocations; Gauthier-Villars: Paris, France, 1956. [Google Scholar]
- Mott, N.; Nabarro, F. Report on strength of solids. Phys. Soc. Lond. 1948, I, 1–19. [Google Scholar]
- Leyson, G.; Curtin, W. Solute strengthening at high temperatures. Model. Simul. Mater. Sci. Eng. 2016, 24, 065005. [Google Scholar] [CrossRef]
- Leyson, G.; Curtin, W. Friedel vs. Labusch: The strong/weak pinning transition in solute strengthened metals. Philos. Mag. 2013, 93, 2428–2444. [Google Scholar] [CrossRef]
- Cáceres, C.; Rovera, D. Solid solution strengthening in concentrated Mg–Al alloys. J. Light Met. 2001, 1, 151–156. [Google Scholar] [CrossRef]
- Gao, L.; Chen, R.; Han, E. Effects of rare-earth elements Gd and Y on the solid solution strengthening of Mg alloys. J. Alloys Compd. 2009, 481, 379–384. [Google Scholar] [CrossRef]
- Arsenault, R.; Patu, S.; Esterling, D. Computer simulation of solid solution strengthening in Fcc alloys: Part I. Friedel and mott limits. Metall. Trans. A 1989, 20, 1411–1418. [Google Scholar] [CrossRef]
- Akhtar, A.; Teghtsoonian, E. Substitutional solution hardening of magnesium single crystals. Philos. Mag. 1972, 25, 897–916. [Google Scholar] [CrossRef]
- Akhtar, A.; Teghtsoonian, E. Solid solution strengthening of magnesium single crystals—I alloying behaviour in basal slip. Acta Metall. 1969, 17, 1339–1349. [Google Scholar] [CrossRef]
- Akhtar, A. Solid Solution Strengthening of Magnesium; University of British Columbia: Vancouver, BC, Canada, 1968. [Google Scholar]
- Garg, P.; Adlakha, I.; Solanki, K. Effect of solutes on ideal shear resistance and electronic properties of magnesium: A first-principles study. Acta Mater. 2018, 153, 327–335. [Google Scholar] [CrossRef]
- Wang, J.; Yuan, Y.; Chen, T.; Wu, L.; Chen, X.; Jiang, B.; Wang, J.; Pan, F. Multi-solute solid solution behavior and its effect on the properties of magnesium alloys. J. Magnes. Alloy. 2022, 10, 1786–1820. [Google Scholar] [CrossRef]
- Su, H.; Tian, G.; Zhang, C.; Wang, S.; Xue, C.; Wang, J.; Guan, S. Quantitative evaluation of the short-range order strengthening effect on solid solution and GB strength of Mg–Y alloys by ab initio calculations. J. Mater. Sci. 2022, 57, 19986–20001. [Google Scholar] [CrossRef]
- Agnew, S.R.; Yoo, M.H.; Tome, C.N. Application of texture simulation to understanding mechanical behavior of Mg and solid solution alloys containing Li or Y. Acta Mater. 2001, 49, 4277–4289. [Google Scholar] [CrossRef]
- Ganeshan, S.; Shang, S.; Wang, Y.; Liu, Z.-K. Effect of alloying elements on the elastic properties of Mg from first-principles calculations. Acta Mater. 2009, 57, 3876–3884. [Google Scholar] [CrossRef]
- Busk, R.S. Lattice parameters of magnesium alloys. Jom 1950, 2, 1460–1464. [Google Scholar] [CrossRef]
- Hardie, D.; Parkins, R. Lattice spacing relationships in magnesium solid solutions. Philos. Mag. 1959, 4, 815–825. [Google Scholar] [CrossRef]
- Peng, Q.; Meng, J.; Li, Y.; Huang, Y.; Hort, N. Effect of yttrium addition on lattice parameter, Young’s modulus and vacancy of magnesium. Mater. Sci. Eng. A 2011, 528, 2106–2109. [Google Scholar] [CrossRef]
- Shi, B.; Cheng, Y.; Shang, X.; Yan, H.; Chen, R.; Ke, W. Hall-Petch relationship, twinning responses and their dependences on grain size in the rolled Mg-Zn and Mg-Y alloys. Mater. Sci. Eng. A 2019, 743, 558–566. [Google Scholar] [CrossRef]
- Ansari, N.; Lee, S.Y.; Singh, S.S.; Jain, J. Influence of yttrium-induced twinning on the recrystallization behavior of magnesium alloys. J. Mater. Sci. 2021, 56, 18258–18271. [Google Scholar] [CrossRef]
- Chen, Y.; Zhu, Z.; Zhou, J. Study on the strengthening mechanism of rare earth yttrium on magnesium alloys. Mater. Sci. Eng. A 2022, 850, 143513. [Google Scholar] [CrossRef]
- Zhang, Y.; Zeng, X.; Liu, L.; Lu, C.; Zhou, H.; Li, Q.; Zhu, Y. Effects of yttrium on microstructure and mechanical properties of hot-extruded Mg–Zn–Y–Zr alloys. Mater. Sci. Eng. A 2004, 373, 320–327. [Google Scholar] [CrossRef]
- Mirak, A.; Davidson, C.; Taylor, J. Study on the early surface films formed on Mg-Y molten alloy in different atmospheres. J. Magnes. Alloy. 2015, 3, 173–179. [Google Scholar] [CrossRef]
- Socjusz-Podosek, M.; Lityńska, L. Effect of yttrium on structure and mechanical properties of Mg alloys. Mater. Chem. Phys. 2003, 80, 472–475. [Google Scholar] [CrossRef]
- Zhu, Q.; Li, Y.; Ding, Z.; Wang, J.; Liu, Y.; Zhang, H.; Xie, T.; Wang, M.; Zhu, H.; Ying, T. Unveiling precipitation behavior in Mg-Y based alloys. Mater. Des. 2021, 202, 109570. [Google Scholar] [CrossRef]
- Zhu, Q.; Li, Y.; Zhang, H.; Qi, X.; Zeng, X. Revisiting the evolution behaviors of β’phase in Mg-Nd and Mg-Y alloys. Mater. Lett. 2021, 305, 130857. [Google Scholar] [CrossRef]
- Leu, B.; Kumar, M.A.; Xie, K.; Beyerlein, I.J. Investigation of twin growth mechanisms in precipitate hardened AZ91. Acta Mater. 2023, 242, 118471. [Google Scholar] [CrossRef]
- Leu, B.; Kumar, M.A.; Xie, K.Y.; Beyerlein, I.J. Twinning pathways enabled by precipitates in AZ91. Materialia 2022, 21, 101292. [Google Scholar] [CrossRef]
Disclaimer/Publisher’s Note: The statements, opinions and data contained in all publications are solely those of the individual author(s) and contributor(s) and not of MDPI and/or the editor(s). MDPI and/or the editor(s) disclaim responsibility for any injury to people or property resulting from any ideas, methods, instructions or products referred to in the content. |
© 2023 by the authors. Licensee MDPI, Basel, Switzerland. This article is an open access article distributed under the terms and conditions of the Creative Commons Attribution (CC BY) license (https://creativecommons.org/licenses/by/4.0/).