Article

Modulating Light Emission Performance of PCSEL via GaN HEMT Driving Circuit

1
Semiconductor Research Center, Hon Hai Research Institute, Taipei 11492, Taiwan
2
Department of Mechanical Engineering, College of Engineering, National Yang Ming Chiao Tung University, Hsinchu 30010, Taiwan
3
Department of Photonics, Institute of Electro-Optical Engineering, College of Electrical and Computer Engineering, National Yang Ming Chiao Tung University, Hsinchu 30010, Taiwan
4
International College of Semiconductor Technology, National Yang Ming Chiao Tung University, Hsinchu 30010, Taiwan
*
Authors to whom correspondence should be addressed.
Crystals 2022, 12(9), 1242; https://doi.org/10.3390/cryst12091242
Submission received: 10 August 2022 / Revised: 22 August 2022 / Accepted: 30 August 2022 / Published: 2 September 2022
(This article belongs to the Section Inorganic Crystalline Materials)

Abstract

:
In this study, a paradigm for modulating the light emission performance of photonic-crystal surface-emitting laser (PCSEL) via GaN high electron mobility transistor (HEMT) driving circuit is proposed for the first time. For light detection and ranging (LiDAR) system, a faster pulse repetition frequency with shorter pulse width can provide not only high resolution but also sufficiently precise range resolution. Hereupon, comprehensive analyses for such an integrated system are conducted with not only electro-optical responses but also the corresponding optical behaviors. The relevant electrical characteristics of the employed GaN HEMT are examined at first. Next, the integrated system on a matrix board with its corresponding circuit topology is discussed, illustrating the relevant operating principles. Thereby, sufficient systematical scrutinization for relevant light emissions is performed for both photodiode responses and the optical behaviors under different conditions, paving a holistic panorama for the LiDAR system. Thus, prospects for the next generation LiDAR system in high-power and high-speed operation can be expected.

1. Introduction

Echolocation in mammals for range-finding and distance sensing is ubiquitous in nature [1,2,3,4,5,6]. For example, a bat can use its built-in sound navigation and ranging (sonar) system to pursue fast-flying prey at night. Imitating such a principle of nature, the light detection and ranging (LiDAR) system accordingly exploits pulsed lasers to measure relevant range. In particular, the flurry of autonomous vehicles is in full swing, and thus the LiDAR system with great performance for environmental perception is in urgent demand [7,8]. Compared with other perception sensors, LiDAR can provide great capabilities of long-range detection, high precision, high spatial resolution, and active three-dimensional (3D) measurement for acquiring detailed surrounding information. Today, LiDAR is widely used in miscellaneous applications, such as autonomous vehicles, machine vision, biomedical industry, augmented reality/virtual reality (AR/VR), industrial automation, and simultaneous localization and mapping (SLAM) [9,10,11,12,13,14,15,16,17,18,19].
For LiDAR systems, pulse repetition frequency (PRF) and pulse width play crucial roles in the ranging performance. High PRF provides high spatial resolutions for 3D point clouds and narrow pulse width provides high range resolutions to avoid ranging ambiguity. Complying with eye safety regulations, the peak power of LiDAR systems, which affects not just the maximum detection range, should be also be a concern [20,21]. The aforementioned issues are frequently discussed and can be tackled with through structuring materials, pulse shape, and laser driving circuits [22,23,24]. Therefore, the consequence of PRF and pulse width is indeed decisive for the performance of a LiDAR system and is worth being carefully investigated.
Herein, an integrated system on a matrix board is utilized with our depletion-mode (D-mode) GaN high electron mobility transistor (HEMT) switch and a commercial photonic-crystal surface-emitting laser (PCSEL) device (Hamamatsu Photonics), thus modulating the light emission performance via the driving circuit [25,26]. Benefits from the superior intrinsic properties of GaN material, such a GaN HEMT switch, can provide several advantages, such as a low parasitic capacitance, a large breakdown endurance, and a low on-resistance [27,28,29,30]. Moreover, the formation of two-dimensional electron gas (2DEG) on the channel brings forth a low node-to-node junction capacitance, offering the capability of high-speed operation [28,31]. Consequently, with the advantageous fast switching property, such a GaN HEMT switch, is quite suitable for high-power and pulse-based applications [28,32,33].
On the other hand, light source is a vital element in such an integrated system. For a LiDAR system, miscellaneous laser light sources have been utilized in the development progress. At first, the edge-emitting laser (EEL), namely a Fabry–Pérot type semiconductor laser, is exploited. However, assorted undesirable drawbacks, such as a broad lasing spectrum, an inherent edge-emitting direction, an asymmetric beam profile, and a large beam divergence, suppress the outcome optical performance, thus hindering the further progress. Thereby, since the first lasing action from a vertical-cavity surface-emitting laser (VCSEL) was demonstrated in 1988, several undesirable features have been tackled with the symmetric beam profile and narrow spectrum [34,35,36,37,38,39,40,41,42,43,44]. However, owing to the multimodal lasing oscillation in high-power operation, the requisite for laser beam collimation yet remains. Auspiciously, a revolutionary semiconductor laser technology, namely the PCSEL device, has changed significantly in the past two decades, gaining from the monolithic integration of photonic crystals in epitaxial structures. PCSEL exhibits great outcome performance in single-mode operation with controllability, and thus PCSEL provides promising perspectives for LiDAR applications [45,46,47,48,49,50,51,52].
With the aforesaid unprecedented merits, a paradigm for modulating the light emission performance of PCSEL via the GaN HEMT driving circuit has been proposed along with comprehensive analyses for the first time. A systematic investigation is conducted with not only electro-optical responses but also the corresponding optical behaviors, paving a holistic panorama for the LiDAR system. Thus, with the assorted unprecedented merits, such an integrated system can be a great paradigm with high potentials for the next generation LiDAR applications. Prospects for the next generation LiDAR system in high-power and high-speed operation can be expected in miscellaneous applications [9,10,11,12,13,14,15,16,17,18,19,32,33,45,46,47,48,49,50,51,52]. That is one small step for the next generation LiDAR systems, but one giant leap for the betterment of human well-being in the future.

2. Modulating Light Emission Performance via Driving Circuit

Prior to the integrated system of a laser driving circuit, electrical characteristics, namely current–voltage (I-V) characteristics, of the employed D-mode GaN HEMT are investigated via a semiconductor device analyzer (Keysight B1500A). Herein, based on previous work, a D-mode GaN HEMT in the same form is utilized with a TO220 package, offering a large metal tab for heat dissipation [25]. Such a GaN HEMT switch with a 120 mm total gate width can provide not only a maximum drain current over 40 A but also breakdown voltage over 800 V. Therefore, with the advantageous fast switching property, compared to the conventional silicon-based metal-oxide semiconductor field effect transistor (MOSFET), such a GaN HEMT switch is quite suitable for high-power and pulse-based applications [30,53,54].

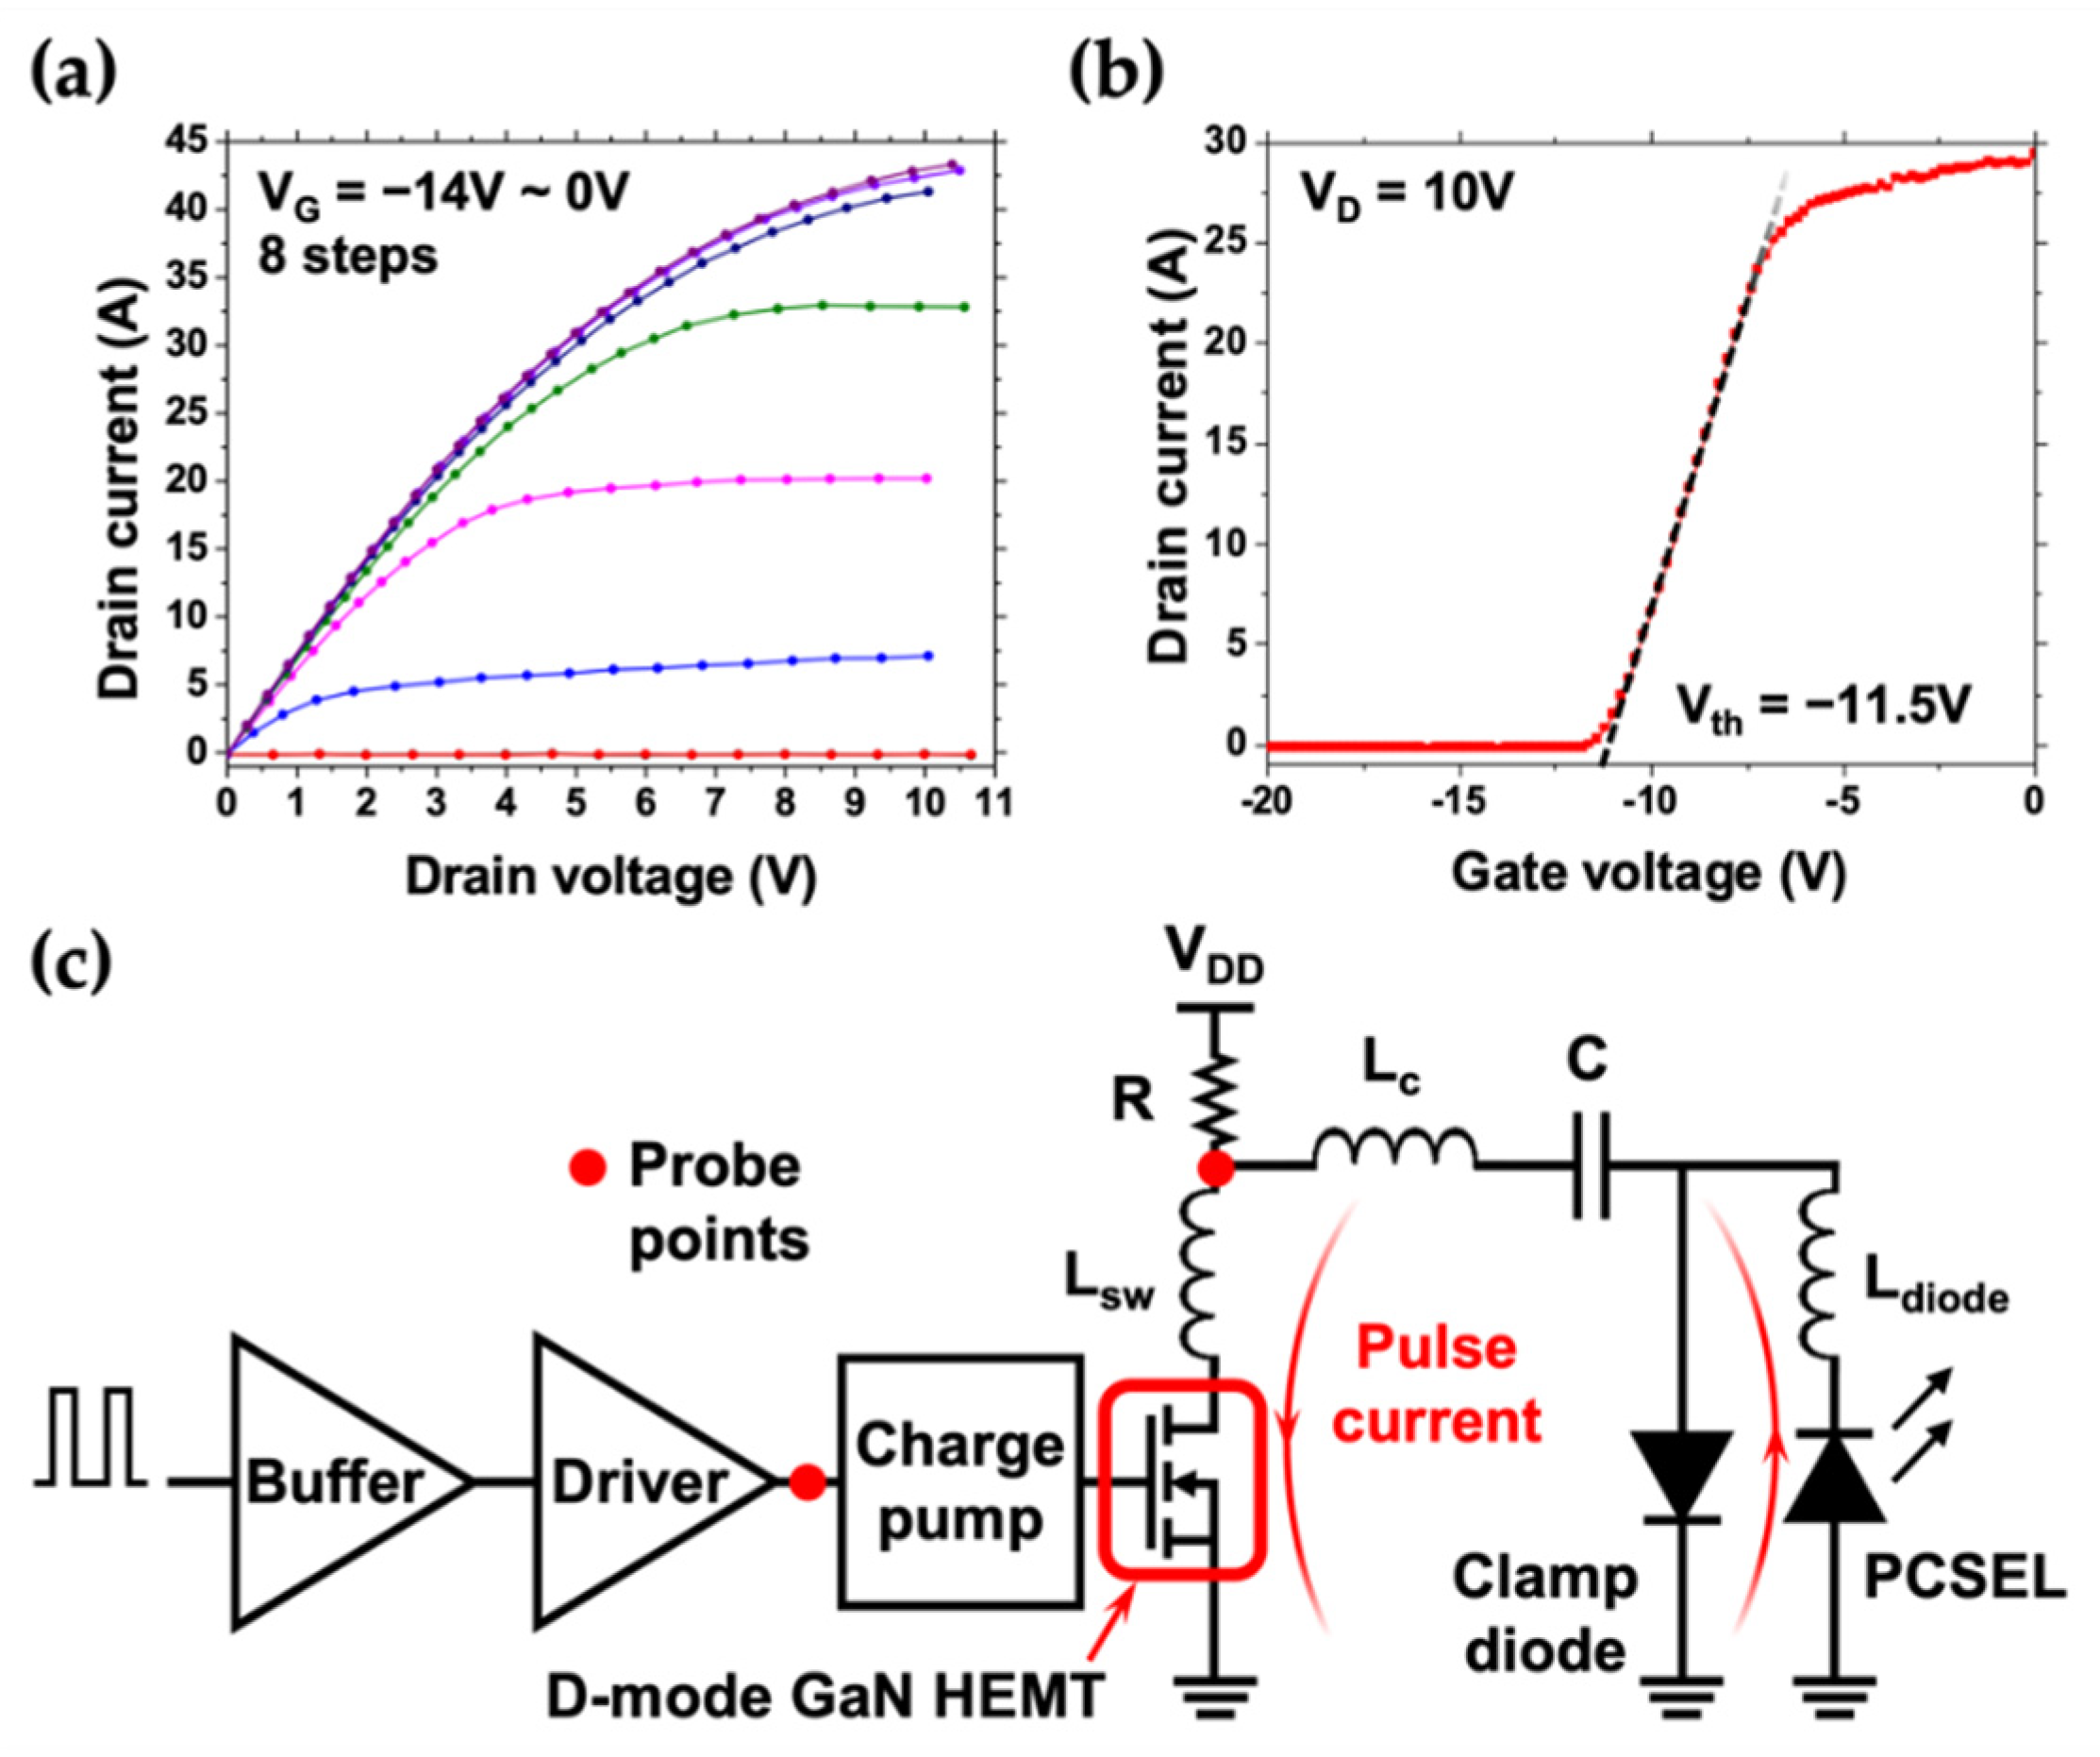
2.1. Integrated System on a Matrix Board

Figure 1a shows the current–voltage (I-V) characteristics of the employed D-mode GaN HEMT. The output characteristics are sequentially measured under various gate voltages from −14 V to 0 V in 8 steps, starting from the very bottom with black and red overlapping curves. It is worth mentioning that a slight decline of the output current (green curve) applied with a gate voltage of −6 V can be observed at the saturation region due to the self-heating effects [55]. Additionally, the corresponding transfer curve is measured with a drain voltage of 10 V, as shown in Figure 1b. Thus, the threshold voltage can be appraised at around −11.5 V.
Turning now to the integrated system on a matrix board, Figure 1c shows the corresponding topology of a laser driving circuit with the employed PCSEL and D-mode GaN HEMT switch, hereafter operating in two phases, namely ON and OFF stages [56]. Firstly, the periodic pulse train is generated by a function generator (Tektronix AFG31054), thereby transmitting through a buffer with 5 V DC power. Then, a gate driver (ON Semiconductor NCP81074) can provide a 10 A driving current to activate the employed D-mode GaN HEMT via a charge pump circuit, clamping the positive pulse signals into negative pulse signals. By adding a charge pump circuit, the original D-mode GaN HEMT can be regarded as an enhancement mode (E-mode) one [57]. In other words, the OFF stage with a zero-voltage signal will be clamped into a negative signal while the ON stage with a high-level signal will be clamped into 0 V.
In the OFF stage, zero-voltage signals will originally transmit through the buffer, thus triggering the gate driver. However, at this point, the additional charge pump circuit will clamp positive signals into negative signals, thus turning off the HEMT switch. In this phase, the discrete capacitor C is charged to VDD through the R, Lc, and the clamp diode. Herein, the clamp diode and Lc form an equivalent series inductance (ESL) of the clamp diode and discrete capacitor.
On the contrary, the gate driver will originally receive high-level signals in the same path, but the signals will be clamped into zero-voltage signals via the charge pump circuit, forming the ON stage to turn on the HEMT switch. In this stage, discrete capacitor C is discharged through the HEMT switch and PCSEL. Such a capacitor discharge loop, Lsw, and Ldiode represent the relevant parasitic inductance, originating from the HEMT switch and the package of PCSEL, respectively. The laser driving ability can be ameliorated by increasing the capacitance but decreasing the total stray inductance of Lsw, Lc, and Ldiode. Moreover, to further suppress the second overshoot, right after the first peaking current, while the HEMT switch turns off, the secondary path can be clamped by the clamp diode.
To probe exact electrical responses, 50 Ω transmission wires with SubMiniature version A (SMA) connectors are exploited for impedance matching, preventing from high-frequency interference. Additionally, to reduce the parasitic effects, all passive elements are employed with surface mount device (SMD) forms, compressing all loop sizes. During the experiment, both VDD and logic input is set to 10 V and 12 V, respectively. Relevant waveforms are extracted by an oscilloscope (Tektronix MDO3054). All aforesaid measurement is conducted in ambient conditions.

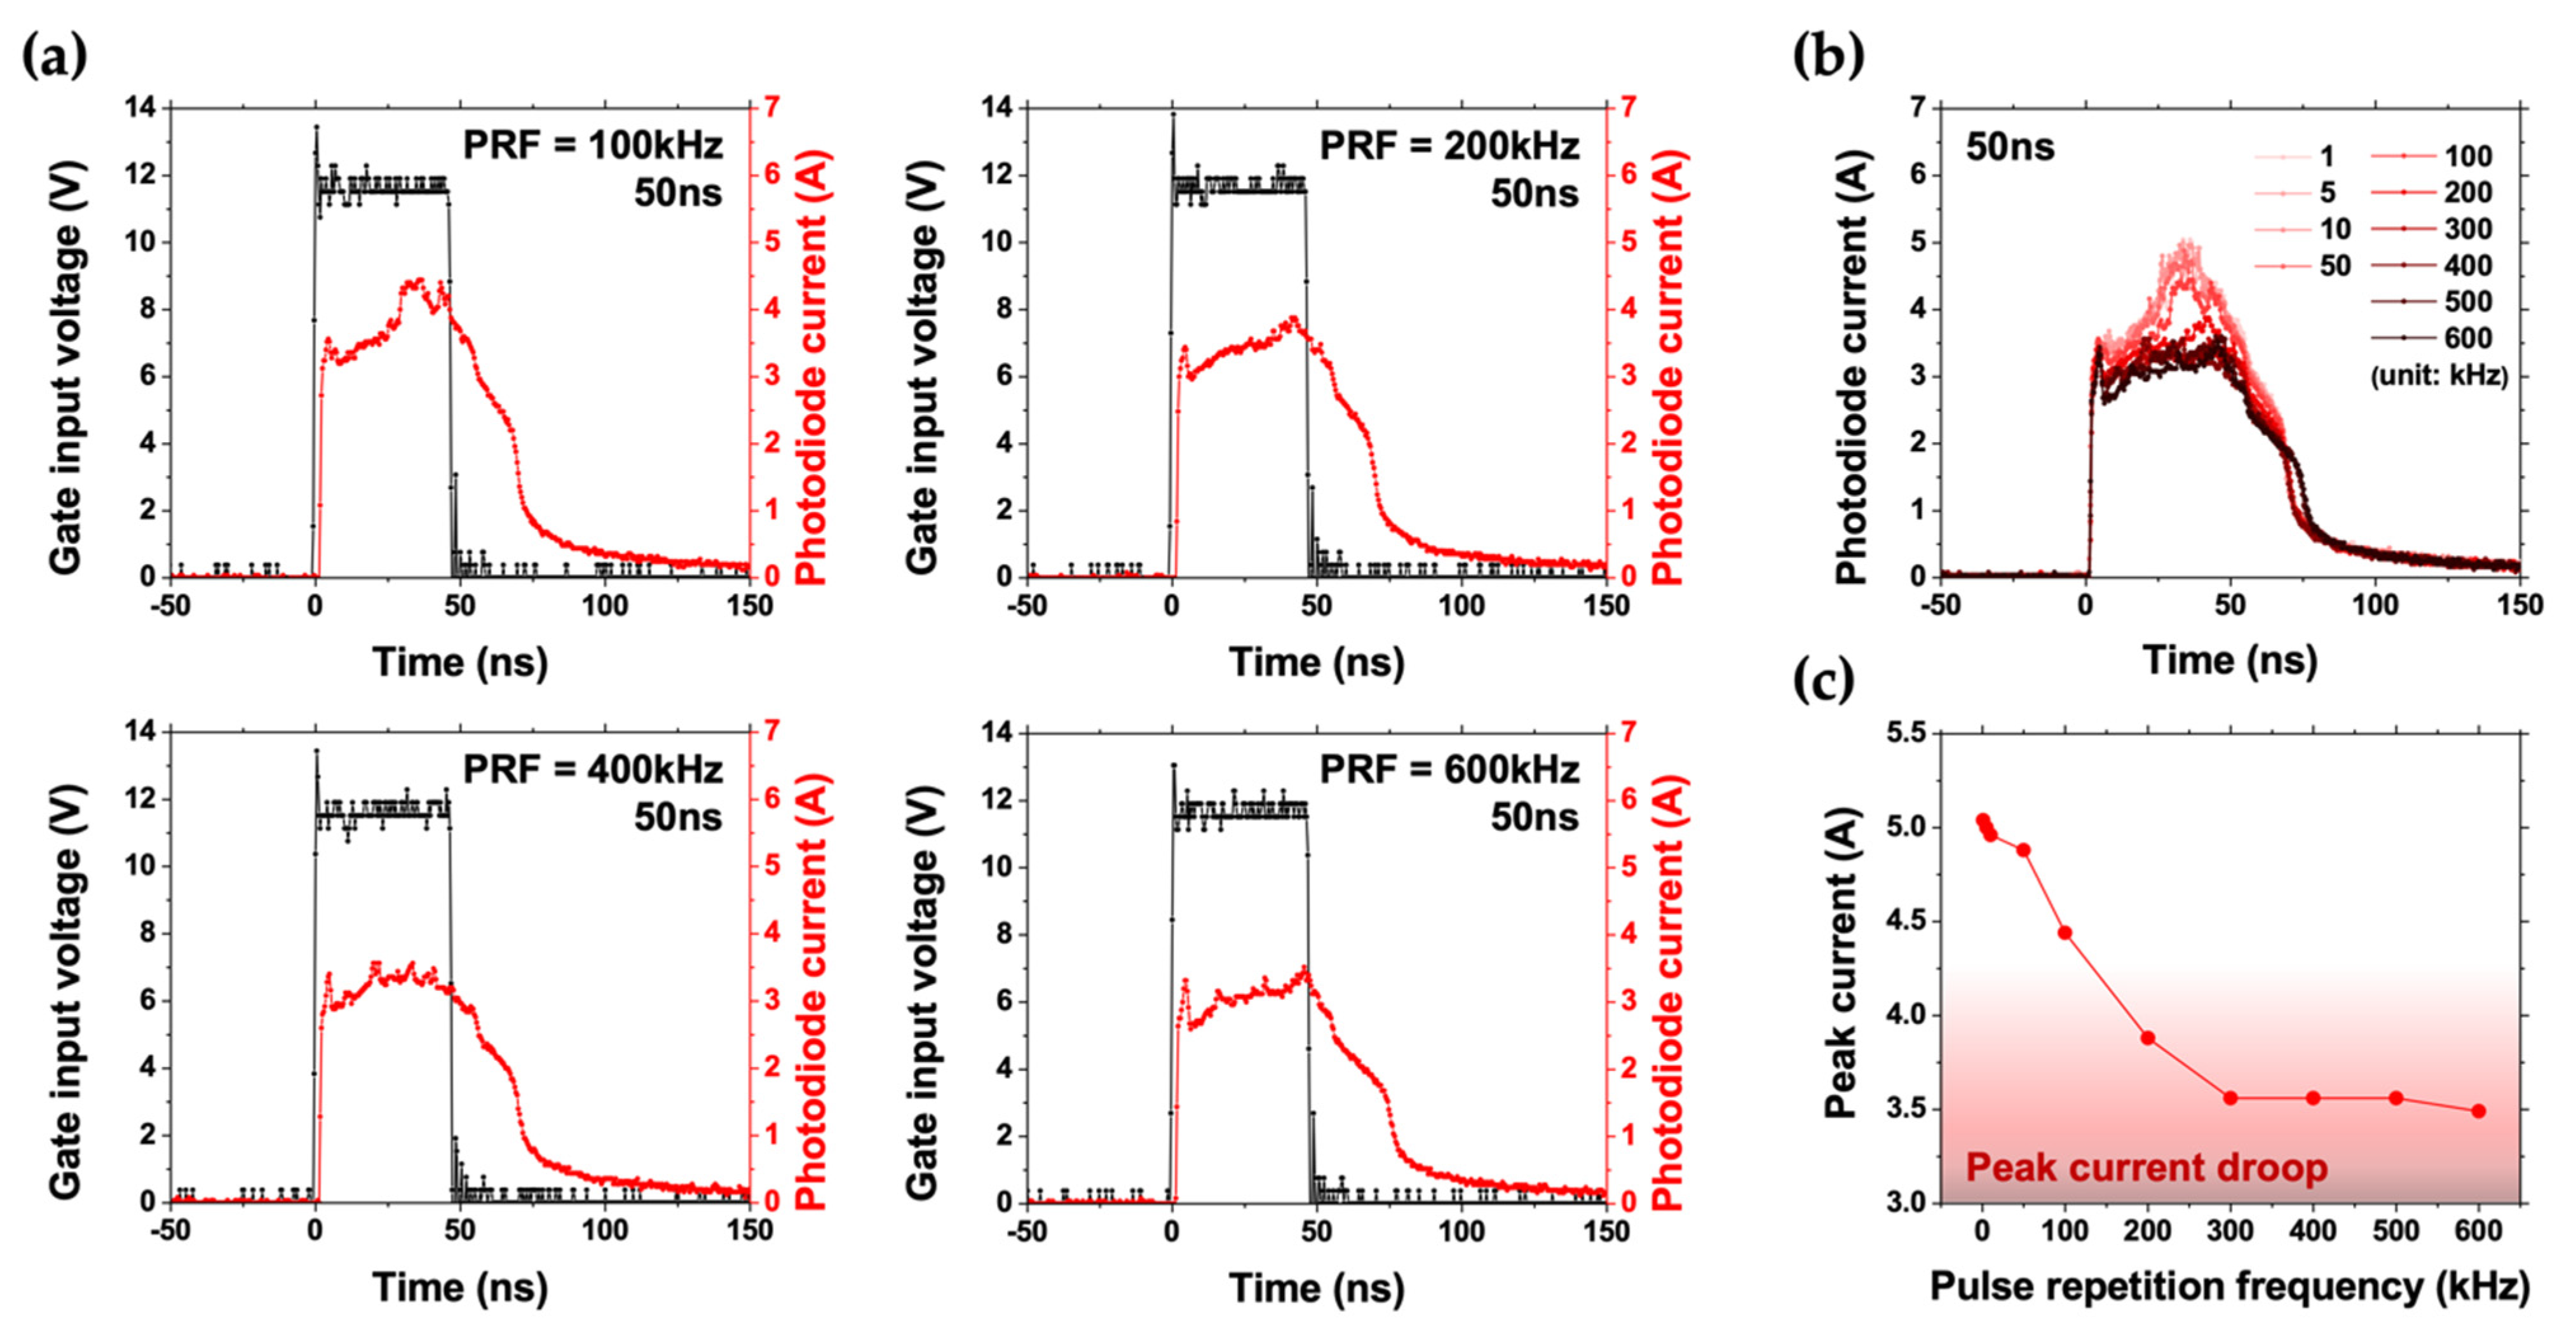
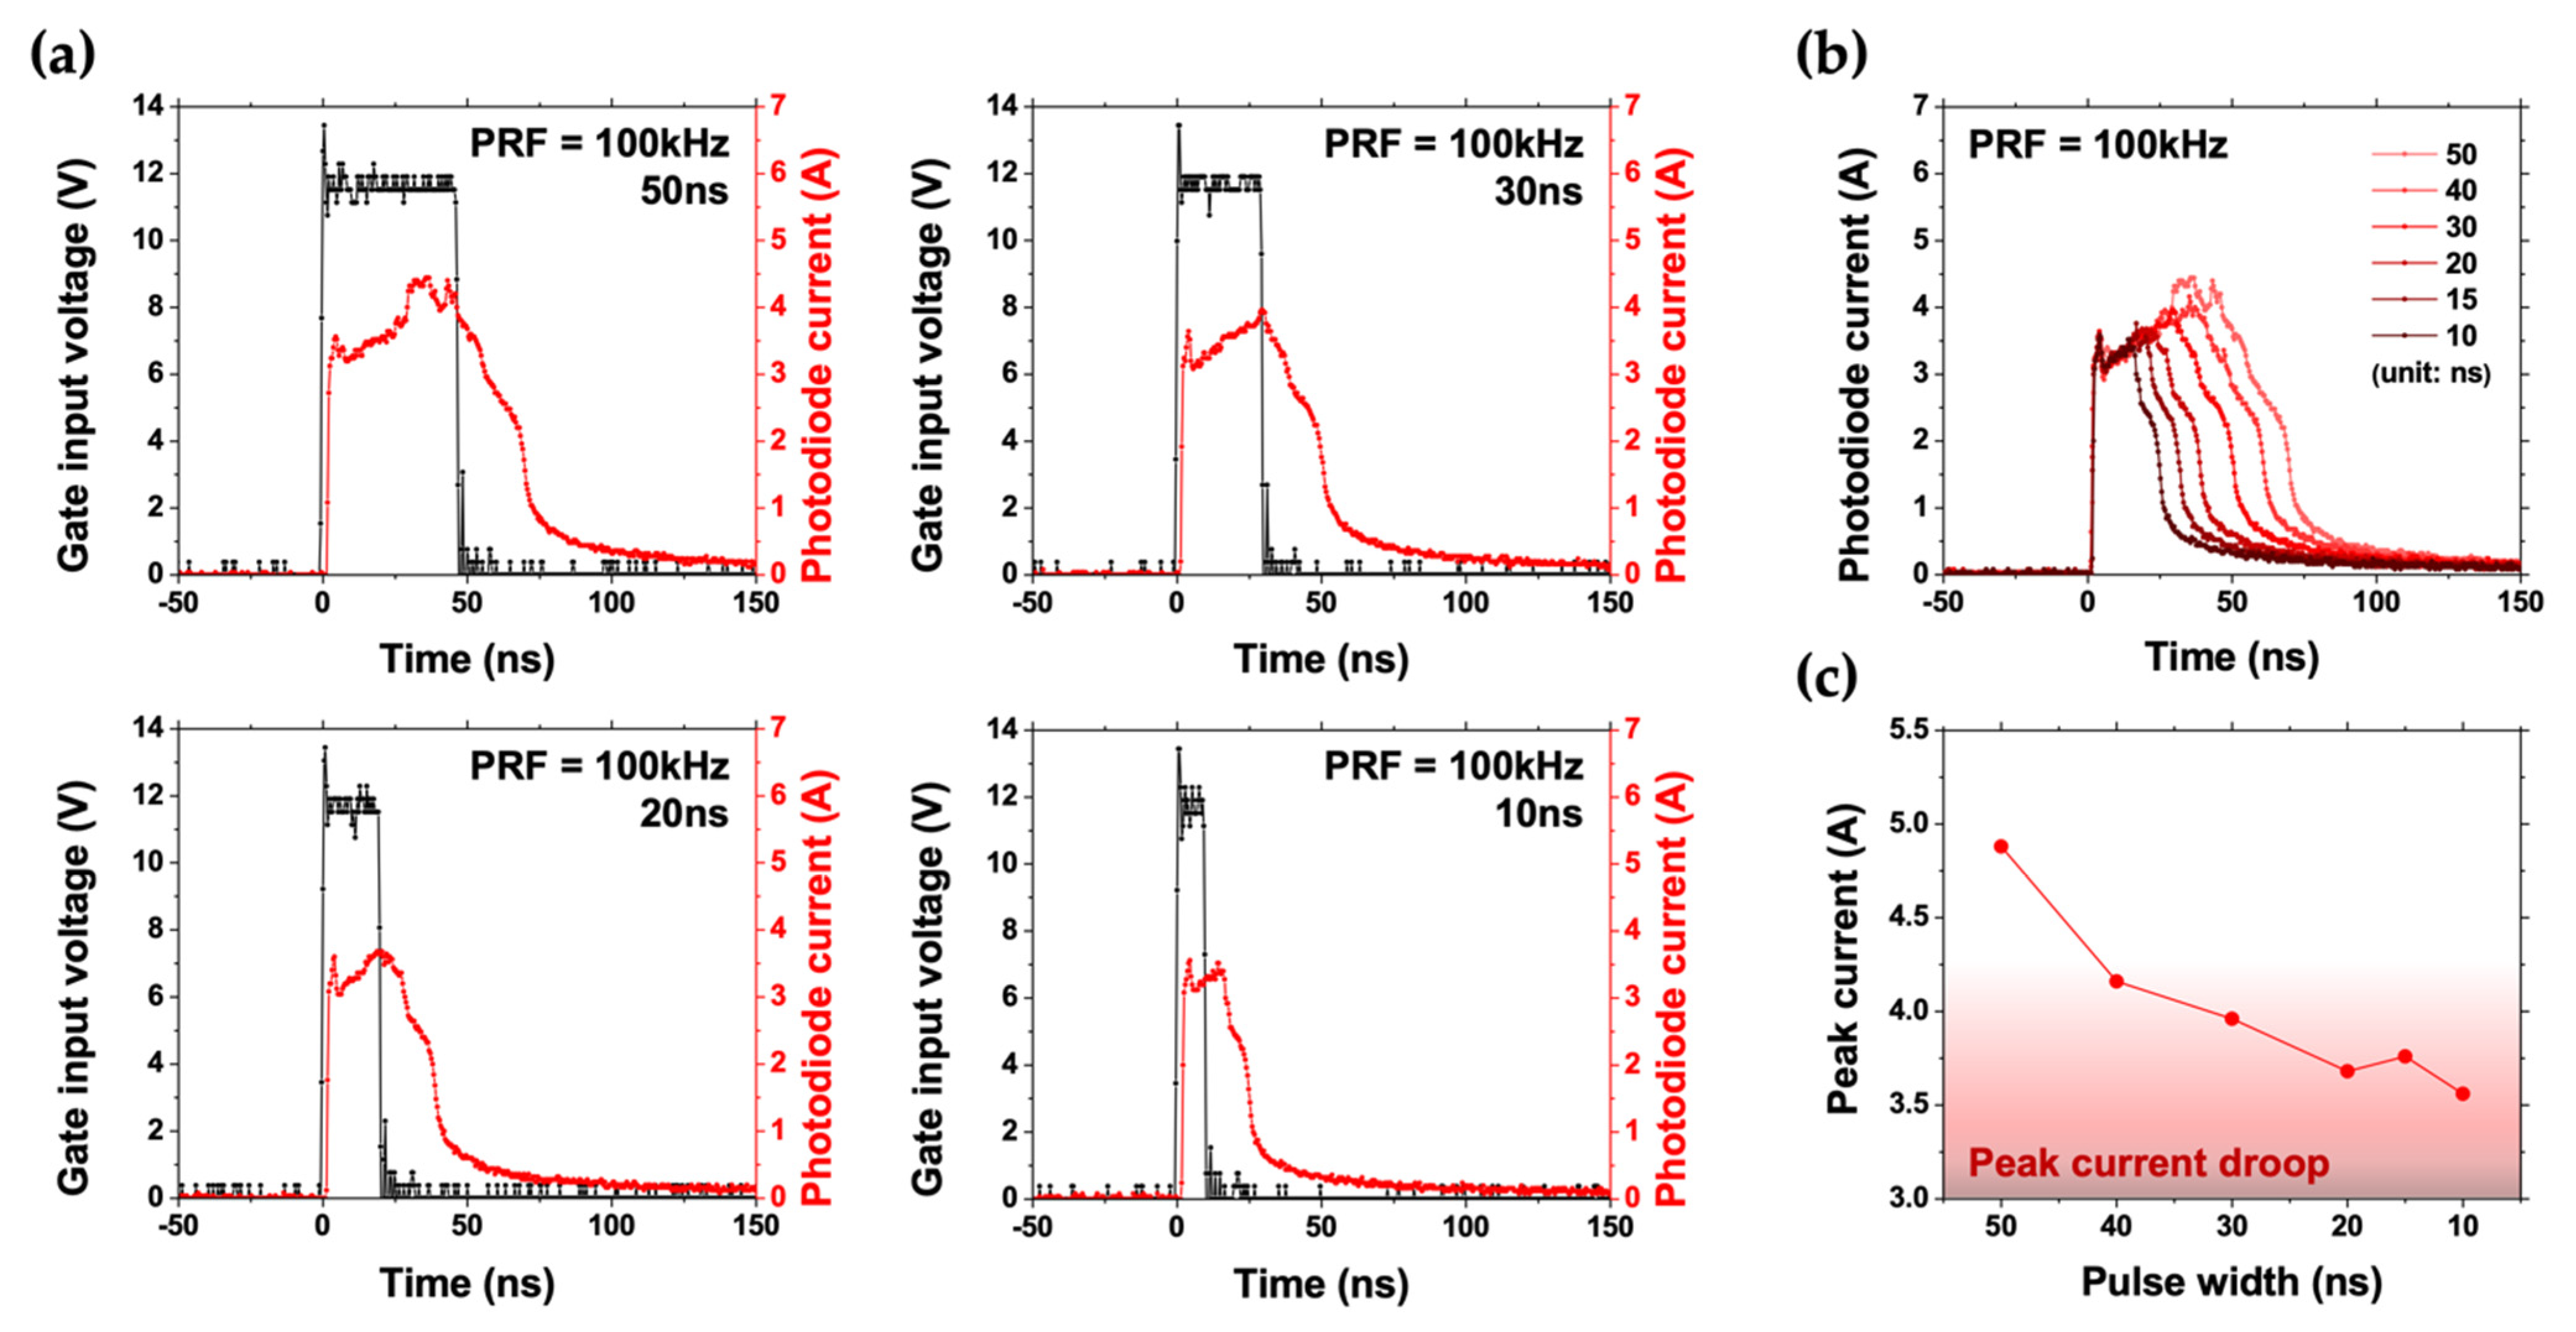
2.2. Electro-Optical Responses of the Driving Circuit

To gain a deep insight into confirming advantageous fast switching of the employed D-mode GaN HEMT, electrical responses of the driving circuit are comprehensively investigated. For a LiDAR system, a faster pulse repetition frequency (PRF) is beneficial to achieve high resolution. As shown in Figure 2, the relevant electro-optical responses of the integrated system are systematically analyzed. The voltage pulses, namely the gate input voltage, are applied to activate the employed PCSEL device, emitting invisible laser light in the near-infrared range (center wavelength at 940 nm). After that, laser light emission from the PCSEL is captured by an InGaAs free-space photodiode with a lens (Thorlabs DET08CL). The photodiode can provide sensitive detection in the wavelength range of 800−1700 nm with a 5 GHz bandwidth. In addition, the transmission wire with a 50 Ω load resistor is exploited for the photodiode, looking at high-speed signals.
Relevant photodiode responses from the PCSEL with distinct pulse repetition frequencies are shown in Figure 2a. Herein, the stimulus interval of gate input voltage, namely the pulse width, is preserved for 50 ns while the PRF is varied. Accordingly, distinct PRFs are applied from 1 kHz and eventually accelerated up to 600 kHz, dynamically activating the employed PCSEL of the integrated system under pulsed conditions. In other words, the corresponding duty cycles are varied from 0.005% up to 3%, and thus introducing a severe self-heating effect of the PCSEL device. The waveforms of photodiode current maintain roughly similar shapes and are consistent with the waveforms of corresponding gate input voltages. At 100 kHz, the rise time response from the starting point of stimulus interval to 90% of the pulse-on photodiode current is estimated around 2.8 ns. However, fall time response for the 10% of pulse-off photodiode current after the stimulus interval is evaluated around 58.8 ns, exhibiting an obvious tail current. In addition, uneven photodiode currents can be observed while the PRF is slower than 200 kHz. Stable waveforms come out with a PRF faster than 200 kHz.
Figure 2b demonstrates a sequence of photodiode responses from the PCSEL for the comparison among various PRFs. The photodiode peak current is decrescent as the PRF becomes faster. The faster PRF, the lower photodiode peak current in general. As shown in Figure 2c, the corresponding peak currents are extracted from Figure 2b for comparison. A significant rollover in peak current can be observed while the PCSEL device is operated at high PRF. Since heat will accumulate over time, such an output droop is originated from the self-heating effect of the PCSEL device, leading to a significant rollover in peak current, namely the decreasing of overall light emission intensity from the PCSEL. Thus, for practical usage, thermal management for a PCSEL device should be considered to prevent device degradation [58]. Afterwards, the higher PRF, the severer rollover. The corresponding peak current drops from 5.04 A to 3.49 A can be discerned at 1 kHz and 600 kHz, respectively. Moreover, a flat saturation of peak current around 3.5 A can be observed once the PRF is applied beyond 300 kHz, namely a duty cycle of 1.5%. Such saturation may owe to the heat accumulation of a PCSEL device, limiting the further implementation for high-speed operation.
Apart from attaining higher PRF to realize a high-resolution LiDAR system, the short pulse width is crucial to achieving sufficiently precise object detection. Moreover, for the LiDAR system equipped with light sources of wavelengths less than 1.5 μm, eye safety should be carefully considered [20,21]. Mercifully, a short pulse light source can tackle such an issue. Thus, relevant electro-optical responses of the integrated system with different pulse widths are investigated in this regard, as shown in Figure 3.
The corresponding photodiode responses from the PCSEL are shown in Figure 3a. The PCSEL employed herein is operated with a fixed PRF of 100 kHz, but the pulse width is shrunk from 50 ns to 10 ns. To put it simply, the corresponding duty cycles are shrunk from 0.5% down to 0.1%. No matter how the pulse width is changed, uneven photodiode currents can be observed with a fixed PRF of 100 kHz once more. However, the tail current tends to be increasingly acute while shrinking the pulse width. Operated with a pulse width of 50 ns, the fall time response for the 10% of pulse-off photodiode current after the stimulus interval is evaluated at around 58.8 ns. However, the corresponding fall time response operated with a pulse width of 10 ns is evaluated at around 57.2 ns. In other words, the tail current is much longer than the stimulus interval, namely the pulse width, under such conditions.
For a perspicuous view, Figure 3b demonstrates a sequence of photodiode responses from the PCSEL for the comparison among various pulse widths. The waveforms of photodiode current overall are consistent with the stimulus interval, but a higher proportion of tail current can be discerned. Compared to the stimulus interval, the proportion of tail current increases from the initial 117.6% to a harsh 752% operated at 100 kHz with a pulse width of 50 ns and 10 ns, respectively. The smaller the duty cycle, the harsher the tail current. Moreover, Figure 3c shows the corresponding peak currents extracted from Figure 3b for comparison. Shrinking the corresponding pulse width, rollover in peak current can be observed as well. A slight saturation can be discerned with a peak current around 3.68 A while the pulse width is shrunk down to 20 ns. The saturation may owe to the inherent properties of the driving circuit, namely the parasitic inductance of employed PCSEL and D-mode GaN HEMT. The shorter the pulse width, the lower the photodiode peak current. The corresponding peak current drops from 4.88 A to 3.56 A with a width of 50 ns and 10 ns, respectively.

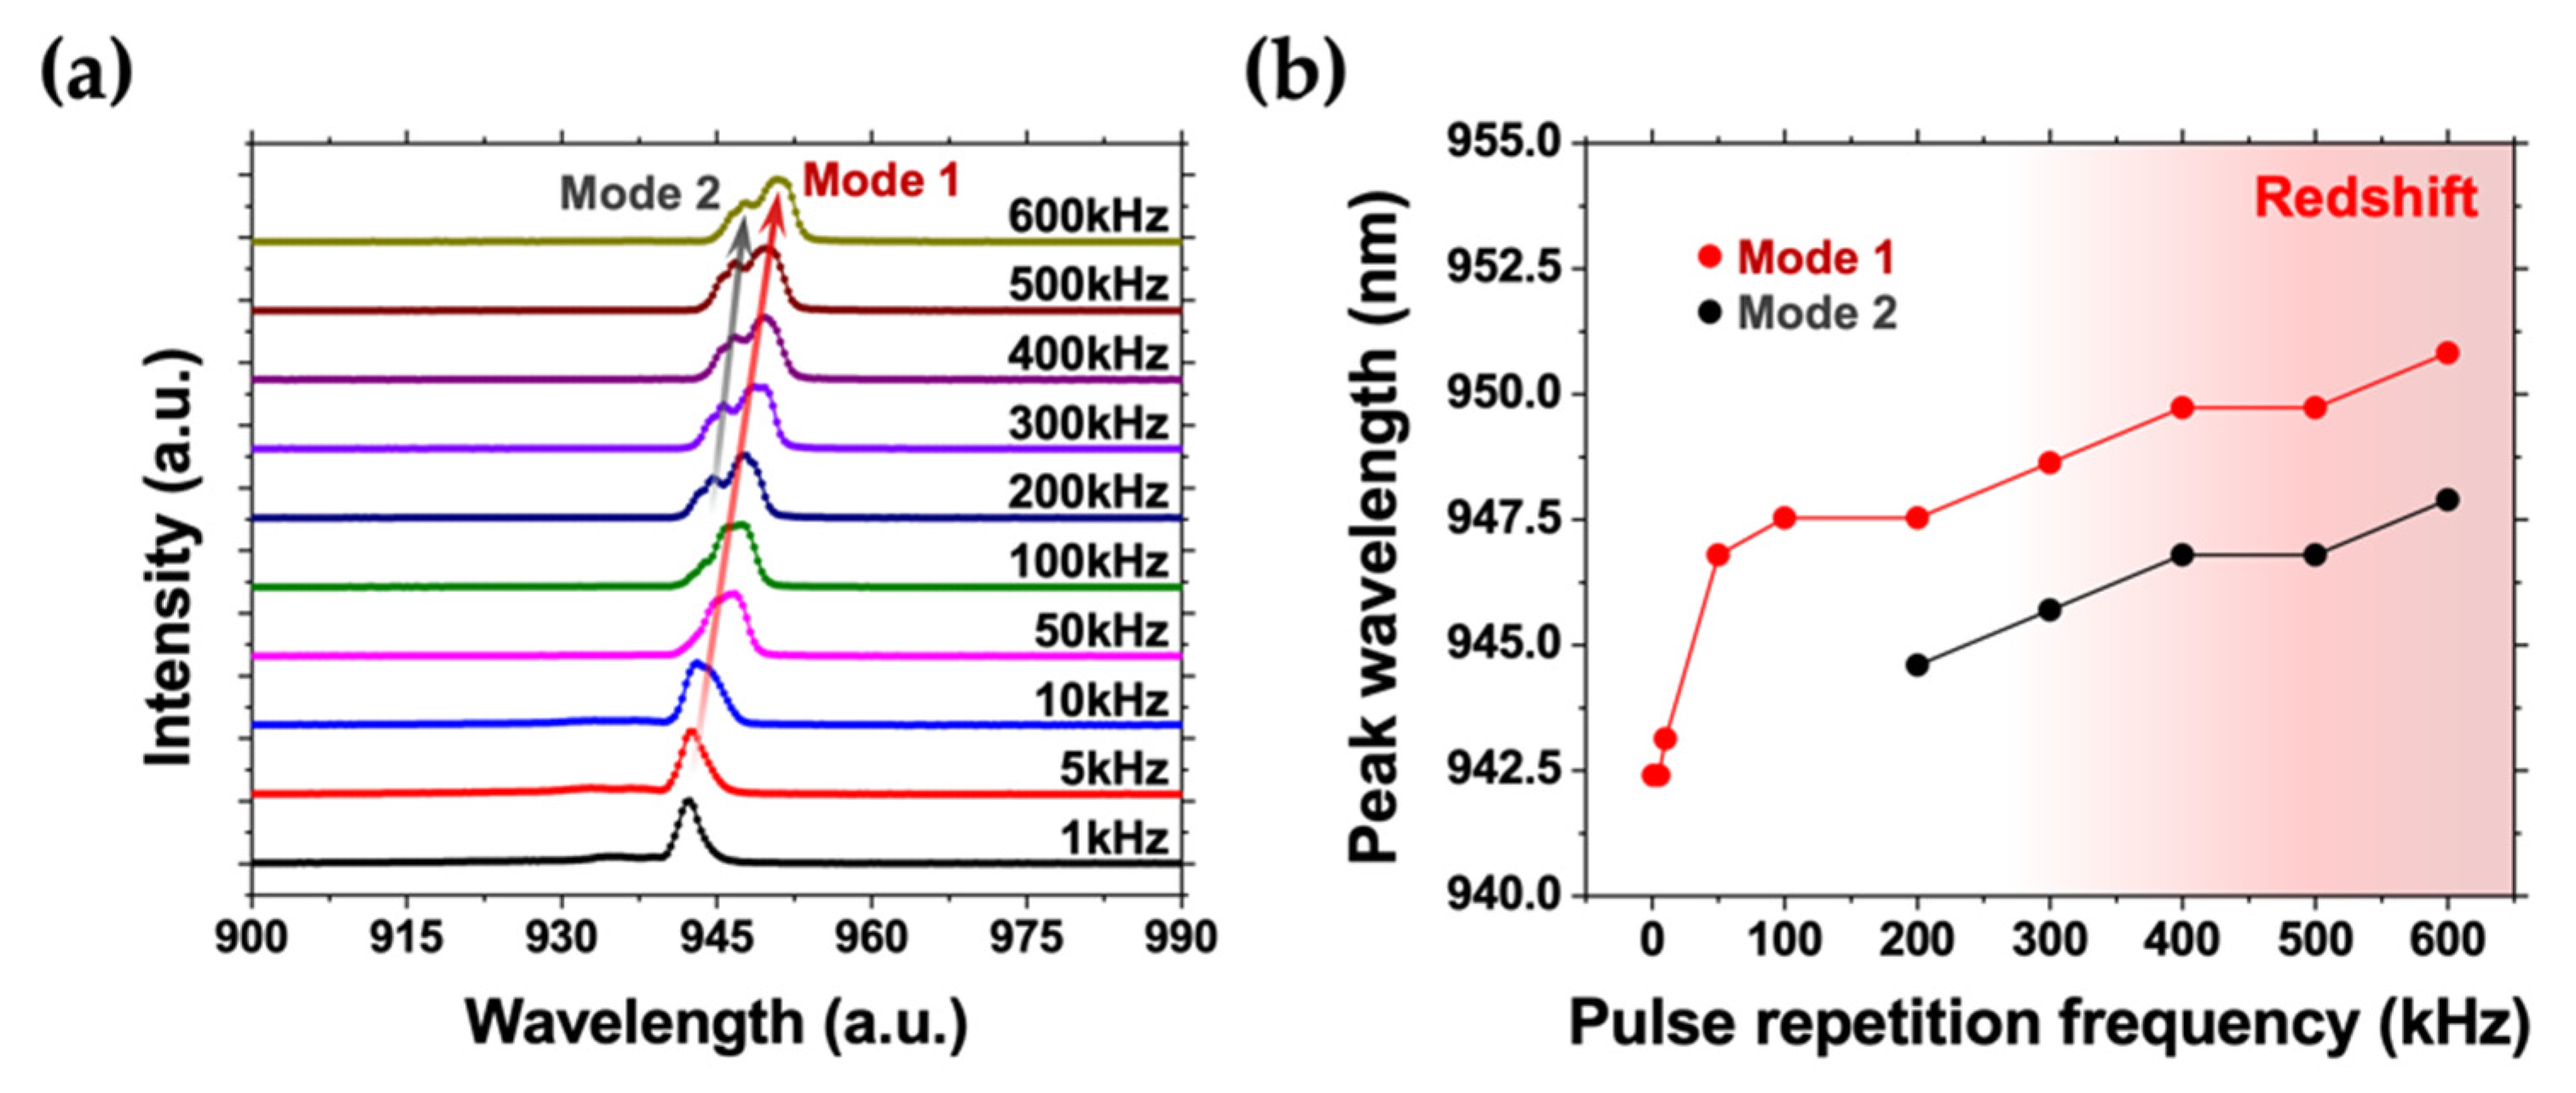
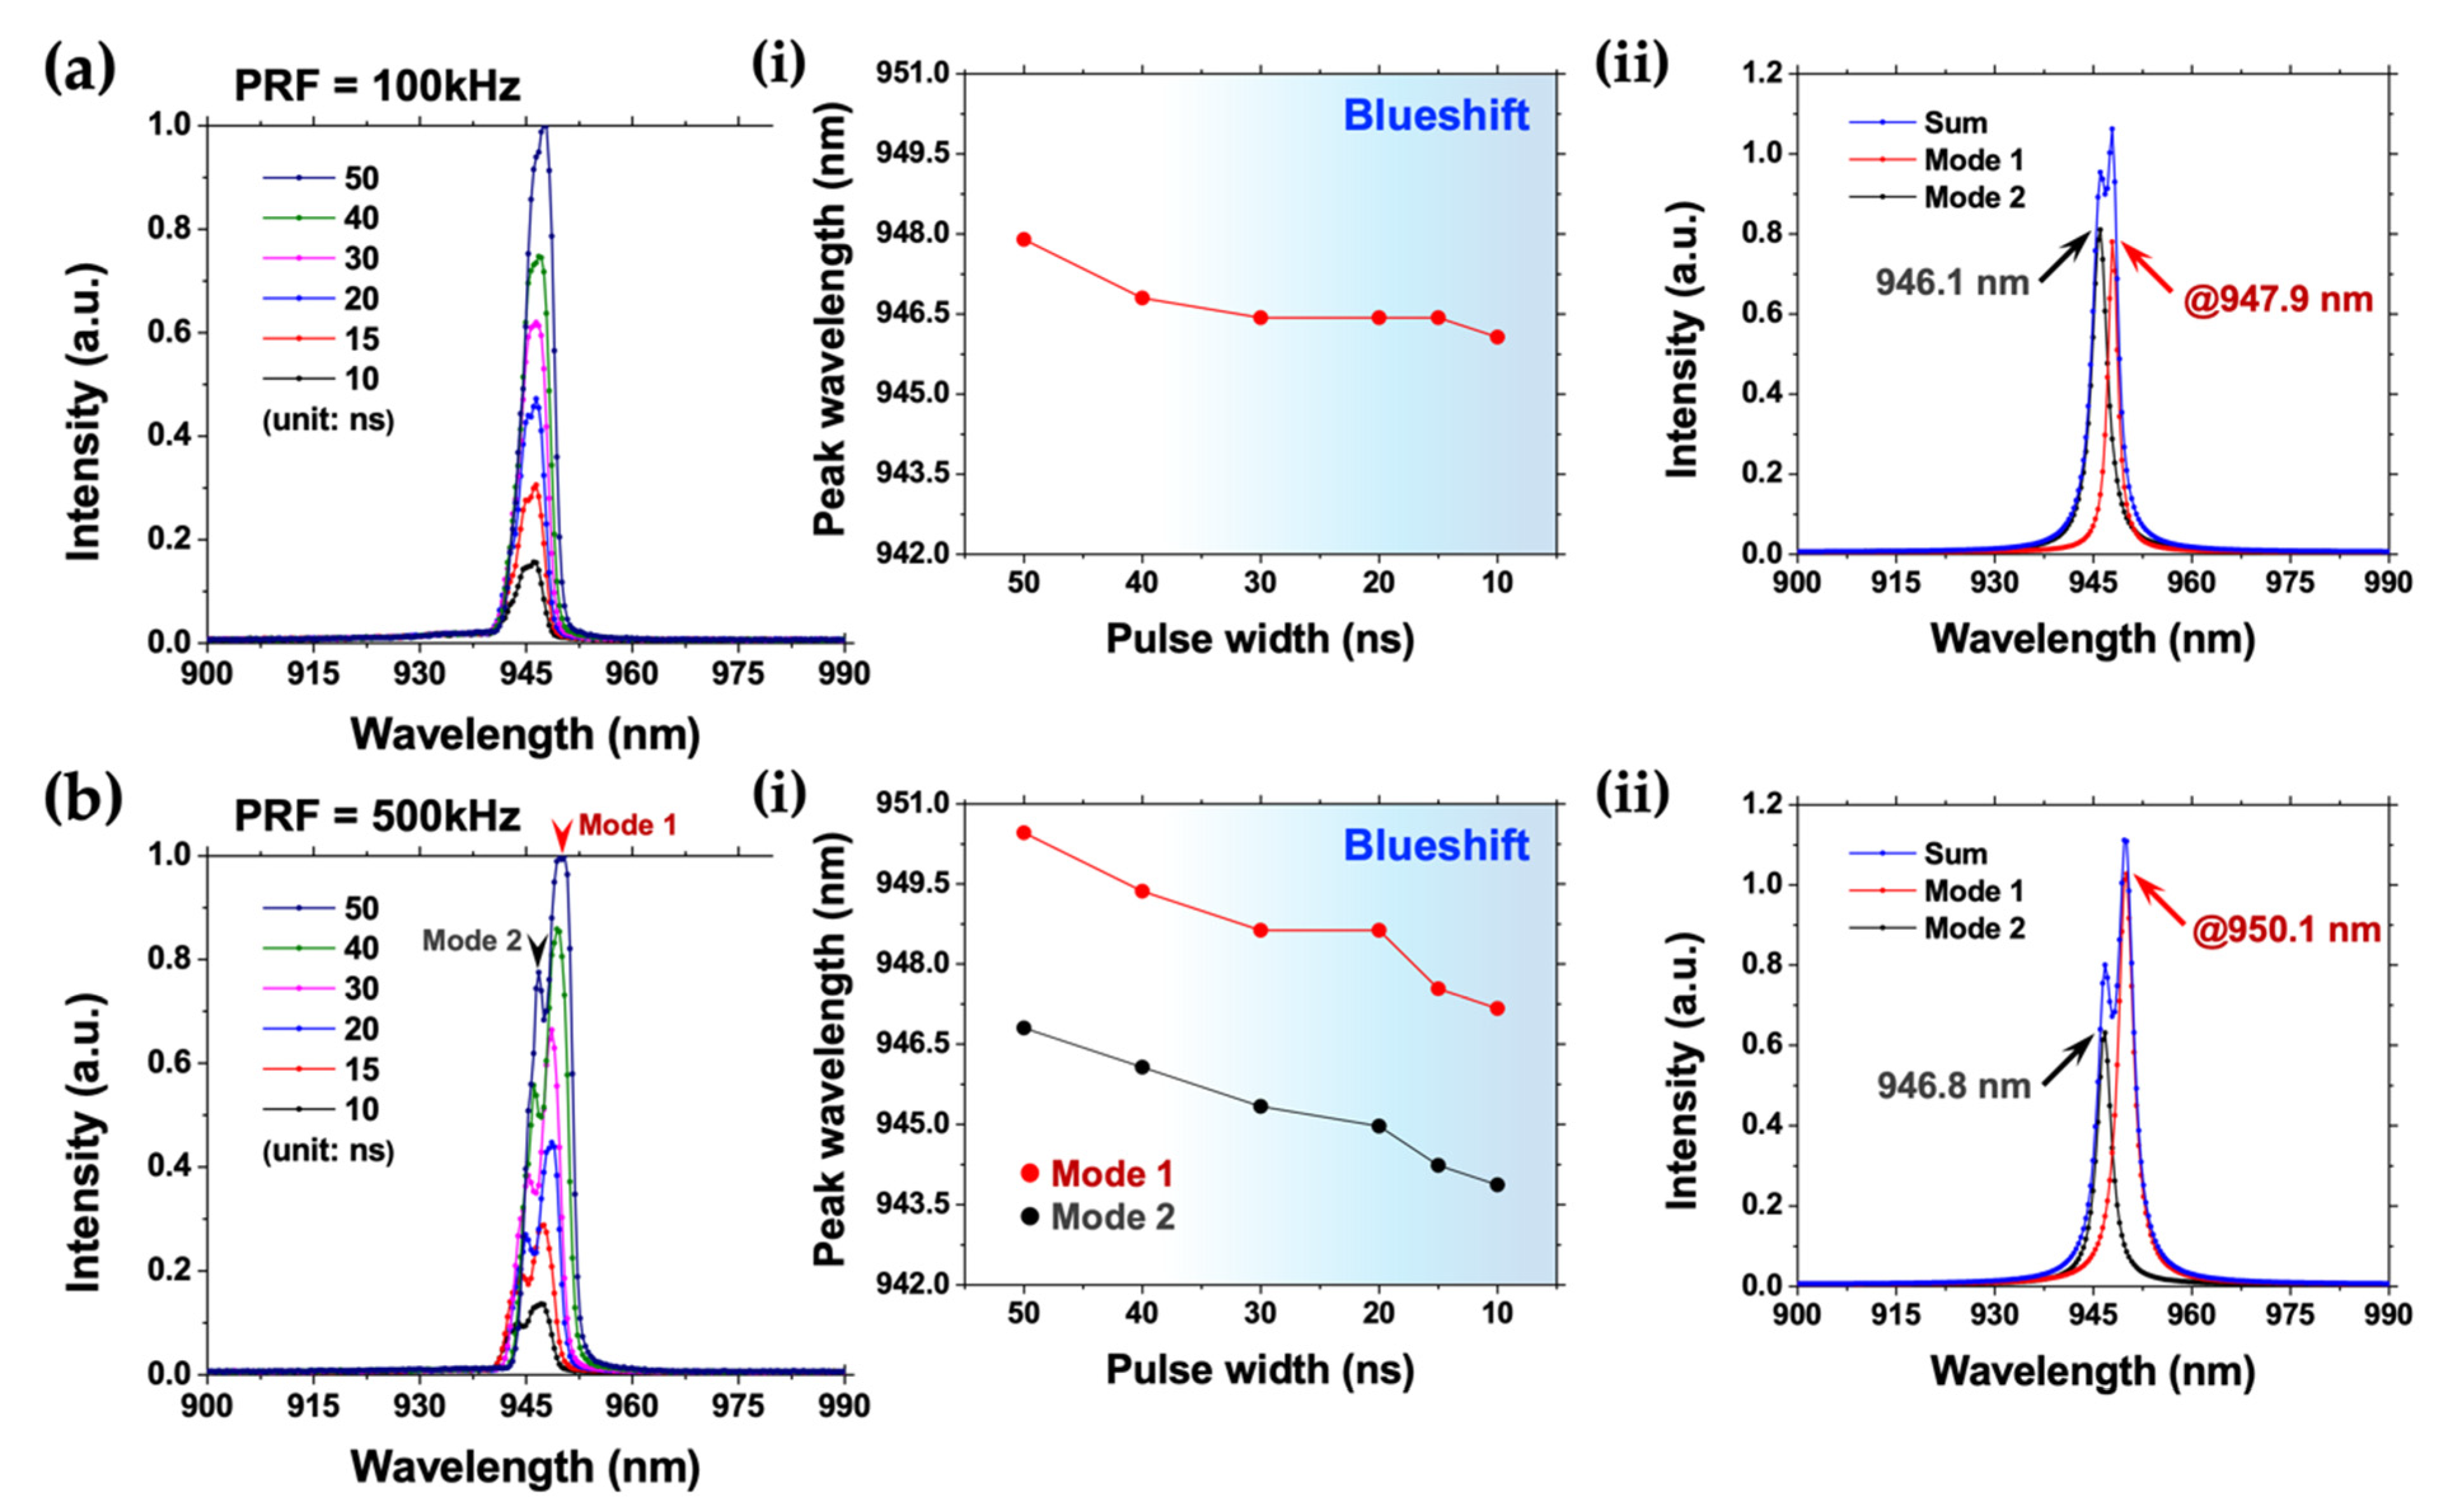
2.3. Optical Behaviors of Relevant Light Emission

To comprehensively characterize the corresponding optical behaviors of light emission under different conditions, a spectrometer (Ocean Insight FLAME-T-XR1) is employed, replacing the aforesaid photodiode. Such a compact spectrometer can provide a precise study of spectroscopy within the wavelength range of 200−1025 nm with an optical resolution of 1.7 nm. Laser light pulses are emitted from the activated PCSEL in accordance with the timing of gate input voltage, namely the turn-on pulses. Whereby the integration time of the spectrometer is set as 10 ms, calculating and analyzing relevant spectra and optical behaviors.
Figure 4 shows the light emission spectra and optical behaviors of the PCSEL operated with miscellaneous PRFs. Herein, the corresponding PRFs are set as the above investigation, namely from 1 kHz up to 600 kHz but all pulse widths are fixed at 50 ns. The corresponding duty cycles are varied from 0.005% up to 3%. While the PRF rises, an apparent redshift can be observed, owing to the aforesaid self-heating effect of the PCSEL device, as shown in Figure 4a. Moreover, once the PRF is applied beyond 200 kHz, namely a duty cycle of 1%, dual-mode spectra can be distinguished, developing an additional Mode 2. Such dual-mode phenomenon may originate from the heat accumulation of a PCSEL device, enabling the lasing action of side modes. Moreover, the power redistribution among different oscillation modes is slow under such rapid pulse operation, namely the rapid current changes, thus hindering preserving an exact mode selection [47]. As shown in Figure 4b, the corresponding center wavelengths are extracted from Figure 4a for comparison among miscellaneous PRFs. For both Mode 1 and Mode 2, the higher PRF, the redder center wavelengths. The center wavelengths of Mode 1 shift from 942.4 nm to 950.82 nm, operated at 1 kHz and 600 kHz, respectively. For the additional Mode 2, the corresponding center wavelengths shift from 944.6 nm to 947.9 nm with the PRF of 200 kHz and 600 kHz, respectively.
As shown in Figure 5, the effects of varying pulse width are profoundly investigated. Herein, the employed PCSEL is operated with two fixed PRFs of 100 kHz and 500 kHz, providing two types of spectral behavior, namely the single- and dual-mode spectra. Thereby, the operating pulse width for both conditions is shrunk from 50 ns to 10 ns, in the same way, looking at the corresponding light emission behaviors. Thus, the corresponding duty cycles are shrunk from 0.5% down to 0.01% and from 2.5% down to 0.5% for the fixed PRFs of 100 kHz and 500 kHz, respectively. Moreover, since the integration time of the spectrometer is set as 10 ms, spectrum intensity is linearly proportional to the stimulus interval of gate input voltage with a fixed PRF, namely the pulse width.
Figure 5a shows the light emission spectra of the PCSEL operated at 100 kHz with a series of pulse widths. Thereby, the corresponding duty cycles are manipulated from 0.5% down to 0.1%. Linear relation between the integrated intensity of spectra and pulse width can be distinctly observed. To gain a deeper understanding of the optical behaviors, corresponding center wavelengths are extracted. A slight blueshift, from 947.9 nm to 946.07 nm, can be discerned, as shown in the inset (i) of Figure 5a. The shorter pulse width, the bluer center wavelength. Moreover, a flat saturation of center wavelength can be observed while the pulse width is shrunk down to 30 ns, namely a duty cycle of 0.3%, indicating the alleviation of the self-heating effect, and thus achieving equilibrium in ambient conditions. Moreover, the corresponding peak deconvolution of the PCSEL operated at 100 kHz with a pulse width of 50 ns is conducted as well, gaining a deeper understanding of the nonsymmetric spectra, as shown in the inset (ii) of Figure 5a. Herein, an implicit dual-mode phenomenon can be observed. For Mode 1 and Mode 2, the corresponding center wavelengths are 947.9 nm and 946.1 nm, respectively.
While the employed PCSEL is operated at 500 kHz, dual-mode spectra emerge, as shown in Figure 5b. Herein, the corresponding duty cycles are manipulated from 2.5% down to 0.5%. the Once again, optical behaviors of spectra retain the linear relation between the integrated intensity of spectra and pulse width. However, the blueshift phenomenon is evident, owing to the alleviation of the severe self-heating effect of a PCSEL device operated herein under such high PRF conditions. Shrinking the pulse width can provide not only less heat generation but also offer enough time for heat dissipation. Corresponding center wavelengths are thus extracted for a perspicuous view, as shown in the inset (i) of Figure 5b. The blueshift phenomenon is more apparent in both Mode 1 and Mode 2. While the pulse width is shrunk from 50 ns to 10 ns, blueshifts for Mode 1 and Mode 2 can be discerned from 950.46 nm to 947.17 nm and 946.8 nm to 943.87 nm, respectively. The corresponding peak deconvolution of the PCSEL operated at 500 kHz with a pulse width of 50 ns is conducted, as shown in the inset ii of Figure 5b. A distinct dual-mode phenomenon can be recognized for Mode 1 and Mode 2 with the corresponding center wavelengths of 950.1 nm and 946.8 nm, respectively. It is worth mentioning that a slight redshift can be observed with a higher PRF, indicating a severer self-heating effect.

3. Reliability Test for the Integrated System

Considering the practical usage, the reliability test for the integrated system is conducted through the corresponding photodiode responses and relevant optical behaviors of light emission from the employed PCSEL. Therefore, the self-heating effect and the relevant side mode suppression ratios (SMSRs) under different conditions are systematically discussed in the following section. All reliability testing was performed in ambient conditions without an external cooling system.

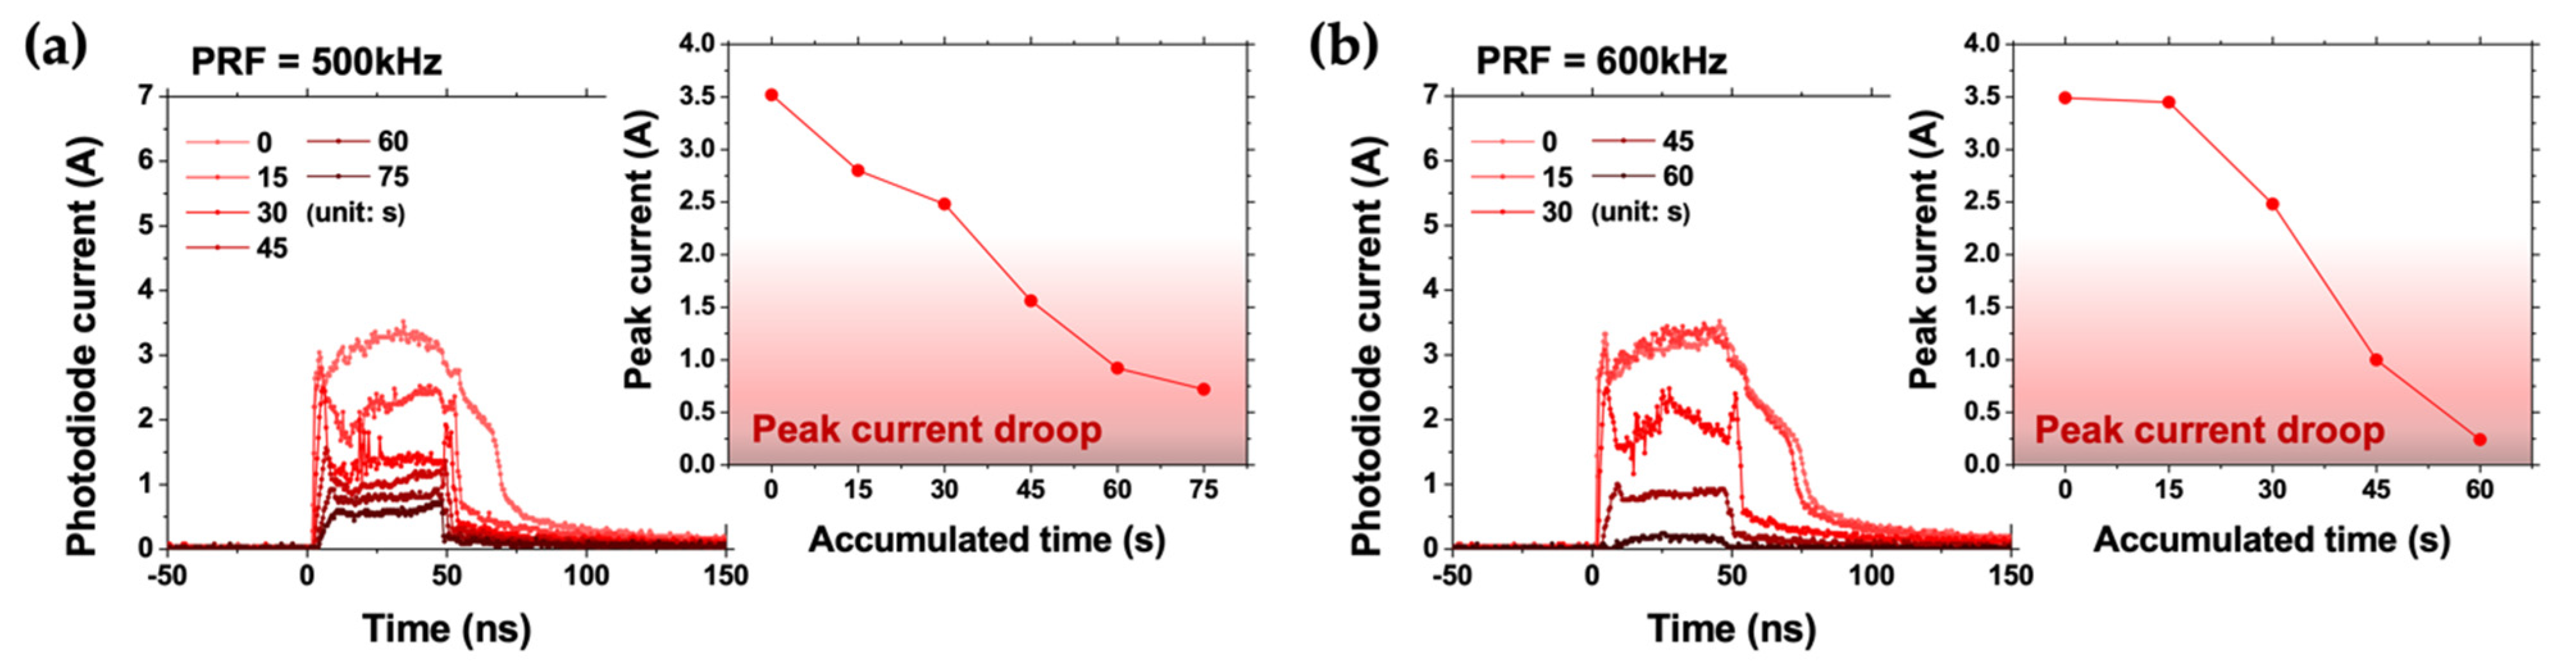
3.1. Self-Heating Effect of PCSEL in High-Frequency Operation

The aforementioned discussion of the rollover in peak current operated at high PRF indicates the harsh self-heating effect for down-to-earth applications. Since heat will accumulate over time, relevant photodiode responses from the PCSEL operated at 500 kHz and 600 kHz with a fixed pulse width of 50 ns, namely at the corresponding duty cycles of 2.5% and 3%, are analyzed in the sequence of accumulated time, as shown in Figure 6a,b, respectively.
Under both 500 kHz and 600 kHz operation conditions, the waveforms of photodiode current are consistent with the stimulus interval, namely the gate input voltage. However, due to device degradation, significant rollover in peak current can be observed in the process of time. It is worth mentioning that the tail currents of both 500 kHz and 600 kHz alleviate at the accumulated time of 15 s and 30 s, respectively. Meanwhile, blatant overshooting and the ringing waveforms at the starting point of the stimulus interval can be observed as well. Corresponding peak currents are extracted for both PRFs, providing intuitive views, as shown in the insets of Figure 6. The corresponding peak current at 500 kHz drops from 3.52 A to 0.72 A within 75 s, whereas the corresponding peak at 600 kHz current rapidly drops from 3.49 A to 0.24 A within just 60 s. Such a result is caused by a higher pulse repetition frequency.
On the other hand, for the optical behaviors of relevant light emission, the corresponding light emission spectra are shown in Figure 7. Due to the large instantaneous injected current and the slow power redistribution among different oscillation modes under such rapid pulse operation, the dual-mode phenomenon in spectra can be discerned [47]. Relevant optical behaviors are consistent with the earlier discussion, namely that a redshift can be observed with a higher PRF. Accordingly, the corresponding center wavelengths are extracted for both PRFs, as shown in the insets of Figure 7. Operated at 500 kHz, the initial center wavelengths of Mode 1 and Mode 2 are 949.36 nm and 946.43 nm and ultimately shift to 955.57 nm and 952.65 nm, respectively. Additionally, the initial center wavelengths operated at 600 kHz of Mode 1 and Mode 2 are 949.73 nm and 946.8 nm and ultimately shift to 953.02 nm and 952.29 nm, respectively. The longer the accumulated time as well as the higher PRF, the redder the corresponding center wavelengths for both modes.
The corresponding peak deconvolution of the PCSEL is performed as well. Herein, the dual-mode phenomenon can be recognized for both conditions. As shown in the inset (ii) of Figure 7a, the corresponding center wavelengths operated at 500 kHz for Mode 1 and Mode 2 are of 949.4 nm and 946.1 nm, respectively. While operating at 600 kHz, the corresponding center wavelengths for Mode 1 and Mode 2 are of 949.7 nm and 946.4 nm, respectively, as shown in the inset ii of Figure 7b. Since the PCSEL is operated under such high PRF, there is no evident redshift between these two conditions.

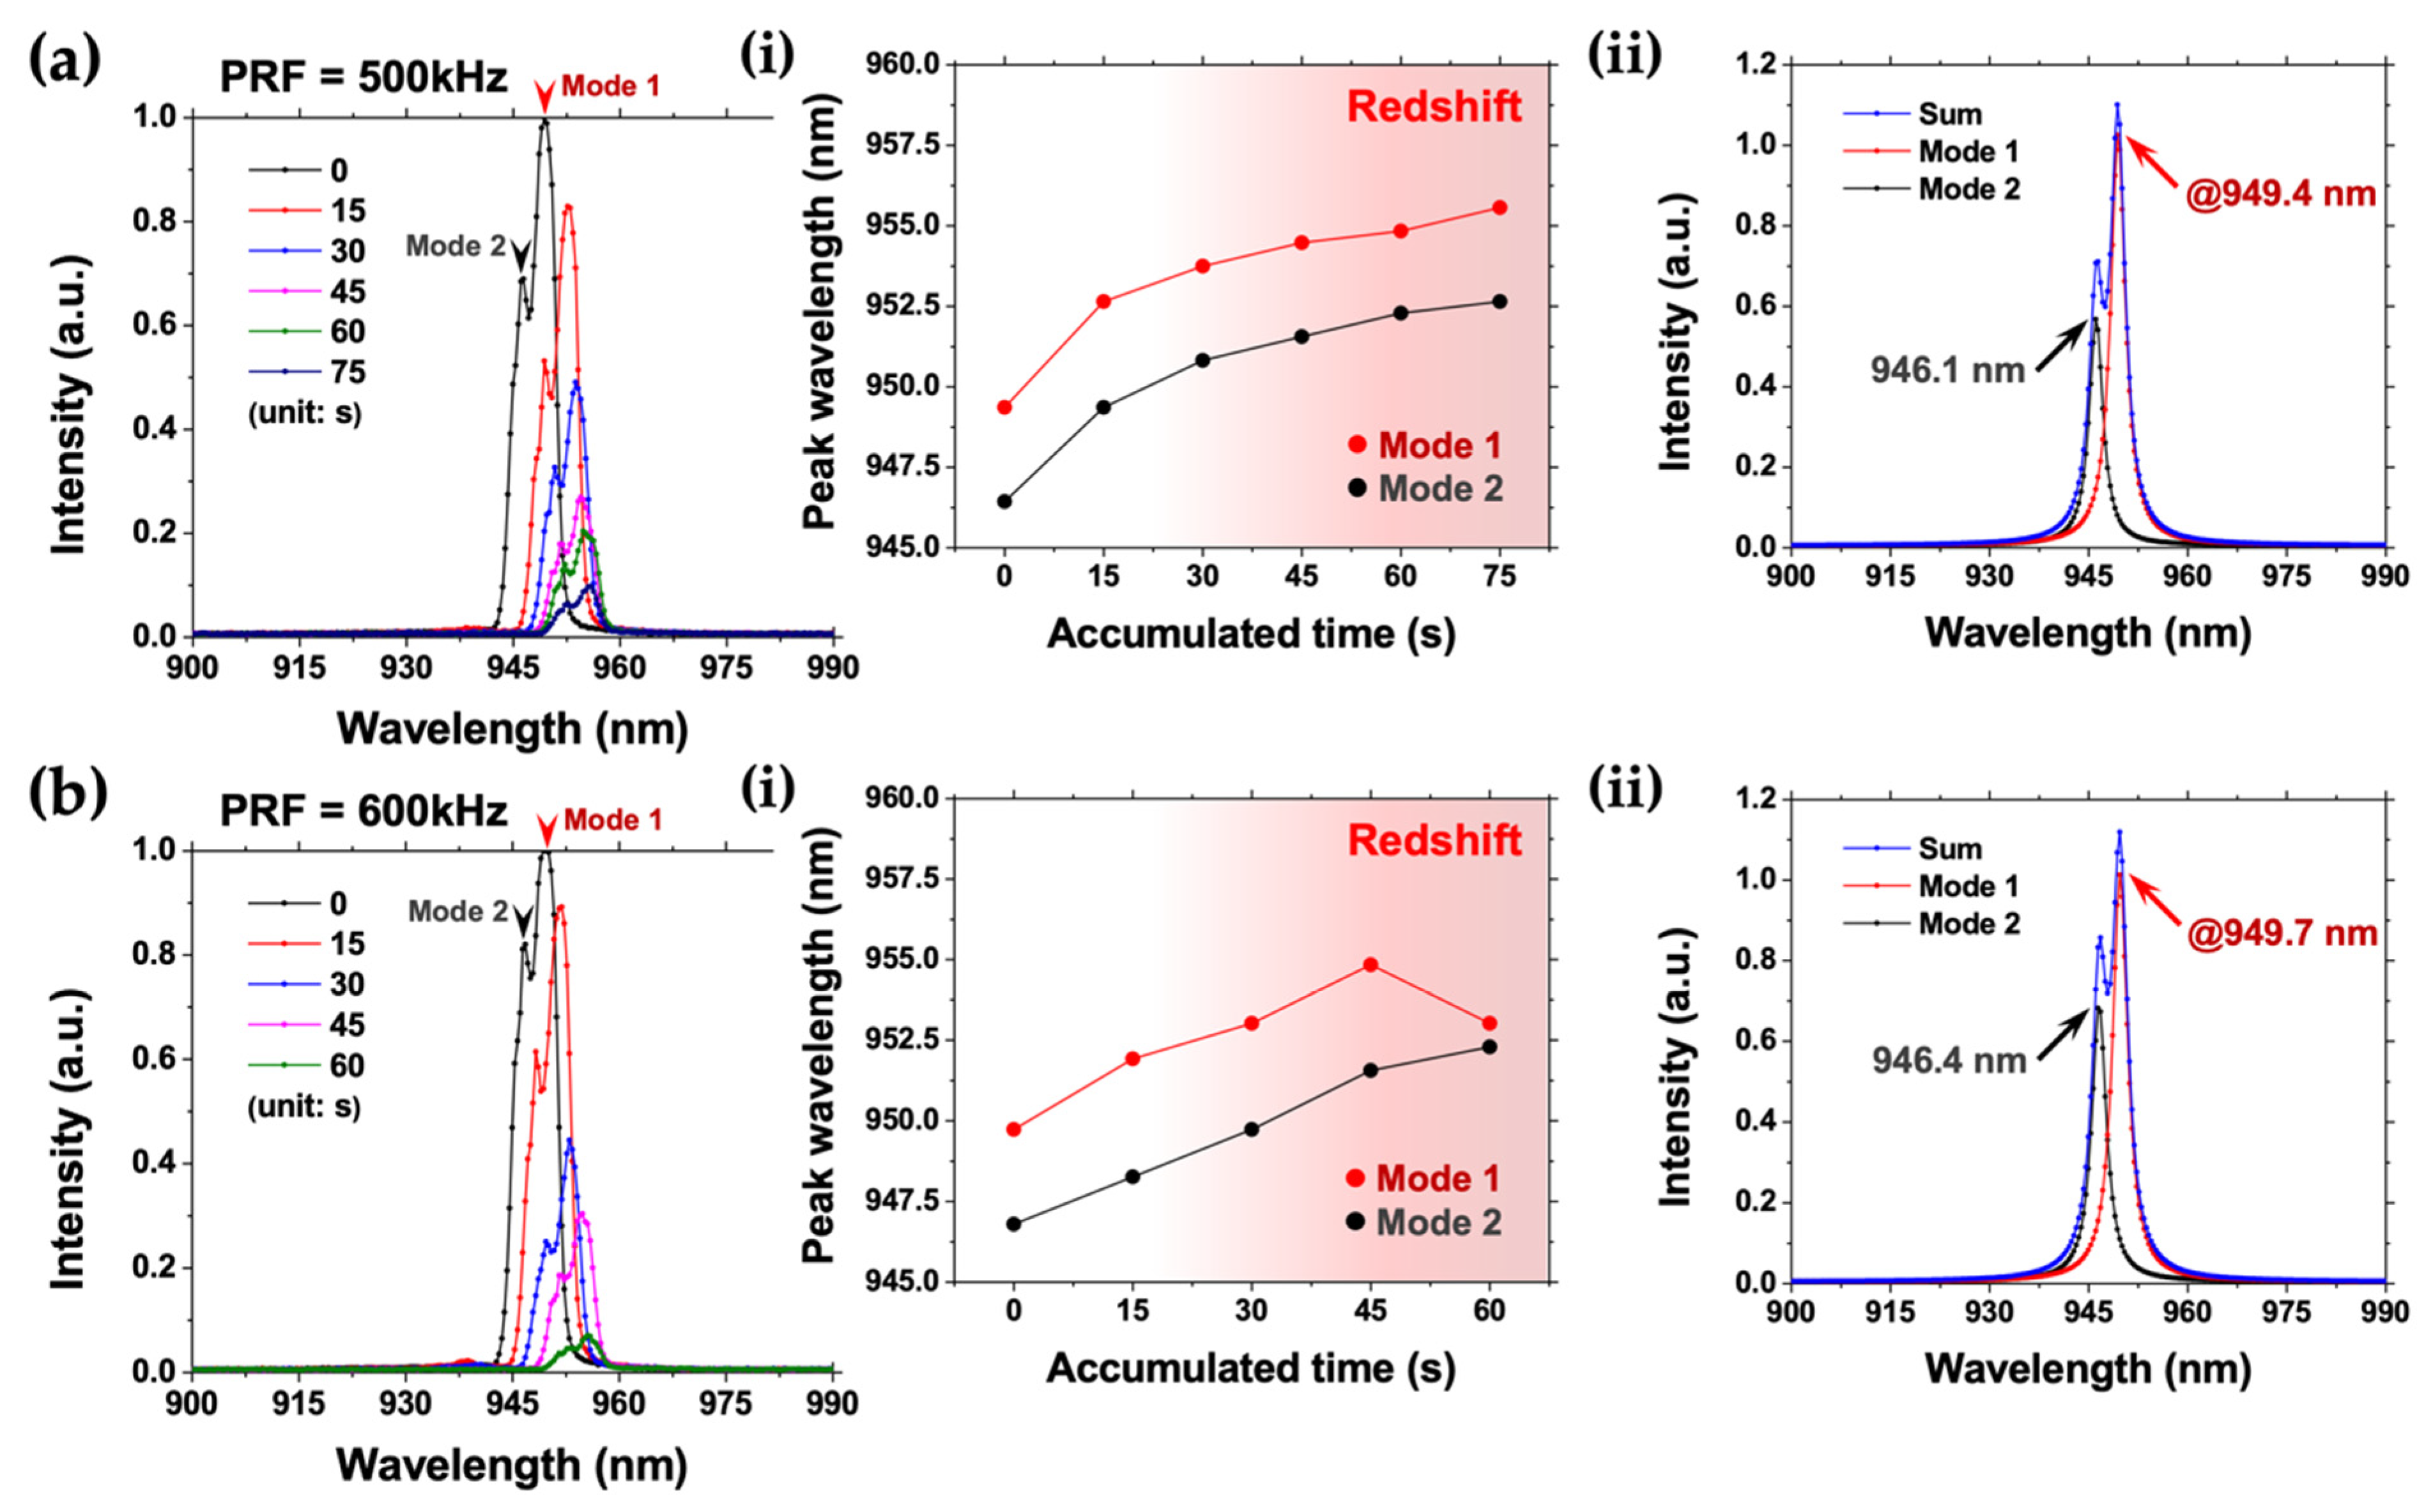
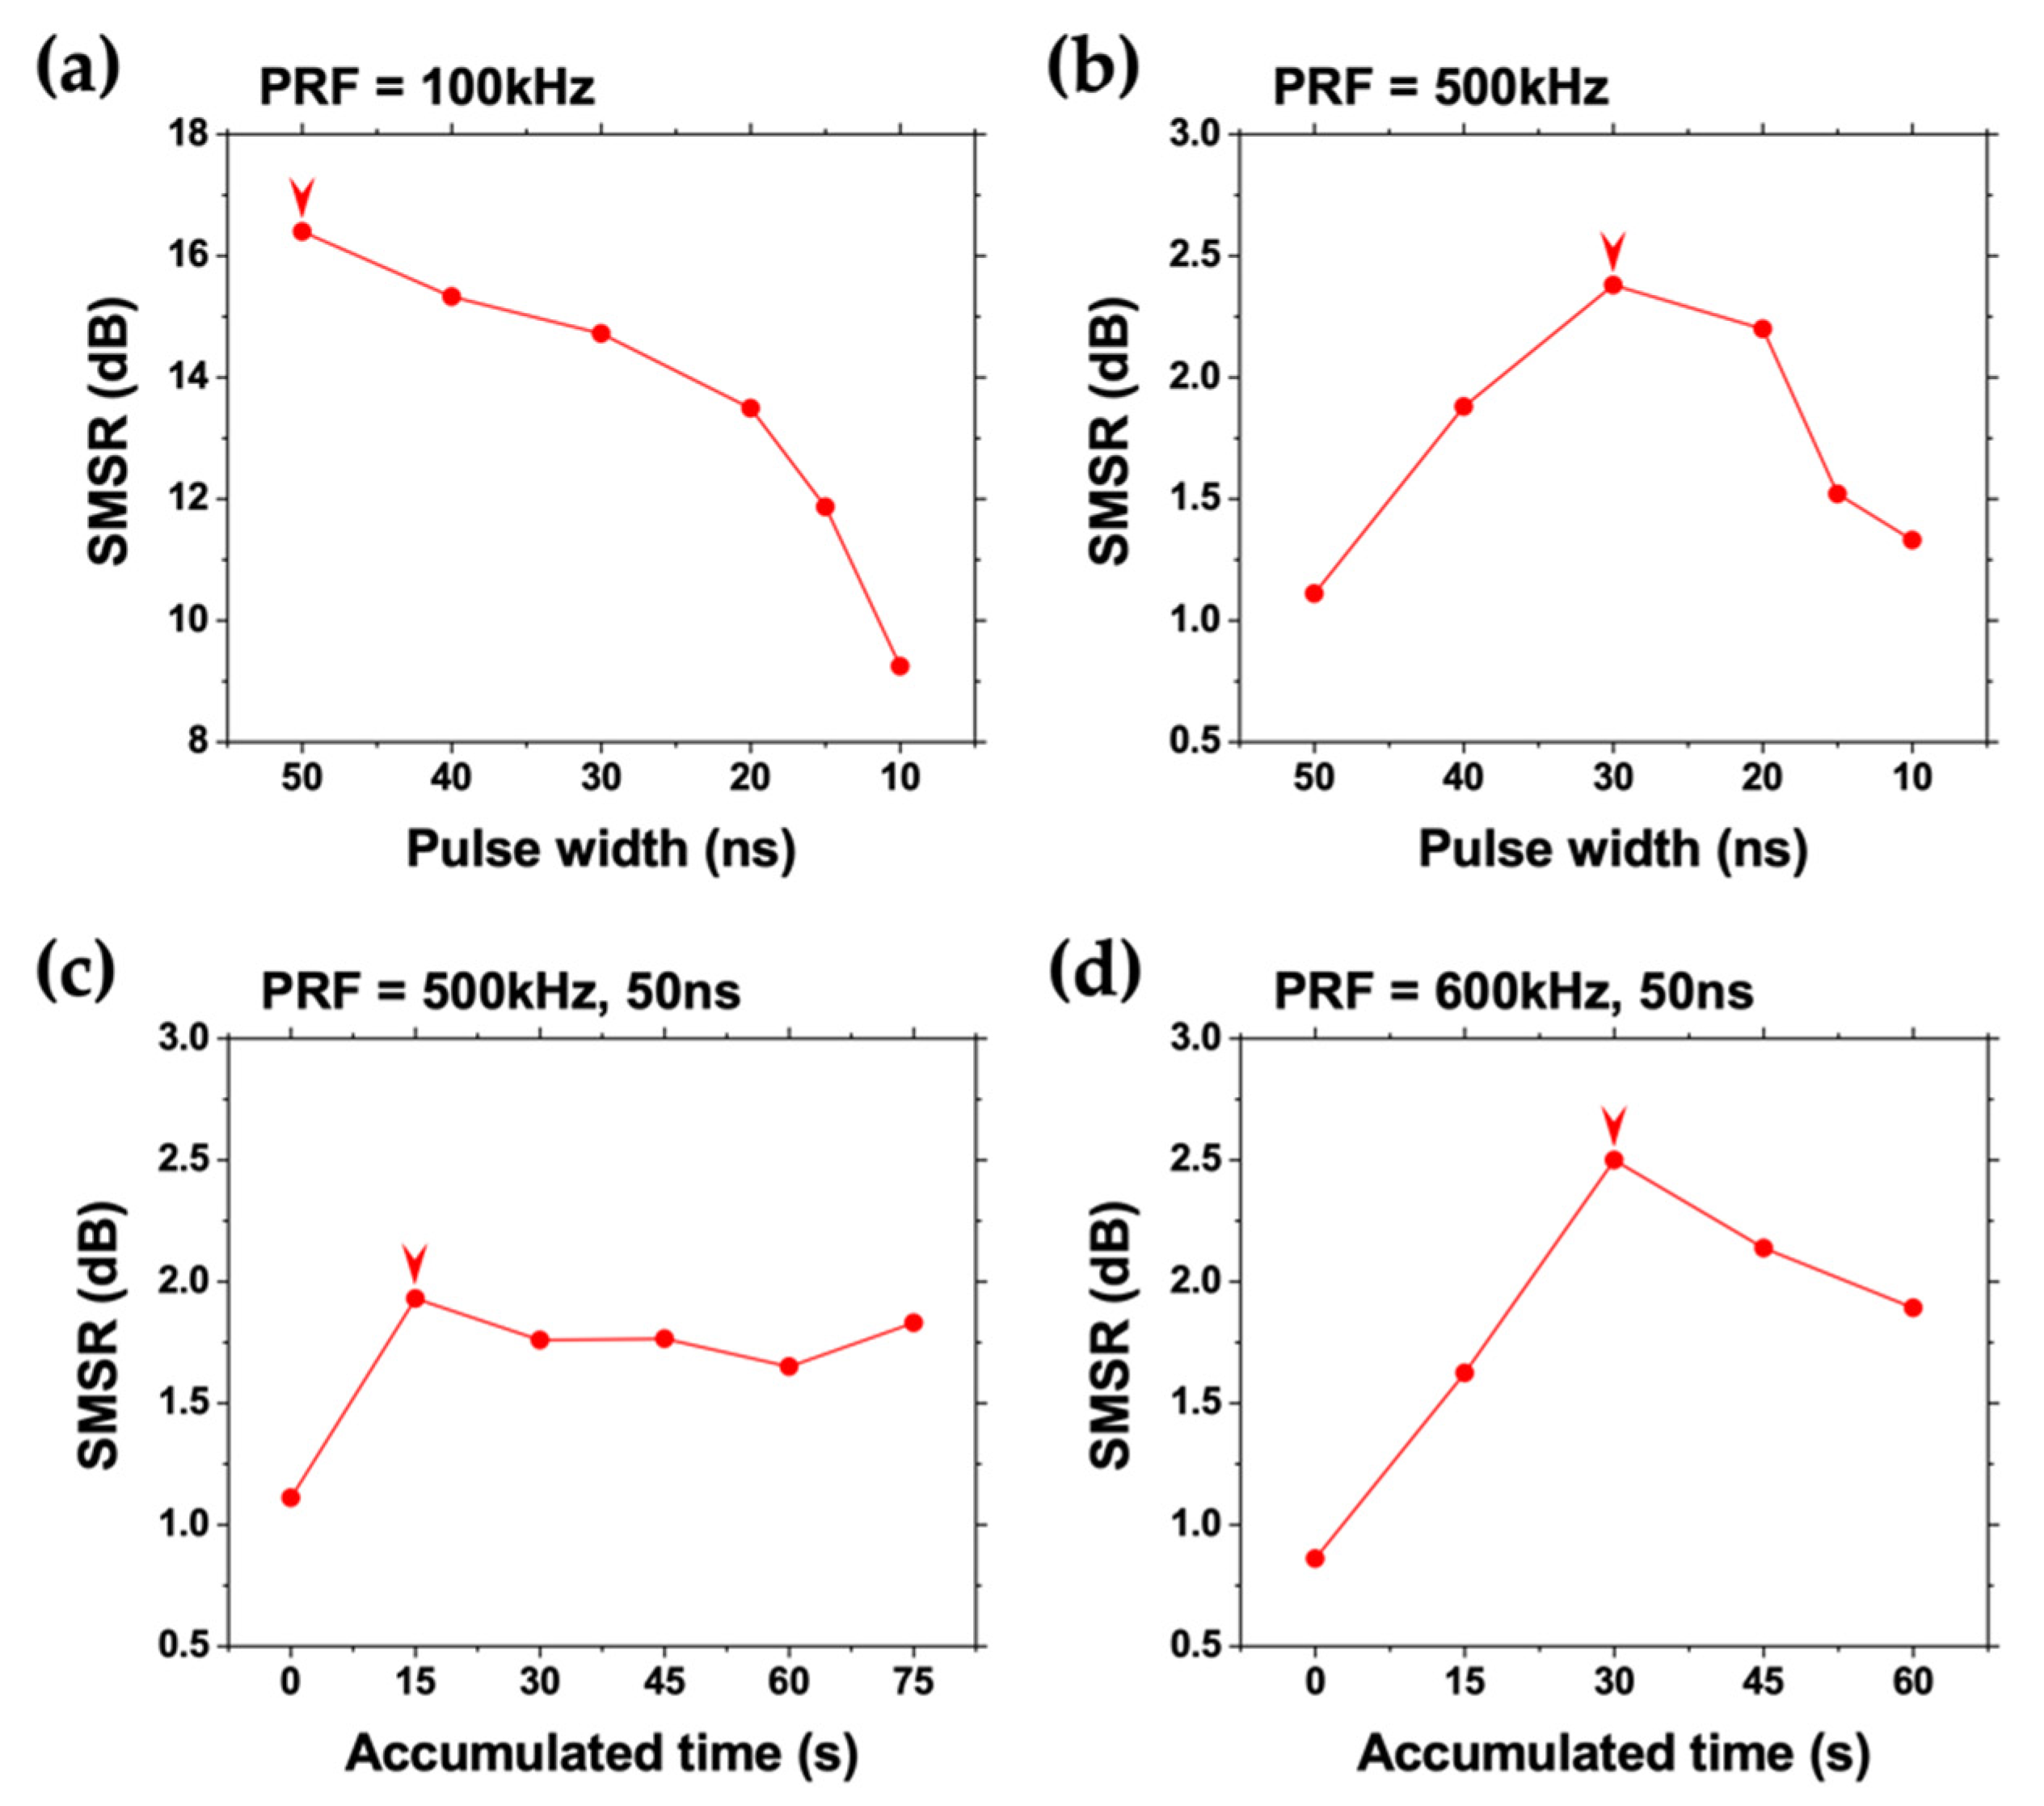
3.2. Relevant Side Mode Suppression Ratios under Different Conditions

Herein, based on the preceding experimental results, relevant side mode suppression ratios (SMSRs) of the employed PCSEL operated under different conditions are evaluated, as shown in Figure 8. Typically, the larger the SMSR, the better the laser performance. However, operating under distinct conditions will result in different SMSRs. The relation of laser light emission intensity between the center-peak-longitudinal mode and the nearest higher-order mode can thus be investigated.
Figure 8a demonstrates a series of SMSRs operated at a fixed PRF of 100 kHz but shrinking the corresponding pulse widths from 50 ns down to 10 ns. Thus, the corresponding duty cycles are shrunk from 0.5% down to 0.1%. The highest SMSR of 16.4 dB appears while the pulse width is 50 ns. However, SMSR rapidly decreases as the pulse width shrinks. Eventually, the SMSR is down to 9.25 dB with a pulse width of 10 ns. At a high PRF of 500 kHz, dual-mode spectra emerge, suppressing the subsequent SMSRs. The corresponding duty cycles are manipulated from 2.5% down to 0.5%. As shown in Figure 8b, the corresponding SMSR initially welcomes a progressive increment, during which the SMSRs grow from 1.11 dB to the highest SMSR of 2.38 dB with pulse widths of 50 ns and 30 ns, respectively. Later, a plateau keeps until the pulse width shrinks down to 20 ns, namely a duty cycle of 1%. The SMSR drops to 1.33 dB in the end.
For SMSRs regarding the self-heating effect of PCSEL under rapid operations with a fixed pulse width of 50 ns, corresponding results are extracted as well. While operating at 500 kHz, namely a duty cycle of 2.5%, the corresponding SMSR is 1.11 dB as the initial condition of Figure 8b. The SMSR reaches the highest value of 1.93 dB at the accumulated time of 15 s, as shown in Figure 8c. From then on, relevant SMSRs keep a plateau over time by achieving an equilibrium, lasting around 60 s. Such an equilibrium phenomenon of SMSRs can be observed even though the intensity of photodiode responses and the corresponding light emission spectra decays in process time. However, operated at 600 kHz, namely a duty cycle of 3%, the equilibrium phenomenon is implicit, as shown in Figure 8d. The highest SMSR of 2.14 dB appears at the accumulated time of 30 s, and afterward the SMSR drops down to 1.89 dB. Due to the severe self-heating effect under this condition, the intensity of photodiode responses and the corresponding light emission spectra fades out within just 60 s. Thus, the follow-up plateau of SMSRs is not observed but decreases under this condition.

4. Conclusions

Comprehensive analyses for modulating light emission performance of PCSEL via GaN HEMT driving circuit have been conducted and well investigated for the first time. It begins with the electrical characteristics of the employed D-mode GaN HEMT. It goes on to the integrated system on a matrix board with its corresponding circuit topology, illustrating the relevant operating principles. Thereby, the electro-optical responses of the driving circuit are systematically scrutinized for relevant light emission, providing a deep insight into both photodiode responses and optical behaviors.
A sequence of photodiode responses from the PCSEL with a fixed pulse width of 50 ns and distinct PRFs from 1 kHz to 600 kHz are demonstrated. Accordingly, the corresponding duty cycles are varied from 0.005% up to 3%. An apparent output droop can be observed while increasing PRF. Due to the severe self-heating effect of the PCSEL device, heat will accumulate over time. Significant rollover in both peak current and the overall light emission intensity emerges. On the other hand, consecutive photodiode responses from the PCSEL with a fixed PRF of 100 kHz, shrinking the pulse width from 50 ns down to 10 ns, are performed as well. The corresponding duty cycles are shrunk from 0.5% down to 0.1%. Shrinking the pulse width, a rollover phenomenon in peak current emerges. For the corresponding optical behaviors of light emission, the shorter pulse width, the bluer center wavelength. The blueshift phenomenon may derive from the alleviation of the severe self-heating effect of the PCSEL device. Shrinking the pulse width can provide not only less heat generation but also offer enough time for heat dissipation under the same PRF.
Turning now to real-world usage, reliability is vitally important for such an integrated system. Relevant photodiode responses from the PCSEL and the optical behaviors operated at 500 kHz and 600 kHz with a fixed pulse width of 50 ns have been sufficiently discussed. The corresponding duty cycles operated at 500 kHz and 600 kHz are 2.5% and 3%, respectively. Due to the self-heating effect, heat will accumulate over time. Obvious output droop and the redshift phenomenon in spectra can be observed. The higher the PRF, the more rapid the device degradation. As a result, the employed PCSEL device can sustain 60 s and 75 s while operated at 500 kHz and 600 kHz, respectively. For the optical behaviors of light emission, the dual-mode phenomenon in spectra can be discerned. The longer the accumulated time as well as the higher the PRF, the redder the corresponding center wavelengths for both modes.
Regarding relevant SMSRs of the employed PCSEL operated under different conditions were evaluated and analyzed. Operated at a fixed PRF of 100 kHz, namely a duty cycle of 0.5%, the SMSR can be evaluated up to 16.4 dB while the pulse width is 50 ns. SMSR rapidly decreases while shrinking the pulse width. On the other hand, at a high PRF of 500 kHz, namely a duty cycle of 2.5%, the dual-mode phenomenon emerges and suppresses the subsequent SMSRs, resulting in the lowest SMSR down to 1.11 dB with a pulse width of 50 ns. Finally, the self-heating effect of PCSEL under rapid operations with a fixed pulse width of 50 ns and the corresponding SMSRs are evaluated as well. Operated at 500 kHz, namely a duty cycle of 2.5%, the corresponding SMSR is 1.11 dB and the highest SMSR reaches 1.93 dB at the accumulated time of 15 s, keeping a plateau over time around 60 s. Operated at 600 kHz, namely a duty cycle of 3%, the highest SMSR of 2.14 dB appears at the accumulated time of 30 s, and afterward the SMSR drops down to 1.89 dB within just 60 s.
A paradigm for modulating the light emission performance of PCSEL via a GaN HEMT driving circuit has been demonstrated here for the first time. Operated under different conditions, relevant analyses have been enquired into; not only electro-optical responses but also the corresponding optical behaviors. Thus, prospects for the next generation LiDAR system in high-power and high-speed operation can be expected.

Author Contributions

Conceptualization, S.-C.C. and H.-C.K.; investigation, Y.-H.H. and C.-Y.L.; HEMT device preparation, C.-H.L. and E.Y.C.; technical support, L.-C.T., T.-C.L. and W.-H.C.; experimental measurements, C.-Y.L.; data curation, Y.-H.H. and C.-Y.L.; writing—original draft preparation, Y.-H.H., C.-Y.L., J.-D.C. and C.-Y.P.; writing—review and editing, Y.-H.H., S.-C.C. and H.-C.K.; supervision, H.-C.K.; project administration, S.-C.C. All authors have read and agreed to the published version of the manuscript.

Funding

This research was funded by the Ministry of Science and Technology in Taiwan (Grant Nos. MOST 110-2622-8-A49-008-SB).

Institutional Review Board Statement

Not applicable.

Informed Consent Statement

Not applicable.

Data Availability Statement

Not applicable.

Acknowledgments

The authors would like to gratefully acknowledge Wei-Bin Lee from the Hon Hai Research Institute and Tsung Sheng Kao at the National Yang Ming Chiao Tung University for the fruitful discussion and relevant technical support.

Conflicts of Interest

The authors declare no conflict of interest.

References

  1. Brinkløv, S.; Fenton, M.B.; Ratcliffe, J.M. Echolocation in oilbirds and swiftlets. Front. Physiol. 2013, 4, 123. [Google Scholar] [CrossRef] [PubMed]
  2. Novacek, M.J. Evidence for echolocation in the oldest known bats. Nature 1985, 315, 140–141. [Google Scholar] [CrossRef]
  3. Au, W.W.; Benoit-Bird, K.J. Automatic gain control in the echolocation system of dolphins. Nature 2003, 423, 861–863. [Google Scholar] [CrossRef]
  4. Zhou, X.; Sun, F.; Xu, S.; Fan, G.; Zhu, K.; Liu, X.; Chen, Y.; Shi, C.; Yang, Y.; Huang, Z.; et al. Baiji genomes reveal low genetic variability and new insights into secondary aquatic adaptations. Nat. Commun. 2013, 4, 2708. [Google Scholar] [CrossRef] [PubMed]
  5. Bhandari, A.; Raskar, R. Signal processing for time-of-flight imaging sensors: An introduction to inverse problems in computational 3-D imaging. IEEE Signal Process. Mag. 2016, 33, 45–58. [Google Scholar] [CrossRef]
  6. Horaud, R.; Hansard, M.; Evangelidis, G.; Ménier, C. An overview of depth cameras and range scanners based on time-of-flight technologies. Mach. Vis. Appl. 2016, 27, 1005–1020. [Google Scholar] [CrossRef]
  7. 3D Imaging and Sensing-Technology and Market Trends 2021. Available online: https://www.i-micronews.com/products/3d-imaging-and-sensing-technology-and-market-trends-2021/ (accessed on 7 July 2022).
  8. Light Detection and Ranging (LiDAR) Market. Available online: https://www.fortunebusinessinsights.com/light-detection-and-ranging-lidar-market-101969 (accessed on 7 July 2022).
  9. O’Toole, M.; Lindell, D.B.; Wetzstein, G. Confocal non-line-of-sight imaging based on the light-cone transform. Nature 2018, 555, 338–341. [Google Scholar] [CrossRef]
  10. Kirmani, A.; Venkatraman, D.; Shin, D.; Colaço, A.; Wong, F.N.; Shapiro, J.H.; Goyal, V.K. First-photon imaging. Science 2014, 343, 58–61. [Google Scholar] [CrossRef]
  11. McCarthy, A.; Krichel, N.J.; Gemmell, N.R.; Ren, X.; Tanner, M.G.; Dorenbos, S.N.; Zwiller, V.; Hadfield, R.H.; Buller, G.S. Kilometer-range, high resolution depth imaging via 1560 nm wavelength single-photon detection. Opt. Express 2013, 21, 8904–8915. [Google Scholar] [CrossRef]
  12. Schwarz, B. Mapping the world in 3D. Nat. Photonics 2010, 4, 429–430. [Google Scholar] [CrossRef]
  13. van Tricht, K.; Lhermitte, S.; Lenaerts, J.T.; Gorodetskaya, I.V.; L’Ecuyer, T.S.; Noël, B.; van den Broeke, M.R.; Turner, D.D.; van Lipzig, N.P. Clouds enhance Greenland ice sheet meltwater runoff. Nat. Commun. 2016, 7, 10266. [Google Scholar] [CrossRef] [PubMed]
  14. Pedreros Bustos, F.; Bonaccini Calia, D.; Budker, D.; Centrone, M.; Hellemeier, J.; Hickson, P.; Holzlöhner, R.; Rochester, S. Remote sensing of geomagnetic fields and atomic collisions in the mesosphere. Nat. Commun. 2018, 9, 3981. [Google Scholar] [CrossRef] [PubMed]
  15. Sutfin, N.A.; Wohl, E. Elevational differences in hydrogeomorphic disturbance regime influence sediment residence times within mountain river corridors. Nat. Commun. 2019, 10, 2221. [Google Scholar] [CrossRef]
  16. McManamon, P. Review of ladar: A historic, yet emerging, sensor technology with rich phenomenology. Opt. Eng. 2012, 51, 060901. [Google Scholar] [CrossRef]
  17. Moosmann, F.; Stiller, C. Velodyne slam. In Proceedings of the IEEE Intelligent Vehicles Symposium (IV), Baden-Baden, Germany, 5–9 June 2011; pp. 393–398. [Google Scholar]
  18. Li, Q.; Chen, L.; Li, M.; Shaw, S.L.; Nüchter, A. A sensor-fusion drivable-region and lane-detection system for autonomous vehicle navigation in challenging road scenarios. IEEE Trans. Veh. Technol. 2013, 63, 540–555. [Google Scholar] [CrossRef]
  19. McCormack, J.; Prine, J.; Trowbridge, B.; Rodriguez, A.C.; Integlia, R. 2D LIDAR as a distributed interaction tool for virtual and augmented reality video games. In Proceedings of the IEEE Games Entertainment Media Conference (GEM), Toronto, ON, Canada, 1 October 2015; pp. 1–5. [Google Scholar]
  20. CENELEC. Safety of laser products-Part 1: Equipment classification, requirements and user’s guide. In Proceedings of the International Electrotechnical Commission (IEC), Geneva, Switzerland, 16 October 2007.
  21. McManamon, P.F. Lidar Technologies and Systems; SPIE: Bellingham, WA, USA, 2019. [Google Scholar]
  22. Hendow, S.T.; Shakir, S.A. Structuring materials with nanosecond laser pulses. Opt. Express 2010, 18, 10188–10199. [Google Scholar] [CrossRef]
  23. Ma, Y.S.; Lin, Z.Y.; Lin, Y.T.; Lee, C.Y.; Huang, T.P.; Chen, K.H.; Lin, Y.H.; Lin, S.R.; Tsai, T.Y. 29.6 A digital-type GaN driver with current-pulse-balancer technique achieving sub-nanosecond current pulse width for high-resolution and dynamic effective range LiDAR system. In Proceedings of the IEEE International Solid-State Circuits Conference (ISSCC), San Francisco, CA, USA, 17–21 February 2019; pp. 466–468. [Google Scholar]
  24. Nie, M.; Liu, Q.; Ji, E.; Cao, X.; Xing, F.; Gong, M. High peak power hybrid MOPA laser with tunable pulse repetition frequency and pulse duration. Appl. Opt. 2017, 56, 3457–3461. [Google Scholar] [CrossRef]
  25. Wu, C.C.; Liu, C.Y.; Wang, G.B.; Shieh, Y.T.; Chieng, W.H.; Chang, E.Y. A New GaN-Based Device, P-Cascode GaN HEMT, and Its Synchronous Buck Converter Circuit Realization. Energies 2021, 14, 3477. [Google Scholar] [CrossRef]
  26. Hamamatsu Photonics, Photonic Crystal Surface Emitting Laser Diodes (PCSEL). Available online: https://www.hamamatsu.com/jp/en.html (accessed on 29 July 2022).
  27. Dora, Y.; Chakraborty, A.; Mccarthy, L.; Keller, S.; DenBaars, S.P.; Mishra, U.K. High breakdown voltage achieved on AlGaN/GaN HEMTs with integrated slant field plates. IEEE Electron Device Lett. 2006, 27, 713–715. [Google Scholar] [CrossRef]
  28. Zeng, F.; An, J.X.; Zhou, G.; Li, W.; Wang, H.; Duan, T.; Jiang, L.; Yu, H. A comprehensive review of recent progress on GaN high electron mobility transistors: Devices, fabrication and reliability. Electronics 2018, 7, 377. [Google Scholar] [CrossRef] [Green Version]
  29. Russo, S.; Di Carlo, A. Influence of the source–gate distance on the AlGaN/GaN HEMT performance. IEEE Trans. Electron. Devices 2007, 54, 1071–1075. [Google Scholar] [CrossRef]
  30. Oka, T.; Ina, T.; Ueno, Y.; Nishii, J. 1.8 mΩ·cm2 vertical GaN-based trench metal–oxide–semiconductor field-effect transistors on a free-standing GaN substrate for 1.2-kV-class operation. Appl. Phys. Express 2015, 8, 054101. [Google Scholar] [CrossRef]
  31. Heikman, S.; Keller, S.; Green, D.S.; DenBaars, S.P.; Mishra, U.K. High conductivity modulation doped AlGaN/GaN multiple channel heterostructures. J. Appl. Phys. 2003, 94, 5321–5325. [Google Scholar] [CrossRef]
  32. Glaser, J. How GaN power transistors drive high-performance lidar: Generating ultrafast pulsed power with GaN FETs. IEEE Power Electron. Mag. 2017, 4, 25–35. [Google Scholar] [CrossRef]
  33. Park, M.; Baek, Y.; Dinare, M.; Lee, D.; Park, K.H.; Ahn, J.; Kim, D.; Medina, J.; Choi, W.J.; Kim, S.; et al. Hetero-integration enables fast switching time-of-flight sensors for light detection and ranging. Sci. Rep. 2020, 10, 2764. [Google Scholar] [CrossRef]
  34. Iga, K. Laboratory Notebook; 1977. [Google Scholar]
  35. Iga, K.; Koyama, F.; Kinoshita, S. Surface emitting semiconductor lasers. IEEE J. Quantum Electron. 1988, 24, 1845–1855. [Google Scholar] [CrossRef]
  36. Iga, K. Surface-emitting laser-its birth and generation of new optoelectronics field. IEEE J. Sel. Top. Quantum Electron. 2000, 6, 1201–1215. [Google Scholar] [CrossRef]
  37. Iga, K. Vertical-cavity surface-emitting laser: Its conception and evolution. Jpn. J. Appl. Phys. 2008, 47, 1. [Google Scholar] [CrossRef]
  38. Iga, K. Vertical-cavity surface-emitting laser (VCSEL). Proc. IEEE 2013, 101, 2229–2233. [Google Scholar] [CrossRef]
  39. Koyama, F.; Kinoshita, S.; Iga, K. Room temperature cw operation of GaAs vertical cavity surface emitting laser. IEICE Trans. Electron. 1988, 71, 1089–1090. [Google Scholar]
  40. Larsson, A. Advances in VCSELs for communication and sensing. IEEE J. Sel. Top. Quantum Electron. 2011, 17, 1552–1567. [Google Scholar] [CrossRef]
  41. Moser, P.; Lott, J.A.; Bimberg, D. Energy efficiency of directly modulated oxide-confined high bit rate 850-nm VCSELs for optical interconnects. IEEE J. Sel. Top. Quantum Electron. 2013, 19, 1702212. [Google Scholar] [CrossRef]
  42. Pruijmboom, A.; Apetz, R.; Conrads, R.; Deppe, C.; Derra, G.; Gronenborn, S.; Gu, X.; Kolb, J.S.; Miller, M.; Moench, H.; et al. VCSEL arrays expanding the range of high-power laser systems and applications. J. Laser Appl. 2016, 28, 032005. [Google Scholar] [CrossRef]
  43. Ebeling, K.J.; Michalzik, R.; Moench, H. Vertical-cavity surface-emitting laser technology applications with focus on sensors and three-dimensional imaging. Jpn. J. Appl. Phys. 2018, 57, 08PA02. [Google Scholar] [CrossRef]
  44. Liu, A.; Wolf, P.; Lott, J.A.; Bimberg, D. Vertical-cavity surface-emitting lasers for data communication and sensing. Photonics Res. 2019, 7, 121–136. [Google Scholar] [CrossRef]
  45. Ishizaki, K.; De Zoysa, M.; Noda, S. Progress in photonic-crystal surface-emitting lasers. Photonics 2019, 6, 96. [Google Scholar] [CrossRef]
  46. Kalapala, A.; Song, A.; Pan, M.; Gautam, C.; Overman, L.; Reilly, K.; Rotter, T.; Balakrishnan, G.; Gibson, R.; Bedford, R.; et al. Scaling challenges in high power photonic crystal surface-emitting lasers. IEEE J. Quantum Electron. 2022, 58, 1–9. [Google Scholar] [CrossRef]
  47. Wang, Z.; Tong, C.; Wang, L.; Lu, H.; Tian, S.; Wang, L. Photonic crystal surface emitting laser operating in pulse-periodic regime with ultralow divergence angle. Photonics 2021, 8, 323. [Google Scholar] [CrossRef]
  48. Taylor, R.J.; Childs, D.; Hogg, R. Vector photonics: The commercial journey of PCSELs and their pathway to high power. In Proceedings of the SPIE High-Power Diode Laser Technology XX, San Francisco, CA, USA, 22 January–28 February 2022; Volume PC1198304. [Google Scholar]
  49. de Zoysa, M.; Inoue, T.; Yoshida, M.; Ishizaki, K.; Kunishi, W.; Gelleta, J.; Noda, S. Light detection functionality of photonic-crystal lasers. IEEE J. Quantum Electron. 2021, 57, 6400208. [Google Scholar] [CrossRef]
  50. Noda, S. Progress of photonic crystal surface-emitting lasers: Paradigm shift for lidar sensing and laser processing. In Proceedings of the Laser Resonators, Microresonators, and Beam Control XXIII, Virtual, 6–12 March 2021; Volume 11672, p. 1167203. [Google Scholar]
  51. Noda, S. Photonic crystal surface-emitting lasers and their application to lidar. In Proceedings of the 2021 26th Microoptics Conference (MOC), Hamamatsu, Japan, 26–29 September 2021; pp. 1–2. [Google Scholar]
  52. Hong, Y.H.; Miao, W.C.; Hsu, W.C.; Hong, K.B.; Lin, C.L.; Lin, C.; Chen, S.C.; Kuo, H.C. Progress of Photonic-Crystal Surface-Emitting Lasers: A Paradigm Shift in LiDAR Application. Crystals 2022, 12, 800. [Google Scholar] [CrossRef]
  53. Glaser, J. High power nanosecond pulse laser driver using an GaN FET. In Proceedings of the International Exhibition and Conference for Power Electronics, Intelligent Motion, Renewable Energy and Energy Management, Nuremberg, Germany, 5–7 June 2018; pp. 1–8. [Google Scholar]
  54. Fornetti, F.; Morris, K.A.; Beach, M.A. Pulsed operation and performance of commercial GaN HEMTs. In Proceedings of the IEEE European Microwave Integrated Circuits Conference (EuMIC), Rome, Italy, 28–29 September 2009; pp. 226–229. [Google Scholar]
  55. Kuzmik, J.; Javorka, R.; Alam, A.; Marso, M.; Heuken, M.; Kordos, P. Determination of channel temperature in AlGaN/GaN HEMTs grown on sapphire and silicon substrates using DC characterization method. IEEE Trans. Electron. Devices 2002, 49, 1496–1498. [Google Scholar] [CrossRef]
  56. Wens, M.; Redoute, J.M.; Blanchaert, T.; Bleyaert, N.; Steyaert, M. An integrated 10A, 2.2 ns rise-time laser-diode driver for LIDAR applications. In Proceedings of the European Solid-State Circuits Conference (ESSCIRC), Athens, Greece, 14–18 September 2009; pp. 144–147. [Google Scholar]
  57. Weng, Y.C.; Wu, C.C.; Chang, E.Y.; Chieng, W.H. Minimum power input control for class-e amplifier using depletion-mode gallium nitride high electron mobility transistor. Energies 2021, 14, 2302. [Google Scholar] [CrossRef]
  58. De Zoysa, M.; Yoshida, M.; Song, B.; Ishizaki, K.; Inoue, T.; Katsuno, S.; Izumi, K.; Tanaka, Y.; Hatsuda, R.; Gelleta, J.; et al. Thermal management for CW operation of large-area double-lattice photonic-crystal lasers. JOSA B 2020, 37, 3882–3887. [Google Scholar] [CrossRef]
Figure 1. Electrical characteristics of the employed GaN HEMT and the topology of a laser driving circuit. (a) Output characteristics of the GaN HEMT operated under various gate voltages. The gate voltages are sequentially applied from −14 V to 0 V in eight steps (starting from the very bottom with black and red overlapping curves). (b) Transfer curve of the GaN HEMT with a drain voltage of 10 V. The threshold voltage can be appraised around −11.5 V. (c) Topology of a laser driving circuit with the PCSEL and GaN HEMT switch.
Crystals 12 01242 g001
Figure 2. Characteristics of the integrated system and the corresponding photodiode responses from the employed PCSEL with fixed pulse width of 50 ns. (a) Photodiode responses from the PCSEL with distinct pulse repetition frequencies. The PCSEL is activated by gate input pulses of the integrated system. The black lines are the gate input voltages (V) from a function generator (left y-axis) while the red lines are the corresponding photodiode currents (A) caused by the irradiation of PCSEL (right y-axis). (b) A sequence of photodiode responses from the PCSEL with various pulse repetition frequencies for comparison. The higher the pulse repetition frequency, the lower the photodiode peak current. (c) Corresponding peak currents extracted from (b). Due to the severe self-heating effect, PCSEL operated at a high pulse repetition frequency will suffer from an output droop. Afterward, the corresponding peak current drops from 5.04 A to 3.49 A at 1 kHz and 600 kHz, respectively.
Crystals 12 01242 g002
Figure 3. Characteristics of the integrated system and the corresponding photodiode responses from the employed PCSEL with a fixed pulse repetition frequency of 100 kHz. (a) Photodiode responses from the PCSEL with different pulse widths. (b) A sequence of photodiode responses from the PCSEL with various pulse widths for comparison. The shorter the pulse width, the lower the photodiode peak current. (c) Corresponding peak currents extracted from (b). Herein, the corresponding peak current drops from 4.88 A to 3.56 A with a width of 50 ns and 10 ns, respectively.
Crystals 12 01242 g003
Figure 4. Light emission behaviors of the employed PCSEL operated with a fixed pulse width of 50 ns. (a) Light emission spectra of the PCSEL with miscellaneous pulse repetition frequencies. The higher the pulse repetition frequency, the redder the center wavelength of Mode 1. Moreover, starting from 200 kHz, an additional Mode 2 can be distinguished. (b) Corresponding center wavelengths extracted from (a). While increasing the pulse repetition frequency, the corresponding center wavelengths of Mode 1 shift from 942.4 nm to 950.82 operated at 1 kHz and 600 kHz, respectively. For the additional Mode 2, the corresponding center wavelengths shift from 944.6 nm to 947.9 nm with the pulse repetition frequency of 200 kHz and 600 kHz, respectively.
Crystals 12 01242 g004
Figure 5. Light emission spectra of the employed PCSEL operated with fixed pulse repetition frequencies of 100 kHz and 500 kHz, respectively. (a) Light emission spectra of the PCSEL operated at 100 kHz with a series of pulse widths. The shorter pulse width, the bluer center wavelength. Insets: (i) Corresponding center wavelengths extracted from (a). While the pulse width is shrunk from 50 ns to 10 ns, a blueshift from 947.9 nm to 946.07 nm can be observed. (ii) Corresponding peak deconvolution of the PCSEL operated at 100 kHz with a pulse width of 50 ns. An implicit dual-mode phenomenon can be observed. For Mode 1 and Mode 2, the corresponding center wavelengths are 947.9 nm and 946.1 nm, respectively. (b) Light emission spectra of the PCSEL operated at 500 kHz with a series of pulse widths. Additionally, two modes, namely Mode 1 and Mode 2, can be discerned from the spectra. Insets: (i) Corresponding center wavelengths extracted from (b). While the pulse width is shrunk from 50 ns to 10 ns, blueshifts from 950.46 nm to 947.17 nm and 946.8 nm to 943.87 nm can be observed for Mode 1 and Mode 2, respectively. (ii) Corresponding peak deconvolution of the PCSEL operated at 500 kHz with a pulse width of 50 ns. A distinct dual-mode phenomenon can be recognized for Mode 1 and Mode 2 with the corresponding center wavelengths of 950.1 nm and 946.8 nm, respectively.
Crystals 12 01242 g005
Figure 6. Reliability test for the integrated system and the corresponding photodiode responses from the employed PCSEL operated with a fixed pulse width of 50 ns. (a) Sequence of photodiode responses from the PCSEL operated at 500 kHz for comparison. Inset: Corresponding peak currents extracted from (a). Due to the self-heating effect, heat will accumulate over time. Thus, an obvious output droop can be observed and the corresponding peak current drops from 3.52 A to 0.72 A within 75 s. (b) A sequence of photodiode responses from the PCSEL operated at 600 kHz for comparison. Inset: Corresponding peak currents extracted from (b). Herein, the corresponding peak current rapidly drops from 3.49 A to 0.24 A within just 60 s due to a higher pulse repetition frequency.
Crystals 12 01242 g006
Figure 7. Reliability test for the integrated system and the corresponding light emission spectra of the employed PCSEL operated with a fixed pulse width of 50 ns. (a) Sequence of light emission spectra of the PCSEL operated at 500 kHz for comparison. Inset: (i) Corresponding center wavelengths extracted from (a). An obvious redshift can be observed in the process of time. Within 75 s, the corresponding center wavelengths of Mode 1 and Mode 2 shift from 949.36 nm to 955.57 nm and from 946.43 nm to 952.65 nm, respectively. (ii) Corresponding peak deconvolution of the PCSEL operated at 500 kHz with a pulse width of 50 ns. A dual-mode phenomenon can be recognized for Mode 1 and Mode 2 with the corresponding center wavelengths of 949.4 nm and 946.1 nm, respectively. (b) A sequence of light emission spectra of the PCSEL operated at 600 kHz for comparison. Inset: (i) Corresponding center wavelengths extracted from (b). Within just 60 s, the corresponding center wavelengths of Mode 1 and Mode 2 shift from 949.73 nm to 953.02 nm and from 946.8 nm to 952.29 nm, respectively. (ii) Corresponding peak deconvolution of the PCSEL operated at 600 kHz with a pulse width of 50 ns. A distinct dual-mode phenomenon can be recognized for Mode 1 and Mode 2 with the corresponding center wavelengths of 949.7 nm and 946.4 nm, respectively.
Crystals 12 01242 g007
Figure 8. Relevant side mode suppression ratios of the employed PCSEL operated under different conditions. The highest SMSRs are labeled with red arrows. (a) SMSRs extracted from Figure 5a. While the pulse width is shrunk from 50 ns to 10 ns, the corresponding SMSRs drop from 16.4 dB to 9.25 dB, respectively. (b) SMSRs extracted from Figure 5b. Two modes emerge at the same time under this condition, and thus the corresponding SMSRs are much lower compared to the case of (a). The highest SMSR is 2.38 dB with the pulse repetition frequency and pulse width of 500 kHz and 30 ns, respectively. (c) SMSRs extracted from Figure 7a. Two modes emerge at the same time under this condition, and the highest SMSR of 1.93 dB appears at the accumulated time of 15 s. (d) SMSRs extracted from Figure 7b. Two modes emerge at the same time under this condition, and the highest SMSR of 2.14 dB appears at the accumulated time of 30 s.
Crystals 12 01242 g008
Publisher’s Note: MDPI stays neutral with regard to jurisdictional claims in published maps and institutional affiliations.

