Abstract
The main objective of this study is to present a methodology to model the microstructure and mechanical properties of ZE41-xCa-ySr alloys for integrated optimization calculation of the heat treatment process of gearbox casting. Firstly, the models of microstructure and mechanical properties of ZE41-xCa-ySr alloys (0 ≤ x ≤ 2, 0 ≤ y ≤ 0.2) are developed using an artificial neural network (ANN) and multivariate regression. The dataset for ANN and regression models is generated by investigating the microstructures and mechanical properties of the ZE41-xCa-ySr alloys. The inputs for ANN and regression models are Ca and Sr contents, aging temperature and aging time. The outputs are grain size, ultimate tensile strength, elongation and microhardness. The optimal ANN model is obtained by testing the performance of different network architectures. In addition, multivariate regression models have been built based on the Least Squares method. Secondly, based on SiPESC software, an Integrated Computing Platform is constructed by combining the scripting language with the command line operation of simulation software, realizing the “process—microstructure—property” optimization calculation. Finally, based on the developed regression model, an Integrated Computing Platform batch called MATLAB achieves the heat treatment process optimization based on mechanical property prediction. The optimum aging temperature of the ZE41-0.17Ca-0.2Sr alloy is 322 °C, and the corresponding aging time is 11 h. Furthermore, the optimized results are validated by the ANN model, suggesting that ANN predicted results are in good agreement with optimized results. As a consequence, this work provides a new strategy for the research and development of Mg alloys, contributing to acceleration in the development of magnesium alloys.
1. Introduction
Magnesium (Mg) has the potential to provide 60–75% mass savings relative to steel or cast iron, and die casting can be used to economically produce large and thin-wall Mg alloy castings to replace steel subsystems [1]. Mg alloys containing rare-earth (RE) elements are considered to be promising alternatives to commercially available alloys, due to their good oxidation resistance and high strength [2]. In addition, mechanical properties of Mg alloys can be improved by employing relevant heat treatment and other engineering processes [3,4,5]. The processes of tailoring the alloy to deliver application-dependent property requirements play key roles in accelerating the conversion of improved Mg alloys into products.
In 2008, Integrated Computational Materials Engineering (ICME) was first proposed, which involved the tools for modeling and simulation, as well as design optimization. ICME aims to reduce the time to market of innovative products by exploiting the design and development of material and process path [6]. Since 2012, ICME has been gradually applied to the research and development of alloys and their components. This approach integrates the multiscale models and key experiments into the entire process of aluminum alloys development. Therefore, ICME promotes the research and development mode to change from “Traditional Design” to “Predictive Design”.
Designing materials for targeted property as required in ICME demands modeling and simulation, which includes both process–microstructure and microstructure–property relations. However, it is a difficult task to briefly summarize a range of multiscale modeling approaches for all process–microstructure and microstructure–property relations for all the alloys.
A few experimental research efforts were devoted to studying the strengthening mechanism, heat treatment technology and microstructure evolution of the Mg-Zn-RE-Zr alloys [7,8,9,10]. The relationship between process parameters and mechanical properties for Mg-Zn-RE-Zr alloys has only been studied empirically. The “composition/process-microstructure-property” relation that is foundational to the design of the alloy composition and process has not yet been studied. The few systematic efforts that have been made to analyze trends in experimental data as a basis for predictions have, in large part, been inconclusive, not the least of which is due to the lack of large amounts of organized data, and even more importantly the challenge of sifting through them in an efficient manner.
In recent decades, artificial neural networks (ANNs) and various regression methods have been powerful and flexible modeling tools that can lead to significant improvements in materials science, modeling complex problems and exploring the correlations between different materials’ properties [11,12,13,14]. Yang employed the ANN model with a backpropagation (BP) algorithm to explore correlations that exist between heat treatment processes and mechanical properties of A357 alloy [15]. Conduit developed an ANN to enable the prediction of individual materials properties both as a function of the composition and heat treatment routine [16]. In addition, linear and nonlinear regression models were applied to develop the input–output relationship in many casting processes [17,18]. Chen applied the nonlinear mathematical model to quantitatively analyze the effects of the heat treatment on Vickers hardness of the Al-Si-Mg alloy, and achieved the optimum heat treatment process using the sequential approximation optimization method [19]. Akhtar optimized process parameters in the turning of Aluminum Alloy 7075 using a Computer Numerical Control machine [20].
ZE41 magnesium alloy is one of the most popular magnesium alloys in the Mg-Zn-RE-Zr based alloy and has been widely used for the aircraft gearbox and generator housings on military helicopters [21,22,23]. In this study, we take ZE41-xCa-ySr alloy as a research object. Firstly, we focus on modeling and correlating the microstructure and mechanical properties of the heat-treated ZE41-Ca-Sr alloys, with alloying elements and aging process using the ANN approach and regression models. Secondly, based on the developed regression model facilitating Integrated Computing Platform, the heat treatment process and alloying composition of ZE41-xCa-ySr alloy are optimized by the Integrated Computing Platform. Finally, the optimized results are validated by the ANN model. This work aims to provide a new strategy for the research and development of Mg alloys, which is conducive to accelerating the development of magnesium alloys.
2. Experiment and Methods
2.1. Experimental Procedure
Figure 1 illustrates the flow chart of this work. In the present work, ZE41-xCa-ySr (Mg-4.2Zn-1.7RE-0.8Zr-xCa-ySr x = 0, 0.2 wt.%, y = 0, 0.2 wt.%) was used as the casting material due to its advantages such as excellent fluidity, good heat resistance and low wall-thickness effect. The casting ingots were produced by high-purity Mg, Zn, Ce-rich mischmetal (50 wt.% Ce, 28 wt.% La, 16 wt.% Nd, 4% wt.% Pr and 2 wt.% impurity), Mg-30Zr, Mg-20Ca and Mg-20Sr in an electric resistance furnace under a protected argon atmosphere at 730 °C. Then, the samples were subjected to different heat treatments. Experiments were designed and accomplished according to underage, peak age and overage conditions at different temperatures. The chemical compositions of the as-cast alloys were determined by the Inductive Coupled Plasma (ICP) method and the results were summarized in Table 1. The RE element consisted of Ce, La, trace Nd and Pr. The heat-treatment parameters (T1 conditions) used in this work were as follows: artificial aging temperatures (300 °C, 325 °C and 350 °C) and aging time (0–32) h. After heat treatments, the tensile specimens were machined with 30 mm in gauge length and 6 mm in diameter. Based on the standard GB/T 228.1-2010, tensile tests were conducted at room temperature. Ultimate tensile strength (UTS) and elongation to failure (El.) were measured. Furthermore, Vickers hardness tests were performed with a 1 kg load. Next, 10 indentations per sample were analyzed to improve precision. The average value was reported as the microhardness (HV). In addition, microstructural examinations were conducted using an optical microscope (OM). The specimens for OM observations were etched in a solution of 2.1 g picric acid, 5 mL acetic acid, 5 mL H2O and 35 mL ethanol. Average grain size was measured using the linear intercept method described in ASTM standard E 112-88.
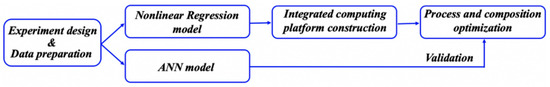
Figure 1.
The flow chart of this work.

Table 1.
Chemical compositions of the experimental alloys (wt.%).
Based on the previous study, the optical micrographs of the as-cast ZE41-xCa-ySr alloys are shown in Figure 2 [24]. It can be seen that the as-cast alloys consist of equiaxed α-Mg matrix and eutectic compounds distributed along grain boundaries. The average grain size of α-Mg phase decreases with increasing Ca and Sr. Figure 3 presents the optical micrographs of the peak-aged ZE41-xCa-ySr alloys, wherein the microstructures consist of primary α-Mg grains and interdendritic phases dispersing along the grain boundaries, as well as the intermetallic particle existing inside grains [25]. The average grain sizes for the peak-aged ZE41 and ZE41-0.2Ca-ySr (y = 0, 0.1 and 0.2 wt.%) alloys are (49.6 ± 2.7) μm, (37.5 ± 2.4) μm, (34.8 ± 2.1) μm, (32.5 ± 2.5) μm and (35.2 ± 2.1) μm, respectively, revealing a slight growth of α-Mg grains after peak age at 325 °C compared with the as-cast alloys. Therefore, the average grain size is selected as an output variable to express the microstructure.
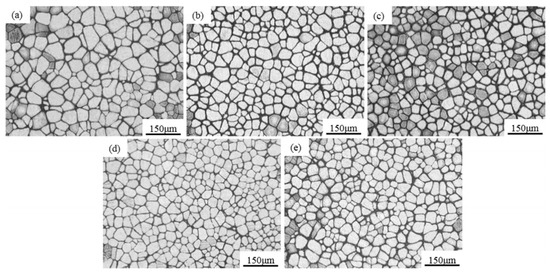
Figure 2.
Optical micrographs of the as-cast ZE41-Ca-Sr alloys: (a) ZE41; (b) ZE41-0.2Ca; (c) ZE41-0.2Ca-0.1Sr; (d) ZE41-0.2Ca-0.2Sr; (e) ZE41-0.2Ca-0.4Sr [24].
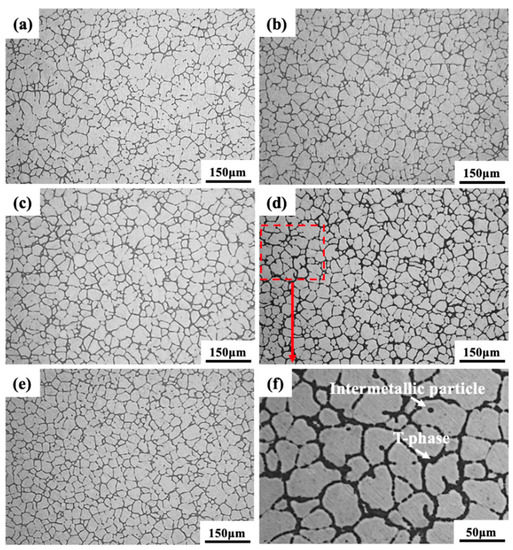
Figure 3.
Optical micrographs of the peak-aged alloys: (a) ZE41, (b) ZE41-0.2Ca, (c) ZE41-0.2Ca-0.1Sr, (d) ZE41-0.2Ca-0.2Sr, (e) ZE41-0.2Ca-0.4Sr and (f) partial enlarged drawing of the ZE41-0.2Ca-0.2Sr alloy [25].
2.2. ANN Modeling
An ANN is a mathematical model consisting of many highly interconnected processing elements organized into layers. ANN keeps knowledge with connection weights [26]. Input signals are processed in the course of the hidden layer, and the following outputs are computed in the output layer. Input–output pairs are presented to the ANN and weights are adjusted to minimize the error between the predicted output and actual value. The multilayered neural network (MLP) is utilized to establish an ANN model, which is used to predict the microstructure and mechanical properties of ZE41-xCa-ySr alloys. Since the Back Propagation (BP) algorithm is a representative method used to reduce the errors created by the gradient descent method, it is used to train the multilayer feed forward network. A three-layered ANN model is developed using the MATLAB R2018a. Figure 4 shows the network configuration of the ANN model. As it seen in Figure 2, the network structure includes three layers: an input layer (four neurons), one hidden layer and an output layer (four neurons). The input variables consist of Ca, Sr content, aging temperature (Ta) and aging time (ta). The outputs correspond to average grain size (D), ultimate tensile strength (UTS), elongation (El.) and microhardness (HV). The dataset has been generated from a series of experiments on samples, as discussed in Section 2.1, which are listed in Appendix A. In order to avoid overfitting in the ANN training, 120 groups of data are divided randomly into three subsets: 70% training set, 15% testing set and 15% validation set. Both input variables and output variables are fed into the neural network toolbox.
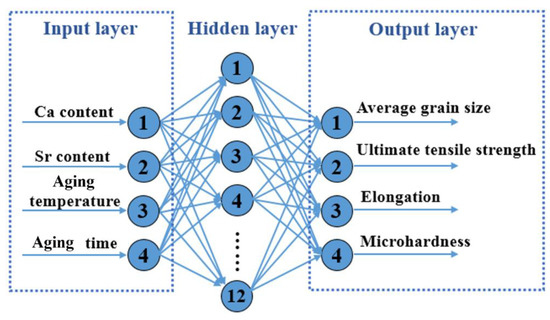
Figure 4.
The network configuration of the ANN model.
The ANN model training parameters are presented in Table 2. Based on the training parameters, the mathematical model of the ANN is shown in Figure 5. The data are normalized to reduce the order of magnitude difference between the various dimensions [27]. As activation transfer functions, the hyperbolic tangent “tan-sigmoid” function and the linear transfer function “Purelin” are used. Compared with the standard gradient descent algorithm, the Levenberg–Marquardt (LM) algorithm possesses fast convergence and a small mean square error [26]. As a result, a BP neural network with LM algorithm is adopted to train the ANN model. In addition, the number of hidden neurons is estimated according to the empirical formula:
where m and n are the number of neurons in the input and output layers, respectively, and a is a constant in the range of 1 to 10 [28,29]. According to the empirical formula, nine kinds of ANN architectures with different neurons in the hidden layer are tested to determine the optimal one. The correlation coefficient (R) is used to evaluate the linear correlation between the experimental and predicted results. However, it is unable to evaluate when the prediction is biased towards a local scope. Therefore, mean squared error (MSE) is also adopted to evaluate the ANN performance. The corresponding functions are as follows:
where Ti is the experimental value, Yi is the predicted value and and are the mean values of all the experimental and predicted results, respectively. n denotes the number of outputs and t denotes the amount of training sets. The convergence to MSE of 0.0167 is established in 1000 epochs.
Table 2.
The ANN model training parameters.
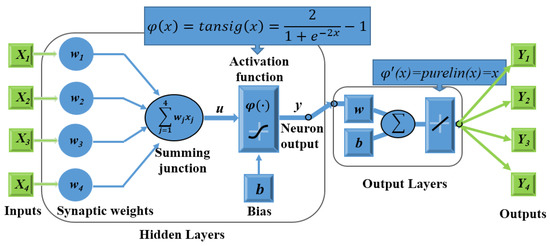
Figure 5.
The mathematical model of the ANN.
2.3. Multivariate Regression Modeling
Multivariate regression analysis is a statistical tool that can be used to analyze the effects of parameters, develop the input–output relationship and obtain the optimal process parameter settings [17]. In this study, regression analysis is used to establish nonlinear regression models for the outputs, namely grain size (D), ultimate tensile strength (UTS), elongation (El.) and microhardness (HV).
The input variables are coded to reduce the difference in the scales of variables. Coding is performed for each input based on its minimum and maximum. The corresponding formula is as follows:
where xi (i = 1, 2, 3, 4) is the coded input variable, Xi is the actual input variable, Xi0 is the value of Xi at the center level and ΔXi is the variation range in Xi. Regression models and statistical analysis are established based on the data in Appendix A. The fitted second-order polynomial regression model describing Y (output variables) expressed as a function of input variables is listed below:
where b0 is a constant, and bi, bii and bij (i, j = 1, 2, 3, 4) are the coefficients of linear, quadratic and cross product terms, respectively. Furthermore, the coefficients are calculated using the Least Squares method, which is a trial-and-error process. The statistical adequacy of regression models is determined by the coefficient of determination (R2) and Fisher’s criterion (F-test). The developed regression models can provide predictive models for integrated optimization calculation of heat treatment process of the ZE41-xCa-ySr alloy gearbox casting.
2.4. Integrated Computing Platform Building
The Integrated Computing Platform is constructed based on an integrated software platform SiPESC (Software Integration Platform for Engineering and Scientific Computation) [28]. SiPESC adopts the “microkernel and plugin” architecture, achieving the dynamic combination, extension and cooperative work of plugins. Therefore, the Integrated Computing Platform integrates multiple software by combining the scripting language with command line operation of simulation software, realizing the entire process simulation from CAD model input to “process-microstructure/defect-property” simulation. In addition, many algorithms are embedded in the Integrated Computing Platform, such as BFGS, SLP, SQP, MMA and GA algorithms, which are used to search for optimal parameter values.
In this work, the optimization calculation of composition and heat treatment processes for the ZE41-xCa-ySr alloy gearbox casting is implemented using the Integrated Computing Platform. Integrated Computing Platform batch calls MATLAB, achieving the optimization calculation of “heat treatment process/composition—microstructure/property” for the gearbox casting. However, before that, developed regression models need to be compiled into a “m.” script file for MATLAB. Figure 6 presents the architecture diagram showing “heat treatment process/composition-microstructure/property” integrated computing system. The optimization calculation of heat treatment and composition parameters for ZE41-xCa-ySr alloy gearbox casting involves the following steps:
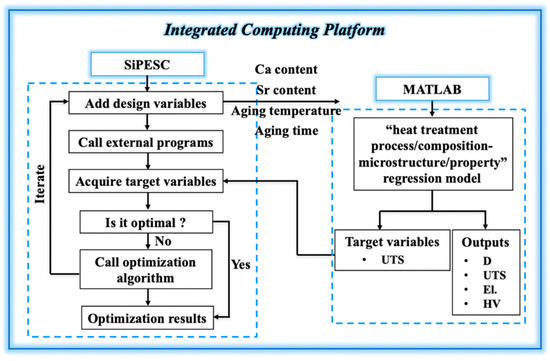
Figure 6.
The architecture diagram showing “heat treatment process/composition-microstructure/property” integrated computing system.
- Input the geometric model of ZE41 alloy gearbox casting.
- Add design variables, such as Ca content (X1), Sr content (X2), aging temperature (X3) and aging time (X4). Moreover, set initial values and calculation ranges of separate variables, as shown in Table 3.
Table 3. Initial values and calculation ranges of separate variables.
- Add an external program for the Integrated Computing Platform to call. Here, it is MATLAB.
- Set the target variable. Set the target variable to UTS in order to obtain the optimal design variables corresponding to the maximum UTS.
- Select the optimization algorithm. The SQP (Sequential Quadratic Programming) method is selected as the optimization algorithm, which is an iterative method for nonlinear optimization.
- Solve. The Integrated Computing Platform starts to make iterative optimization calculations and output each calculation result. Outputs include grain size (D), ultimate tensile strength (UTS), elongation (El.) and microhardness (HV).
3. Results and Discussion
3.1. Subsection
The aim of using the ANN model is to develop a prediction model which correlates between the input variables such as Ca, Sr content, aging temperature and aging time, and outputs such as D, UTS, El. and HV of the alloys. ANN Models are developed based on trial and error by adjusting the number of neurons in the hidden layer until maximum R and minimum MSE are obtained. The values of R and MSE for the different ANN models are shown in Figure 7, respectively. The results suggest that the ANN model with 12 neurons in the hidden layer obtains the maximum R value and the minimum MSE value, suggesting that 12 hidden-layer neurons of the ANN model exhibit favorable performance. As a result, the optimal ANN architecture is 4-12-4 (4 neurons in the input layer, 12 neurons in the hidden layer and 4 neurons in the output layer).
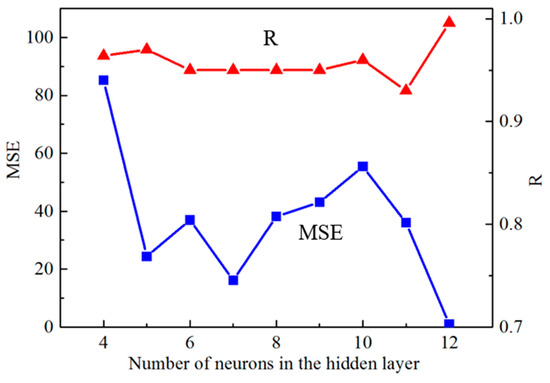
Figure 7.
The values of R and MSE for the different ANN models.
Figure 8 shows the performance of the optimal ANN model, indicating that the ANN model prediction exhibits good correlation with experimental results in training (R = 0.997), testing (R = 0.999), validation (R = 0.995) and whole (R = 0.996) datasets. The training convergence curve for the optimal ANN model is given in Figure 9. In the training stage of the ANN model, it is observed that the MSE decreases with the increasing number of iterations and reaches the error goal at about 120 epochs. Therefore, the well-trained ANN model has robust generalization ability.
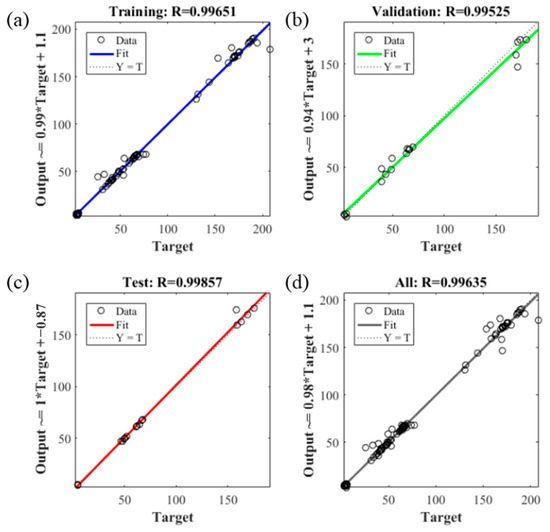
Figure 8.
Analysis of the optimal ANN model predicted results in comparison with experimental results during training, validation and testing of the model. (a) training (R = 0.997), (b) testing (R = 0.999), (c) validation (R = 0.995) and (d) whole (R = 0.996) datasets.
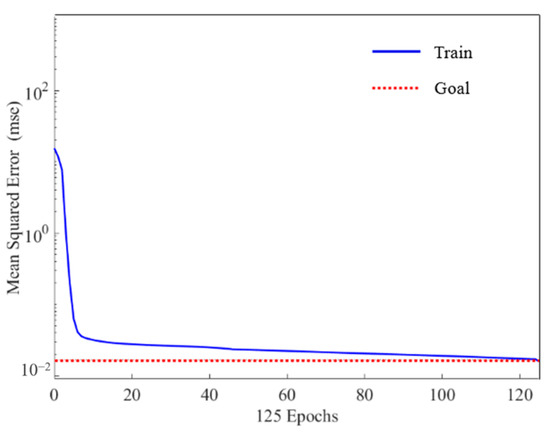
Figure 9.
Training convergence curve for the optimal ANN model.
Figure 10 presents the comparisons between the experimental and the predicted results for the entire datasets, suggesting that the ANN model has an adequate approximation to experimental values. Therefore, the microstructure and mechanical properties of the heat-treated ZE41-xCa-ySr alloy can be predicted with high accuracy using this ANN model.
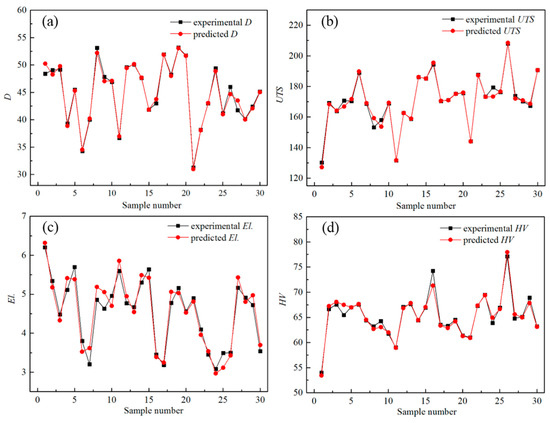
Figure 10.
The comparisons between the experimental and the predicted results for the entire datasets. (a) D, (b) UTS, (c) El. and (d) HV.
Table 4 shows the predicted and experimental values of the BP neural network and percentage error. The results show that, for all the input parameters, the neural network projections agree very well with the experimental values. The percentage of error (P) between the experimental and ANN results is within 5%. These error levels are acceptable. As a consequence, the accuracy of the ANN model is validated. The percentage of error (P) is quantified as follows:
where Ti is the experimental value and Yi is the predicted value, respectively.
Table 4.
Predicted and experimental values of the BP neural network and percentage error.
3.2. Model Development Using Regression Model
Equations (7)–(10) present the multivariate regression models and their adequacy validations. The coefficients of the terms suggest the influence of the variables on the response variables. The coefficient of determination (R2) is adopted to test the fit of regression models. For the model of D, the value of R2 is 0.747, which indicates that 74.7% of the variability in the response (D) can be explained by the regression model. In addition, the F-test is used to determine whether all the terms of regression models are statistically significant. If the calculated F ratio exceeds the critical F1−α, k−1, n−k value with degrees of freedom (k−1) and (n−k), the terms are significant at the α level of significance (α = 0.05, k is the number of terms, and n is the number of the experimental dataset). Consequently, from Equations (7)–(10), we can see that developed models quantify the effects of alloying elements and the aging process on the response variables, and the multivariate regression models are capable of making accurate predictions. The regression models are provided to the Integrated Computing Platform for “heat treatment process/composition-microstructure/property” integrated optimization calculation.
where, x1 = 10X1 − 1, x2 = 10X2 − 1, x3 = 0.04X3 − 13, x4 = 0.0625X4 − 1.
3.3. Integrated Optimization Calculation
Based on the ICME paradigm, an Integrated Computing Platform for the “process-microstructure-property” simulation is established, which can realize the property prediction and process optimization. The Integrated Computing Platform first calls ProCAST software to implement “casting process-microstructure/defect” simulation, and then calls MATLAB software for “microstructure–property” calculation. Figure 11 shows the calculation interface of the Integrated Computing Platform. The Integrated Computing Platform automatically iterates 76 times. Table 5 lists partial iterations of integrated optimization calculation, suggesting that the optimized design variables correspond to the maximum UTS, HV and minimum D. Table 6 shows the optimal solution corresponding to the 61st iteration. Then, the optimized results are validated by the developed ANN model. The comparison of results is also shown in Table 5. Through analyzing the obtained results, it can be found that ANN predicted results coincide well with the integrated computing results. Therefore, the ANN model and multivariate regression models have high prediction accuracy. Furthermore, the optimization of the heat treatment process and composition based on property prediction is achieved through the Integrated Computing Platform.
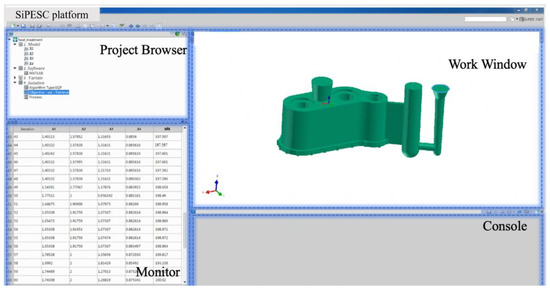
Figure 11.
The calculation interface of Integrated Computing Platform.
Table 5.
Partial iterations of integrated optimization calculation.
Table 6.
The optimal solution and results of model validation.
4. Conclusions
- The ANN model was developed using the BP algorithm. The optimal architecture (4-12-4) processed the maximum R value and the minimum MSE value. The ANN model was capable of predicting the microstructure and mechanical properties of heat-treated ZE41-xCa-ySr alloys with high reliability.
- Multivariate regression analysis was employed to model the microstructure and mechanical properties of the heat-treated ZE41-xCa-ySr alloys. The adequacy of the models was tested by the coefficient of determination and Fisher’s criterion. All the nonlinear regression models were statistically adequate, which provided mathematical models for Integrated Computing Platform.
- Based on SiPESC software, the Integrated Computing Platform was established by combining the scripting language with command line operation of the simulation software, realizing “process-microstructure/defect-property” simulation. An Integrated Computing Platform called MATLAB achieved the optimization calculation of “heat treatment process/composition—microstructure/property” for the ZE41-xCa-ySr alloy gearbox casting. The optimum aging temperature of the ZE41-0.17Ca-0.2Sr alloy is 322 °C, and the corresponding aging time is 11 h.
Author Contributions
Conceptualization, Y.F. and H.H.; methodology, C.L.; software, Y.S.; validation, Y.X., J.W. and X.Z.; formal analysis, Z.S.; writing—original draft preparation, Y.F.; writing—review and editing, H.H.; visualization, Y.X.; supervision, X.Z.; project administration, Y.F.; funding acquisition, Y.F. All authors have read and agreed to the published version of the manuscript.
Funding
This work was financially supported by the Major Special Projects of the Plan “Science and Technology Innovation 2025” (No. 2019B10105, 2019B10086, 2019B10103, 2020Z096, 2020Z060, 2020Z048, 20221ZDYF020197), the Ningbo Natural Science Foundation (No. 202003N4340) and Zhejiang province military–civilian integration technology collaborative innovation platform.
Institutional Review Board Statement
Not applicable.
Informed Consent Statement
Not applicable.
Data Availability Statement
Not applicable.
Conflicts of Interest
The authors declare no conflict of interest.
Appendix A
Table A1.
The experimental results.
Table A1.
The experimental results.
| Coded Input Variables | Actual Input Variables | Actual Output Variables | ||||||||||
|---|---|---|---|---|---|---|---|---|---|---|---|---|
| x1 | x2 | x3 | x4 | X1: Ca (wt.%) | X2: Sr (wt.%) | X3: Ta (°C) | X4: ta (h) | Y1: D (μm) | Y2: UTS (MPa) | Y3: El. (%) | Y4: HV | |
| Center point (0) | 0.1 | 0.1 | 325 | 16 | - | - | - | - | ||||
| Range ΔXi | 0.2 | 0.2 | 50 | 32 | - | - | - | - | ||||
| High level (1) | 0.2 | 0.2 | 350 | 32 | - | - | - | - | ||||
| Low level (−1) | 0 | 0 | 300 | 0 | - | - | - | - | ||||
| No. | ||||||||||||
| 1 | −1 | −1 | −1 | −1 | 0 | 0 | 300 | 0 | 48.40 | 130.20 | 6.20 | 54.00 ± 1.22 |
| 2 | −1 | −1 | −1 | −0.75 | 0 | 0 | 300 | 4 | 49.08 | 169.30 | 5.34 | 66.64 ± 2.13 |
| 3 | −1 | −1 | −1 | −0.375 | 0 | 0 | 300 | 10 | 49.15 | 163.90 | 4.48 | 67.57 ± 1.54 |
| 4 | −1 | −1 | −1 | 1 | 0 | 0 | 300 | 32 | 39.29 | 170.70 | 5.11 | 65.48 ± 2.01 |
| 5 | −1 | −1 | 0 | −0.6875 | 0 | 0 | 325 | 5 | 45.49 | 170.50 | 5.70 | 67.00 ± 1.87 |
| 6 | −1 | −1 | 0 | −0.375 | 0 | 0 | 325 | 10 | 34.29 | 189.00 | 3.80 | 67.57 ± 1.94 |
| 7 | −1 | −1 | 0 | 1 | 0 | 0 | 325 | 32 | 40.01 | 168.70 | 3.20 | 64.40 ± 2.34 |
| 8 | −1 | −1 | 1 | −0.625 | 0 | 0 | 350 | 6 | 53.14 | 153.30 | 4.86 | 63.22 ± 2.01 |
| 9 | −1 | −1 | 1 | −0.5 | 0 | 0 | 350 | 8 | 47.83 | 158.00 | 4.63 | 64.25 ± 2.84 |
| 10 | −1 | −1 | 1 | 1 | 0 | 0 | 350 | 32 | 46.93 | 168.90 | 4.96 | 61.72 ± 1.17 |
| 11 | 1 | −1 | −1 | −1 | 0.2 | 0 | 300 | 0 | 36.70 | 131.60 | 5.60 | 59.00 ± 2.18 |
| 12 | 1 | −1 | −1 | −0.75 | 0.2 | 0 | 300 | 4 | 49.59 | 162.70 | 4.77 | 67.10 ± 1.31 |
| 13 | 1 | −1 | −1 | −0.25 | 0.2 | 0 | 300 | 12 | 50.09 | 158.70 | 4.67 | 67.65 ± 1.94 |
| 14 | 1 | −1 | −1 | 1 | 0.2 | 0 | 300 | 32 | 47.64 | 186.10 | 5.30 | 64.39 ± 2.00 |
| 15 | 1 | −1 | 0 | −0.6875 | 0.2 | 0 | 325 | 5 | 41.86 | 185.20 | 5.64 | 66.90 ± 2.31 |
| 16 | 1 | −1 | 0 | −0.25 | 0.2 | 0 | 325 | 12 | 42.98 | 194.40 | 3.45 | 74.25 ± 1.94 |
| 17 | 1 | −1 | 0 | 1 | 0.2 | 0 | 325 | 32 | 51.93 | 170.40 | 3.18 | 63.50 ± 1.76 |
| 18 | 1 | −1 | 1 | −0.625 | 0.2 | 0 | 350 | 6 | 48.25 | 171.20 | 4.78 | 63.30 ± 2.74 |
| 19 | 1 | −1 | 1 | −0.375 | 0.2 | 0 | 350 | 10 | 53.16 | 175.20 | 5.16 | 64.50 ± 2.03 |
| 20 | 1 | −1 | 1 | 1 | 0.2 | 0 | 350 | 32 | 51.76 | 175.56 | 4.56 | 61.40 ± 1.79 |
| 21 | 1 | 1 | −1 | −1 | 0.2 | 0.2 | 300 | 0 | 31.30 | 144.10 | 4.90 | 61.00 ± 2.11 |
| 22 | 1 | 1 | −1 | −0.75 | 0.2 | 0.2 | 300 | 4 | 38.15 | 187.70 | 4.10 | 67.30 ± 1.84 |
| 23 | 1 | 1 | −1 | −0.25 | 0.2 | 0.2 | 300 | 12 | 42.98 | 173.30 | 3.45 | 69.50 ± 2.31 |
| 24 | 1 | 1 | −1 | 1 | 0.2 | 0.2 | 300 | 32 | 49.39 | 179.30 | 3.08 | 63.90 ± 1.71 |
| 25 | 1 | 1 | 0 | −0.6875 | 0.2 | 0.2 | 325 | 5 | 41.19 | 176.20 | 3.49 | 66.90 ± 2.54 |
| 26 | 1 | 1 | 0 | −0.25 | 0.2 | 0.2 | 325 | 12 | 46.01 | 208.00 | 3.50 | 77.10 ± 1.90 |
| …… | ||||||||||||
| 117 | 1 | 1 | 0 | 1 | 0.2 | 0.2 | 325 | 32 | 41.74 | 173.80 | 5.17 | 64.80 ± 1.57 |
| 118 | 1 | 1 | 1 | −0.625 | 0.2 | 0.2 | 350 | 6 | 40.15 | 170.32 | 4.91 | 65.10 ± 2.09 |
| 119 | 1 | 1 | 1 | −0.375 | 0.2 | 0.2 | 350 | 10 | 42.40 | 167.40 | 4.72 | 68.90 ± 2.27 |
| 120 | 1 | 1 | 1 | 1 | 0.2 | 0.2 | 350 | 32 | 45.14 | 190.70 | 3.54 | 63.20 ± 1.68 |
Table A2.
Nomenclature.
Table A2.
Nomenclature.
| Symbol | Implication | Units |
|---|---|---|
| MSE | Mean squared error | - |
| R | The correlation coefficient | - |
| D | Grain size | μm |
| UTS | Ultimate tensile strength | MPa |
| El. | Elongation | % |
| HV | Microhardness | - |
| ta | Aging time | s |
| a | Aging temperature | °C |
References
- Tresa, M.P. Weight loss with magnesium alloys. Science 2010, 328, 986–987. [Google Scholar]
- Kondori, B.; Benzerga, A.A. Modeling damage accumulation to fracture in a magnesium-rare earth alloy. Acta Mater. 2017, 124, 225–236. [Google Scholar] [CrossRef]
- Wang, Y.D.; Wu, G.H.; Liu, W.C.; Pang, S.; Zhang, Y.; Ding, W.J. Effects of chemical composition on the microstructure and mechanical properties of gravity cast Mg-xZn-yRE-Zr alloy. Mater. Sci. Eng. A 2014, 594, 52–61. [Google Scholar] [CrossRef]
- Yang, Y.; Zhang, K.; Li, X.G.; Li, Y.J.; Ma, M.L.; Shi, G.L.; Yuan, J.W. Microstructure and phase transformation of as-cast and annealed Mg-4Zn-1Y alloy containing quasi-crystal phase. Rare Met. 2015, 34, 239–244. [Google Scholar] [CrossRef]
- Hou, X.L.; Peng, Y.L.; Lv, P.; Cai, J.; Ji, L.; Guan, Q.F. Hot deformation behavior and microstructure evolution of a Mg-Gd-Nd-Y-Zn alloy. Rare Met. 2016, 35, 532–536. [Google Scholar] [CrossRef]
- Panchal, J.H.; Kalidindi, S.R.; McDowell, D.L. Key computational modeling issues in integrated computational materials engineering. Comput. Aided Des. 2013, 45, 4–25. [Google Scholar] [CrossRef]
- Qiu, X.; Yang, Q.; Cao, Z.Y.; Liu, Y.B.; Meng, J. Microstructure and mechanical properties of Mg-Zn-(Nd)-Zr alloys with different extrusion processes. Rare Met. 2016, 35, 841–849. [Google Scholar] [CrossRef]
- Luo, K.; Zhang, L.; Wu, G.H.; Liu, W.C.; Ding, W.J. Effect of Y and Gd content on the microstructure and mechanical properties of Mg-Y-RE alloys. J. Magnes. Alloy 2019, 7, 345–354. [Google Scholar] [CrossRef]
- Zhou, Y.Y.; Fu, P.H.; Peng, L.M.; Wang, D.; Wang, Y.X.; Hu, B.; Liu, M.; Anil, K.S.; Ding, W.J. Precipitation modification in cast Mg-1Nd-1Ce-Zr alloy by Zn addition. J. Magnes. Alloy 2019, 7, 113–123. [Google Scholar] [CrossRef]
- Wang, Y.D.; Wu, G.H.; Liu, W.C.; Pang, S.; Zhang, Y.; Ding, W.J. Influence of heat treatment on microstructure and mechanical properties gravity cast Mg-4.2Zn-1.5RE-0.7Zr magnesium alloy. Trans. Nonferrous Met. Soc. China 2013, 23, 3611–3620. [Google Scholar] [CrossRef]
- Ashtiani, H.R.R.; Shayanpoor, A.A. Processing Workability and Artificial Neural Network of AA1070 to the Prediction of Hot Flow Stress. Phys. Met. Metallogr. 2021, 122, 1426–1435. [Google Scholar] [CrossRef]
- Sharath, B.N.; Venkatesh, C.V.; Afzal, A.; Aslfattahi, N.; Aabid, A.; Baig, M.; Saleh, B. Multi ceramic particles inclusion in the aluminium matrix and wear characterization through experimental and response surface-artificial neural networks. Materials 2021, 14, 2895. [Google Scholar] [CrossRef] [PubMed]
- Zhao, D.W.; Ren, D.X.; Zhao, K.M.; Pan, S.; Guo, X.L. Effect of welding parameters on tensile strength of ultrasonic spot welded joints of aluminum to steel-By experimentation and artificial neural network. J. Manuf. Process. 2017, 30, 63–74. [Google Scholar] [CrossRef]
- Castin, N.; Pascuet, M.I.; Messina, L.; Domain, C.; Olsson, P.; Pasianot, R.C.; Malerba, L. Advanced atomistic models for radiation damage in Fe-based alloys: Contributions and future perspectives from artificial neural networks. Comput. Mater. Sci. 2018, 148, 116–130. [Google Scholar] [CrossRef]
- Yang, X.W.; Zhu, J.C.; Nong, Z.S.; He, D.; Lai, Z.H.; Liu, Y.; Liu, F.W. Prediction of mechanical properties of A357 alloy using artificial neural network. Trans. Nonferrous Met. Soc. China 2013, 23, 788–795. [Google Scholar] [CrossRef]
- Conduit, B.D.; Jones, N.G.; Stone, H.J.; Conduit, G.J. Design of a nickel-base superalloy using a neural network. Mater. Des. 2017, 131, 358–365. [Google Scholar] [CrossRef]
- Patel, M.P.G.; Mathew, R.; Krishna, P.; Parappagoudar, M.B. Investigation of Squeeze Cast Process Parameters Effects on Secondary Dendrite Arm Spacing Using Statistical Regression and Artificial Neural Network Models. Procedia Technol. 2014, 14, 149–156. [Google Scholar] [CrossRef]
- Bhatt, A.; Parappagoudar, M.B. Modeling and Analysis of Mechanical Properties in Structural Steel-DOE Approach. Arch. Foundry Eng. 2015, 15, 5–12. [Google Scholar] [CrossRef][Green Version]
- Chen, L.W.; Zhao, Y.H.; Wen, Z.Q.; Tian, J.Z.; Hou, H. Modelling and Optimization for Heat Treatment of Al-Si-Mg Alloy Prepared by Indirect Squeeze Casting Based on Response Surface Methodology. Mater. Res. 2017, 20, 1274–1281. [Google Scholar] [CrossRef]
- Akhtar, M.N.; Sathish, T.; Mohanavel, V.; Afzal, A.; Arul, K.; Ravichandran, M.; Rahim, I.A.; Alhady, S.S.N.; Bakar, E.A.; Saleh, B. Optimization of Process Parameters in CNC Turning of Aluminum 7075 Alloy Using L27 Array-Based Taguchi Method. Materials 2021, 14, 4470. [Google Scholar] [CrossRef]
- Zhao, M.C.; Liu, M.; Song, G.L.; Atrens, A. Influence of Microstructure on Corrosion of As-cast ZE41. Adv. Eng. Mater. 2008, 10, 104–111. [Google Scholar] [CrossRef]
- Neil, W.C.; Forsyth, M.; Howlett, P.C.; Hutchinson, C.R.; Hinton, B.R.W. Corrosion of magnesium alloy ZE41—The role of microstructural features. Corros. Sci. 2009, 51, 387–394. [Google Scholar] [CrossRef]
- Fu, Y.; Wang, H.; Liu, X.T.; Hai, H. Effect of calcium addition on microstructure, casting fluidity and mechanical properties of Mg-Zn-Ce-Zr magnesium alloy. J. Rare Earths. 2017, 35, 503–509. [Google Scholar] [CrossRef]
- Fu, Y.; Wang, H.; Zhang, C.; Hai, H. Effects of minor Sr additions on the as-cast microstructure, fluidity and mechanical properties of Mg-4.2Zn-1.7RE-0.8Zr-0.2Ca (wt%) alloy. Mater. Sci. Eng. A 2018, 723, 118–125. [Google Scholar] [CrossRef]
- Fu, Y.; Liu, C.; Hai, H.; Xu, Y.D.; Zhu, X.R. Effect of ageing treatment on microstructures, mechanical properties and corrosion behavior of Mg-Zn-RE-Zr alloy micro-alloyed with Ca and Sr. China Foundry 2021, 18, 131–140. [Google Scholar] [CrossRef]
- Ozerdem, M.S.; Kolukisa, S. Artificial neural network approach to predict the mechanical properties of Cu-Sn-Pb-Zn-Ni cast alloys. Mater. Des. 2009, 30, 764–769. [Google Scholar] [CrossRef]
- Britto, A.S.F.; Raj, R.E.; Mabel, M.C. Prediction and optimization of mechanical strength of diffusion bonds using integrated ANN-GA approach with process variables and metallographic characteristics. J. Manuf. Process. 2018, 32, 828–838. [Google Scholar] [CrossRef]
- Soundararajan, R.; Ramesh, A.; Sivasankaran, S.; Sathishkumar, A. Modeling and Analysis of Mechanical Properties of Aluminium Alloy (A413) Processed through Squeeze Casting Route Using Artificial Neural Network Model and Statistical Technique. Adv. Mater. Sci. Eng. 2015, 2015, 714762. [Google Scholar] [CrossRef]
- Li, J.C.; Zhao, D.L.; Ge, B.F.; Yang, K.W.; Chen, Y.W. A link prediction method for heterogeneous networks based on BP neural network. Physica A 2018, 495, 1–17. [Google Scholar] [CrossRef]
Publisher’s Note: MDPI stays neutral with regard to jurisdictional claims in published maps and institutional affiliations. |
© 2022 by the authors. Licensee MDPI, Basel, Switzerland. This article is an open access article distributed under the terms and conditions of the Creative Commons Attribution (CC BY) license (https://creativecommons.org/licenses/by/4.0/).