
Modeling the Mechanical Properties of Heat-Treated Mg-Zn-RE-Zr-Ca-Sr Alloys with the Artificial Neural Network and the Regression Model


Abstract
1. Introduction
2. Experiments and Methods
2.1. Experimental Procedure
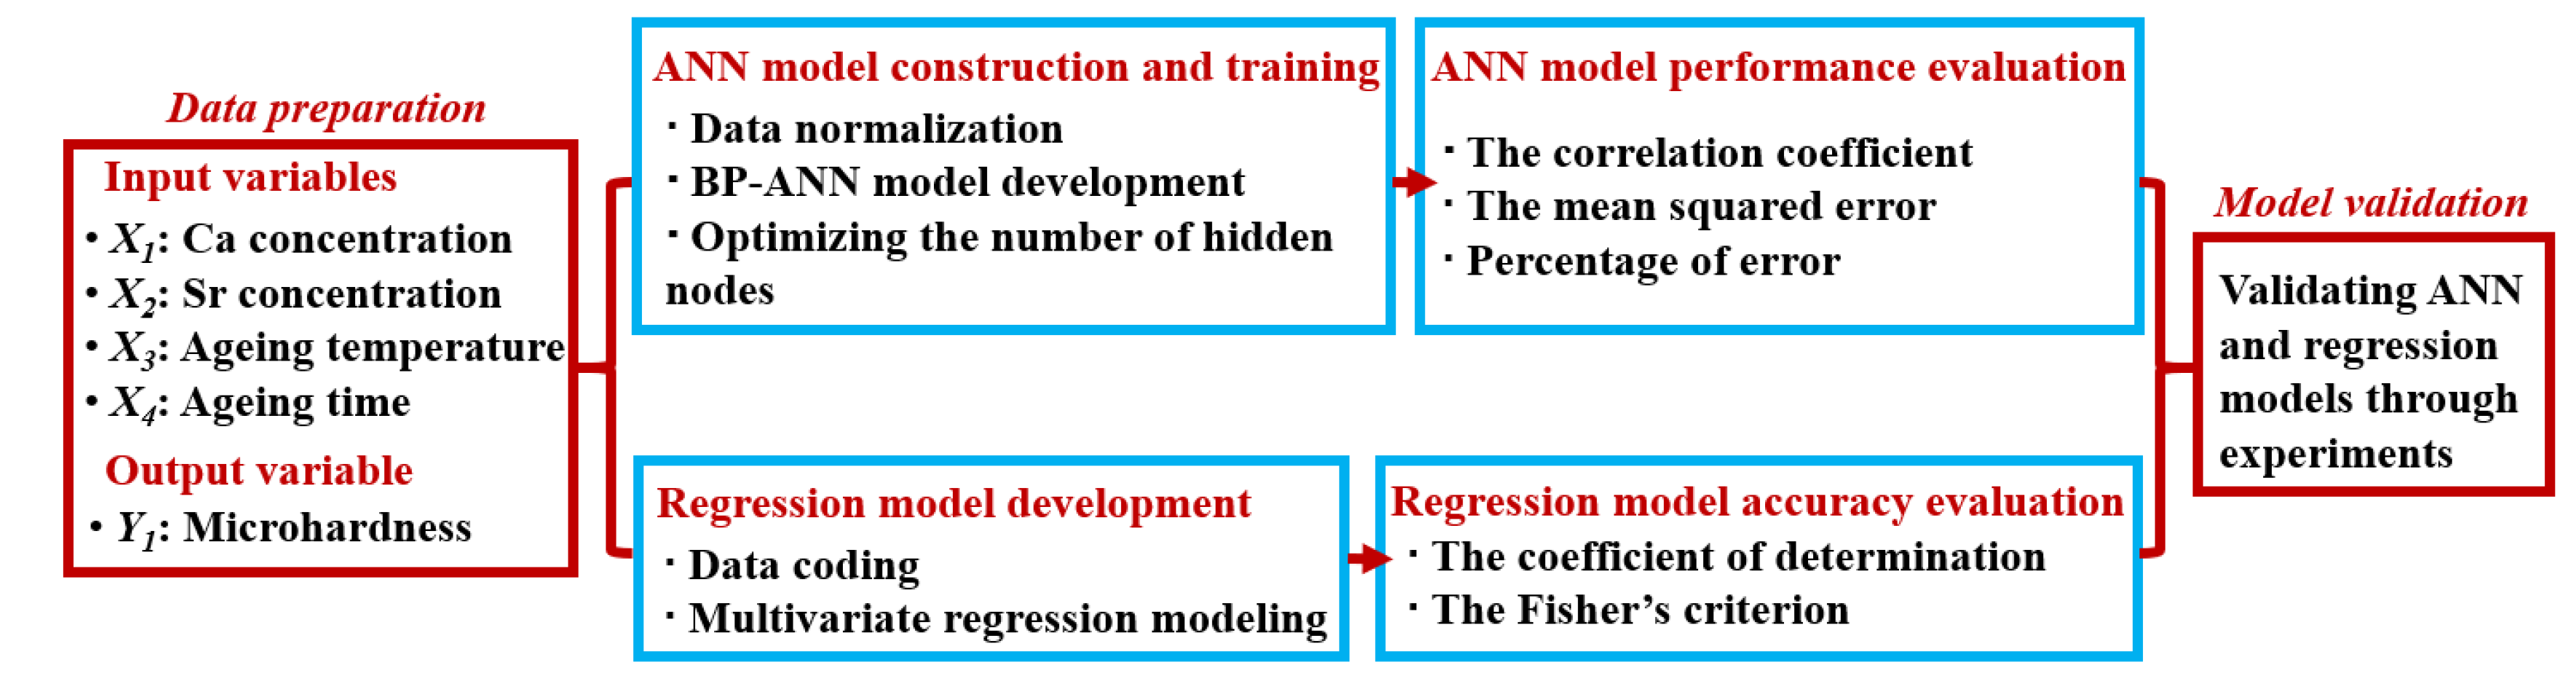
2.2. BP Neural Network Modeling
- (1)
- In order to decrease the order-of-magnitude difference in the various dimensions, the experimental dataset was normalized between −1 and 1 using the following formula:where XN is the normalized value of a certain variable and X is the experimental value for this variable. Furthermore, Xmin and Xmax are the minimum and the maximum in the dataset for this variable, respectively.
- (2)
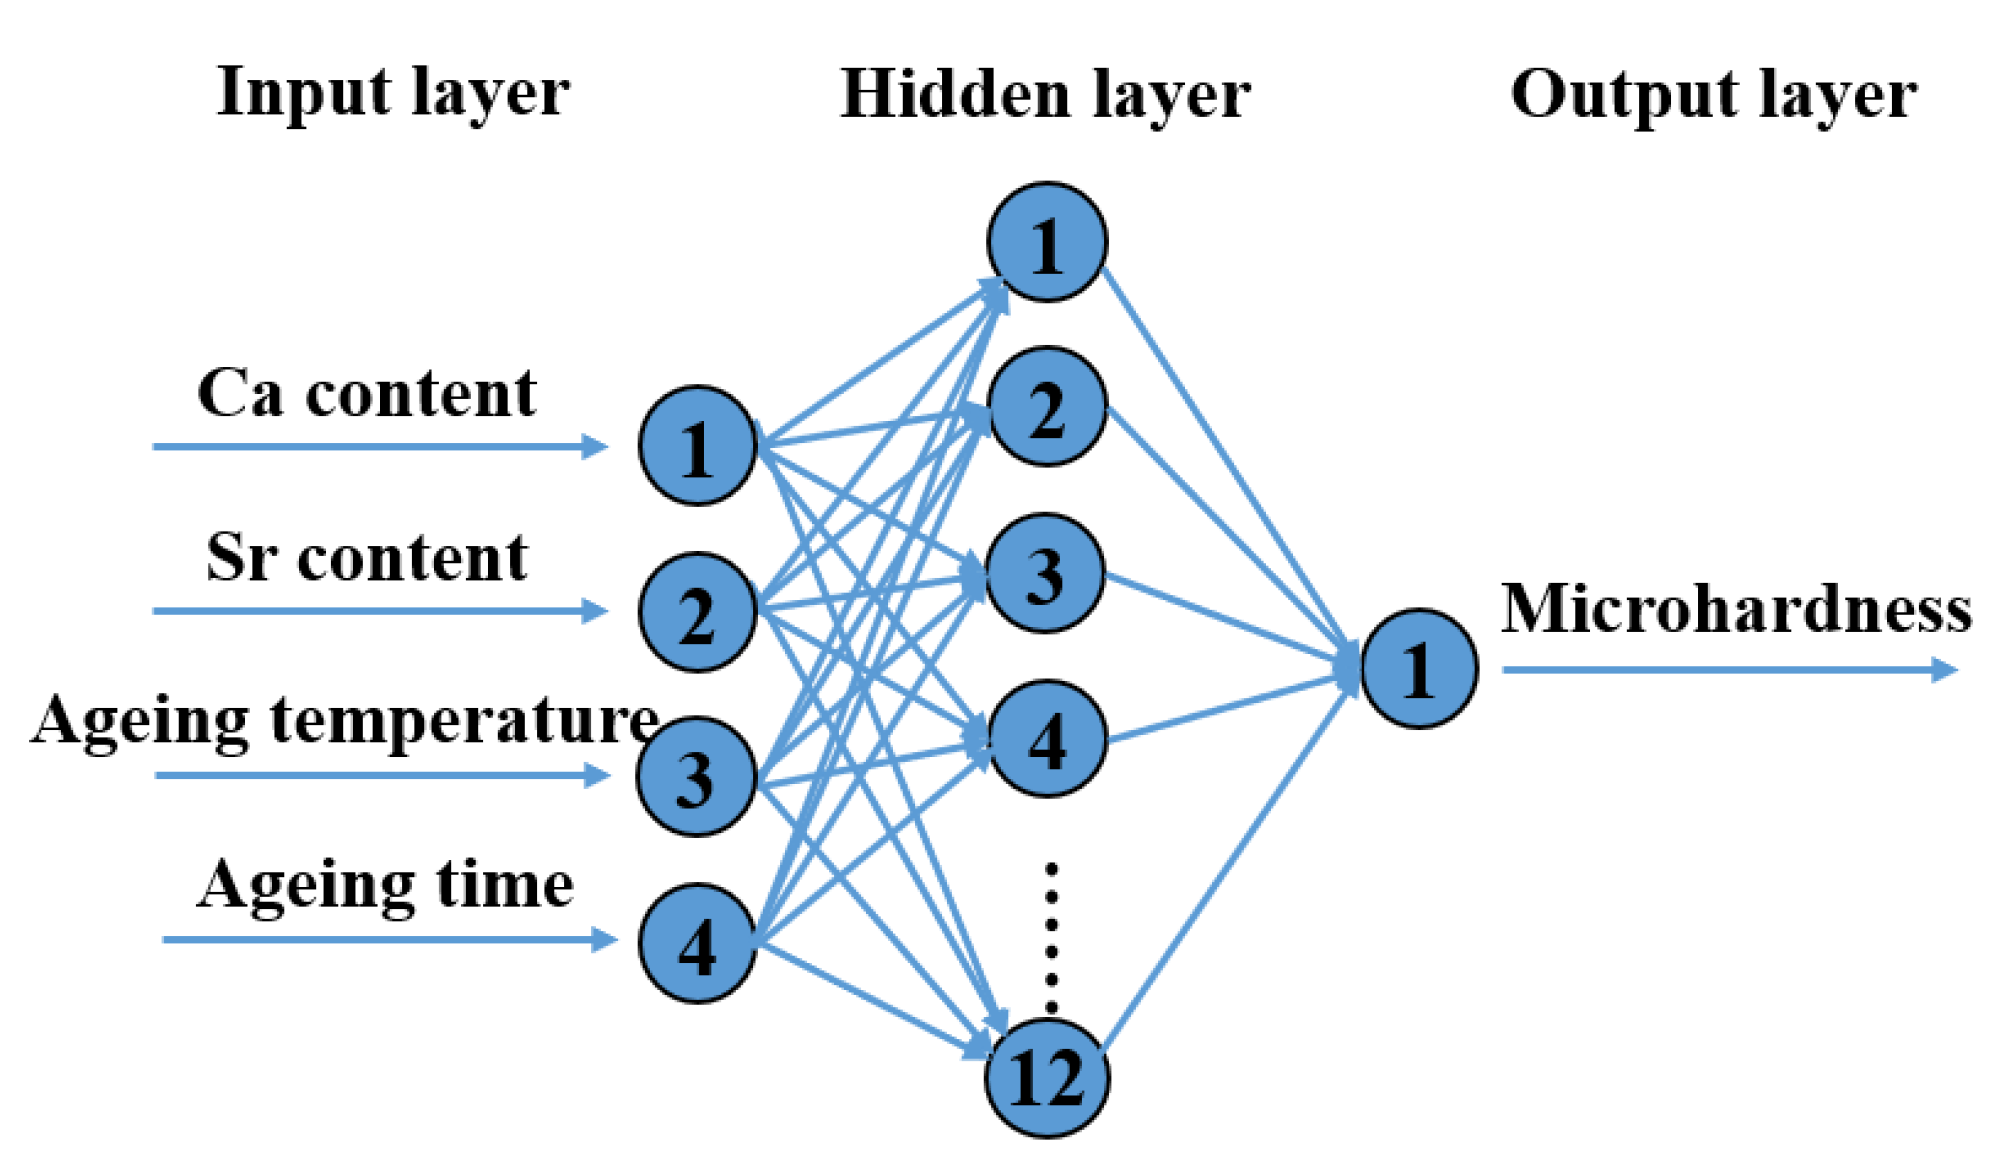
- Table 2 shows the architecture and training parameters of the BP neural network. The hyperbolic tangent ‘tan-sigmoid’ and linear transfer ‘Purelin’ functions were used as activation transfer functions. The mathematical model of the BP neural network is shown in Figure 3. Compared with the standard gradient descent algorithm, the Levenberg–Marquardt (LM) algorithm possesses fast convergence and a small mean square error [22]. As a result, the BP neural network was trained using the LM algorithm. To evaluate the performance of the developed BP network model, the correlation coefficient (R), the percentage of error and the mean squared error (MSE) were quantified as follows:where Ti is the experimental value and Yi is the predicted value. Furthermore, and are the mean values of all the experimental and predicted results, respectively. n is the total number of data pairs in this investigation. The convergence of MSE to 0.005 was established in 1000 epochs.
- (3)
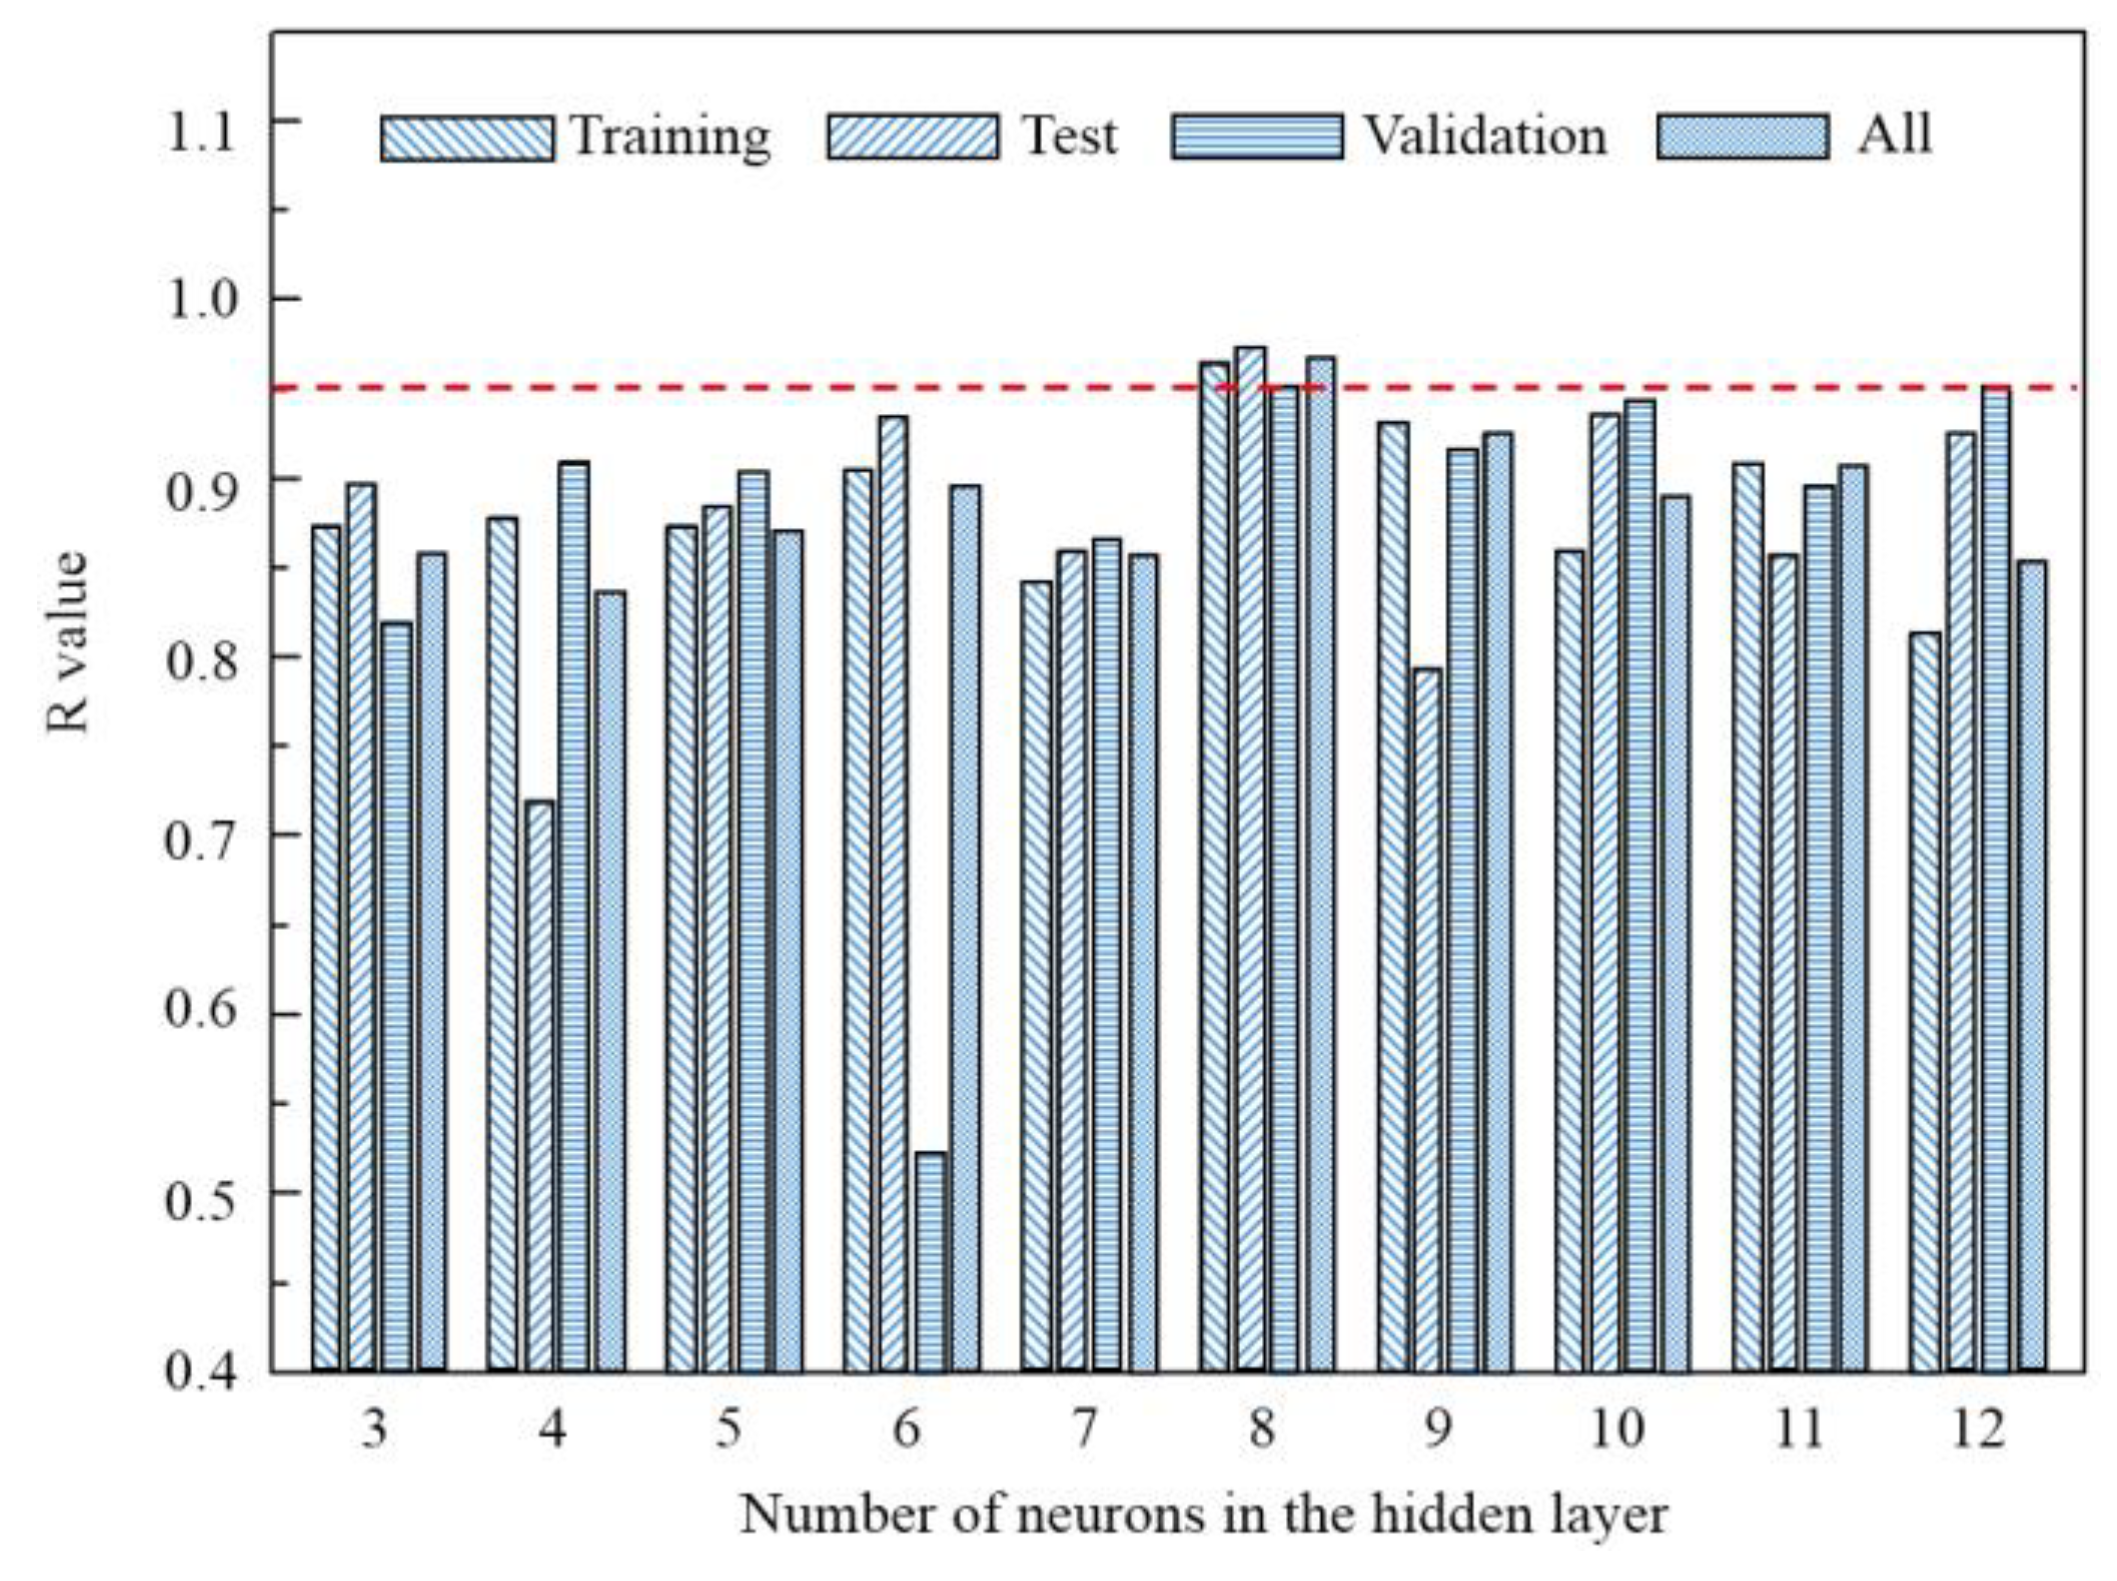
- The BP neural network was optimized by adjusting the number of hidden neurons. The effect of the number of hidden neurons on output variables was also studied. The number of hidden neurons was estimated according to the empirical equation:where m and n are the number of neurons in the input layer and output layer, respectively, and a is a constant ranging from 1 to 10 [23,24]. In order to obtain the optimal architecture, ten different BP network models were tested.
2.3. Multiple Regression Modeling
3. Results and Discussion
3.1. BP Neural Network Results
3.2. Regression Model Results
3.3. Model Validation
4. Conclusions
- (1)
- The ANN model was established using the BP algorithm. The architecture (4-8-1) was in good agreement with that of the experimental values with a correlation coefficient above 0.95.
- (2)
- The regression model was adopted to model the mechanical properties of the heat-treated experimental alloys. The adequacy of the models was tested by the coefficient of determination and Fisher’s criterion. The nonlinear regression model was statistically adequate.
- (3)
- Predicted results obtained by the BP model and the regression model are well in accordance with experimental results, indicating developed models can reliably predict the mechanical properties of heat-treated Mg-4.2Zn-1.7RE-0.8Zr-xCa-ySr alloys. Therefore, time-consuming experiments can be reduced and, hence, considerable savings in terms of cost and time could be obtained by using the developed BP model and the regression model.
Author Contributions
Funding
Institutional Review Board Statement
Informed Consent Statement
Data Availability Statement
Conflicts of Interest
Appendix A

| No. | Inputs | Output | |||
|---|---|---|---|---|---|
| X1: Ca Content, wt.% | X2: Sr Content, wt.% | X3: Ageing Temperature, °C | X4: Ageing Time, h | Y: HV | |
| 1 | 0 | 0 | 300 | 0.125 | 54.9 |
| 2 | 0 | 0 | 300 | 0.5 | 61.1 |
| 3 | 0 | 0 | 300 | 1 | 64.2 |
| 4 | 0 | 0 | 300 | 2 | 65.9 |
| 5 | 0 | 0 | 300 | 6 | 66.5 |
| 6 | 0 | 0 | 300 | 8 | 66.2 |
| 7 | 0 | 0 | 300 | 10 | 67.6 |
| 8 | 0 | 0 | 300 | 12 | 66.6 |
| 9 | 0 | 0 | 300 | 16 | 65.1 |
| 10 | 0 | 0 | 300 | 20 | 65.2 |
| 11 | 0 | 0 | 300 | 32 | 65.5 |
| 12 | 0 | 0 | 325 | 0.25 | 58.4 |
| 13 | 0 | 0 | 325 | 0.5 | 61.7 |
| 14 | 0 | 0 | 325 | 1 | 63.1 |
| 15 | 0 | 0 | 325 | 2 | 64.7 |
| 16 | 0 | 0 | 325 | 4 | 66.7 |
| 17 | 0 | 0 | 325 | 6 | 68.4 |
| 18 | 0 | 0 | 325 | 8 | 68.7 |
| 19 | 0 | 0 | 325 | 10 | 69.2 |
| 20 | 0 | 0 | 325 | 14 | 65.8 |
| 21 | 0 | 0 | 325 | 16 | 65.9 |
| 22 | 0 | 0 | 325 | 20 | 65.5 |
| 23 | 0 | 0 | 325 | 28 | 62.7 |
| 24 | 0 | 0 | 325 | 32 | 64.4 |
| 25 | 0 | 0 | 350 | 0.125 | 54.9 |
| 26 | 0 | 0 | 350 | 0.25 | 57.4 |
| 27 | 0 | 0 | 350 | 1 | 62.8 |
| 28 | 0 | 0 | 350 | 2 | 64.0 |
| 29 | 0 | 0 | 350 | 4 | 62.6 |
| 30 | 0 | 0 | 350 | 8 | 64.3 |
| 31 | 0 | 0 | 350 | 10 | 63.3 |
| 32 | 0 | 0 | 350 | 12 | 62.6 |
| 33 | 0 | 0 | 350 | 20 | 62.9 |
| 34 | 0 | 0 | 350 | 24 | 62.1 |
| 35 | 0 | 0 | 350 | 32 | 61.7 |
| 36 | 0.2 | 0 | 325 | 0.125 | 59.1 |
| 37 | 0.2 | 0 | 325 | 0.5 | 61.2 |
| 38 | 0.2 | 0 | 325 | 2 | 64.5 |
| 39 | 0.2 | 0 | 325 | 4 | 66.2 |
| 40 | 0.2 | 0 | 325 | 8 | 67.5 |
| 41 | 0.2 | 0 | 325 | 10 | 72.8 |
| 42 | 0.2 | 0 | 325 | 14 | 68.5 |
| 43 | 0.2 | 0 | 325 | 16 | 66.1 |
| 44 | 0.2 | 0 | 325 | 20 | 65.4 |
| 45 | 0.2 | 0 | 325 | 28 | 64.4 |
| 46 | 0.2 | 0 | 325 | 32 | 63.5 |
| 47 | 0.2 | 0.1 | 325 | 0.125 | 61.0 |
| 48 | 0.2 | 0.1 | 325 | 1 | 64.0 |
| 49 | 0.2 | 0.1 | 325 | 2 | 65.5 |
| 50 | 0.2 | 0.1 | 325 | 4 | 65.4 |
| 51 | 0.2 | 0.1 | 325 | 8 | 68.3 |
| 52 | 0.2 | 0.1 | 325 | 10 | 72.8 |
| 53 | 0.2 | 0.1 | 325 | 12 | 75.5 |
| 54 | 0.2 | 0.1 | 325 | 16 | 65.1 |
| 55 | 0.2 | 0.1 | 325 | 20 | 65.1 |
| 56 | 0.2 | 0.1 | 325 | 28 | 64 |
| 57 | 0.2 | 0.1 | 325 | 32 | 63.8 |
| 58 | 0.2 | 0.2 | 325 | 0.5 | 64.3 |
| 59 | 0.2 | 0.2 | 325 | 1 | 65.0 |
| 60 | 0.2 | 0.2 | 325 | 4 | 66.3 |
| 61 | 0.2 | 0.2 | 325 | 6 | 67.5 |
| 62 | 0.2 | 0.2 | 325 | 10 | 72.3 |
| 63 | 0.2 | 0.2 | 325 | 12 | 77.1 |
| 64 | 0.2 | 0.2 | 325 | 14 | 72.9 |
| 65 | 0.2 | 0.2 | 325 | 20 | 66.3 |
| 66 | 0.2 | 0.2 | 325 | 24 | 65.6 |
| 67 | 0.2 | 0.2 | 325 | 28 | 65.1 |
| 68 | 0.2 | 0.4 | 325 | 0.13 | 61.5 |
| 69 | 0.2 | 0.4 | 325 | 0.5 | 64.2 |
| 70 | 0.2 | 0.4 | 325 | 1 | 65.4 |
| 71 | 0.2 | 0.4 | 325 | 4 | 65.3 |
| 72 | 0.2 | 0.4 | 325 | 6 | 66.9 |
| 73 | 0.2 | 0.4 | 325 | 8 | 68.2 |
| 74 | 0.2 | 0.4 | 325 | 12 | 73.7 |
| 75 | 0.2 | 0.4 | 325 | 14 | 70.4 |
| 76 | 0.2 | 0.4 | 325 | 16 | 69.8 |
| 77 | 0.2 | 0.4 | 325 | 24 | 66.4 |
References
- Fang, X.G.; Lü, S.L.; Zhao, L.; Wang, J.; Liu, L.F.; Wu, S. Microstructure and mechanical properties of a novel Mg-RE-Zn-Y alloy fabricated by rheo-squeeze casting. Mater. Des. 2016, 94, 353–359. [Google Scholar] [CrossRef]
- Pan, H.; Kang, R.; Li, J.; Xie, H.; Zeng, Z.; Huang, Q.; Yang, C.; Ren, Y.; Qin, G. Mechanistic investigation of a low-alloy Mg–Ca-based extrusion alloy with high strength–ductility synergy. Acta Mater. 2020, 186, 278–290. [Google Scholar] [CrossRef]
- Li, D.; Xue, H.-S.; Yang, G.; Zhang, D.-F. Microstructure and mechanical properties of Mg–6Zn–0.5Y magnesium alloy prepared with ultrasonic treatment. Rare Met. 2017, 36, 622–626. [Google Scholar] [CrossRef]
- Wang, Y.D.; Wu, G.H.; Liu, W.C.; Pang, S.; Zhang, Y. Effects of chemical composition on the microstructure and mechanical properties of gravity cast Mg-xZn-yRE-Zr alloy. Mater. Sci. Eng. A 2014, 594, 52. [Google Scholar] [CrossRef]
- Zhao, M.-C.; Liu, M.; Song, G.-L.; Atrens, A. Influence of Microstructure on Corrosion of As-cast ZE41. Adv. Eng. Mater. 2008, 10, 104–111. [Google Scholar] [CrossRef]
- Neil, W.; Forsyth, M.; Howlett, P.; Hutchinson, C.; Hinton, B. Corrosion of magnesium alloy ZE41—The role of microstructural features. Corros. Sci. 2009, 51, 387–394. [Google Scholar] [CrossRef]
- Fu, Y.; Wang, H.; Zhang, C.; Hao, H. Effects of minor Sr additions on the as-cast microstructure, fluidity and mechanical properties of Mg-4.2Zn-1.7RE-0.8Zr-0.2Ca (wt%) alloy. Mater. Sci. Eng. A 2018, 723, 118–125. [Google Scholar] [CrossRef]
- Wen, K.; Du, W.B.; Liu, K.; Wang, Z.H.; Li, S.B. Microstructures and mechanical properties of homogenization and isothermal aging Mg-Gd-Er-Zn-Zr alloy. Rare Met. 2016, 35, 443. [Google Scholar] [CrossRef]
- Jana, A.; Das, M.; Balla, V.K. Effect of heat treatment on microstructure, mechanical, corrosion and biocompatibility of Mg-Zn-Zr-Gd-Nd alloy. J. Alloys Compd. 2020, 821, 153462. [Google Scholar] [CrossRef]
- Wang, Y.D.; Wu, G.H.; Liu, W.C.; Pang, S.; Zhang, Y.; Ding, W.J. Influence of heat treatment on microstructure and mechanical properties gravity cast Mg-4.2Zn-1.5RE-0.7Zr magnesium alloy. Trans. Nonferrous Met. Soc. China 2013, 23, 3611–3620. [Google Scholar] [CrossRef]
- Zhao, J.W.; Ding, H.; Zhao, W.J.; Huang, M.L.; Wei, D.B.; Jiang, Z.Y. Modelling of the hot deformation behavior of a titanium alloy using constitutive equations and artificial neural network. Comput. Mater. Sci. 2014, 92, 47. [Google Scholar] [CrossRef]
- Sun, Y.; Zeng, W.; Han, Y.; Ma, X.; Zhao, Y.; Guo, P.; Wang, G.; Dargusch, M. Determination of the influence of processing parameters on the mechanical properties of the Ti–6Al–4V alloy using an artificial neural network. Comput. Mater. Sci. 2012, 60, 239–244. [Google Scholar] [CrossRef]
- Liu, Z.; Wang, W.-D.; Gao, W. Prediction of the mechanical properties of hot-rolled CMn steels using artificial neural networks. J. Mater. Process. Technol. 1996, 57, 332–336. [Google Scholar] [CrossRef]
- Chen, F.F.; Breedon, M.; White, P.; Chu, C.; Mallick, D.; Thomas, S.; Sapper, E.; Cole, I. Correlation between molecular features and electrochemical properties using an artificial neural network. Mater. Des. 2016, 112, 410–418. [Google Scholar] [CrossRef]
- Yang, X.-W.; Zhu, J.-C.; Nong, Z.-S.; He, D.; Lai, Z.-H.; Liu, Y.; Liu, F.-W. Prediction of mechanical properties of A357 alloy using artificial neural network. Trans. Nonferrous Met. Soc. China 2013, 23, 788–795. [Google Scholar] [CrossRef]
- Conduit, B.D.; Jones, N.G.; Stone, H.J.; Conduit, G.J. Design of a nickel-base superalloy using a neural network. Mater. Des. 2017, 131, 358–365. [Google Scholar] [CrossRef]
- Malinov, S.; Sha, W.; McKeown, J. Modelling the correlation between processing parameters and properties in titanium alloys using artificial neural network. Comput. Mater. Sci. 2001, 21, 375–394. [Google Scholar] [CrossRef]
- Malinov, S.; Sha, W. Application of artificial neural networks for modelling correlations in titanium alloys. Mater. Sci. Eng. A 2004, 365, 202–211. [Google Scholar] [CrossRef]
- Manjunath Patel, G.C.; Mathew, R.; Krishna, P.; Parappagoudar, M.B. Investigation of squeeze cast process parameters effects on secondary dendrite arm spacing using statistical regression and artificial neural network models. Procedia Technol. 2014, 14, 149. [Google Scholar] [CrossRef]
- Bhatt, A.; Parappagoudar, M.B. Modeling and Analysis of Mechanical Properties in Structural Steel-DOE Approach. Arch. Foundry Eng. 2015, 15, 5–12. [Google Scholar] [CrossRef][Green Version]
- Chen, L.; Zhao, Y.; Wen, Z.; Tian, J.; Hou, H. Modelling and Optimization for Heat Treatment of Al-Si-Mg Alloy Prepared by Indirect Squeeze Casting Based on Response Surface Methodology. Mater. Res. 2017, 20, 1274–1281. [Google Scholar] [CrossRef]
- Ozerdem, M.S.; Kolukisa, S. Artificial neural network approach to predict the mechanical properties of Cu-Sn-Pb-Zn-Ni cast alloys. Mater. Des. 2009, 30, 764. [Google Scholar] [CrossRef]
- Soundararajan, R.; Ramesh, A.; Sivasankaran, S.; Sathishkumar, A. Modeling and Analysis of Mechanical Properties of Aluminium Alloy (A413) Processed through Squeeze Casting Route Using Artificial Neural Network Model and Statistical Technique. Adv. Mater. Sci. Eng. 2015, 2015, 714762. [Google Scholar] [CrossRef]
- Li, J.-C.; Zhao, D.-L.; Ge, B.-F.; Yang, K.-W.; Chen, Y.-W. A link prediction method for heterogeneous networks based on BP neural network. Phys. A Stat. Mech. Appl. 2018, 495, 1–17. [Google Scholar] [CrossRef]


| Nominal Alloys | Actual Composition | ||||||
|---|---|---|---|---|---|---|---|
| Mg | Zn | RE | Zr | Ca | Sr | ||
| 1 | Mg-4.2Zn-1.7RE-0.8Zr | Bal. | 4.11 | 1.62 | 0.70 | - | - |
| 2 | Mg-4.2Zn-1.7RE-0.8Zr-0.2Ca | Bal. | 4.14 | 1.61 | 0.76 | 0.18 | - |
| 3 | Mg-4.2Zn-1.7RE-0.8Zr-0.2Ca-0.1Sr | Bal. | 4.03 | 1.67 | 0.67 | 0.19 | 0.11 |
| 4 | Mg-4.2Zn-1.7RE-0.8Zr-0.2Ca-0.2Sr | Bal. | 4.13 | 1.72 | 0.69 | 0.22 | 0.21 |
| 5 | Mg-4.2Zn-1.7RE-0.8Zr-0.2Ca-0.4Sr | Bal. | 4.11 | 1.64 | 0.75 | 0.17 | 0.38 |
| Parameters | BP Neural Network |
|---|---|
| Number of layers | 3 |
| Number of neurons on the layers | Input: 4, Hidden: 4~12, Output: 4 |
| Transfer functions | Hidden layer: Tan-Sigmoid Output layer: Purelin |
| Train method | Levenberg–Marquardt (LM) |
| Initial weights and biases | Randomly between −1 and 1 |
| Target error value | 0.0167 |
| Learning rate | Variable learning rate |
| Levels | Input Variables | |||
|---|---|---|---|---|
| X1: Ca Content, wt.% | X2: Sr Content, wt.% | X3: Ageing Temperature, °C | X4: Ageing Time, h | |
| Low level (−1) | 0 | 0 | 300 | 0.125 |
| Center level (0) | 0.1 | 0.2 | 325 | 15.9375 |
| High level (1) | 0.2 | 0.4 | 350 | 32 |
| Variation range (∆Xi) | 0.2 | 0.4 | 50 | 31.875 |
| No. | Ca Content, wt.% | Sr Content, wt.% | Ageing Temperature, °C | Ageing Time, h | Experimental HV | Predicted HV | Percentage of Error, % |
|---|---|---|---|---|---|---|---|
| 1 | 0 | 0 | 300 | 0.25 | 57.8 | 57.08 | 1.17 |
| 2 | 0 | 0 | 300 | 4 | 66.6 | 67.79 | −1.72 |
| 3 | 0 | 0 | 300 | 24 | 65.2 | 63.82 | 2.16 |
| 4 | 0 | 0 | 325 | 0.125 | 54.9 | 55.59 | −1.29 |
| 5 | 0 | 0 | 325 | 12 | 66.1 | 67.97 | −2.88 |
| 6 | 0 | 0 | 325 | 24 | 64.5 | 63.08 | 2.14 |
| 7 | 0 | 0 | 350 | 0.5 | 60.3 | 59.43 | 1.36 |
| 8 | 0 | 0 | 350 | 6 | 63.2 | 64.24 | −1.62 |
| 9 | 0 | 0 | 350 | 16 | 62.9 | 64.75 | −2.95 |
| 10 | 0.2 | 0 | 325 | 1 | 62.6 | 62.89 | −0.55 |
| 11 | 0.2 | 0 | 325 | 6 | 67.8 | 66.98 | 1.21 |
| 12 | 0.2 | 0 | 325 | 12 | 74.3 | 75.19 | −1.27 |
| 13 | 0.2 | 0 | 325 | 24 | 64.9 | 64.70 | 0.31 |
| 14 | 0.2 | 0.1 | 325 | 0.5 | 63.2 | 63.27 | −0.18 |
| 15 | 0.2 | 0.1 | 325 | 6 | 65.9 | 66.05 | −0.22 |
| 16 | 0.2 | 0.1 | 325 | 14 | 69.0 | 68.96 | 0.01 |
| 17 | 0.2 | 0.1 | 325 | 24 | 64.7 | 64.52 | 0.28 |
| 18 | 0.2 | 0.2 | 325 | 0.125 | 61.6 | 63.37 | −2.87 |
| 19 | 0.2 | 0.2 | 325 | 2 | 66.0 | 65.86 | 0.21 |
| 20 | 0.2 | 0.2 | 325 | 8 | 69.9 | 68.40 | 2.15 |
| 21 | 0.2 | 0.2 | 325 | 16 | 70.9 | 69.01 | 2.66 |
| 22 | 0.2 | 0.2 | 325 | 32 | 64.8 | 63.14 | 2.56 |
| 23 | 0.2 | 0.4 | 325 | 2 | 64.9 | 65.58 | −1.04 |
| 24 | 0.2 | 0.4 | 325 | 10 | 71.5 | 70.00 | 2.07 |
| 25 | 0.2 | 0.4 | 325 | 20 | 67.4 | 68.07 | −1.00 |
| 26 | 0.2 | 0.4 | 325 | 32 | 64.2 | 64.61 | −0.64 |
| Inputs | The Response HV | |||||
|---|---|---|---|---|---|---|
| Ca Content, wt.% | Sr Content, wt.% | Ageing Temperature, °C | Ageing Time, h | Regression Model | BP Model | Experimental Result |
| 0.2 | 0.4 | 312.5 | 16 | 70.35 | 67.49 | 68.91 |
Publisher’s Note: MDPI stays neutral with regard to jurisdictional claims in published maps and institutional affiliations. |
© 2022 by the authors. Licensee MDPI, Basel, Switzerland. This article is an open access article distributed under the terms and conditions of the Creative Commons Attribution (CC BY) license (https://creativecommons.org/licenses/by/4.0/).
Share and Cite
Fu, Y.; Shao, Z.; Liu, C.; Wang, Y.; Xu, Y.; Zhu, X. Modeling the Mechanical Properties of Heat-Treated Mg-Zn-RE-Zr-Ca-Sr Alloys with the Artificial Neural Network and the Regression Model. Crystals 2022, 12, 754. https://doi.org/10.3390/cryst12060754
Fu Y, Shao Z, Liu C, Wang Y, Xu Y, Zhu X. Modeling the Mechanical Properties of Heat-Treated Mg-Zn-RE-Zr-Ca-Sr Alloys with the Artificial Neural Network and the Regression Model. Crystals. 2022; 12(6):754. https://doi.org/10.3390/cryst12060754
Chicago/Turabian StyleFu, Yu, Zhiwen Shao, Chen Liu, Yinyang Wang, Yongdong Xu, and Xiurong Zhu. 2022. "Modeling the Mechanical Properties of Heat-Treated Mg-Zn-RE-Zr-Ca-Sr Alloys with the Artificial Neural Network and the Regression Model" Crystals 12, no. 6: 754. https://doi.org/10.3390/cryst12060754
APA StyleFu, Y., Shao, Z., Liu, C., Wang, Y., Xu, Y., & Zhu, X. (2022). Modeling the Mechanical Properties of Heat-Treated Mg-Zn-RE-Zr-Ca-Sr Alloys with the Artificial Neural Network and the Regression Model. Crystals, 12(6), 754. https://doi.org/10.3390/cryst12060754