Article

Effect of Electrolysis Temperature on the Preparation of FeO by Molten Salt Electrolysis

1
College of Metallurgy and Energy, North China University of Science and Technology, Tangshan 063210, China
2
Hesteel Group Tangsteel Company, Tangshan 063000, China
*
Author to whom correspondence should be addressed.
Crystals 2022, 12(8), 1130; https://doi.org/10.3390/cryst12081130
Submission received: 1 August 2022 / Revised: 8 August 2022 / Accepted: 9 August 2022 / Published: 12 August 2022

Abstract

:
FeO is a low-price material with high charge storage capacity, biocompatibility and other characteristics. It has been applied in the fields of catalysts, capacitors, electrodes and composite materials. However, the current method of preparing FeO needs to control the temperature and reducing atmosphere, which increase the production difficulty and cost. In this experiment, the molten salt electrolysis method was used to prepare FeO by using the NaCl-KCl molten salt system and Fe2O3 and Al2O3 as raw materials, and the influence of temperature on the preparation process was explored. The results showed that the electrolysis process of Fe2O3 to FeO is mainly divided into the following three stages: the electric double-layer charging process, Fe2O3 to Fe3O4 process and Fe3O4 to FeO process. The increase in temperature can improve the reaction speed and strengthen the electrolysis effect. The higher the temperature, the less Fe3O4 and more FeO in the sample. Through analysis, it was found that the increase in temperature will affect the theoretical voltage of the electrolytic reaction in thermodynamics, resulting in the increase in the overall potential provided by the power supply. In terms of kinetics, the increase in temperature will affect the viscosity of molten salt, so that O2− transport has better kinetic conditions.

1. Introduction

FeO is a black transition metal oxide. It has the characteristics of high charge storage capacity [1], biocompatibility [2], non-toxicity [3], and low price, and has attracted the interest of researchers in metallurgy and energy fields. FeO is mainly used to make supercapacitors and electrocatalytic electrodes due to its high volumetric specific capacities and wide operating voltage range [4,5,6]. In recent studies, nano-sized FeO particles were coated on capacitor electrodes and battery electrodes in the form of surface coatings for performance improvement [7,8]. Nano-sized FeO also has applications in biomedicine and as an antibacterial agent [9,10]. Therefore, FeO is a developmental potential material. Among many works on FeO, the FeO-Al2O3 system has been identified as having a high application value. The Al/FeO-Al2O3/p-Si diodes prepared by the sol-gel coating method have excellent photoreaction performance [11]. WU used FeO, Al2O3, Fe2O3 as raw materials to prepare water-based nanofluids using the ultrasonic dispersion method, and the product can be used as cooling liquid [12]. In terms of material preparation, FeAl2O4 [13,14] prepared with FeO and Al2O3 as raw materials has good prospects in the fields of infrared radiation materials [15] and catalysts [16]. Therefore, it is necessary to further explore the potential of the FeO-Al2O3 system.
Due to the fact that FeO has thermal instability, the preparation of FeO must be carried out under conditions in which it can exist stably. This requires a weak reducing atmosphere or reducing agent and a relatively low temperature [17]. These conditions hinder the application of FeO and increase the cost. In order to solve these problems, this experiment adopted the green metallurgical process of molten salt electro deoxidation [18], and used Fe2O3 and Al2O3 as raw materials to prepare FeO. Compared with the traditional preparation method, the electro deoxidation method used Fe2O3 as the Fe source, which is common in steel-making solid waste. This can not only greatly reduce the preparation cost, but also facilitate the recycling of secondary resources. The preparation process does not require C and reducing gas, and no harmful gas was discharged, which can reduce energy consumption and environmental pollution. If the theoretical preparation method is to be used in practical industrial applications, energy consumption and cost are the most important factors, and the electrolysis temperature is the most important factor affecting the energy consumption in the electrolysis process. In order to make the design of electrolysis parameters more suitable for practical application, the influence of temperature on electrolysis effect should be explored to minimize energy consumption on the premise of achieving a certain electrolysis effect.

2. Experimental

2.1. Thermodynamic Analysis

The NaCl-KCl molten salt system [19] was used in this experiment because it is cheap and will not react with raw materials. Fe2O3 can be deoxidized to FeO under a certain electrolytic voltage, so as to facilitate the subsequent combination of FeO and Al2O3 to FeAl2O4. In order to determine the experimental conditions and reaction sequence, Factsage 7.3 was used for thermodynamic calculation. The main reactions involved in the experiment are as follows [20].
Al2O3 (s) = 2Al (s) + 2/3O2 (g)
Fe2O3 (s) = 2/3Fe3O4 (s) + 1/6O2 (g)
Fe3O4 (s) = 3FeO (s) + 1/2O2 (g)
FeO (s) = Fe (s) + 1/2O2 (g)
NaCl (s) = Na (s) + 1/2Cl2 (g)
KCl (s) = K (s) + 1/2Cl2 (g)
The standard theoretical decomposition voltage EΘ was calculated using Formula (7).
ΔGΘ = −nFEΘ
where, ΔGΘ is the standard Gibbs free energy, (kJ·mol−1); EΘ is the theoretical decomposition voltage in the standard state, (V); F is the Faraday constant, (96,485 C·mol−1); and n is the number of electrons gained or lost in the reaction equation.
Figure 1 shows that the order of reaction was (2) > (3) > (4) > (1) > (5) > (6) above 600 °C. The electrolytic voltage should be controlled within the range that meets the deoxidization of iron oxide and is less than the electrolytic voltage of Al2O3, NaCl and KCl. However, this theoretical voltage range cannot achieve the expected electrolysis effect. The complete electro deoxidation process needs to undergo several processes, including O2− diffusion on the cathode surface after dissociation from oxide, O2− transformation to the anode in molten salt, O2− change into oxygen atoms on the anode surface and generation of CO2 [16]. Each step will affect the electrolysis process. The NaCl-KCl molten salt system used in this experiment had a relatively weak ability to transmit O2−. It prevented O2− which fell out of the cathode from reaching the anode graphite rod in time. Therefore, it was necessary to increase the electrolytic driving force and adjust the experimental voltage to 2.3 V.

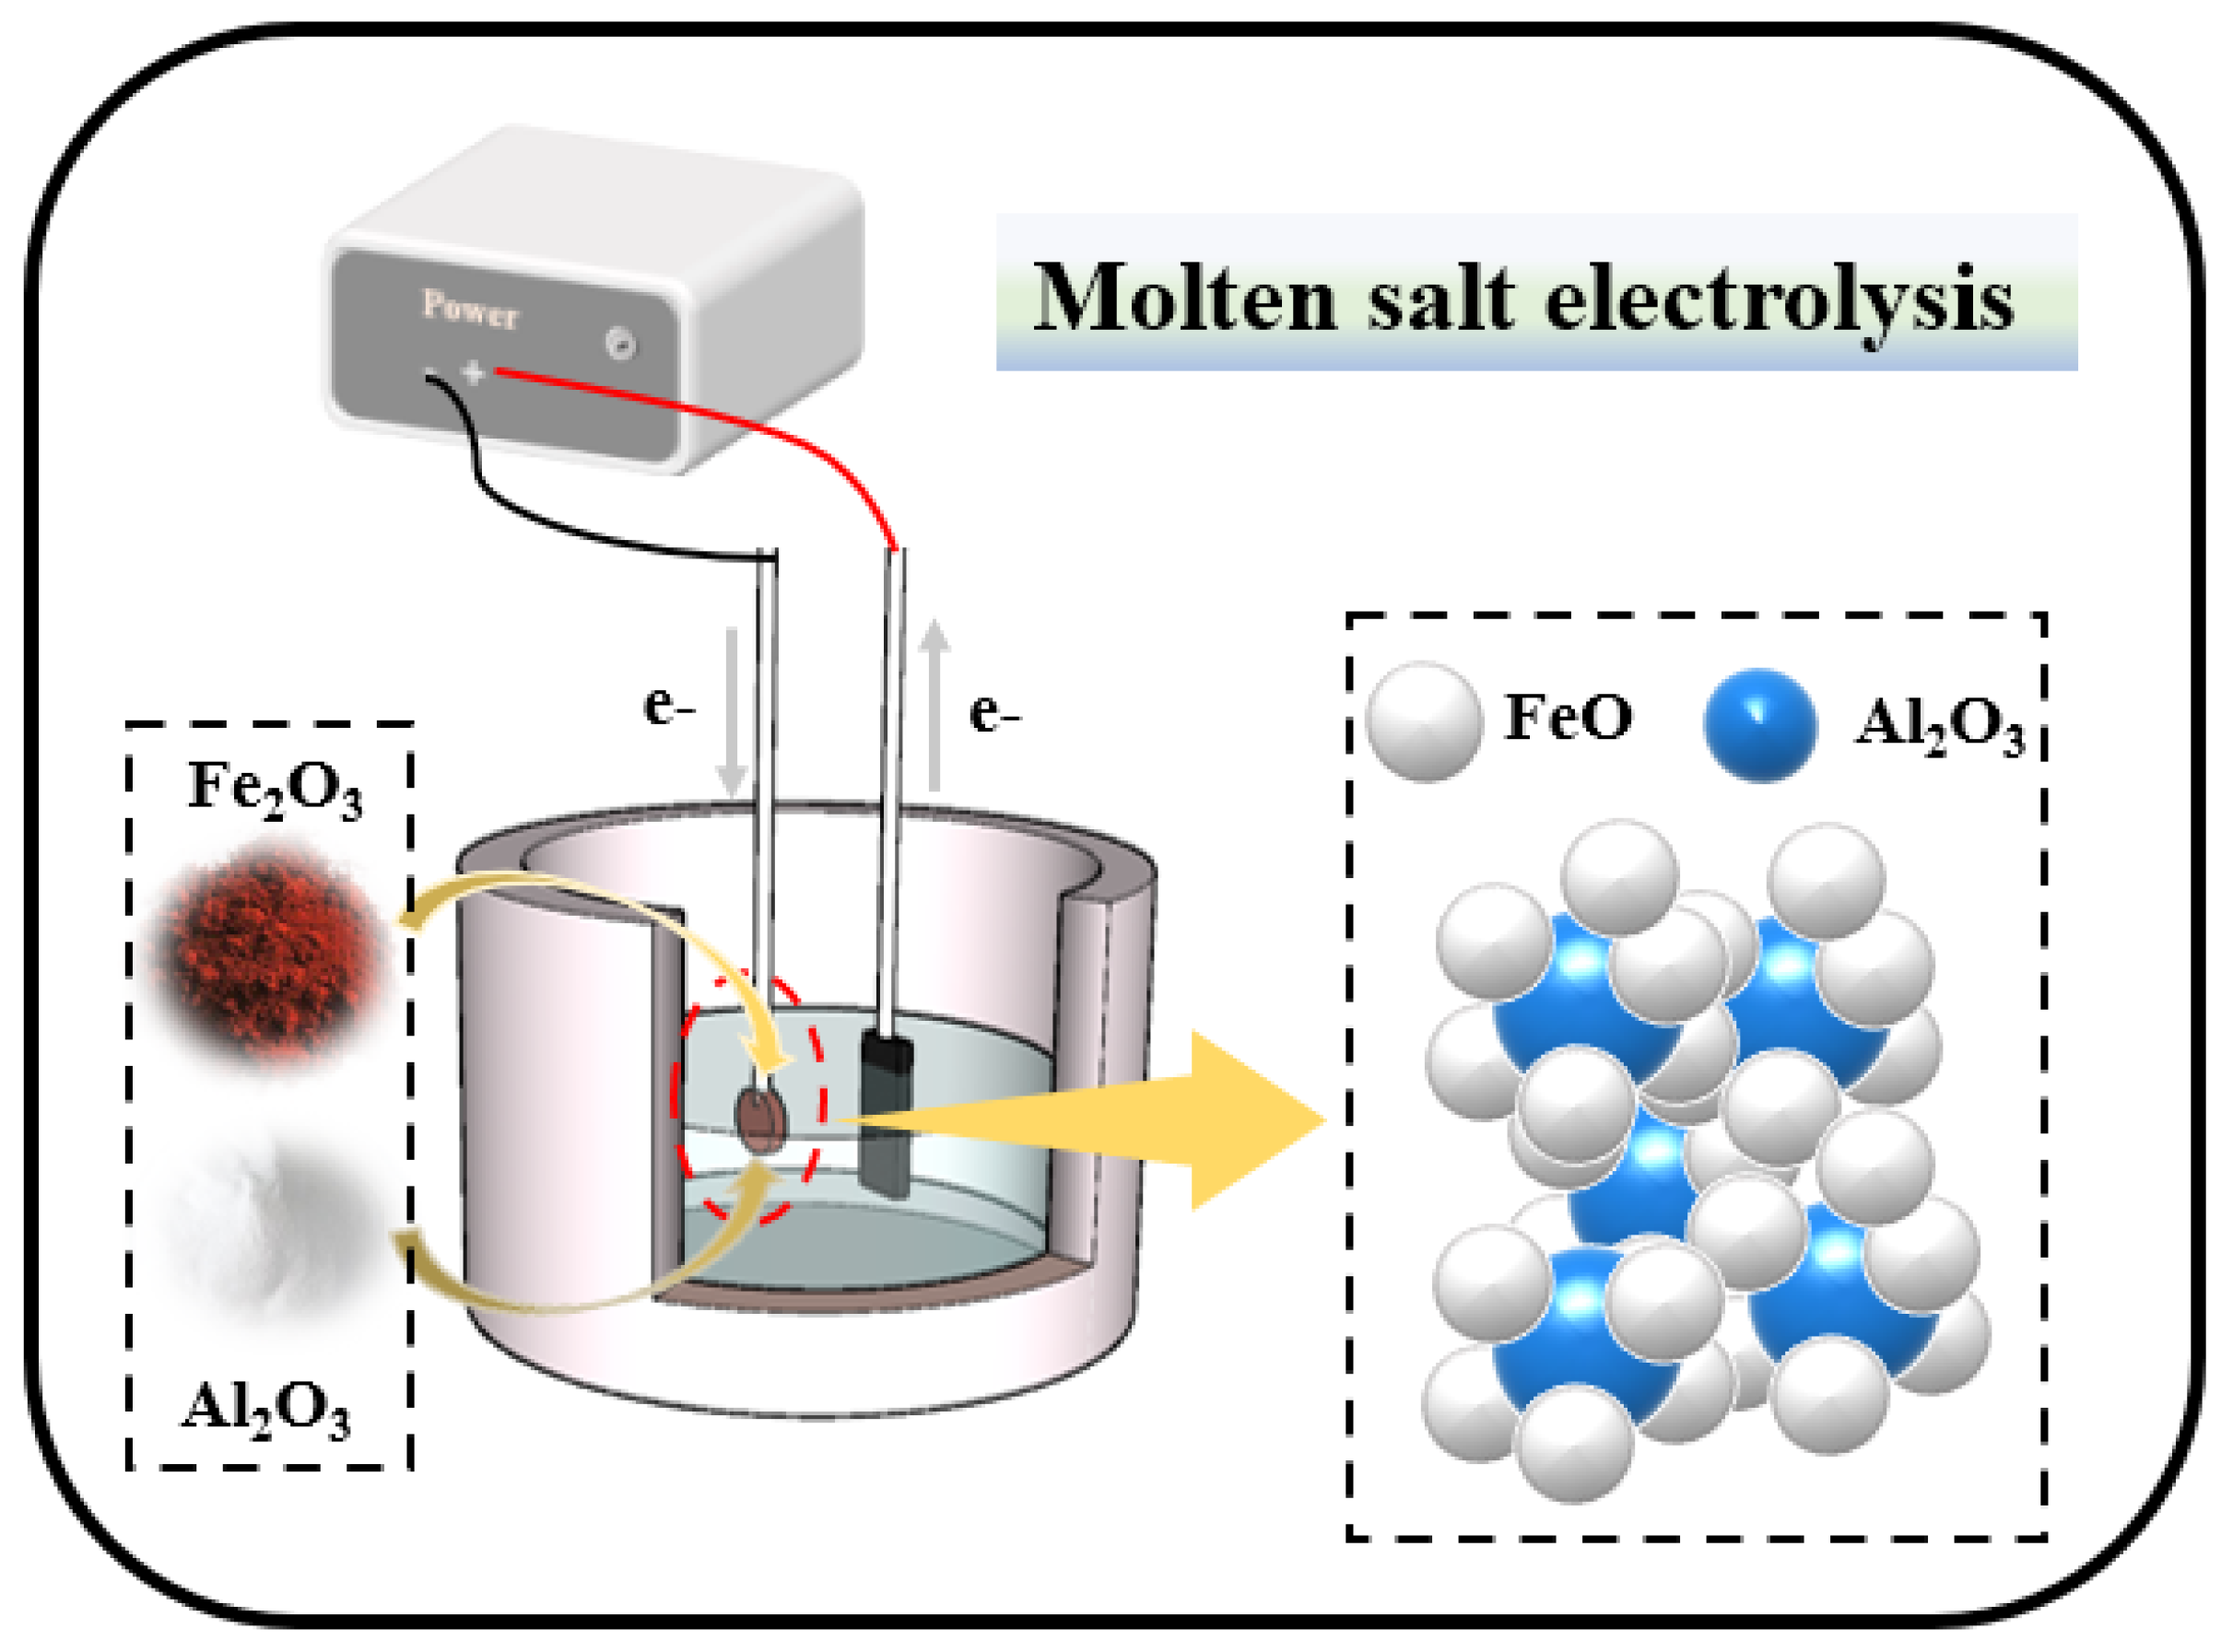
2.2. Experimental Process

The cathode raw materials were analytically pure (99.5%) Fe2O3 and Al2O3 powders (Macklin Group Co., Ltd., China, analytical reagent). Fe2O3 and Al2O3 with a mass ratio of 3:2 was weighed, the two powders were mixed evenly, place into an agate ball milling tank, an agate ball and 6 mL alcohol were added, and then the ball was milled for 6 h to achieve a small and uniform particle size. The powder dried for 12 h and was poured into the sample pressing mold, pressed on the sample pressing machine with a pressure of 6 MPa for 3 min, and then removed. The pellets were sintered for 5 h at 800 °C to ensure they had a certain strength and density. The sintered pellet was the cathode of electrolysis (10 × 3 × 1 mm3). High-purity graphite pellet (100 × 15 × 5 mm3) was used as the electrolytic anode. Weighed NaCl and KCl with a molar ratio of 1:1 was mixed well, and poured into a graphite crucible (the total mass of NaCl and KCl was 180 g). The graphite crucible was placed into the tubular furnace, the furnace temperature was raised to the experimental temperature under argon atmosphere and maintained for 1 h to completely melt the molten salt. Then, the assembled cathode and anode were placed into molten salt, and a voltage of 2.3 V for 4 h was applied. The whole process was carried out in argon atmosphere to prevent the electrolytic device and sample from being oxidized. Argon atmosphere can also prevent oxygen in the air from dissolving into molten salt. After electrolysis, the cathode was rinsed with distilled water in argon atmosphere to remove the salt adhered to its surface, then the cathode pellet was placed into a beaker and 50 mL of alcohol was added, washed in an ultrasonic cleaner for 10 h, and then dried. The schematic diagram of the electrolysis process is shown in Figure 2. The prepared samples were characterized using a D/MAX2500PC diffractometer and Zeiss Gemini 300 electron microscope, and the phase differences and microstructure differences caused by different electrolysis temperatures were analyzed.

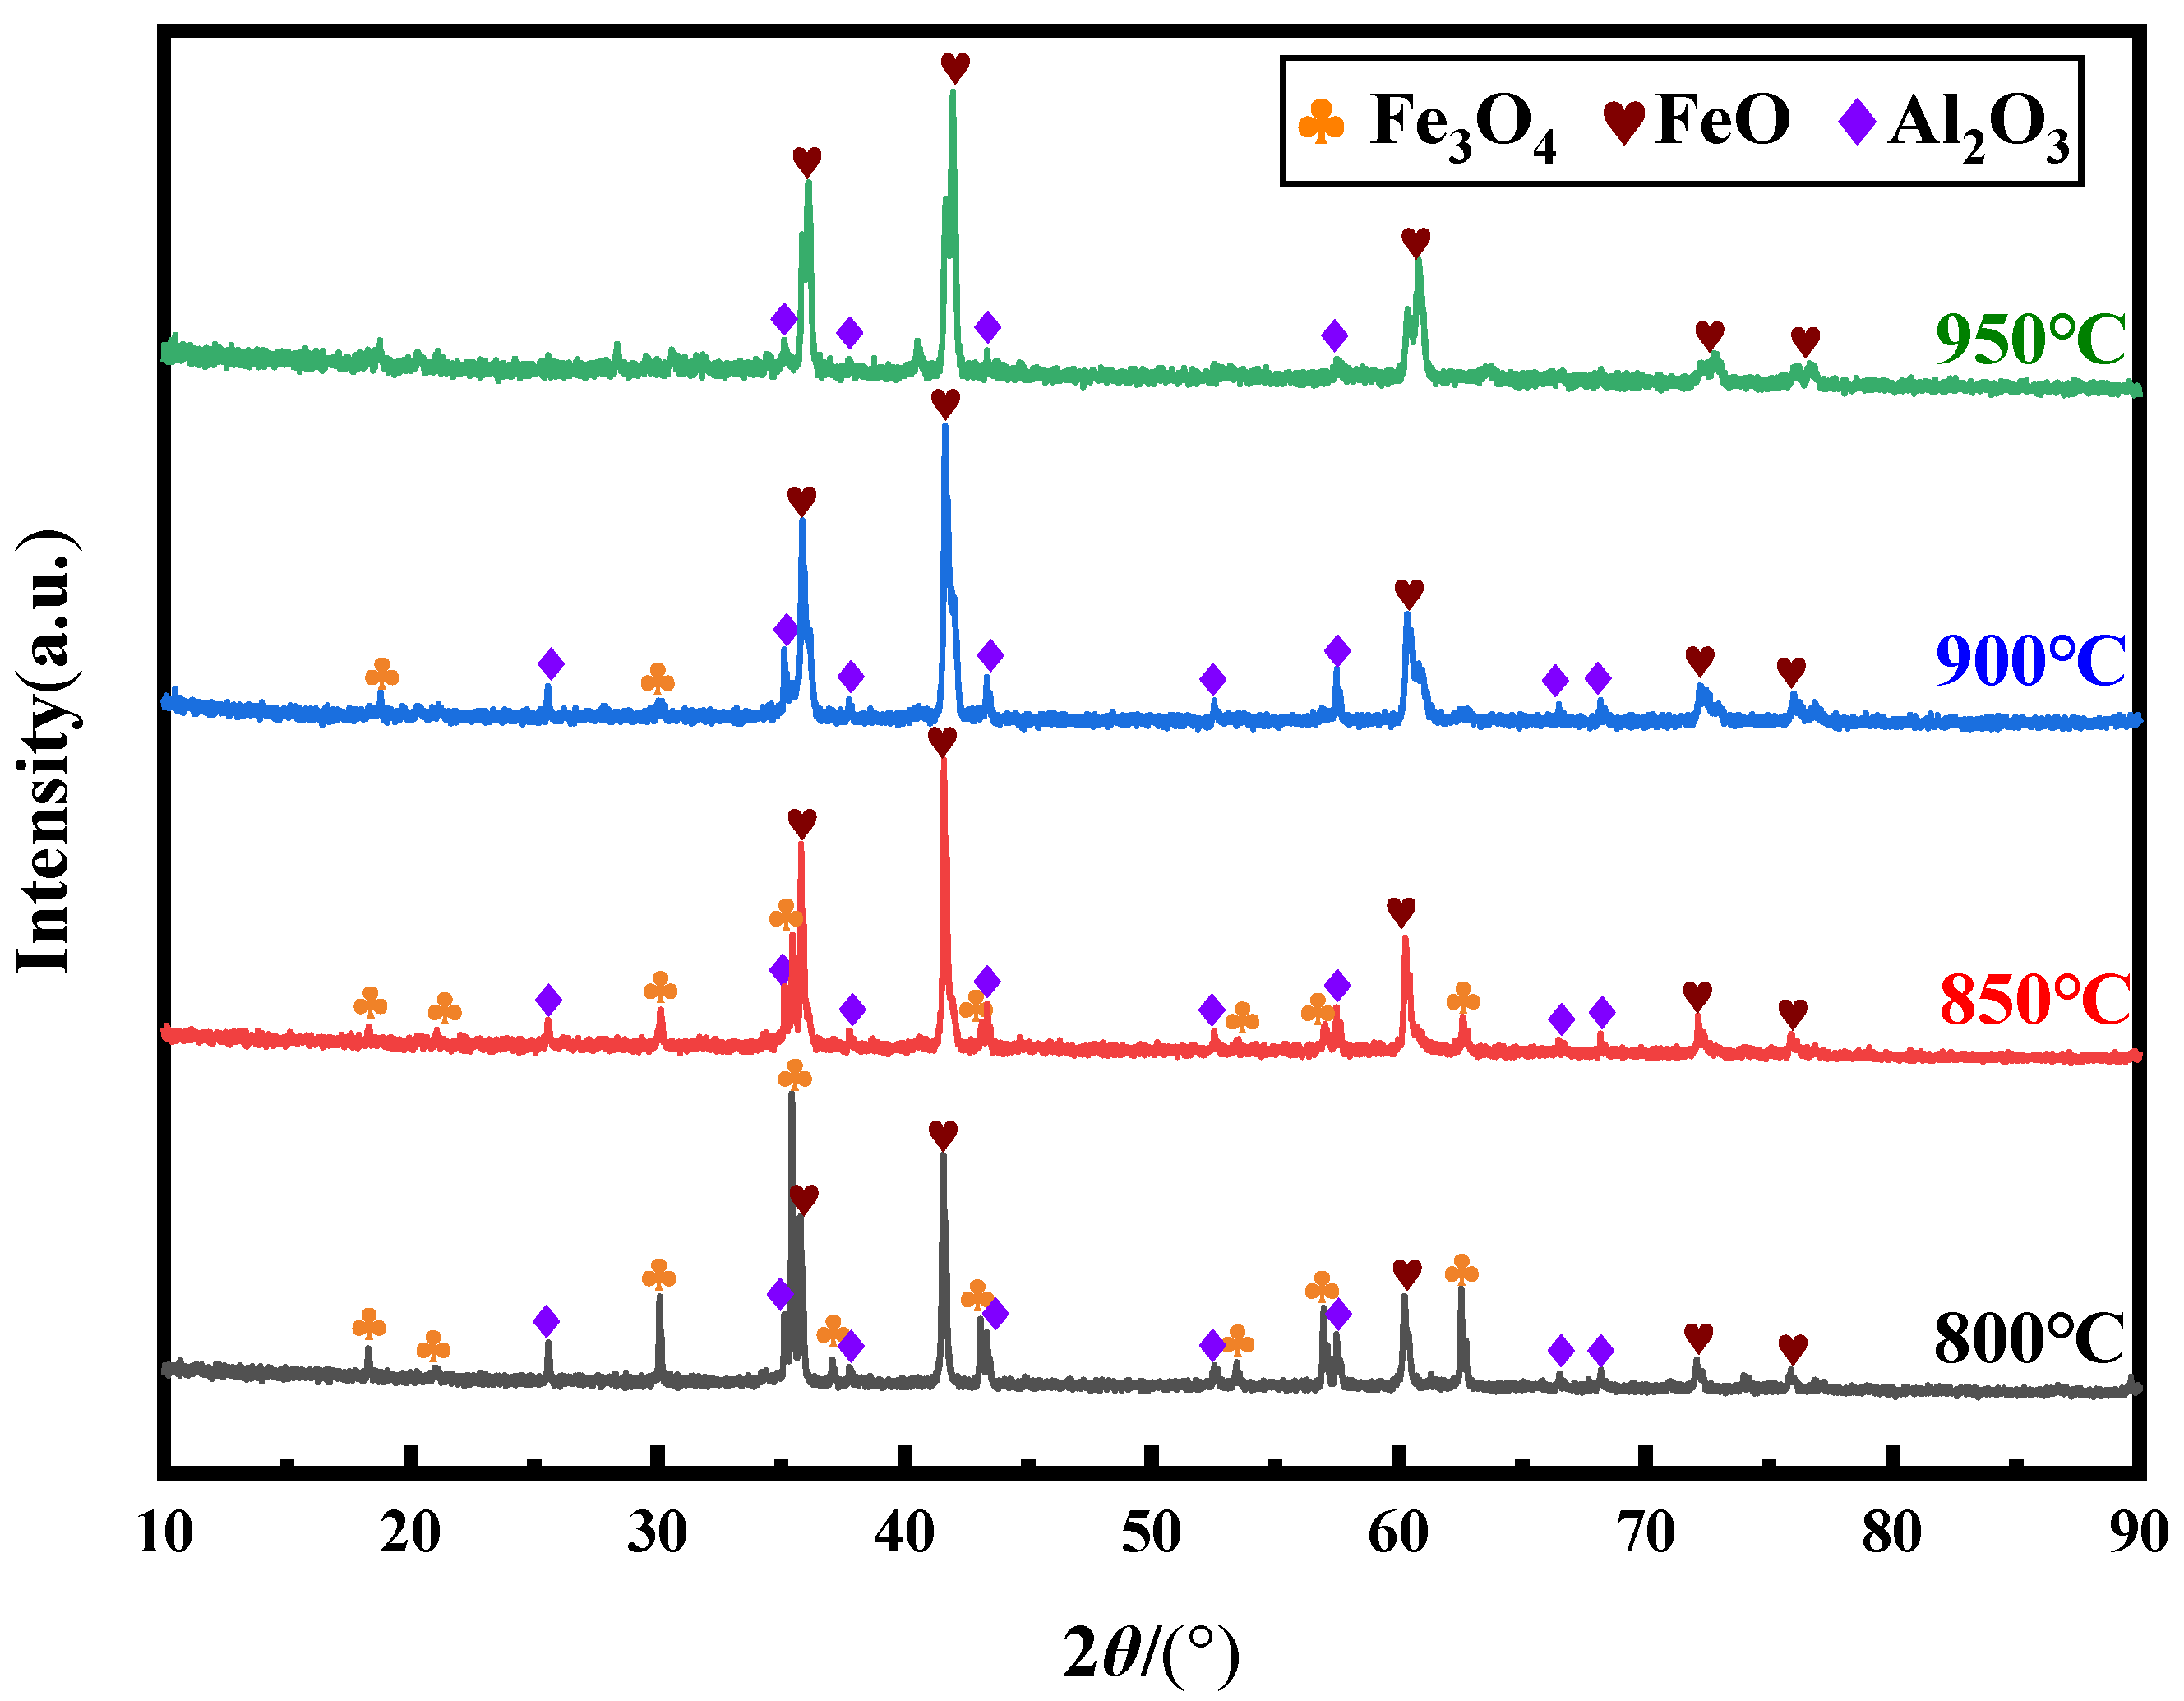
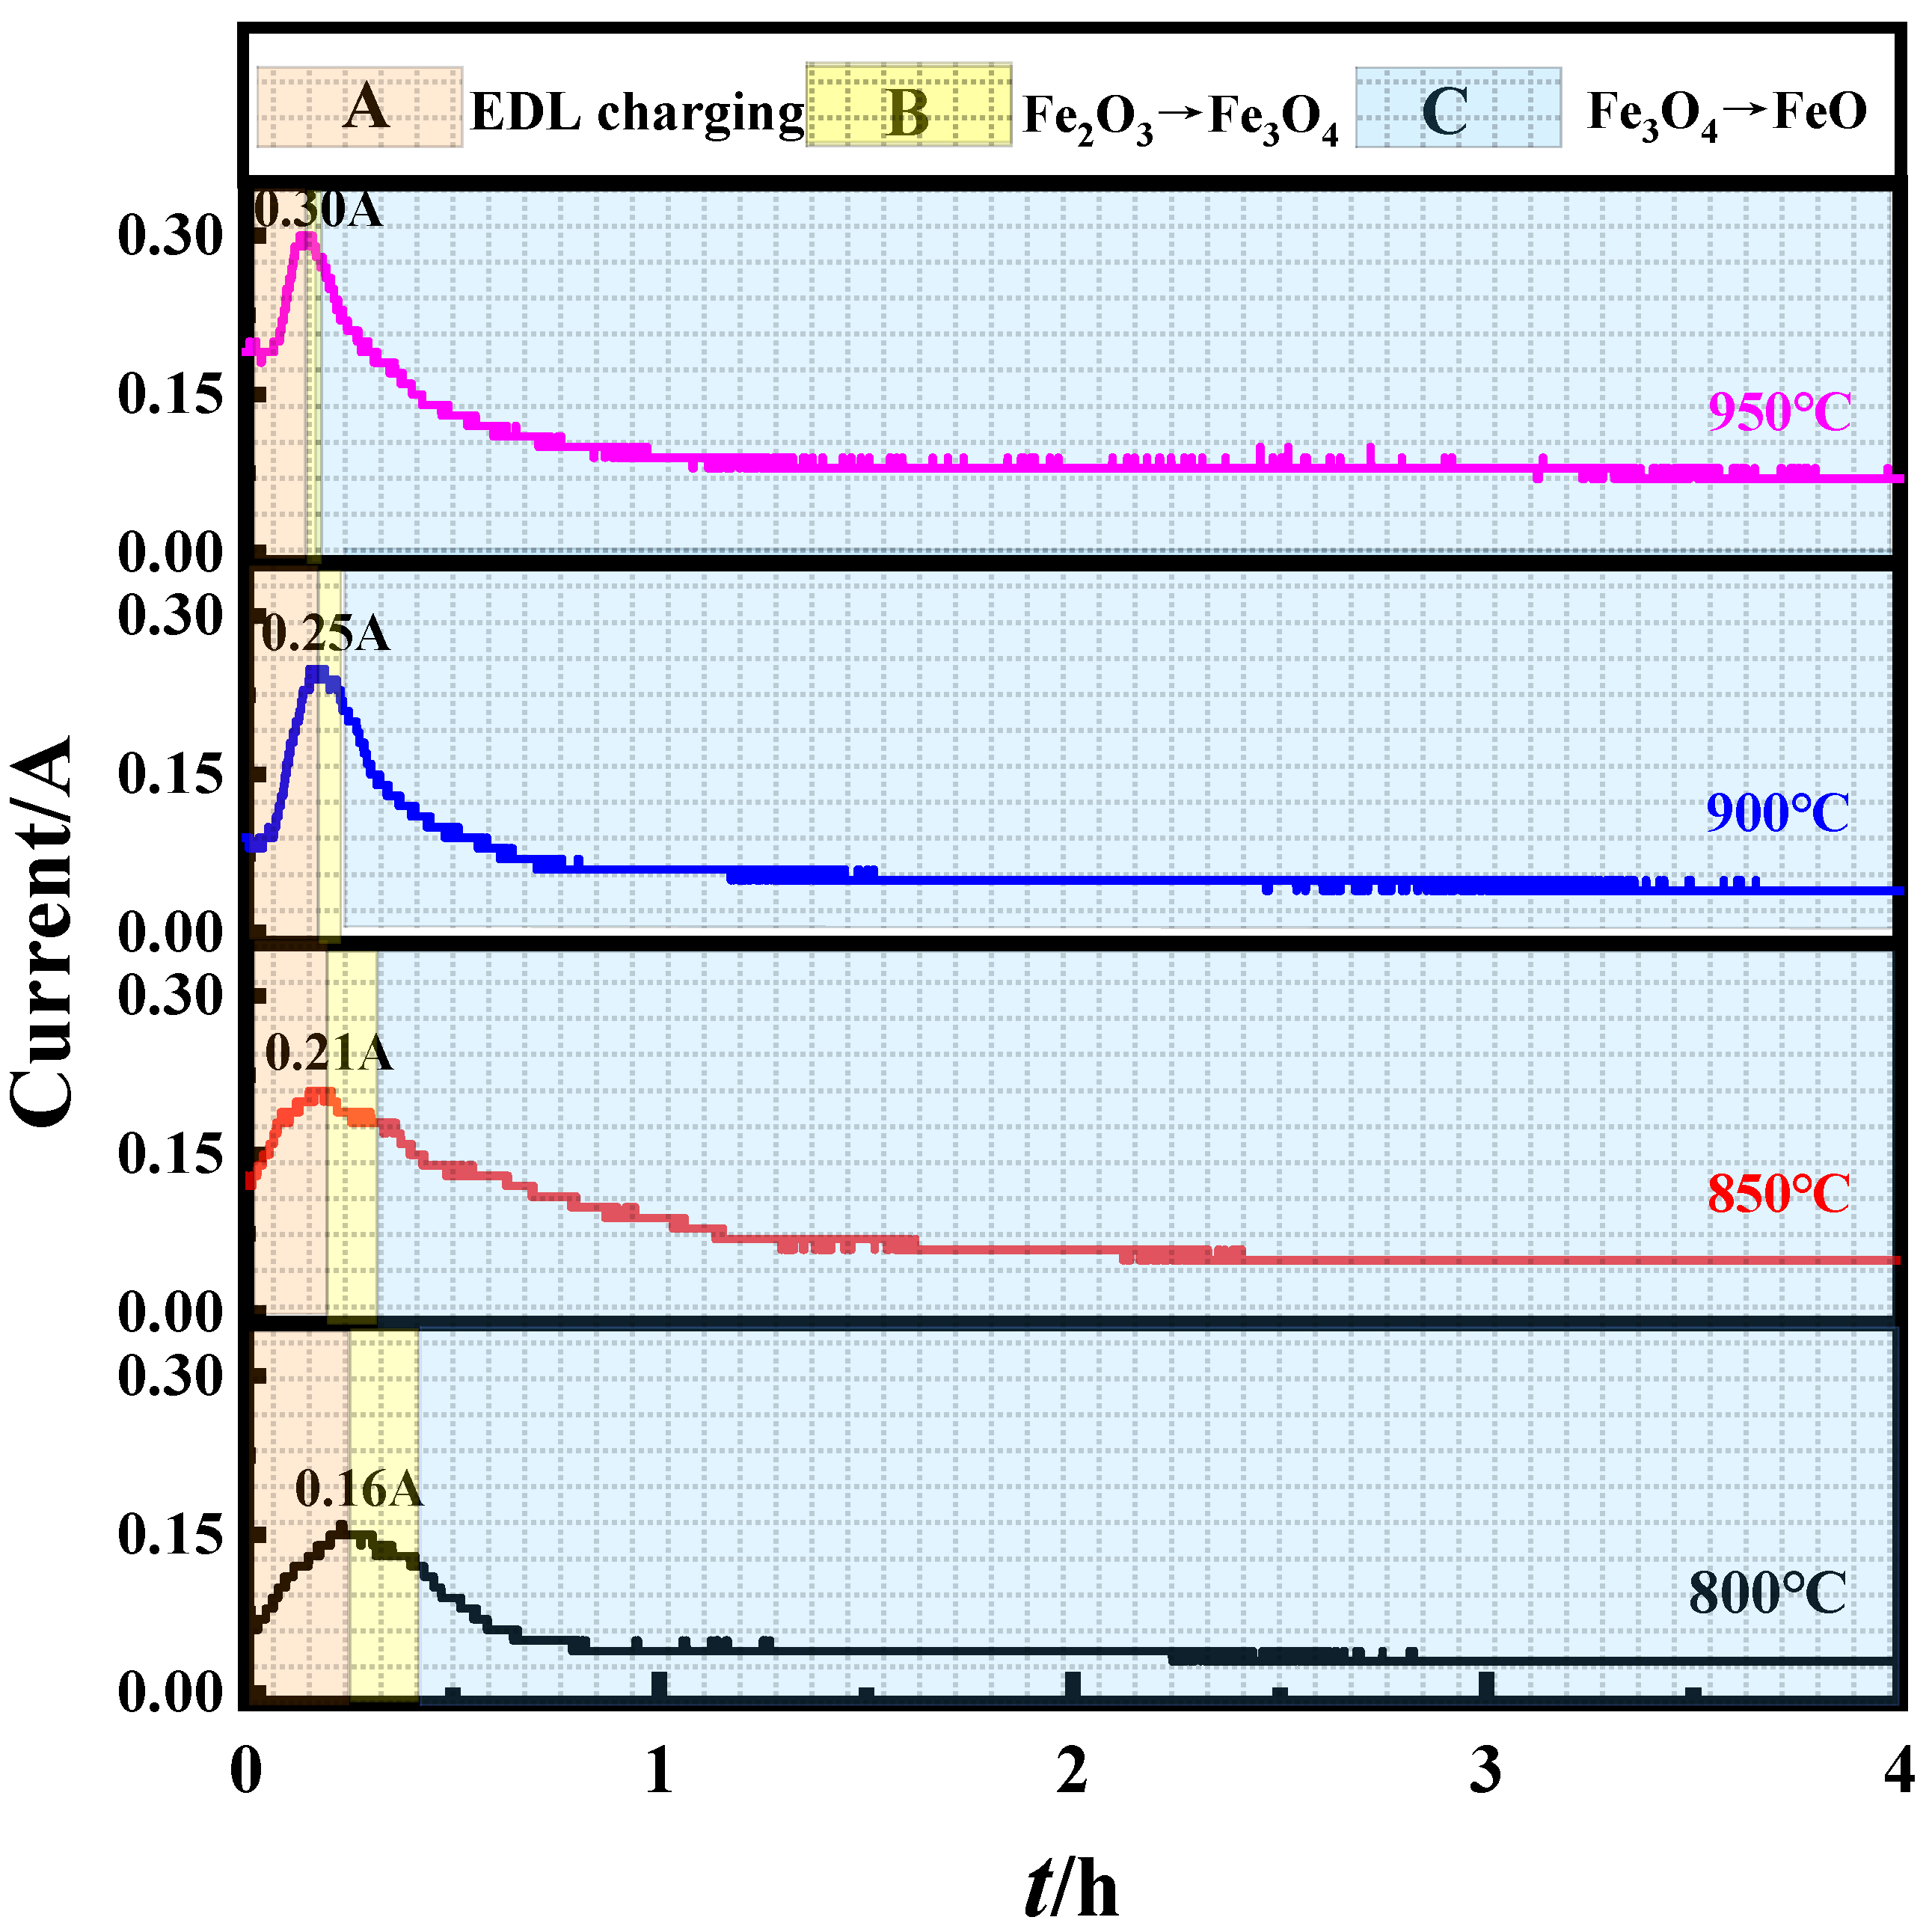
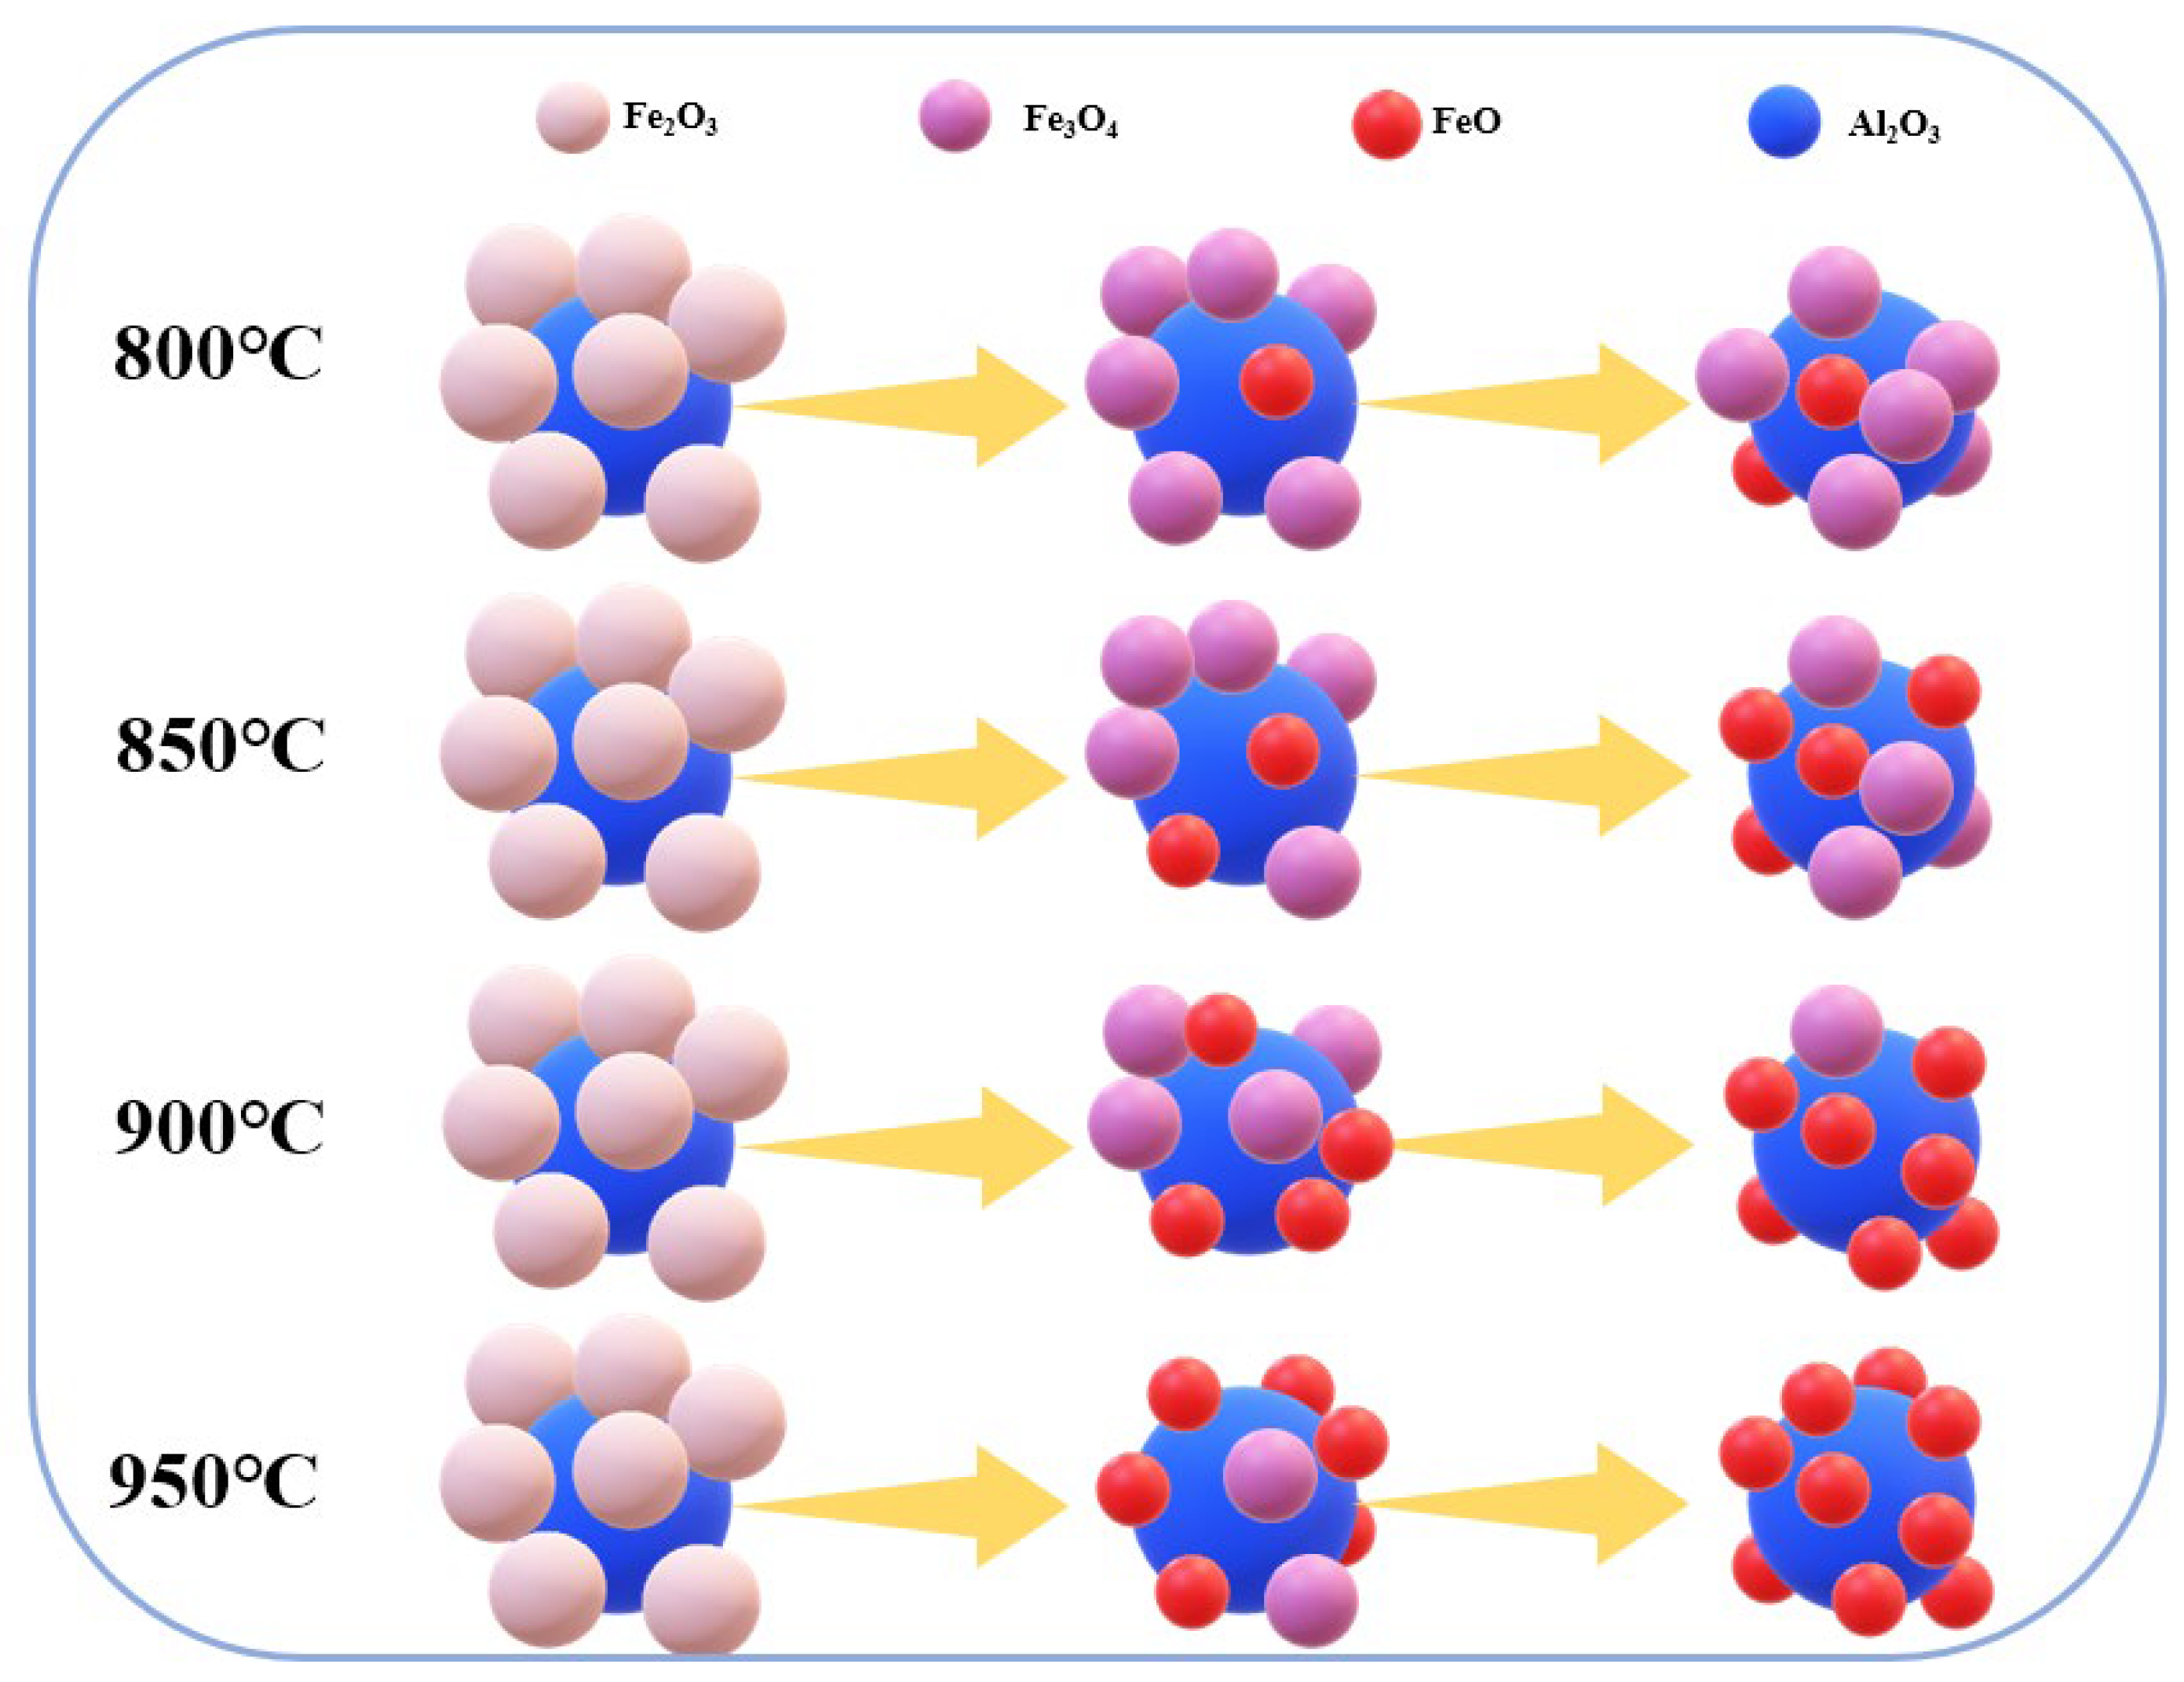
3. Results and Discussion

Figure 3 shows the XRD pattern of the product after electrolysis at 2.3 V at different temperatures for 4 h. The products of the cathode pellet at 800 °C were Fe3O4, FeO and Al2O3 phases, of which Fe3O4 was the main phase. This shows that the transformation degree of Fe3O4→FeO was not considerable at this temperature, and there was still a considerable amount of Fe3O4 in the sample. When the electrolysis temperature was low, the viscosity of molten salt electrolyte was high, the fluidity was poor, the conductivity was also low, and the kinetic conditions of O2− transmission were relatively worse. According to the thermodynamic calculation in Section 2.1, it can be found that with the decrease in temperature, the theoretical potential of the reduction reaction of iron oxide increases. Therefore, under the condition of constant voltage, the reaction at lower temperature had less over potential, and the electrolysis rate was slower, which affected the diffusion of O2− from the cathode to molten salt. The Fe3O4 content of the cathode product at 850 °C decreased sharply, and the FeO content increased and became the main phase in the sample. After electrolysis at 900 °C, the main product of the cathode was still FeO, the FeO peak was stronger, and the content of Fe3O4 decreased gradually. The main product of electrolysis at 950 °C was FeO. Fe3O4 basically disappeared. Because at a high temperature the theoretical electrolytic voltage of iron oxide was low, the over potential of the reaction was larger and the reaction faster. At the same time, it can also be clearly found in the experiment that the viscosity of electrolyte decreased, so the resistance of ion movement was smaller and the movement speed faster, which weakened the concentration polarization and was conducive to the progress of the reaction, making it quickly convert to FeO under the specified conditions. Some researchers found the same phenomenon by electrochemical means. The increase in temperature will reduce the activation energy of the iron oxide electro deoxidation reaction, which will increase the reaction rate [21].
Figure 4 shows the recorded I-t curve corresponding to different electrolysis temperatures. The curve can be divided into three stages of A, B and C. Stage A is the electric double layer charging process. After the power is turned on, the electrode will complete the polarization charging in a short time, and the current will rise to the maximum value quickly. When the current reaches the maximum value, it means that the electric double layer charging is completed. At this time, the three-phase boundary is formed, and subsequent electric deoxidation can be carried out. Stage B is the process of electro deoxidation of Fe2O3 to Fe3O4, which represents the gradual entry of molten salt into the cathode pellet and the formation of a new three-phase boundary constantly advancing towards the interior of the pellet at the deoxidized Fe3O4 and undeoxidized Fe2O3. At this stage, with the transition from Fe2O3 to Fe3O4, the current gradually decreased and tended to be stable. The current entered a short plateau period, and Fe2O3 was completely deoxidized to Fe3O4. Stage C represents the process of electro deoxidation of Fe3O4 to FeO, and the current in this stage is smaller than that in stage B. As the reaction occurred inside the cathode pellet, the three-phase boundary was also deeper, which led to the resistance of the pellet becoming larger, so the overpotential provided by the power supply was smaller, the driving force of the reaction was smaller, and the current further dropped [22]. Combined with the duration and current of stages B and C, it was more difficult for Fe3O4 to transform into FeO than Fe2O3 to Fe3O4. As the rate curve in electrochemical reaction, the slope of I-t curve in each stage can reflect the reaction speed in this stage to a certain extent, and can be used to compare the reaction kinetics under different conditions. Table 1 shows the absolute value of the current slope obtained by the linear fitting of A and B stages. The fitting was carried out using Origin 2021. Comparing the I-t curves at different temperatures, when the electrolysis temperatures were different, its initial currents were different, and the slope of current change with time was also different. The higher the temperature was, the higher the electric double-layer charging speed and current peak after charging were. The shorter time required for stage B, the better kinetic conditions of the reaction. XRD and I-t curves both show that the electrolysis temperature had a significant effect on the electrolysis reaction rate. As the temperature of molten salt decreases, the theoretical decomposition voltage required for raw oxide will increase. If the voltage is constant, the driving force of the electrolytic reaction will decrease at this time, which is bound to affect the reaction rate dynamically. On the other hand, a higher electrolysis temperature can shorten the time required to complete stage A and B, so in the case of limited time, the time left for stage C will be longer, and the amount of FeO obtained by deoxidation will be greater.
Figure 5 and Figure 6 show the SEM and energy spectrum surface scan images of the samples after electrolysis for 4 h at different temperatures. The large block particles were Al2O3, and the small particles were the products of Fe2O3 deoxidization, which adhere to Al2O3 particles to form nuclei and mature. With the increase in the electrolysis temperature, the particles of deoxidized Fe2O3 become increasingly smaller. According to the XRD results, this phenomenon was due to the increasing amounts of FeO obtained by deoxidation. The electrolysis temperature of 950 °C was suitable for this experiment.
Combined with the XRD, I-t curve and SEM results, the influence mechanism of temperature on the preparation process of FeO can be obtained. In thermodynamics, the rise in temperature leads to the decrease in the theoretical electrolytic voltage and the rise in the experimental overpotential, which increases the speed of the reaction. In dynamics, as the temperature increases, the average energy of all molecules also increases. The energy required for iron oxide molecules from the normal to active state decreases, and the number of activated molecules participating in the reaction increases, so the reaction proceeds faster, as shown in Figure 7. In addition, the decrease in the molten salt viscosity caused by increasing temperature also provides better kinetic conditions for ion transport.

4. Conclusions

In this paper, Fe2O3 and Al2O3 were used as raw materials to prepare FeO by molten salt electro deoxidation, and the influence of temperature on the preparation process was explored. At the electrolysis temperature of 800 °C, the components of the sample were Fe3O4, FeO and Al2O3, in which Fe3O4 was the main phase. As the electrolysis temperature continued to rise, the main item of the sample was FeO, and the amount of Fe3O4 continued to decrease, while the amount of FeO continued to increase. From the corresponding I-t curve, the increase in the electrolysis temperature can accelerate the electric double layer charging process and electrolysis speed, and the overall current of the electrolysis process is also stronger. SEM images also show a matching phenomenon, in which the higher the temperature, the more FeO is present in smaller particles. These phenomena show that the increase in the electrolysis temperature improved the effect of iron oxide electro deoxidation, and increased the number of activated iron oxide molecules. According to thermodynamic calculation, the theoretical voltage of electro deoxidation of iron oxide will decrease with the increase in temperature, so the higher the temperature, the greater the overpotential of the electrolytic reaction and the stronger the electrolytic driving force. On the other hand, the higher the temperature of molten salt, the better the kinetic conditions of ion migration and the faster the reaction. When the electrolysis temperature reached 950 °C, only FeO and Al2O3 were present in the sample, thereby achieving the electrolysis target.

Author Contributions

Z.J. and C.L. (Chao Luo) designed the experiments; H.Y. wrote the paper; J.M. and C.L. (Chenxiao Li) analyzed the data; H.L. and J.L. guided the experiment. All authors have read and agreed to the published version of the manuscript.

Funding

This research was funded by the National Natural Science Foundation of China, grant number 52004097. This research was funded by Hebei Province High-level Talent Funding Project, grant number B2022005007. This research was funded by Tangshan science and technology innovation team training plan project, grant number 21130207D.

Institutional Review Board Statement

Not applicable for studies not involving humans or animals.

Informed Consent Statement

Not applicable for studies not involving humans.

Data Availability Statement

Not applicable.

Conflicts of Interest

The authors declare no conflict of interest. The funders had no role in the design of the study; in the collection, analysis, or interpretation of data; in the writing of the manuscript; or in the decision to publish the results.

References

  1. Wu, Z.S.; Zhou, G.; Yin, L.C.; Ren, W.; Li, F.; Cheng, H.M. Graphene/metal oxide composite electrode materials for energy storage. Nano Energy 2012, 1, 107–131. [Google Scholar] [CrossRef]
  2. Issa, B.; Obaidat, I.M.; Albiss, B.A.; Haik, Y. Magnetic nanoparticles: Surface effects and properties related to biomedicine applications. Int. J. Mol. Sci. 2013, 14, 21266–21305. [Google Scholar] [CrossRef] [PubMed]
  3. Roeb, M.; Gathmann, N.; Neises, M.; Sattler, C.; Pitz-Paal, R. Thermodynamic analysis of two-step solar water splitting with mixed iron oxides. Int. J. Energy. Res. 2009, 33, 893–902. [Google Scholar] [CrossRef]
  4. Ahmed, A.T.A.; Pawar, S.M.; Inamdar, A.I.; Im, H.; Kim, H. Fabrication of FeO@ CuCo2S4 multifunctional electrode for ultrahigh-capacity supercapacitors and efficient oxygen evolution reaction. Int. J. Energy Res. 2020, 44, 1798–1811. [Google Scholar] [CrossRef]
  5. Wang, H.; Cao, M.; Mao, T.; Fu, J.; Pan, W.; Hao, H.; Liu, H. Fabrication of BaTiO3@ FeO core-shell nanoceramics for dielectric capacitor applications. Scr. Mater. 2021, 196, 113753. [Google Scholar] [CrossRef]
  6. Wang, H.; Cao, M.; Tao, C.; Hao, H.; Yao, Z.; Liu, H. Tuning the microstructure of BaTiO3@ FeO core-shell nanoparticles with low temperatures sintering dense nanocrystalline ceramics for high energy storage capability and stability. J. Alloys Compd. 2021, 864, 158644. [Google Scholar] [CrossRef]
  7. Liu, Z.; Wang, H.; Peng, W.; Wang, Z.; Li, X.; Guo, H.; Shih, K. Synthesis of FeO-nanowires/NiCo2O4-nanopellets core/shell heterostructure as free-standing electrode with enhanced lithium storage properties. Ceram. Int. 2016, 42, 15099–15103. [Google Scholar] [CrossRef]
  8. Harshiny, M.; Samsudeen, N.; Kameswara, R.J.; Matheswaran, M. Biosynthesized FeO nanoparticles coated carbon anode for improving the performance of microbial fuel cell. Int. J. Hydrogen Energy 2017, 42, 26488–26495. [Google Scholar] [CrossRef]
  9. Harshiny, M.; Iswarya, C.N.; Matheswaran, M. Biogenic synthesis of iron nanoparticles using Amaranthus dubius leaf extract as a reducing agent. Powder. Technol. 2015, 286, 744–749. [Google Scholar] [CrossRef]
  10. Laurent, S.; Bridot, J.L.; Elst, L.V.; Muller, R.N. Magnetic iron oxide nanoparticles for biomedical applications. Future. Med. Chem. 2010, 2, 427–449. [Google Scholar] [CrossRef]
  11. Tatarǒlu, A.; Hendi, A.A.; Alorainy, R.H.; Yakuphanǒlu, F. A new aluminum iron oxide Schottky photodiode designed via sol—gel coating method. Chin. Phys. B 2014, 23, 057504. [Google Scholar] [CrossRef]
  12. Wu, W.D.; Liu, S.M.; Hong, H.X.; Chen, S.X. Stability analysis of water-based nanofluids prepared by using supersonic dispersion method. Adv. Mater. Res. 2012, 383, 6174–6180. [Google Scholar] [CrossRef]
  13. Zhang, J.B.; Zhang, G.; Xiao, G.Q. Preparation of hercynite. Bull. Chin. Ceram. Soc. 2007, 26, 4. [Google Scholar]
  14. Botta, P.M.; Aglietti, E.F.; López, J.M.P. Mechanochemical synthesis of hercynite. Mater. Chem. Phys. 2002, 76, 104–109. [Google Scholar] [CrossRef]
  15. Liu, J.X.; He, G.; Lu, N.; Li, J.T. High infrared emission property of FeAl2O4 fabricated by combustion synthesis. J. Ceram. 2017, 38, 179–183. [Google Scholar]
  16. Mu, H.Y.; Li, F.T.; An, X.T.; Liu, R.H.; Li, Y.L.; Qian, X.; Hu, Y.Q. One-step synthesis, electronic structure, and photocatalytic activity of earth-abundant visible-light-driven FeAl2O4. Phys. Chem. Chem. Phys. 2017, 19, 9392–9401. [Google Scholar] [CrossRef]
  17. Kamijo, C. Method of Estimation of Reduction Rate Constant in Ishida-Wen’s Model for FeO-Al2O3 Briquette. ISIJ Inter. 2017, 57, 1797–1803. [Google Scholar] [CrossRef]
  18. Pelton, A.D.; Gabriel, A.; Sangster, J. Liquidus measurements and coupled thermodynamic–phase-diagram analysis of the NaCl–KCl system. J. Chem. Soc. Faraday Trans. 1 Phys. Chem. Condens. Phases. 1985, 81, 1167–1172. [Google Scholar] [CrossRef]
  19. Li, H.; Jia, L.; Liang, J.L.; Yan, H.Y.; Cai, Z.Y.; Reddy, R.G. Study on the direct electrochemical reduction of Fe2O3 in NaCl-CaCl2 melt. Int. J. Electrochem. Sci. 2019, 14, 11267–11278. [Google Scholar] [CrossRef]
  20. Chen, G.Z.; Fray, D.J.; Farthing, T.W. Direct electrochemical reduction of titanium dioxide to titanium in molten calcium chloride. J. Nat. 2000, 407, 361–364. [Google Scholar] [CrossRef]
  21. Li, H.; Zhang, L.; Liang, J.; Reddy, R.G.; Yan, H.; Yin, Y. Electrochemical Behavior of Fe3O4 in NaCl-CaCl2 Melts. Int. J. Chem. React. Eng. 2019, 17, 1–10. [Google Scholar] [CrossRef]
  22. Xu, Y.K.; Yan, H.Y.; Jing, Z.W.; Qi, X.; Li, H.; Liang, J.L. Effect of Fe2O3 on Electro-Deoxidation in Fe2O3-Al2O3-NaCl-KCl System. Crystals 2021, 11, 1026. [Google Scholar] [CrossRef]
Figure 1. EΘT diagram of electrochemical reactions that may occur in the process of electro-deoxidation.
Crystals 12 01130 g001
Figure 2. Schematic diagram of electrolysis process.
Crystals 12 01130 g002
Figure 3. XRD patterns of the products at different electrolysis temperatures.
Crystals 12 01130 g003
Figure 4. The current-time curves during electrolysis.
Crystals 12 01130 g004
Figure 5. The SEM and energy spectrum surface scan images of samples with different electrolysis temperatures, 800 °C in (a), 850 °C in (b), 900 °C in (c) and 950 °C in (d).
Crystals 12 01130 g005
Figure 6. The greater enlargement SEM images of samples with different electrolysis temperatures, 800 °C in (a), 850 °C in (b), 900 °C in (c) and 950 °C in (d).
Crystals 12 01130 g006
Figure 7. Schematic diagram of activated molecules becoming more due to temperature rise.
Crystals 12 01130 g007
Table 1. Absolute value of slope after linear fitting of stage A and B.
TemperatureStage A SlopeStage B Slope
800 °C1.2345.051
850 °C1.6035.722
900 °C4.5527.764
950 °C4.9928.031
Publisher’s Note: MDPI stays neutral with regard to jurisdictional claims in published maps and institutional affiliations.

