Article

Biosynthesis of Ag Nanoparticles Using Caralluma acutangula Extract and Its Catalytic Functionality towards Degradation of Hazardous Dye Pollutants

Department of Chemistry, Faculty of Science, Jazan University, Jazan P.O. Box 82817, Saudi Arabia
*
Author to whom correspondence should be addressed.
Crystals 2022, 12(8), 1069; https://doi.org/10.3390/cryst12081069
Submission received: 1 July 2022 / Revised: 22 July 2022 / Accepted: 25 July 2022 / Published: 30 July 2022

Abstract

:
Nanomaterials, today, are an integral part of our everyday lives, industrial processes and appliances. Biosynthesis, because of its environmental sustainability, is now becoming a hot topic. The biosynthesis of nanomaterials using plant phytochemicals enhances the nanomaterial’s biocompatibility and its compatibility with the environment too. Hence, forthe first time, this study uses Caralluma acutangula (CA) plant extracts to synthesize silver nanoparticles (CA-AgNPs) and characterize them using UV–visible spectroscopy, FTIR, Raman spectroscopy, XRD, TEM, TGA, SEM, EDX, zeta potential, and bandgap analysis. The particle size distributions of CA-AgNPs were observed to fall in the range of 2–6 nm predominantly using TEM images. High crystallinity % was calculated as 86.01 using XRD data. Extracted phytochemicals from CA were characterized and analyzed using GC-MS. The bandgap (Eg) of CA-AgNPs was calculated as 3.01 eV and zeta potential was found to be −16.1 mV. The biosynthesized CA-AgNPs were confirmed for their degradation efficiency of two toxic water pollutant dyes: Congo red, CR (95.24% degradation within 36 min), and methylene blue, MB (96.72% degradation within 32 min), in the presence of NaBH4. Different doses of CA-AgNPs and NaBH4 were checked for their chemical kinetics and rate constant analysis. The chemical kinetics were explored on the basis of integrated rate law model equations and confirmed as pseudo-zero-order reactionsfor CR and MB dyes. The rate constant ‘k’ for CR and MB was calculated as 0.0311 and 0.0431 mol.L−1.min−1, respectively.

1. Introduction

Nanomaterials are more versatile than their bulk counterpart because of their higher specificity and surface activity [1]. Pt, Ag, and Au nanomaterials (NMs) have been widely used in photonics, electronics, and optical devices as catalysts for biosensing and biolabeling agents [2,3,4,5,6,7,8,9]. Despite all the advantages of exploiting this newfound knowledge, environmental concerns have been rising. There are several associated issues surrounding the chemicals used during the synthesis process, through the hazardous reducing agents and organic solvents that are highly reactive and present potential environmental and biological risks [10,11]. In addition, the enormous energy consumption required to maintain high temperature and pressure conditions is associated with physical and chemical synthetic methods [12]. In this direction, environmentally benign NM production methods using plant extracts, bacteria, and fungi have become resourceful [13,14,15,16,17,18,19]. The biosynthetic techniques for the preparation of NMs possess several advantages over chemical and physical synthetic methods, such as simplicity, cost-effectiveness, and biocompatibility, especially when it comes to biomedical and pharmaceutical applications. The use of plant extracts as biogenic agents potentially eliminates the elaborate processes of cell culture and cell maintenance required for the biogenic synthesis of metal nanoparticles using microorganisms.
Silver nanoparticles (AgNPs) have received increasing attention due to the surface plasmon resonance (strong absorption in the visible region), which can be easily monitored using a UV–visible spectrophotometer. The applications of AgNPs in the field of medicine, optoelectronics, optics, catalysis and sensors are well accomplished [20,21,22,23]. AgNPs have been synthesized using leaf extracts of Terminalia arjuna [24], Euphorbia heterophylla [25], seed extracts of Trigonella foenum–graceum [26,27], fruit extracts of S. acuminata [28], honey [29], fruit extracts of Terminalia chebula [30], aqueous extracts of Caulerpa racemosa [31], seed extracts of Buniumpersicum [32], yeast extract [33], fruit extracts of Gmelina Arborea [34], aqueous extract of Allium cepa [35] and Kashayam, Guggulitiktham [36]. The southwest of Saudi Arabia is rich in wild plants, and these comprise about 70% of the total Saudi Arabian flora. One of the highly represented families in this country is Apocynaceae. Many species of this plant family have been used to treat different diseases by traditional medical practitioners of Saudi Arabia [37,38]. The genus Caralluma belongs to the family Apocynaceae (sub-family Asclepiadoideae), comprising around 200 genera and 2500 species. In Saudi Arabia, this genus is represented by 14 species found in the west and southwest regions [39]. C. acutangula (CA) has been proven effective on breast, hepatocellular carcinoma, and prostate cancer [38]. In addition, CA is particularly used for weight gain management. This species is rich in pregnane glycosides which are molecules acknowledged for anticancer, antiobesity, appetite-suppressant, and antitrypanosomal activities [40,41]. In the following work, we prepared CA-AgNPs using CAplant extracts by a green synthesis procedure for the first time. The CA-AgNPs were characterized morphologically and chemically using UV-Vis, FTIR, Raman spectroscopy, TEM, TGA, SEM, EDX, zeta potential, and bandgap analysis. The synthesized CA-AgNPs were used for the catalytic degradation of two environmentally hazardous dyes: Congo red (CR) and methylene blue (MB). The degradation efficiencies were calculated as 95.24% and 96.72% within 36 and 32 min for CR and MB, respectively. According to the linear law of chemical kinetics, CR and MB degradation were observed with pseudo-zero-order chemical kinetics with reaction rate constants of 0.0311 and 0.0431 mol.L−1.min−1, respectively.

2. Materials and Methods

2.1. Materials

Silver nitrate (AgNO3), Congo red dye (Dye content ∼40%) were purchased from Sigma-Aldrich (Baden-Württemberg, Germany) and directly used without purification. Methanol solvent of 99.9% purity was purchased from Merck KGaA, Darmstadt, Germany. Methylene blue (microscopic grade) was bought from S.D. Fine Chem. limited, Mumbai, India. Deionized water from a Milli-Q system was used for all the experiments. CA leaves were obtained from a healthy plant, growing in an open forest in the northern region of Jazan, Saudi Arabia.

2.2. Preparation of CAExtract

Naturally grown, healthy CA leaves were washed thoroughly under running water followed by washing with double-distilled water. Leaves were cut into small pieces and washed again with distilled water. Washed leaves were sun-dried for 15 days. The dried pieces were crushed into a fine powder by grinding (Blender, Model 24CB10C, Waring Commercial, Stamford, CT, USA). Next, 25 g of the ground CA leaves were added into 600 mL double-distilled water and heated up to 90 °C for 4 h. An orange-colored plant extract was obtained, then filtered through Whatman filter paper to obtain a transparent aqueous solution. This will be referred to as CA extract (CAE). CAE was used for green synthesis and stabilization of AgNPs.

2.3. GC-MS Analysis of CAExtract

Phytochemicals in the CA extracts were analyzed using GC-MS. Aqueous extract of CA was dried using a solvent evaporator (Hei-VAP, Hei-dolph, Schwabach, Germany) and heated for 1.0 h at 80 °C. After drying, the dried samples were dissolved in methanol and applied for GC-MS analysis for phytochemical characterization. The extract was analyzed by a gas chromatography–mass spectrometry (GC-MS) instrument (model; QP2010 Ultra, Shimadzu Corporation, Kyoto, Japan). The separation was achieved on a Rtx-5MS capillary column (30 m length × 0.25 mm dia.) coated with a 0.25 μm film thickness stationary phase (Restek Corporation, Bellefonte, PA, USA). Helium was employed as the carrier gas at a constant linear velocity of 36.3 cm/s. A sample volume of 1.0 μL was injected using an AOC-20i+s autoinjector. The injection port was set at 290 °C. The GC oven temperature was programmed as follows: 1 min., at 50 °C, heated at 5 °C/min to 300 °C and held for 10 min. The ion source temperature in the MS was set at 230 °C and the interface at 280 °C. Total ion chromatogram (TIC) was created for m/z range 50–500. The GC peaks were identified by comparing their mass spectra using the library of the National Institute of Standards and Technology (Version 11, NIST, Gaithersburg, MD, USA). The relative amount of each component was calculated by comparing its peak area to the total area of peaks in the chromatogram.

2.4. Preparation of CA-AgNPs

Ag nanoparticle biosynthesis and stabilization were initiated using silver nitrate, 2.0 mM, in CA extract in a 250 mL flask. CA extract solution was heated at 80 °C, silver nitrate solution was added, and the reaction was carried out in the dark. Within a few minutes, the reaction mixture changed from orange to red and, finally, brown, indicating the formation and stabilization of Ag nanoparticles. The reaction was carried out for 1 h, and the resultant reaction mixture solution was centrifuged at 13,000 rpm (Model No. 5452, Eppendorf AG, Hamburg, Germany). The CA-AgNPs were finally washed twice with water and methanol.

2.5. Characterization of CA-AgNPs

The biosynthesized CA-AgNPs were characterized using UV-Vis spectrophotometer (SCO TECH, SPUV-26, Dingelstadt, Germany) with 1.0 cm quartz cuvettes in the range from 200 to 800 nm. CA-AgNPs crystallinity and structure were examined by Shimadzu XRD, LabX-6000 XRD X-ray Diffractometer, Kyoto, Japan, with a CuKα (λ = 1.54056 Å), working on 40/30 kV/Milli Ampere, at 2°/m amid 20°–70° angles. The CA-AgNPs’ surface morphology was analyzed using high-resolution scanning electron microscopy (HRSEM), energy-dispersive X-ray spectrometry (EDX), and atomic mapping by SEM Quanta FEG 250 with field emission gun, FEI− Netherlands. CA-AgNP suspension (10.0 μL) was placed on a carbon conductive adhesive tape. Samples were dried at 80 °C under vacuum overnight and subjected to HRSEM and EDX. The CA-AgNPs’ stability and thermal stability were evaluated by thermogravimetric analysis (TGA), using a DTG-60H simultaneous DTA-TG Apparatus, Shimadzu, Kyoto, Japan. The analysis was performed in a nitrogen environment at a heating rate of 5.0 °C min−1. The CA-AgNPs’ shape and surface morphology were analyzed using transmission electron microscope (TEM), JEOL HRTEM, JEM-2100F (Tokyo, Japan) instrument at 120 kV. Nanoparticle suspension was prepared in methanol. A 1.0 μL sample was transferred onto a Cu grid and heated in a vacuum oven at 80 °C overnight to vaporize the solvent and further characterized by the TEM instrument. CA-AgNPs surface charge was measured by zeta sizer nano instrument, Nano ZS90, ZEN3690, Malvern Instruments Ltd., Worcestershire, UK. CA aqueous extract was dried using a solvent evaporator (Hei-VAP, Heidolph, Germany) and the functional groups in the CA extract were determined using FTIR set at 4000–450 cm−1, using a Prestige-21, Shimadzu, Kyoto, Japan IR spectrometer. For the bandgap analysis of CA-AgNPs, reflectance spectra were monitored at UV-3600 diffused reflectance spectrometer (DRS), Shimadzu, Kyoto, Japan. The presence of various phytochemicals on CA-AgNPs and their respective vibrational frequencies were recorded by a FT-Raman profile using 532 nm excitation XDR FT-RAMAN spectrometer, Thermo Fisher Scientific, Waltham, Massachusetts, USA (5.1 cm−1 to 8.3 cm−1 resolution, run at power ~6 mW).

2.6. Catalytic Degradation of MB and CR Dyes

The biosynthesized CA-AgNPs were evaluated for their functionality byaffinity and catalytic probes in the presence of NaBH4 against the water-based carcinogenic pollutant dyes: MB and CR. Biosynthesized CA-AgNPs were ultra-sonicated for 30 min and used for evaluating the anionic- and cationic-dye-degradation experiments. Table 1 shows that 1.0 mM dye was taken in a UV cuvette with NaBH4 (5.0 mM) and different doses of AgNPs at a constant 3.0 mL volume.
Dye degradation analysis was carried out in a 4.0 mL quartz cuvette. The reduction reaction was monitored and recorded based on the changes in the absorption spectra at 2.0 min time intervals. The % of degradation of the dyes was estimated through the following equation:
Degradation   % = C 0     C t C 0 × 100  
where C0 is the initial absorbance of the dye, Ct is the absorbance of the dye at time t. The whole reaction of degradation was conducted at average room temperature. Figure 1 gives the schematic workflow employed in this study.

3. Results and Discussion

The appearance of the reddish-brown color of the reaction mixture signifies the formation of colloidal CA-AgNPs. The color change is due to surface plasmon resonance (SPR) excitation and it was evaluated using UV-Vis spectrophotometry. The reaction progress for the formation of CA-AgNPs was checked at different time intervals such as 0, 10, 20, 30, 40, 50 and 60 min using UV-Vis spectroscopy, as shown in Figure 2a. The UV-Vis spectrum of the CA aqueous extract displays a sharp absorptionpeak at 270 nm and 330 nm due to the presence of various phytochemicals such as flavonoids and phenolic acids. Flavonoids exhibit UV absorption maxima at 270–280 nm and 310–350 nm, while phenolic acids show maxima at 270–280 nm and 305–330 nm [42]. The absorption bands at 270 nm and 330 nm in Figure 2a for the CA extract could be attributed to the presence of flavonoids and phenolic acids. In addition, the GC-MS data revealed the domination of benzoic acid in the CA extract (27.8%). Benzoic acid has a maximum absorption band around 269 to 274 nm [43]. It could have also contributed to the UV band shown at 270 nm in Figure 2a.
AgNO3 aqueous solution alone exhibitsthe absorption peak at 300 nm due to the presence of Ag+. Figure 2a (I and II) reflects the formation of CA-AgNPs with the CA aqueous extract;the peaks at 330 nm and 300 nm due to the CA extract and AgNO3 disappear, and the new absorption peaks at 435 and 260 nm were appeared.A marginal peak shift at 260 nm was observed compared with the CA-aqueous-extract UV-Vis spectrum. CA-AgNPs are known to exhibit a UV–Visible absorption maximum in the range of 400–500 nm because of surface plasmon resonance (SPR) [44]. Figure 2a gives the results of the UV-Vis absorbance study conducted tocharacterize the CA-AgNPs; the peak maximum at 435 nm, beginning from 400 nm to 500 nm, conforms to the SPR of CA-AgNPs. As the biosynthesis of the CA-AgNPs’ reaction progressed, the SPR appeared within 20 min at 435 nm. Nevertheless, after the 60 min reaction progressed, the same high absorption peak (at 435 nm) was observed, indicating the successful biosynthesis of the CA-AgNPs’ reaction ending within 60 min, as shown in Figure 2a (II). The Figure 2a inset figure portrays the color of the AgNO3 solution (colorless), CA extract solution (yellow greenish)and, finally, the prepared CA-AgNP suspension (sharp black). The widening of the peak indicates that the particles were polydispersed. The optical studies revealed that the CA-AgNPsexhibit a direct bandgap of 3.01 eV (Figure 2b) [45]. As a result of their large band, CA-AgNPs embedded in ceramics and glass could be used as optoelectronic devices. Interestingly, the CA-AgNPsbelonged to this high-potential large-bandgap-materials class.

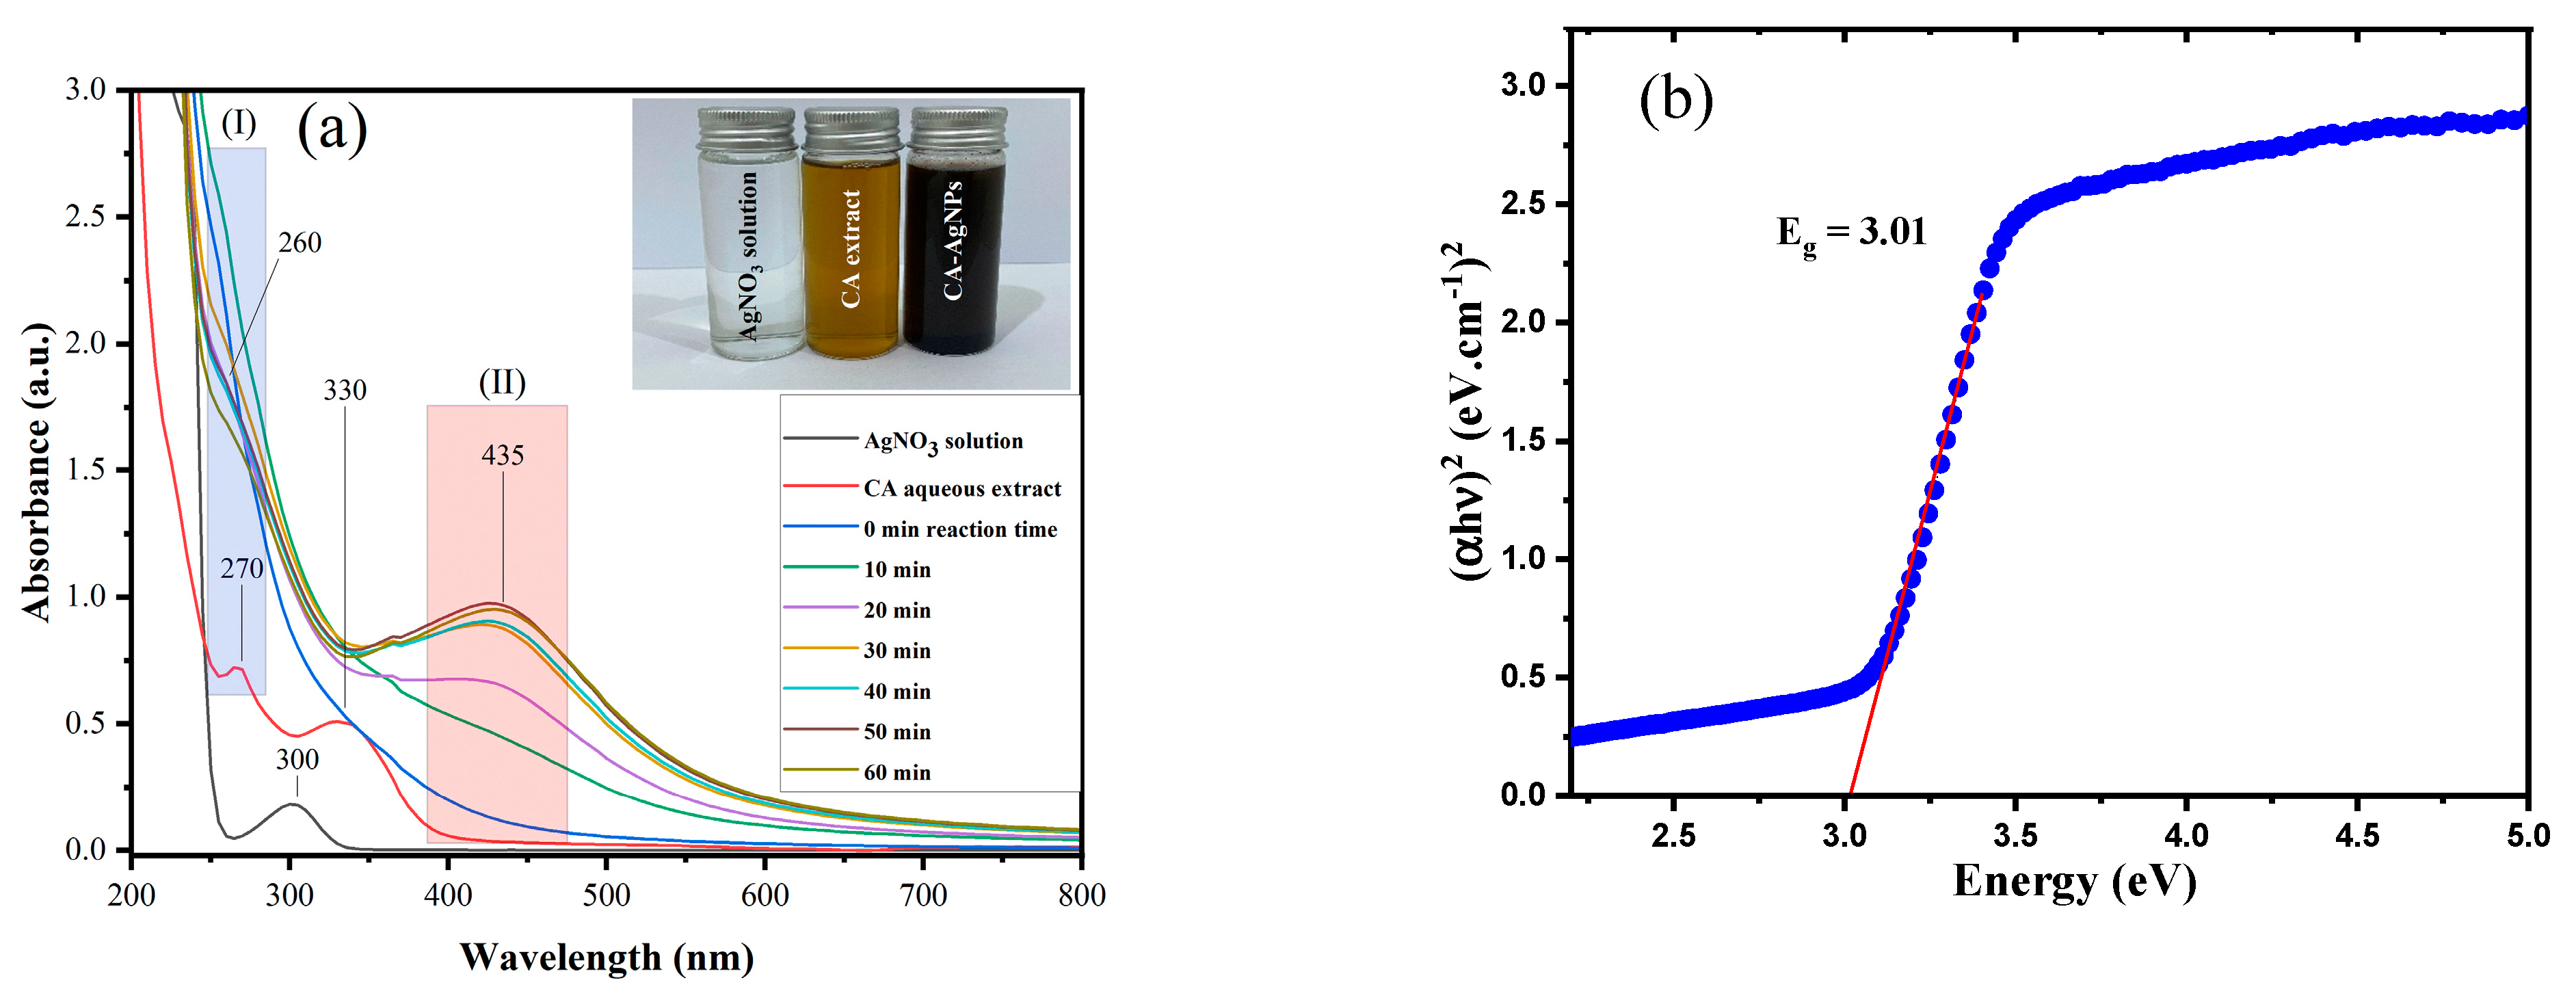
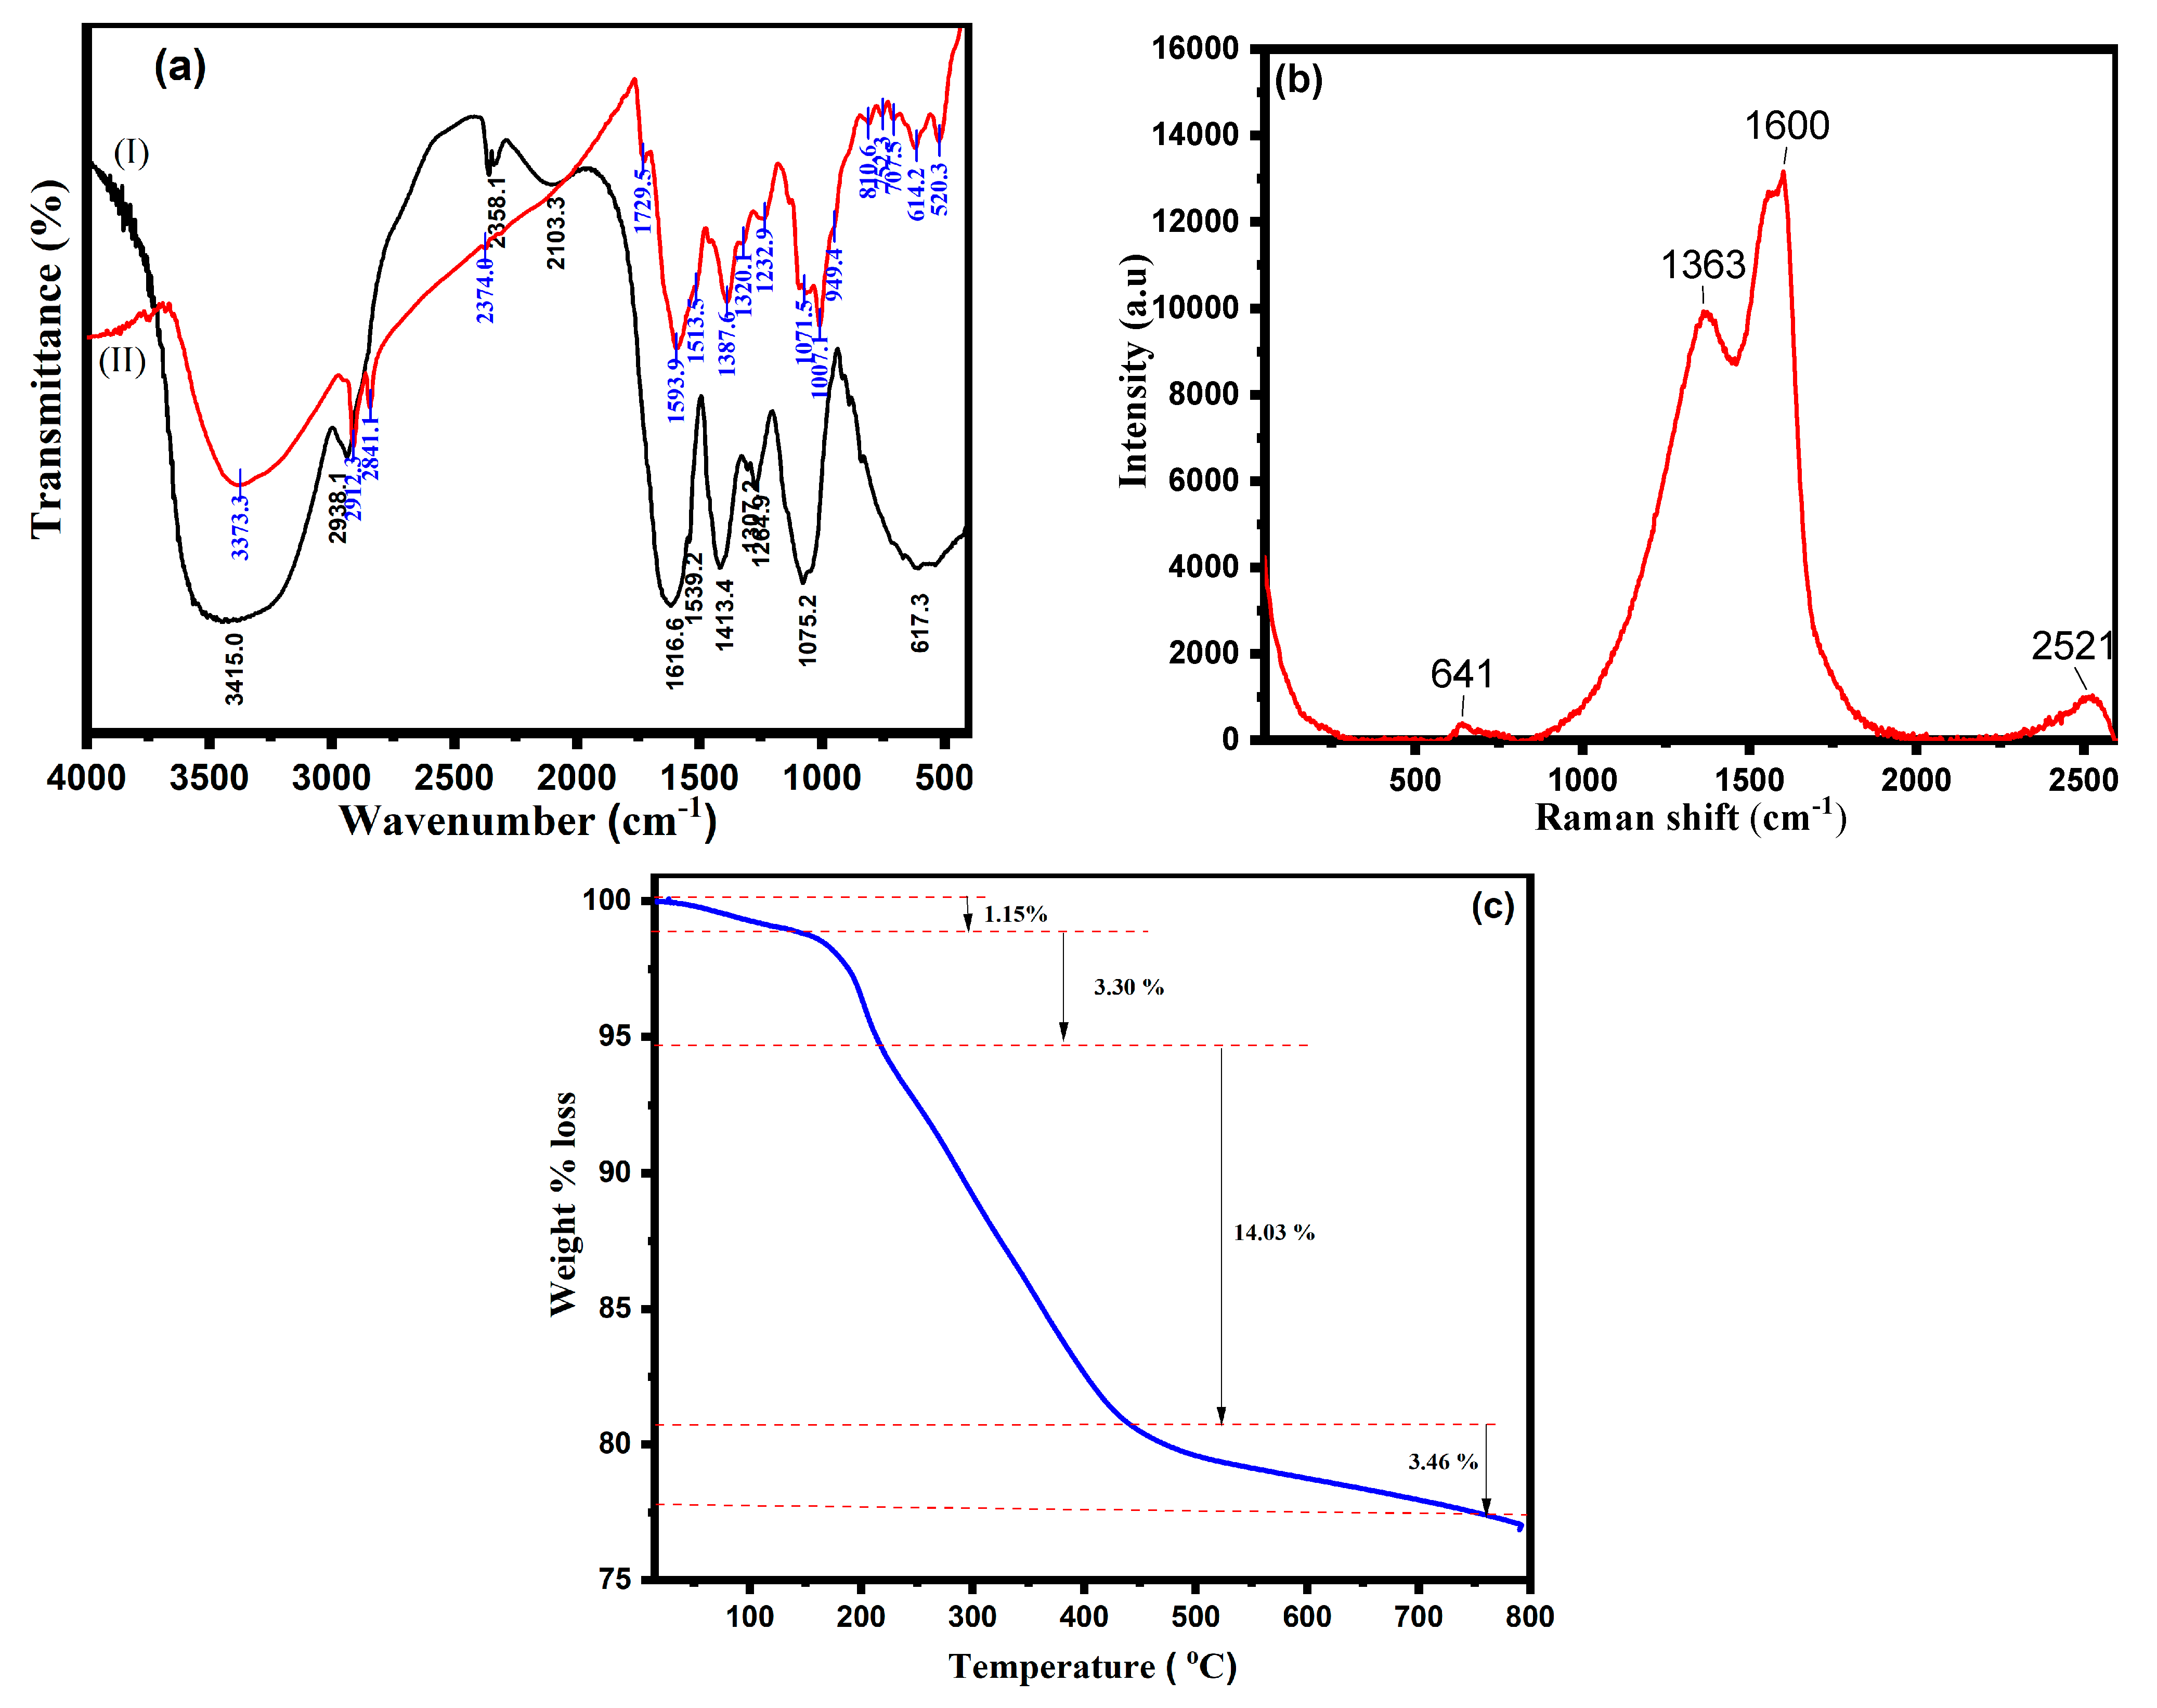
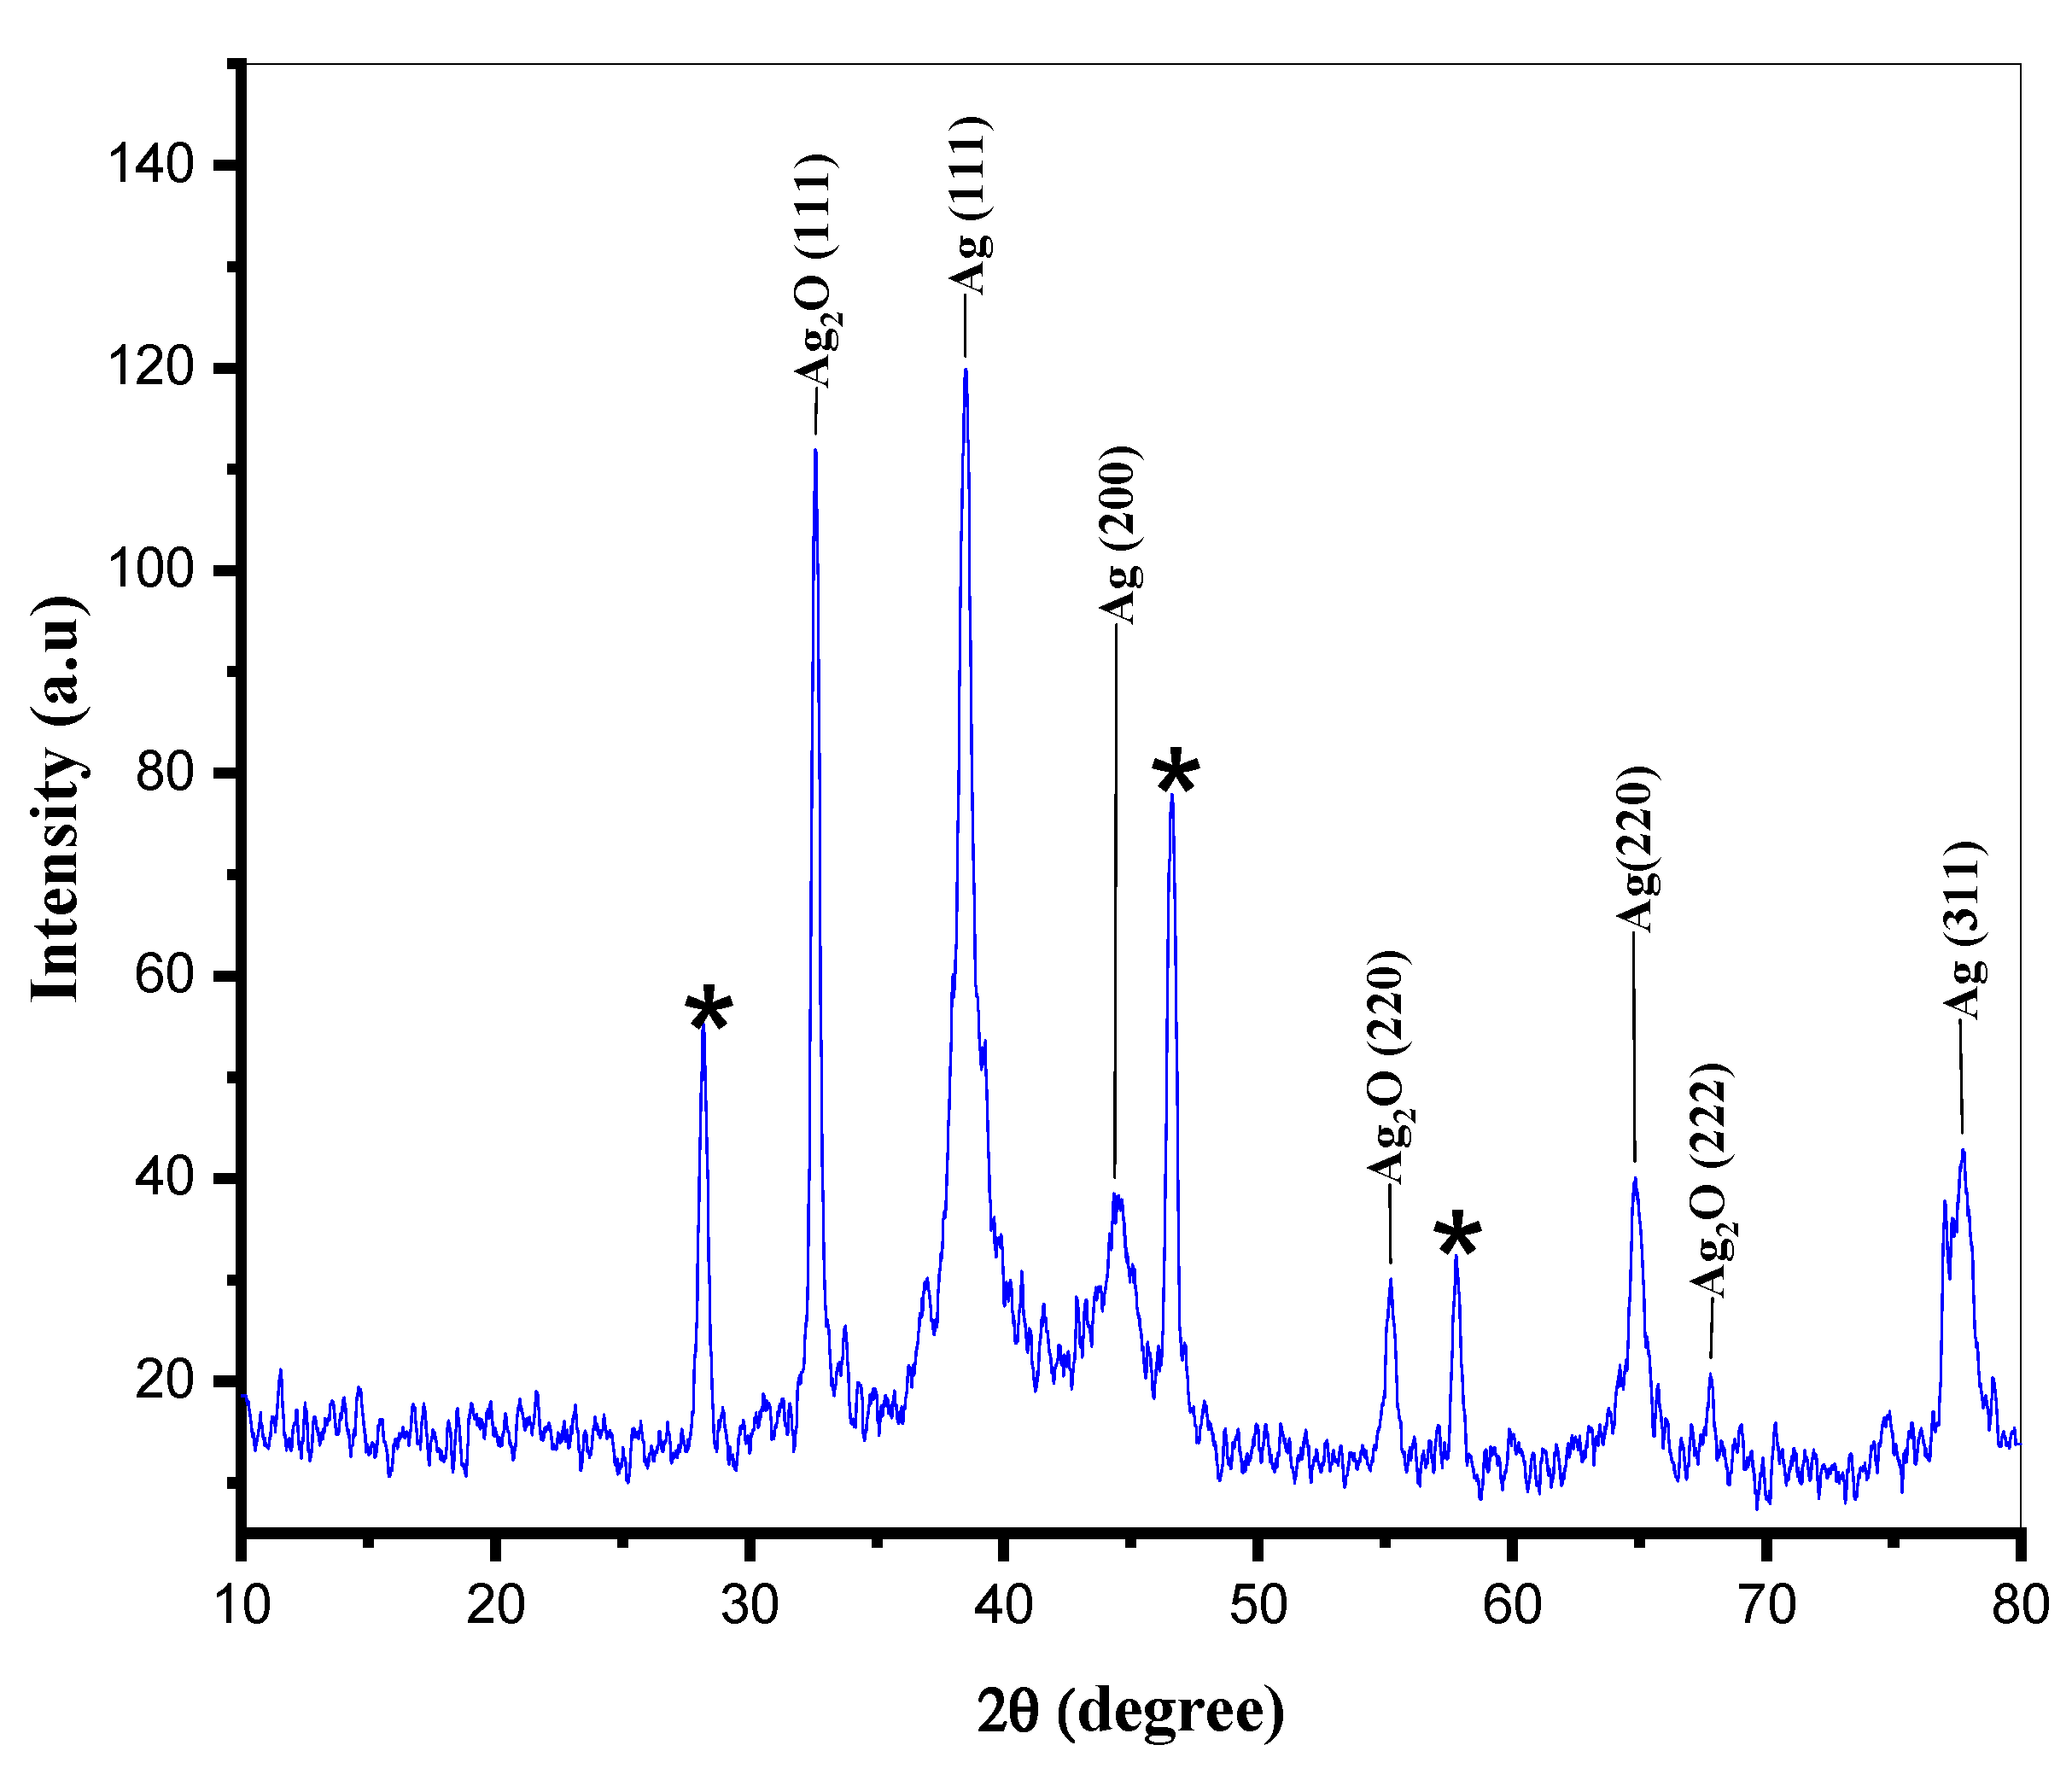
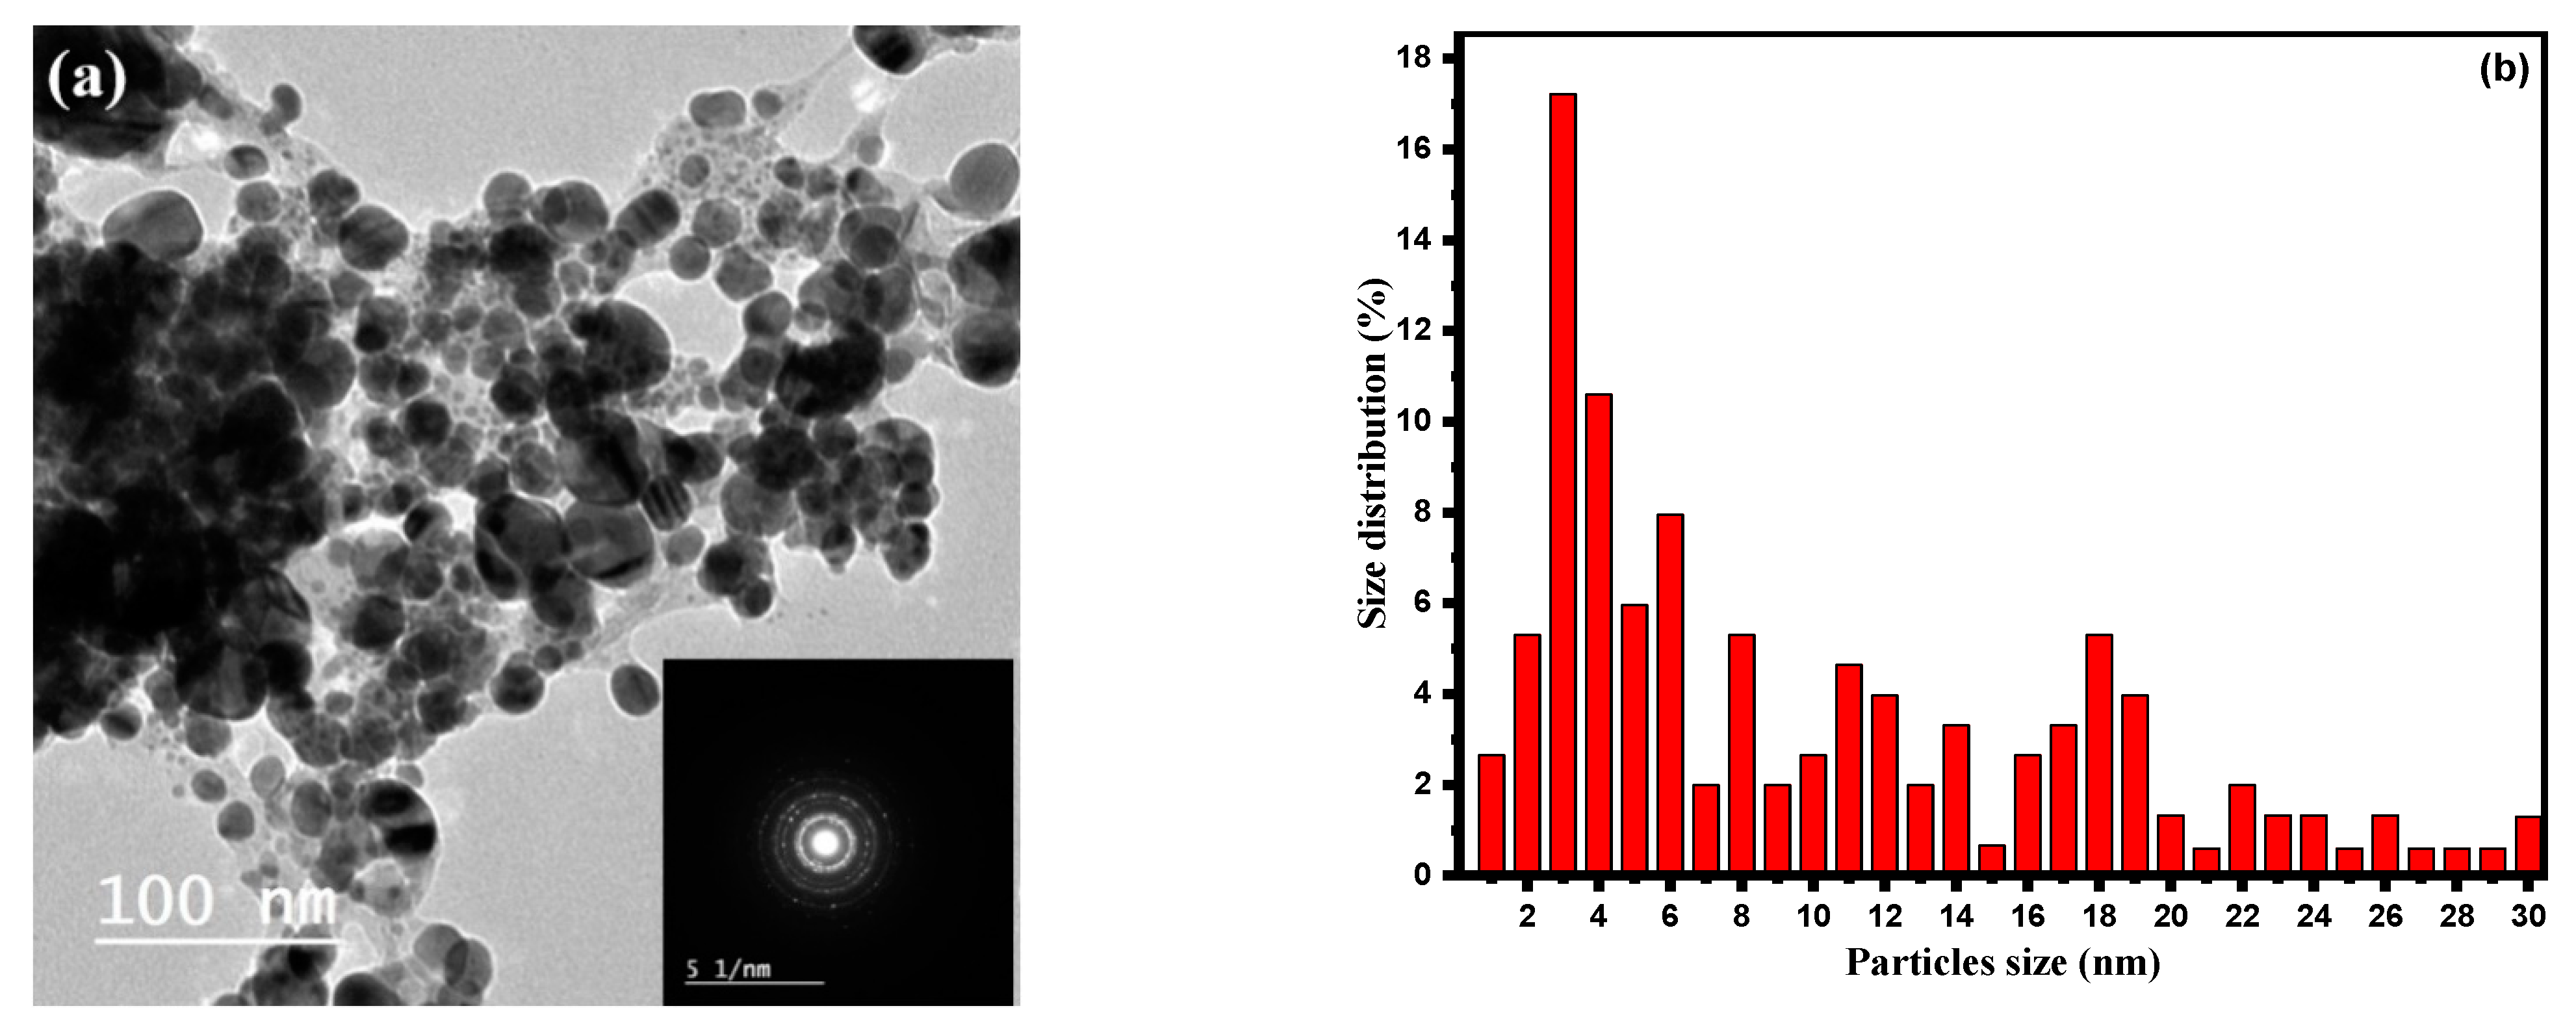
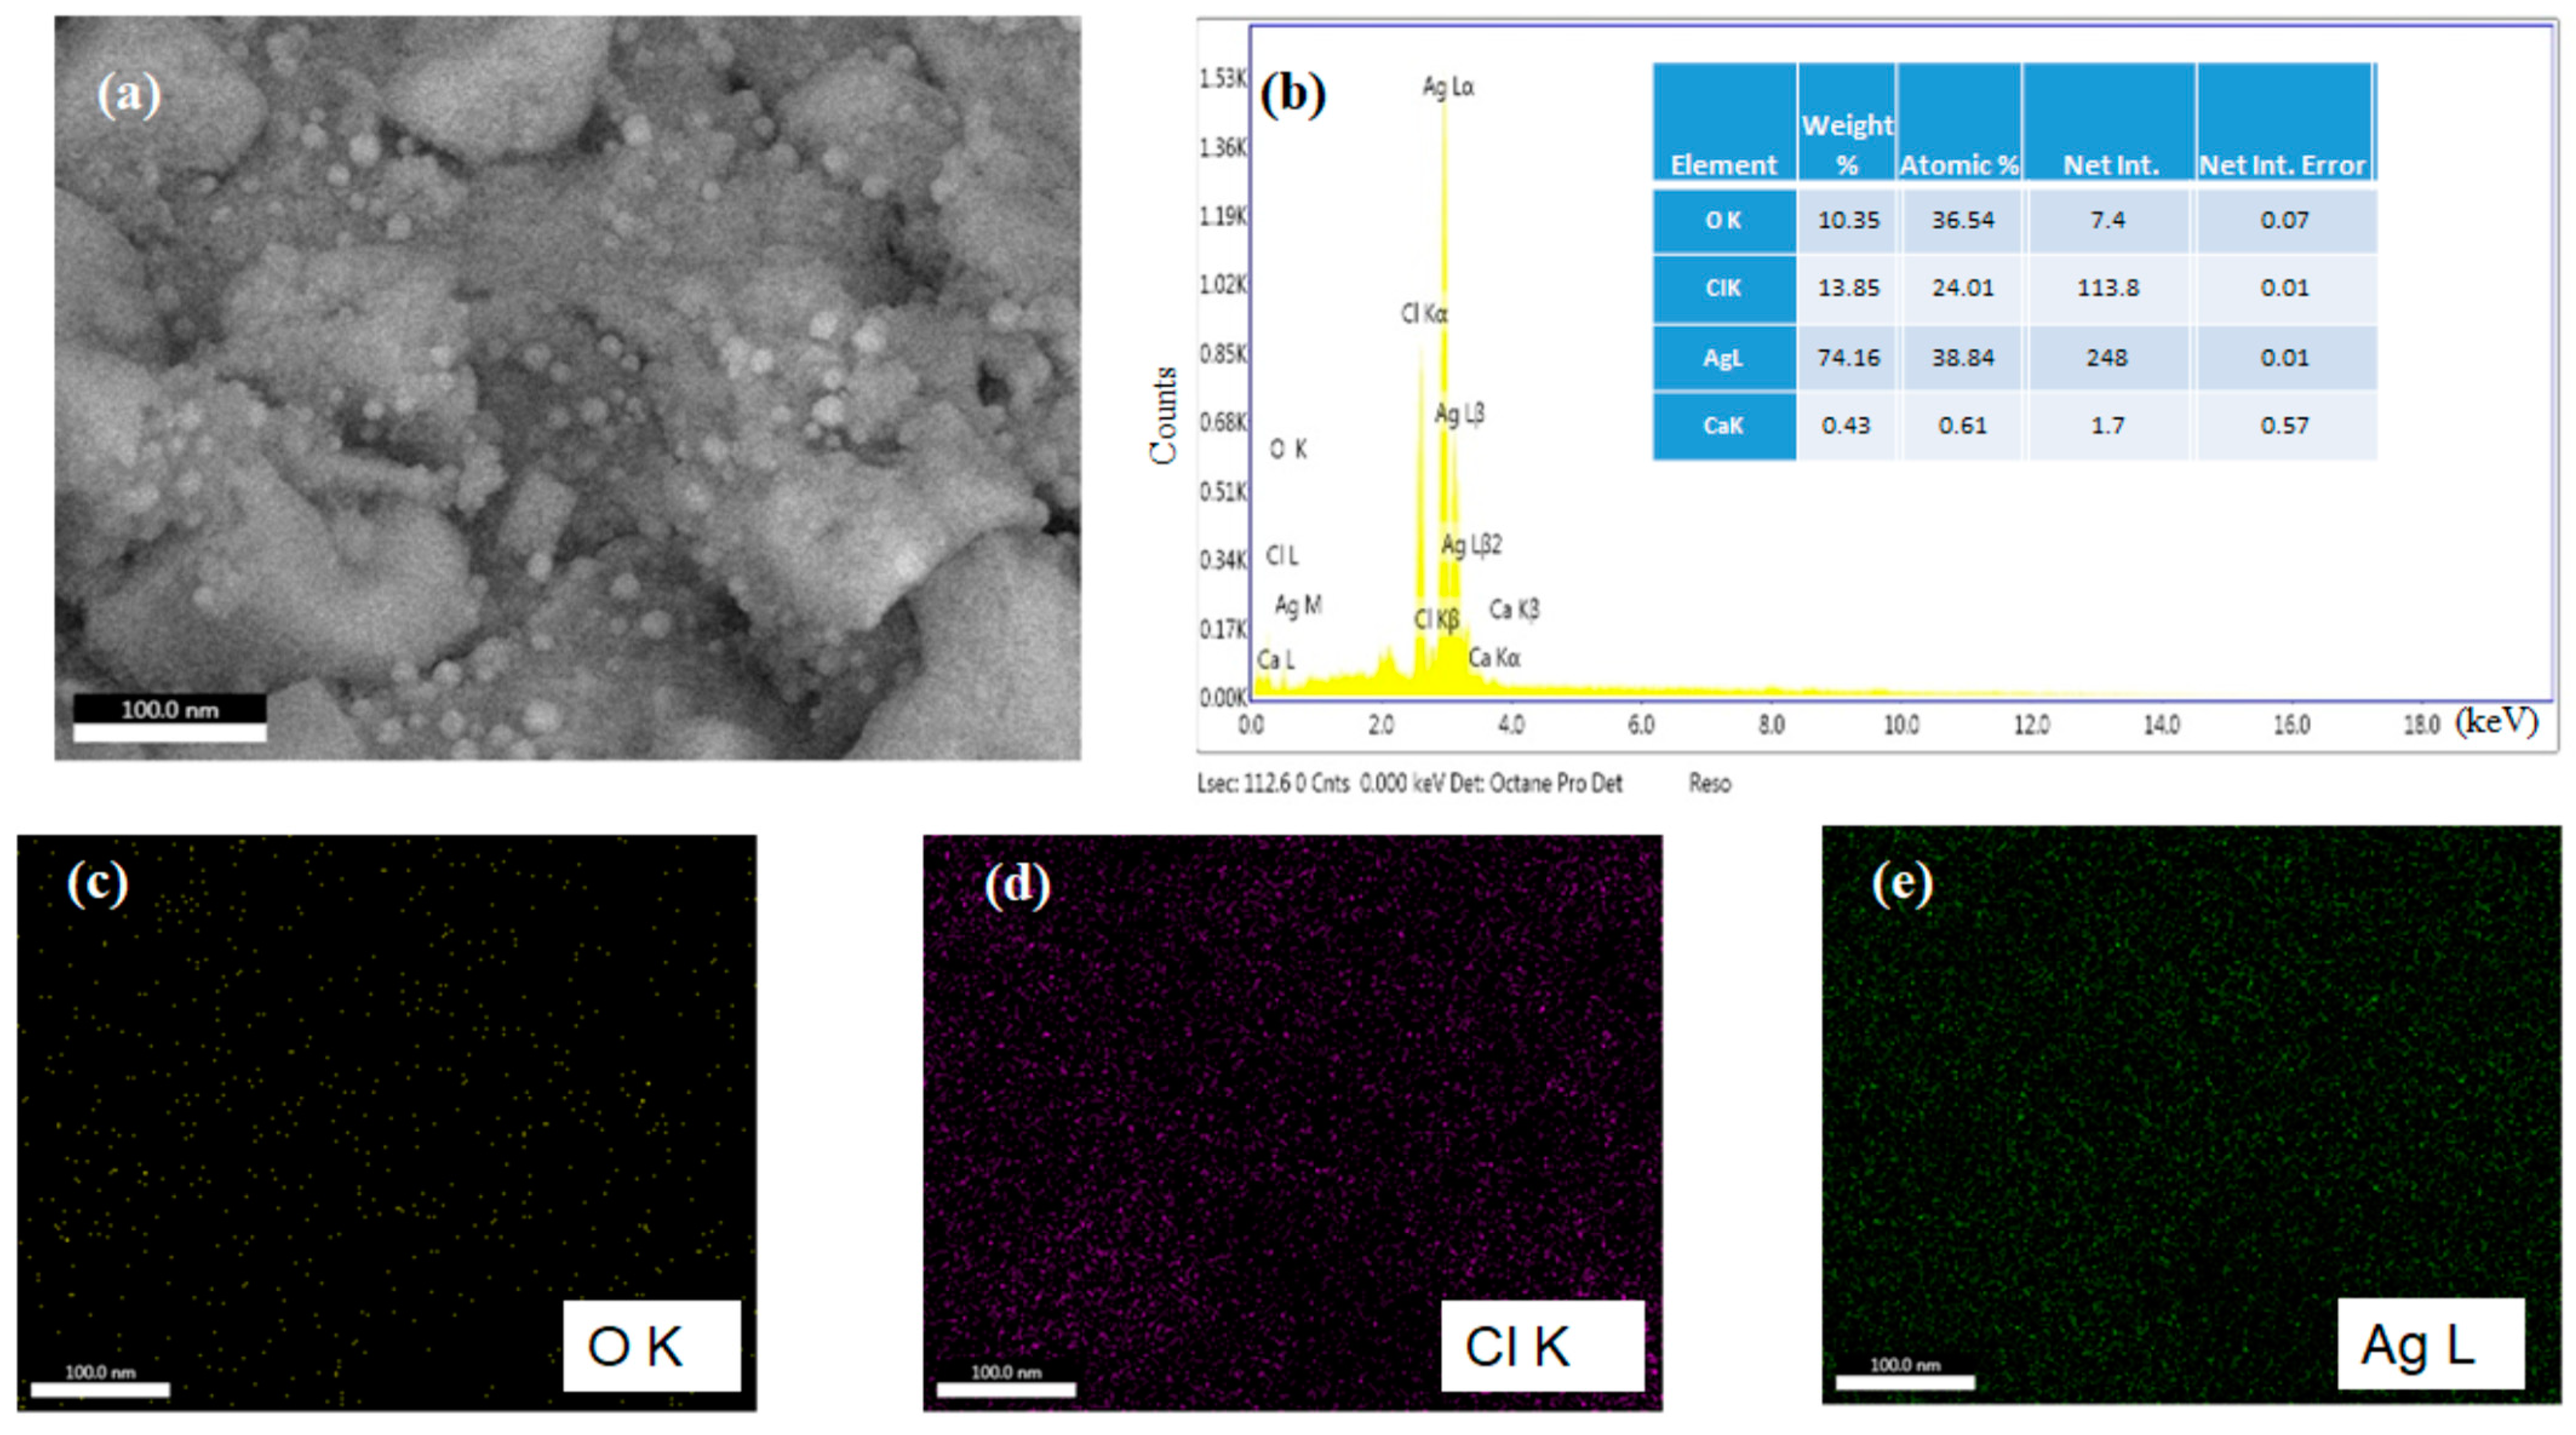
3.1. Phytochemical Analysis by GC-MS and CA-AgNPs Charecterization

Supplementary Figure S1 gives the GC-MS chromatogram of the CA extract that was used for the biosynthesis of CA-AgNPs. It indicates 25 predominant phytochemical peaks at different retention times. CA has not been well defined and characterized yet, while Sireesha et al. [46] have characterized other species belonging to the genus Caralluma. They have mentioned that the characterization of CA needs to be addressed in the future. Our report is the first detailed characterization of this species (Supplementary Table S1). Caralluma is one of the prominent genera in the Apocynaceae family. Most of the compounds identified by Sireesha et al., belonging to various species of Caralluma, showed predominant glycosides and steroids [46]. In terms of relative peak area abundance, the following phytochemicals dominated the GC-MS chromatogram: glycerin (8.22%), benzoic acid (27.80%), 1,3,5-pentanetriol, 3-methyl (2.26%), glycerol trimethyl ether (2.88%), 3,5,-dimethoxyacetophenone (3.20%), tridecanoic acid, 4,8,12-trimethyl-,methyl ester (10.16%), (2S,13S)-12,13-dihydroxy-1,4,7,10-tetraoxacyclotetradecane (6.49%), 6-O-Methyl-2,4-methylene-.beta.-sedoheptitol (2.33%), Androst-5,15-dien-3-ol acetate (1.13%),D-arabinose-hexopyranoside, methyl 2,6-dideoxy-4-O-(6-dexoy-3-O-methyl-β-D-allyopyranosyl)-3-O-methyl (11.77%), 2-Methyl-2-hexenoic acid (1.23%), 11-α-Hydroxy-7-oxodiosgenin (1.95%), 2H-Pyran, 6-heptyltetrahydro-2,2-dimethoxy (3.65%) and K-Strophanthin (3.78%). The CA-AgNPsweremost likely functionalized by the glycosides/steroids from the CA extract. However, more conclusive studies are needed to confirm thecapping/surface functionalization of these phytochemicals. Previous studies have shown that benzoic acid derivatives reduce and stabilize agents during CA-AgNPs’ synthesis [47,48,49].
The FTIR spectrum analysis in Figure 3a was executed to characterize the possible biomolecules present in the leaf extract based on their functional groups. In the FTIR spectrum, the low band at 615 cm−1 corresponds to C-Cl stretching. The band at 1686 cm−1 was observed due to the C=O stretching and at the band at 1283 cm−1 was due to C-O stretching in the CA extract alone. This band stretching is indicative of the presence of benzoic acid [50,51,52], while these bands in the CA-AgNPs shifted to 1585 cm−1 and 1269 cm−1. The peak shift indicates structural changes at the molecular level. The band at 1626 cm−1 may correspond to the N-H stretching of the conjugated amine. The strong and broadband at 3358 cm−1 corresponds to the O-H stretching of hydrogen intramolecular-bonded alcohols and phenols; this aligns with what has been reported by previous authors [50,51,52]. These FTIR finding data were also correlated with GC-MS results where the benzoic-acid peak area represented 27.80% of the total peak areas in the chromatogram [43], as shown in Supplementary Table S1 and Supplementary Figure S1. The FTIR spectrum explores the presence of benzoic acid in the CA extract and of CA-AgNPs’ functional group stretching and vibrational bands in Figure 3a. The GC-MS study indicates benzoic acid as the major compound in the CA extract, and it is possible that benzoic acid could have played the lead role in the reduction/stabilization of CA-AgNPs. The FTIR spectra of CA-AgNPs in Figure 3a exhibited prominent peaks at 2949, 1585, and 1381 cm−1 [50]. The band at 1381 is for C–C and C–N stretching; the presence of the sharp peak at 2916 cm−1 was assigned to the C–H and C– H (methoxy compounds) stretching vibration, respectively [50]. Previous authors have reported these peaks for biosynthesized CA-AgNPs [50,51,52]. Hydroxyl and carboxyl ions in the biological phytochemicals develop a protective layer on the CA-AgNPs’ surface, enhancing the stability of the nanoparticles, and organic moieties increase dye enrichment on the nanoparticle surface.
Raman spectroscopic analysis (Figure 3b) indicated asymmetric, strong COO stretch band at 1450–1360 cm−1 [53]. Furthermore, symmetric stretching vibrations of C=O groups could be identified at 1658 cm−1. These have been observed in the case of earlier reports dealing with AgNPs [54].
The thermal behavior of the CA-AgNPs was examined by TGA (Figure 3c). The first step in the decomposition process (weight loss of 1.15%), that occurred between 100 and 150 °C, could be attributed to the evaporation of moisture adsorbed on the surface of the CA-AgNPs. A second degradation, with an associated weight loss of about 3.30%, was observed between 150 and 230 °C, which may have happened due to volatile molecules or the rearrangement of biomolecules. The third degradation, a weight loss of 14.03% occurring at 250 to 440 °C, wasa consequence ofthe desorption of the organic biomolecules present at the surface of the nanoparticles. This weight loss might be attributed to the decomposition of phenolic acids, flavonoids, and carbohydrates, which originate from the plant extract and are responsible for stabilizing CA-AgNPs [55]. Above 440 °C, a steady weight loss accounting for about 3.46% was recorded, which could probably be assigned to the thermal degradation of resistant aromatic compounds present on the surface of the CA-AgNPs [56]. The TGA data indicate that the bioactive organic compounds from the CA extract are attached to the surface of the obtained nanoparticles [57,58,59]. There is a high probability for the functionalization/capping of the synthesized CA-AgNPs, with the phytochemicals in the CA extractbeing attributed to various % losses during TGA.
The CA-AgNPs crystalline nature was determined using the XRD crystallography technique. The CA-AgNPs powder XRD results in Figure 4 gives diffraction peaks at 2θ angle 38.38°, 44.44°, 64.76°, and 77.64°, that can be assigned to the Miller indices planes (111), (200), (220), and (311); theserefer to the face-centered cubic crystalline structure of silver nanoparticles [60]. XRD Bragg’s diffraction peaks of CA-AgNPs were matched with the data base of the Joint Committee on Powder Diffraction Standard for Ag (JCPDS card No. 00-004-0783). XRD diffraction broad peaks reflect smaller-sized and highly stabilized CA-AgNPs. Some recent published articles on the green synthesis of Ag nanoparticles reported unassigned XRD diffraction peaks, which they speculate to be owing to biomolecule crystallization on the AgNPs surface [24,58,61]. In our case also, as shown in Figure 4, the XRD pattern represents some new diffraction Bragg’s peaks at 2θ 28.14°, 32.62°, 40.04°, 46.66°, 54.89°, 57.76° and 67.80°. The Bragg’s diffraction peaks are identical with those at JCPDS card No. 01-076-1489 for Ag2O. Spectral peaks at 32.62°, 54.89°, and 67.78° refer to the Miller indices plane (111), (200) and (311) for Ag2O material formation during the biosynthesis of CA-AgNPs [61,62]. Usually in synthesis procedures involving aqueous medium, it is reported that the possibility of silver oxide nanoparticles being formed is high, since silver reacts with water in the solution. In a nascent condition, the nanoparticles are highly reactive due to their high surface to volume ratio [62] and that is the reason we see Ag2O peaks along with Ag peaks. The three unassigned peaks (*) could be due to the crystallization of biomolecules on the surface of the CA-AgNPs [24,63]. The high and broad peaks in the XRD analysis indicate the predominating silver component in the reaction mixture and are also indicative of the crystallinity of the CA-AgNPs. The % crystallinity of the biosynthesized CA-AgNPs was calculated using the following equation [64]:
%   Crystallinity = Area   under   the   crystalline   peaks Area   under   all   peaks × 100
Using the XRD data, the crystalline peaks’ area was measured as 709.12 and the total area of all peaks was observed as 824.39. After applying equation number 2, a crystalline structure was obtained at 86.01% which refers to the high-degree crystalline nature of CA-AgNPs.
The morphology of the CA-AgNPs was analyzed using SEM and TEM. Figure 5a displays the TEM image of the CA-AgNPs, which are spherical. The size distribution histogram plotted based on the TEM images shows that the CA-AgNPs lie in the size domains ranging from 1–30 nm, with the predominant sizes within 2 nm to 6 nm (Figure 5b).
SEM studies were also conducted as shown in Figure 6a which reflect the CA-AgNPs’ surface morphology as spherical. EDX based on the SEM micrographs determinedthe chemical identity of the synthesized AgNPs which consisted predominantly of Ag, as shown in Figure 6b. In the EDX, the Ag weight % was calculated and observed as 74.16% while the O and Cl weight % was observed as 10.35% and 13.85%, respectively. The elemental mapping of SEM micrographs was applied to support the chemical identity of the synthesized CA-AgNPs, which are predominantly composed of Ag, as shown by green-colored dots in Figure 6d. In the case of oxygen (O), it is observed with a low intensity (yellow dots), while in the case of chlorine (Cl), it is observed with a high intensity (purple dots). The presence of a high intensity of chlorine is due to the plant components present in the plant extract, which, no doubt, will be functionalized on the synthesized CA-AgNPs.
In Supplementary Figure S4, the negative zeta potential was observed at −16.1 mV, and zeta deviation was 4.35 mV. A high negative value of zeta potential causes repulsion among nanoparticles to prevent agglomeration [65].

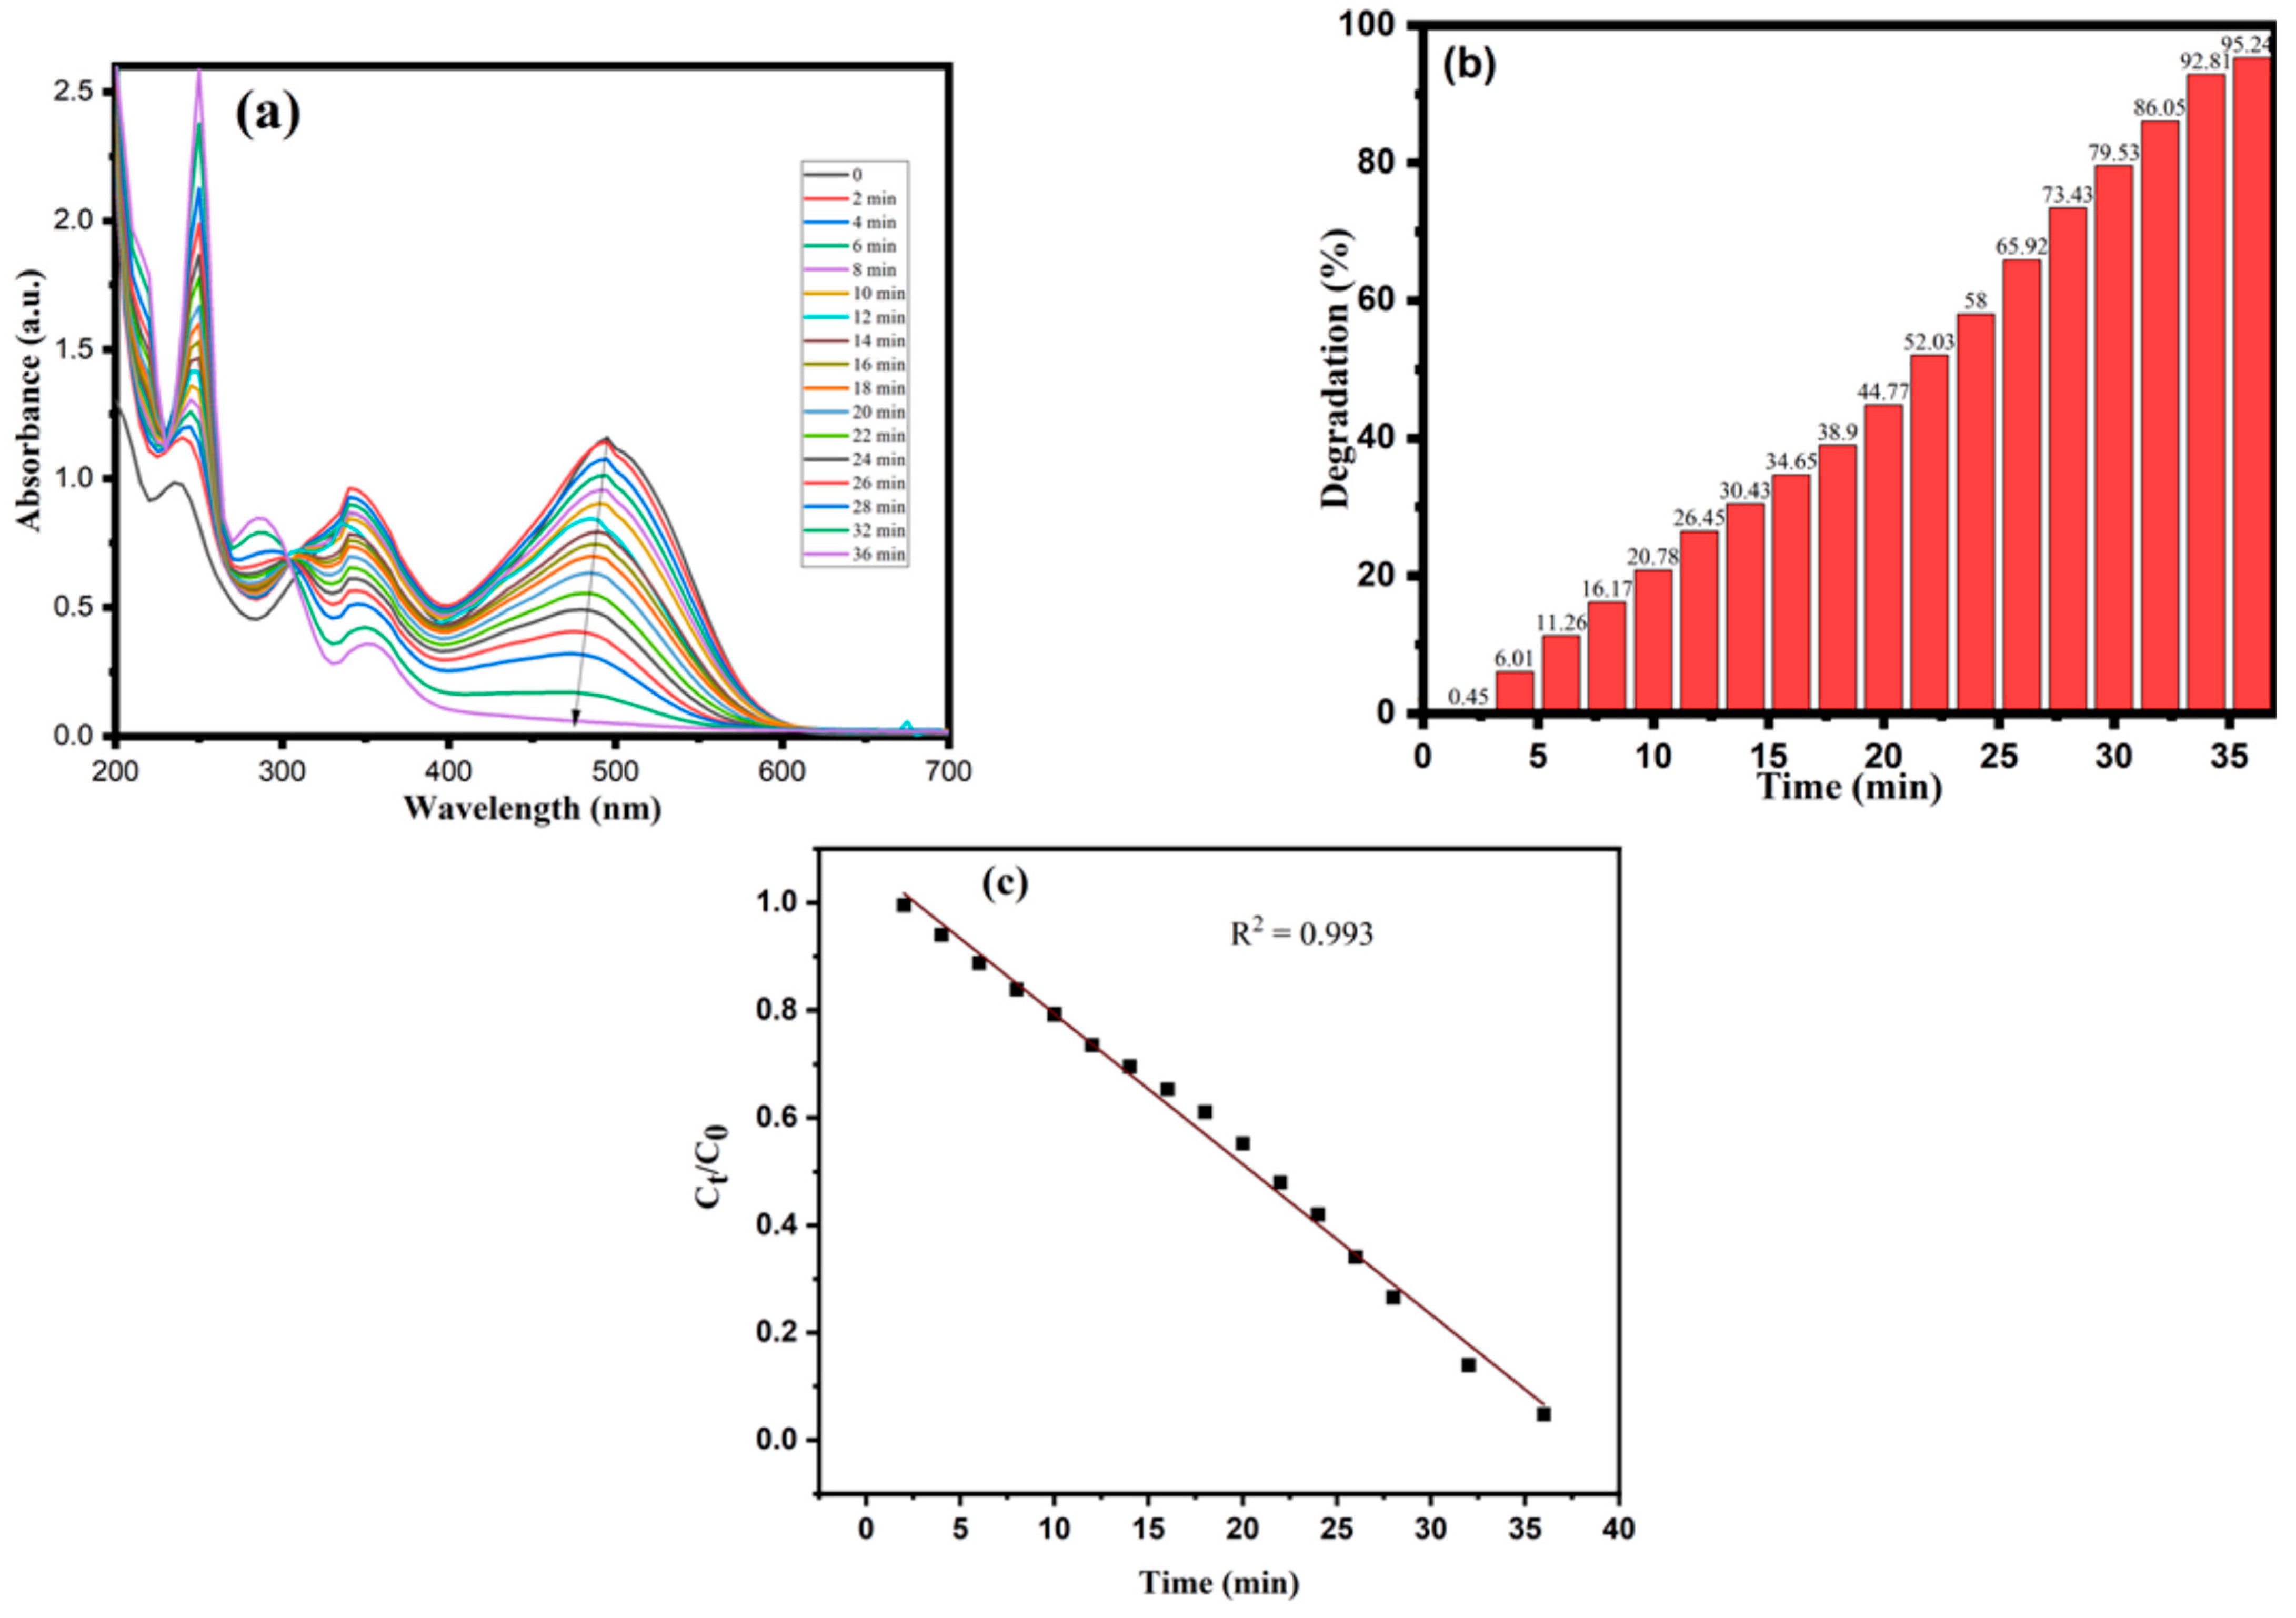
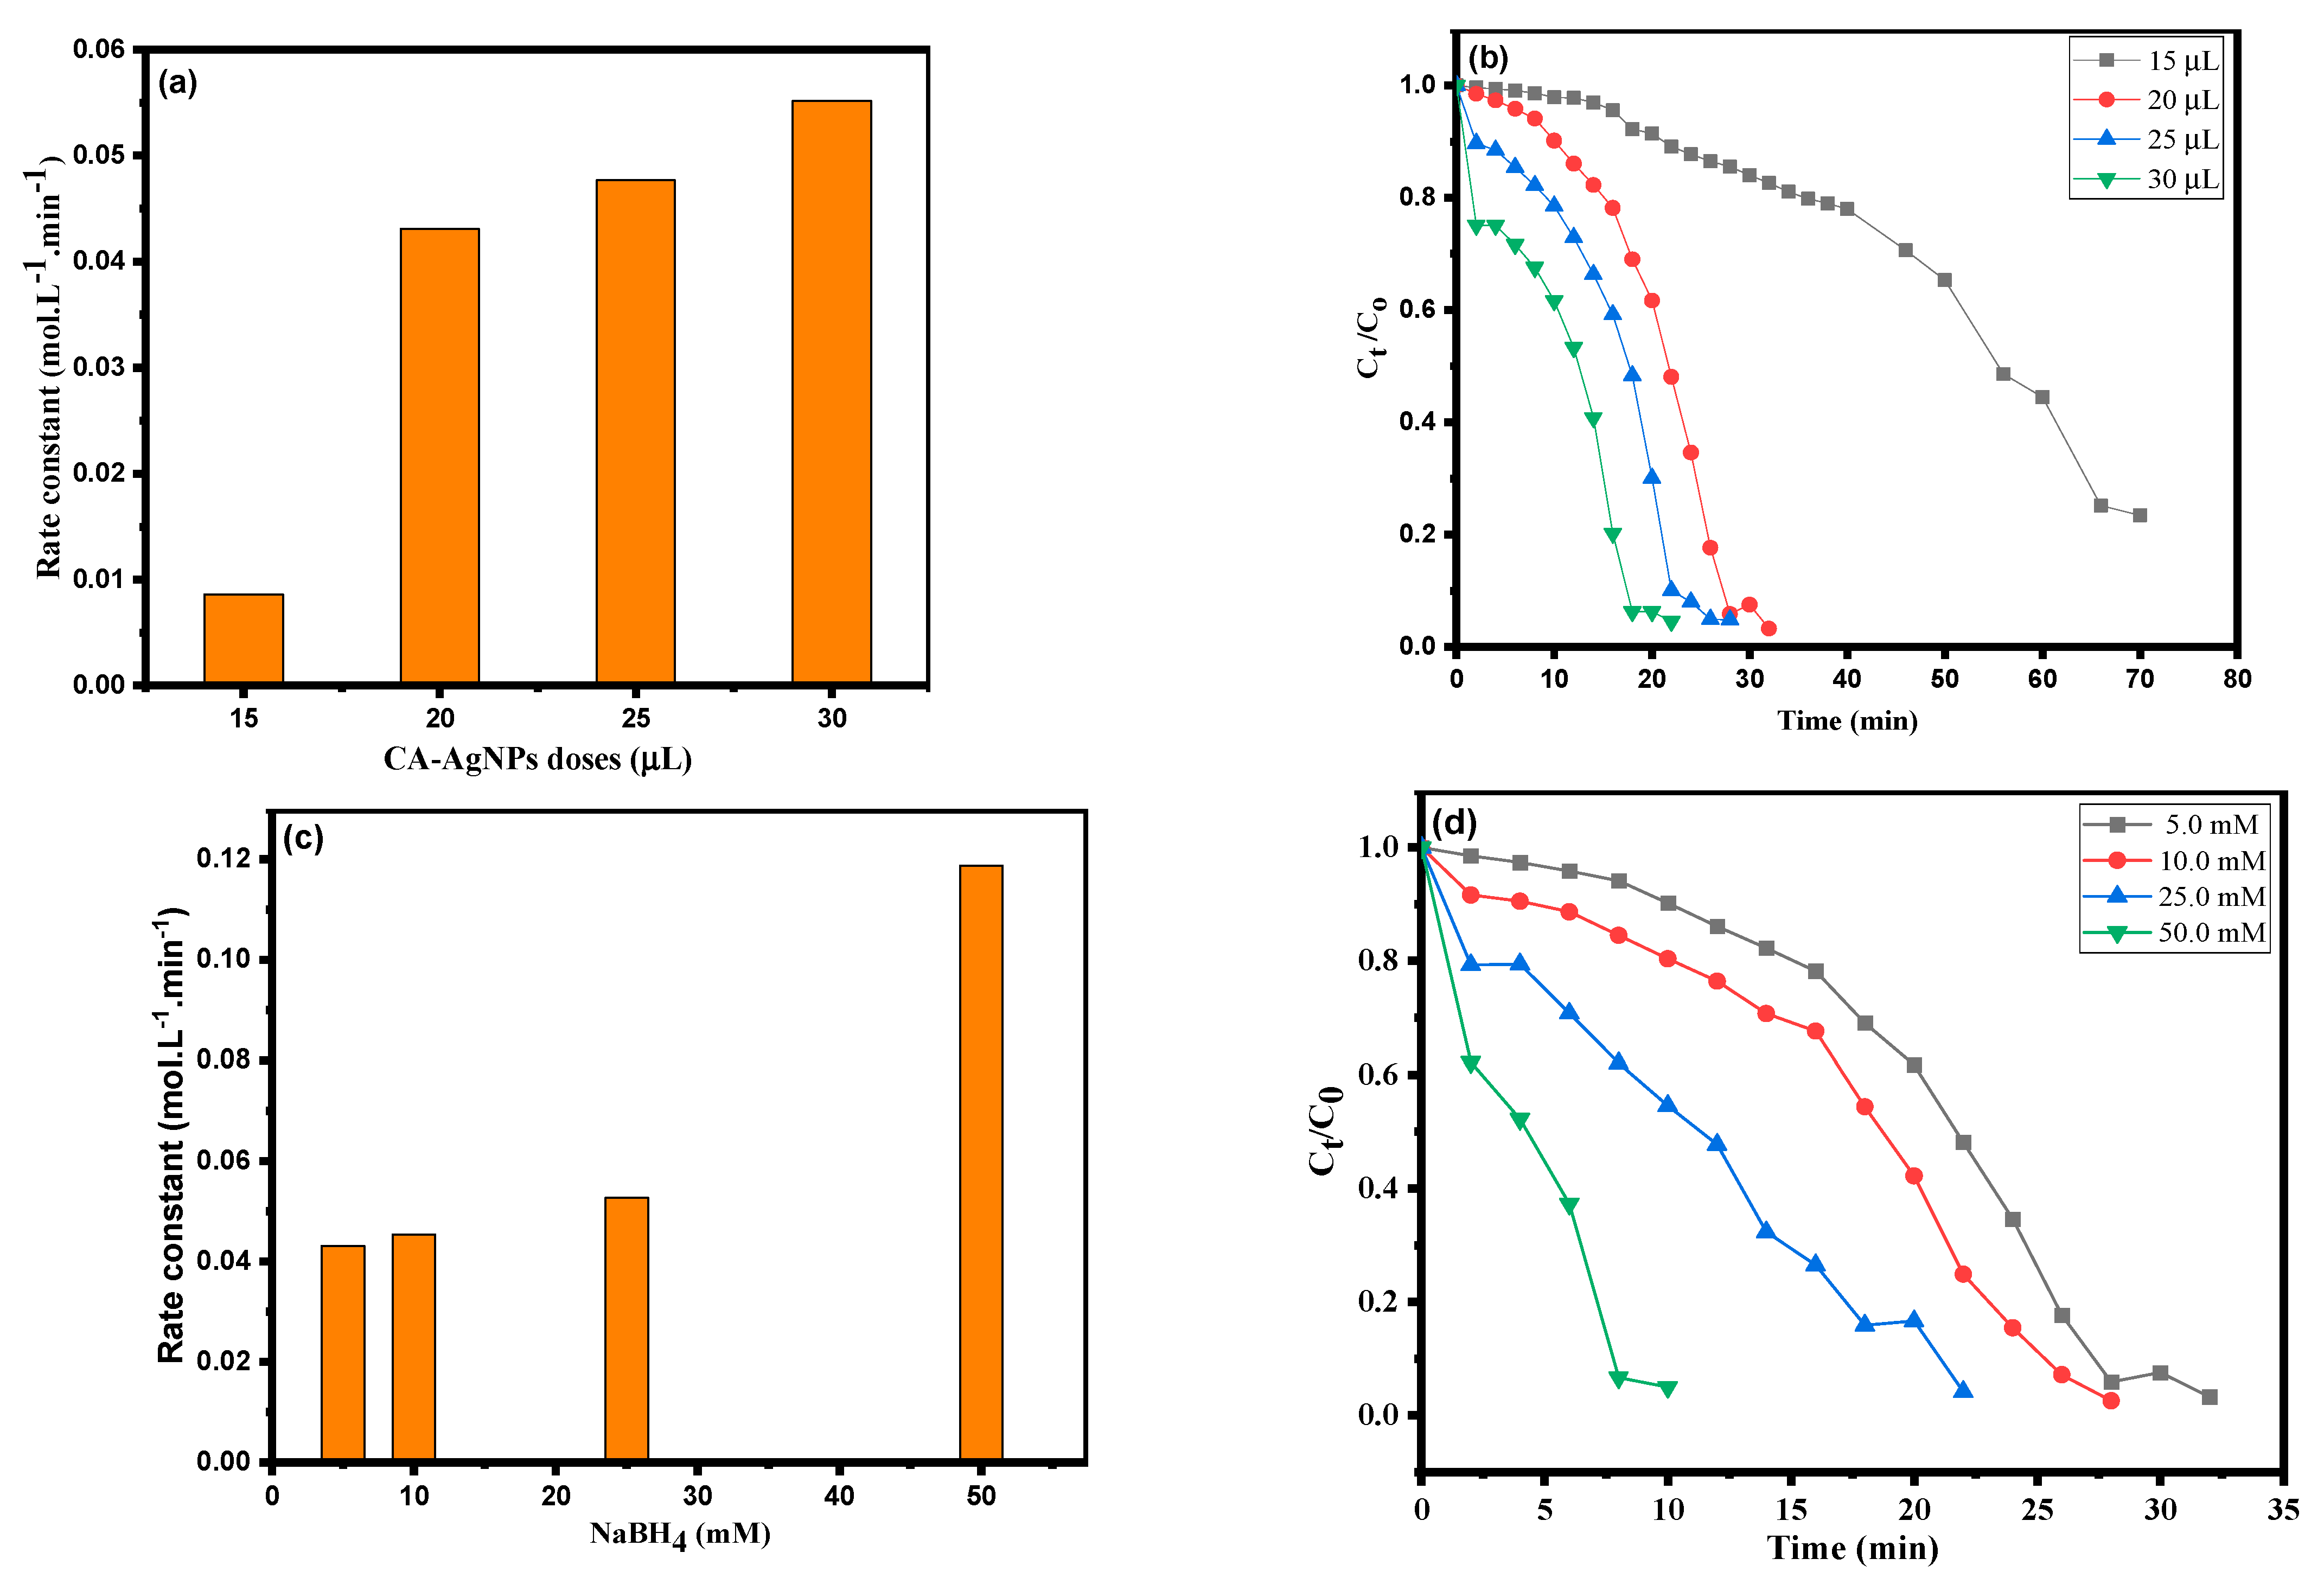
3.2. Dye Degradation by CA-AgNPs

The biosynthesized CA-AgNPs were applied to degrade two dyes (anionic and cationic) commonly released from various industries. Congo red (CR, anionic) and methylene blue (MB, cationic) dyes were used to test the dye degradation ability of CA-AgNPs. The CA-AgNPs-mediated catalytic reduction of CR and MB was carried out in the presence of NaBH4 as a reducing agent. The maximum absorption peak of the aqueous solution of CR (brick-red color) was observed at 490 nm. Figure 7a gives the CR degradation with time, and the reduction reaction followed the pseudo-zero-order reaction kinetics. The complete degradation (95.24%) of CR was achieved after 36 min with dye degradation rate constant, k = 0.0311 mol.L−1.min−1(R2 = 0.9905). Figure 7b displays the % degradation bar graph of CR using CA-AgNPs as calculated by Equation (1), while Figure 7c shows the Ct/Co vis time linear degradation plots of CR dye (R2 = 0.993). Supplementary Figure S2a indicates the synergic effect of CA-AgNPs and NaBH4 leading to high dye degradation %. On the other hand, CA-AgNPs (20.0 µL, 0.05%) (b) or NaBH4 (5.0 mM) (c) didnot have any significant effect on dye degradation.
Figure 8a–d show the influence of CA-AgNPs’ concentrations and NaBH4 concentrations on CR degradation. The synergistic effect of both nanoparticles and NaBH4 as shown in Figure 8a, brefers to the rate constant for pseudo-zero-order kinetics. The rate constant (k) was enhanced as the CA-AgNP doses increased at constant 5.0 mM NaBH4 concentration. Figure 8c,d shows the effect of varying NaBH4 concentration from 5.0 mM to 50.0 mM with constant CA-AgNPs (20 µL, 0.05%). As the NaBH4 concentration increases, Ct/Co decreases, which correspondsto the dye degradation time (Figure 8d). In contrast, the rate constant increases, as shown in Figure 8c, reflecting the good synergistic effect of CA-AgNPs and NaBH4 at different applied parameters. The intensity of absorption remained constant, and no discoloration was observed with CA-AgNPs (Supplementary Figure S2a,b) and NaBH4 (Supplementary Figure S2a,c) alone for a long-time observation. In the presence of the potent reducing agent NaBH4, still no degradation was observed.
MB is a cationic, heterocyclic, aromatic dye employed as a redox indicator in analytical chemistry and a chemotherapeutic and anti-malarial agent in the aquaculture industry. An aqueous solution of MB is blue and shows a maximum UV-Vis absorption peak at 664 nm. Figure 9a proves MB (10.25 ppm) dye degradation which reflects the synergistic effects of CA-AgNPs (0.05%, 20.0 µL) in the presence of NaBH4 (5.0 mM, 0.980 µL). Figure 9b shows the percent of degradation of MB using CA-AgNPs as calculated by Equation (1), which was 96.72% within 32 min. Figure 9c, a plot graph of Ct/Co % versus time, refers to the MB dye degradation, which gradually increases as a function of time. In the supporting information, Supplementary Figure S3a, the synergic effect of CA-AgNPs and NaBH4is demonstrated, leading to high dye degradation %, as early as 32 min. On the other hand, CA-AgNPs (20.0 µL, 0.05%) or NaBH4 (5.0 mM) do not have any significant effect on dye degradation. It is noted here that in the presence of NaBH4 alone, MB dye degradation was rather ambiguous (Supplementary Figure S3a,b). This could be because the NaBH4 generates H2 and a portion of the MB dye instantly gets converted to its colorless form (leucomethylene blue (LMB)) [24]. Solely using CA-AgNPs (Supplementary Figure S3c), no degradation was observed.
Figure 10a–d indicate the influence of CA-AgNP dose and NaBH4 concentrations on the MB degradation chemical kinetics. The synergistic effect of nanoparticles and NaBH4 is shown in Figure 10a,b. The results indicated that the initial rate constant as pseudo-zero-order chemical kinetics increased with increasing CA-AgNP doses from 15 to 30 µL (at constant 5.0 mM NaBH4). 30µL (0.05%) of CA-AgNPs shows complete MB dye degradation after 22 min. Figure 10c,d reveal the varied response toNaBH4 concentration from 5.0 mM to 50.0 mM using constant CA-AgNPs (20 µL, 0.05%). It was observed that as the NaBH4 concentration increases, the complete dye degradation time decreases (Figure 10d), while the degradation rate constant increases as shown (Figure 10c), which reflects the good synergistic effect of CA-AgNPs and NaBH4 at different applied parameters.

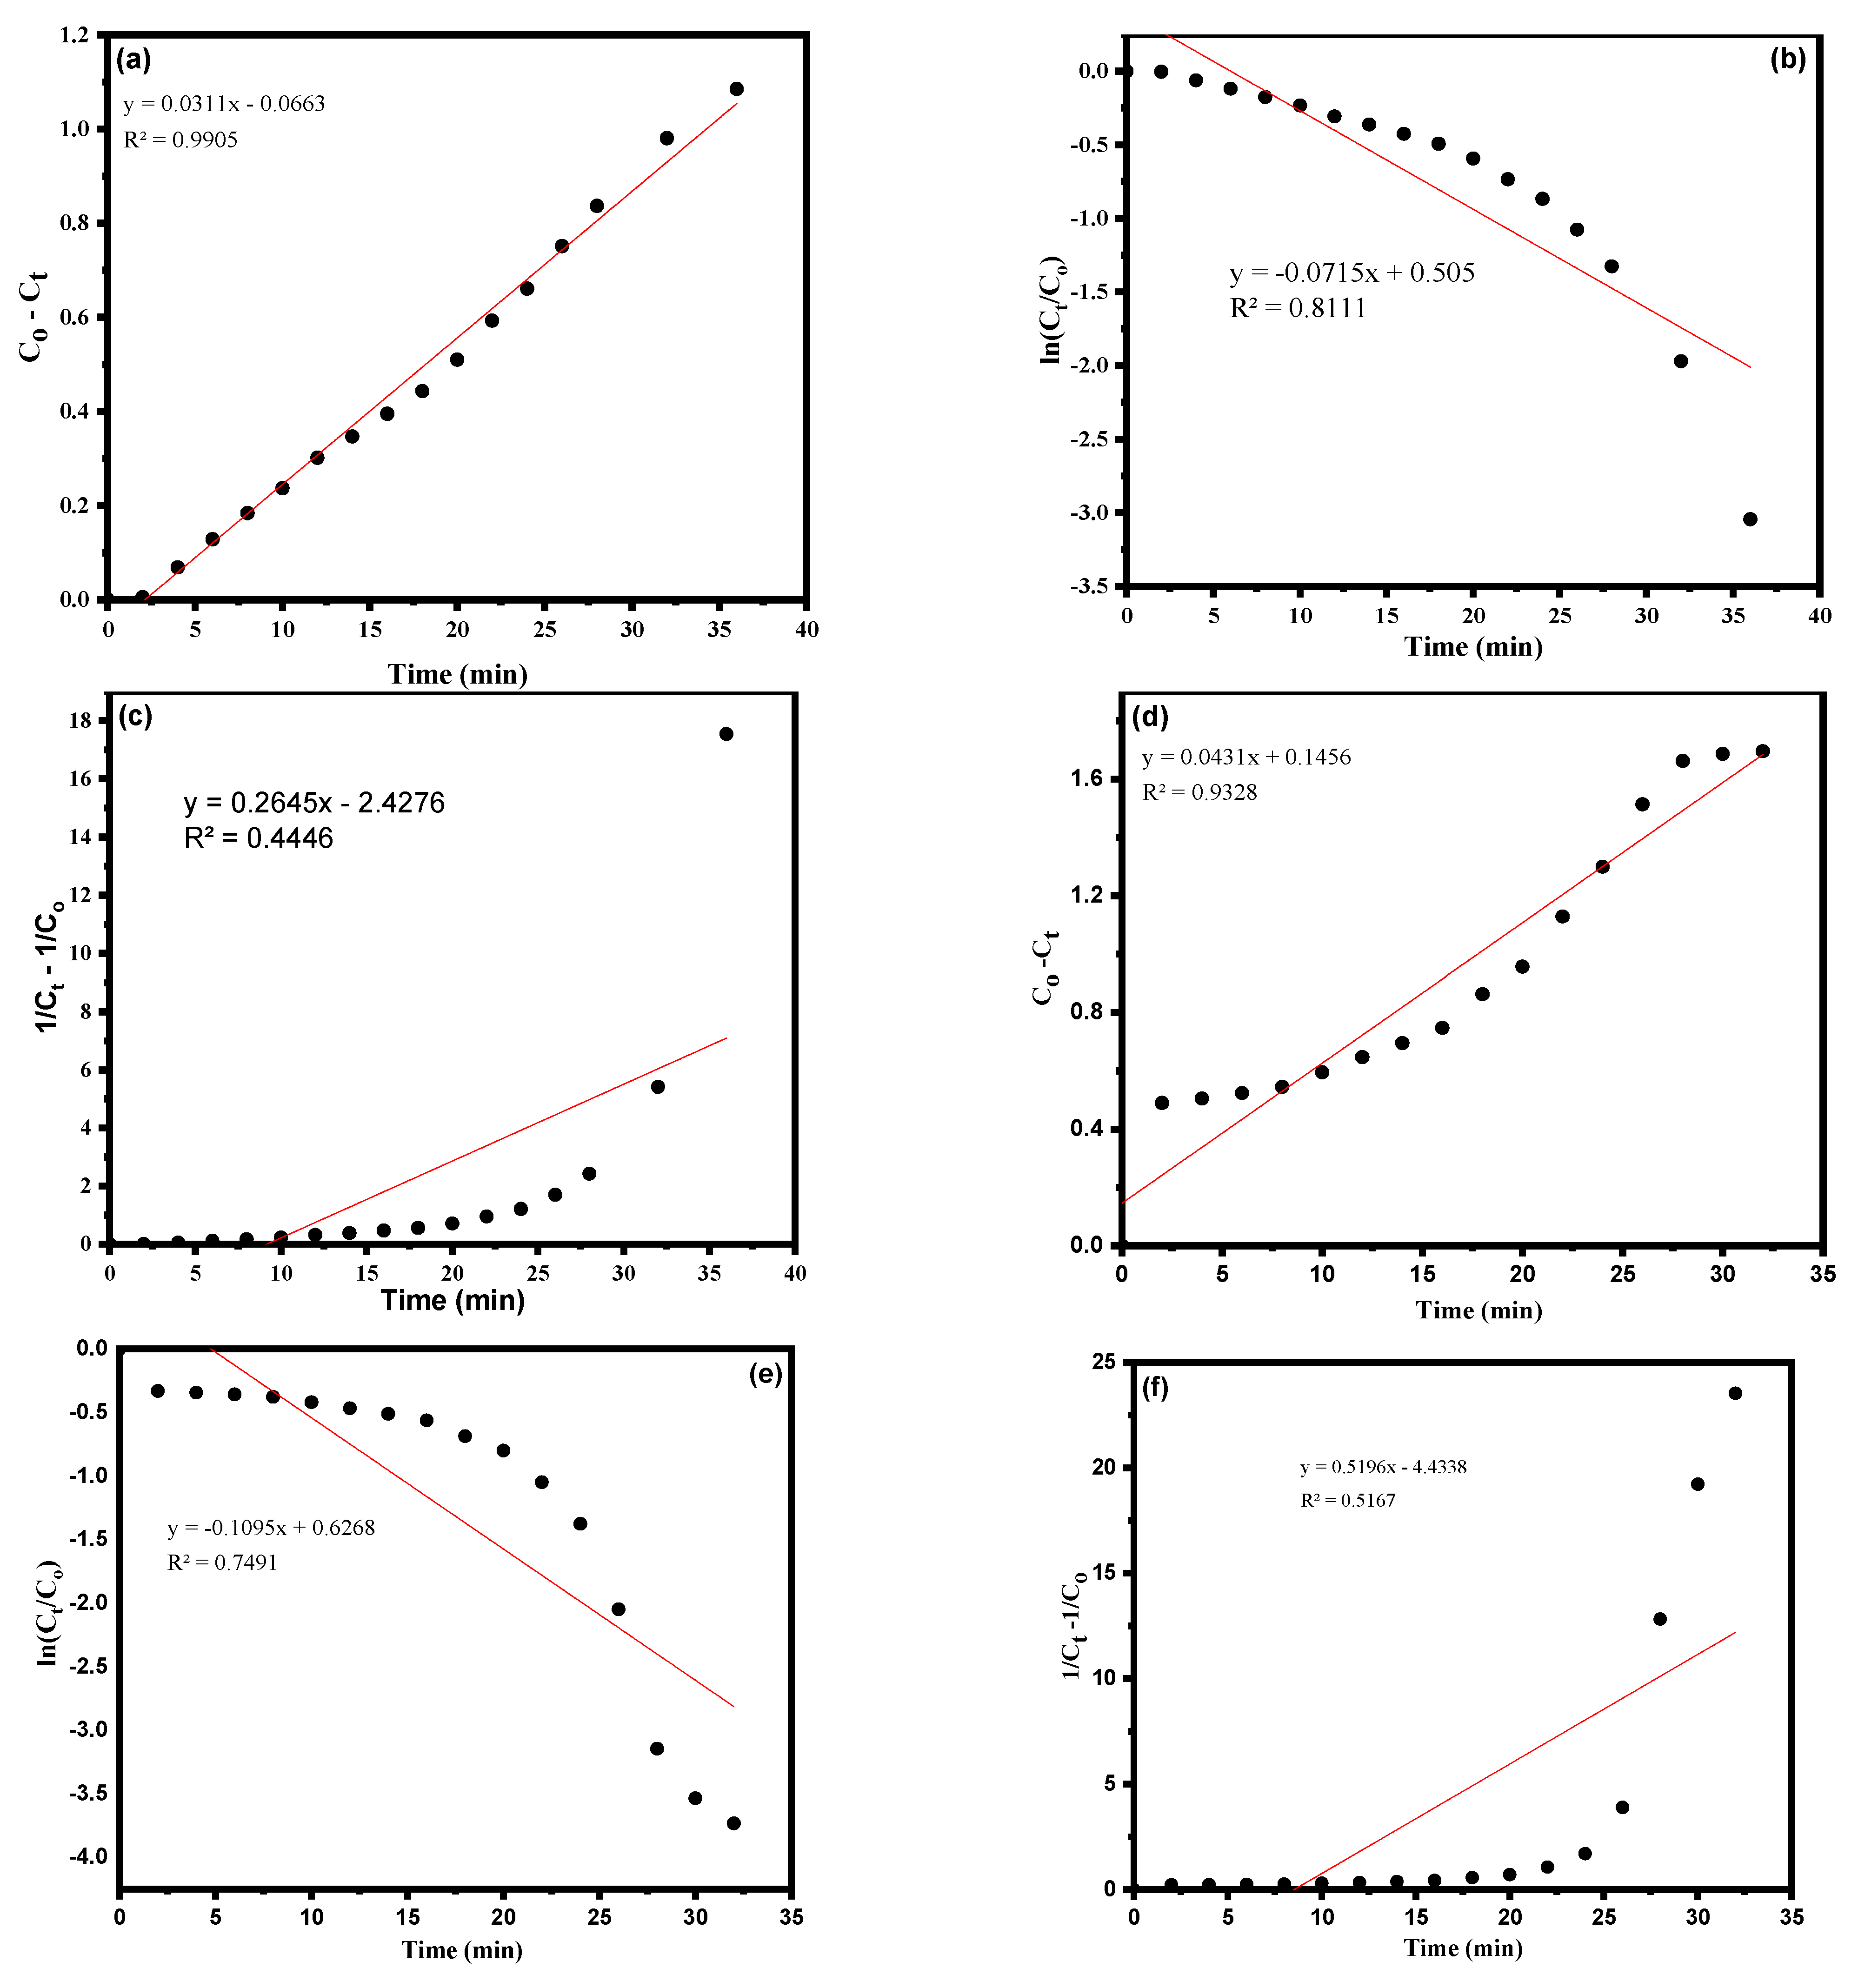
3.3. Kinetic Study Using CA-AgNPs Catalyst

The chemical kinetics of CR and MB dyes ‘degradation was studied using the concentration data based on three kinetic models: zero-order, first-order and second-order. The integrated rate law linear equations for each kinetic model are shown in Table 2 to calculate the apparent reaction rate constant, and plots were drawn as C o C t (zero-order kinetic model), ln C t C o (first-order kinetic model) and 1 C t 1 C o (second-order kinetic model) versus time of dye degradation for CR and MB, as shown in Figure 11a–f and Table 2. The linear regression coefficient (R2) mechanism was applied to determine the CR and MB dye degradation chemical kinetic model. In the case of CR (anionic), the degradation kinetic model shown in Figure 11a represents the best linear (straight line) model data (R2 = 0.9905) with apparent zero-order kinetics with a rate constant 0.0311 mol.L−1.min−1, while Figure 11b,c represent first-order and second-order kinetics with R2 values of0.8111 and 0.4446, respectively, as shown in Table 2.In the case of the MB (cationic) dye, the degradation kinetics models, based on the integrated rate law, are shown in Figure 11d–f and Table 2. Interestingly, the kinetic model for MB can be described as pseudo-zero-order with a good regression coefficient value (R2 = 0.9328) and an apparent reaction rate constant k = 0.0431 mol.L−1.min−1, shown in Figure 11d and Table 2. On the other hand, the pseudo-first-order and second-order chemical kinetic regression coefficient R2 values are 0.7491 and 0.5167, respectively; these are lesser than the pseudo-zero-order kinetic model.To investigate the mechanism, the concentration data were applied to zero-order, first-order and second-order kinetic models to find the rate of degradation.
Raj et al. recently demonstrated the biosynthesis of silver nanoparticles (AgNPs) using Terminalia arjuna leaf extracts. They then used the biosynthesized AgNPs as a catalyst for the degradation of methyl orange (MO), methylene blue (MB), Congo red (CR), and 4- nitrophenol (4-NP) [24]. Several organic dyes use NaBH4 as a reducing agent, and it is kinetically favorable but not thermodynamically viable. Hence, various nanocatalysts have been reported for catalyzing the reduction of organic dyes. Raj et al. [24] reported a plausible mechanism that may work for the role of AgNPs in the catalytic reduction of organic dyes. They speculate that the role of NaBH4 is to produce BH4−1 by its dissociation and act as an electron donor. In contrast, dye molecules act as electron acceptors, and CA-AgNPs act as relay centers for electron transfer from the BH4−1 ion to dye molecules, as shown in the schematic representation in Figure 12. Both BH4−1 and dye molecules diffuse to the biosynthesized CA-AgNPs’ surfaces in an aqueous solution and go through the synergistic effects. The BH4−1 and dye molecules are attached to the NPs’ surface. The hydrogen released from BH4−1 acts as a hydrogen source that gets adsorbed on the catalytic surface of CA-AgNPs and acts on the dye molecules. The electron-carrying CA-AgNPs activate the catalytic surface and activate the azo bond of the dyes resulting in the rupture of the azo bonds due to the uptake of electrons via the catalyst and hydrogen from BH4−1. This way, the dye CR is reduced by the CA-AgNPs’ surfaces [24,65]. In the case of MB, the hydrogen released from BH4−1 results in the appearance of leucomethylene blue (LMB), the colorless, reduced form of MB. Table 3 displays the various comparison parameters between this work and previous reports in the literature after applying green synthesized AgNPs for dye degradation.
Figure 13 displaysthe comparison of two dye degradations during the application of CA-AgNPs after using two different doses of catalysis at constant NaBH4 reducing agent (5.0 mM) concentration. CR degradation % refer to linear progress while MB shows lower to higher degradation %. Nevertheless, in both dyes, the CA-AgNP catalystshave asynergistic effect in the presence of NaBH4 to degrade the dyes, as the data show in Figure 8a–d and Figure 10a–d.

4. Conclusions

For the first time, Caralluma acutangula aqueous extract was used to biosynthesize CA-AgNPs. This biosynthesis process is relatively cheap, fast and environmentally friendly as no toxic chemicals or organic solvents are required. Biosynthesis routes proved to be a valuable process for the production of stable silver nanoparticles. The indigenously biosynthesized CA-AgNPs in this study were characterized by various analytical techniques including UV–Visible spectroscopy, FTIR spectroscopy, Raman spectroscopy, XRD, TEM, TGA, SEM, EDX, zeta potential, and bandgap analysis. The biosynthesized CA-AgNPs proved to be efficient for the degradation of two toxic water pollution dyes: CR (95.24% degradation within 36 min) and MB (96.72% degradation within 32 min) in the presence of NaBH4. Dye degradation chemical kinetics were explored as pseudo-zero-order reactions on the basis of integrated-rate-law model equations. The rate constant ‘k’ for CR and MB was calculated as 0.0311 and 0.0431 mol.L−1.min−1, respectively. The mechanism of CA-AgNP-mediated dye degradation has been speculated and further studies are required to confirm it.

Supplementary Materials

The following supporting information can be downloaded at: https://www.mdpi.com/article/10.3390/cryst12081069/s1, Figure S1: Gas Chromatography-Mass Spectrometry chromatogram of Caralluma acutangula extract in methanol. Inset Figure refers to zoom of the blue color zone. Identified predominant components in the extract are shown in Table S1, Figure S2: (a) CR dye degradation by CA-AgNPs with NaBH4, NaBH4, CA-AgNPs alone (b) Control UV graph of CR with NaBH4 alone; (c) Control UV graph of MB with CA-AgNPs alone, Figure S3: (a) MB dye degradation by CA-AgNPs with NaBH4, NaBH4, CA-AgNPs alone (b) UV graph of MB Control with NaBH4 alone; (c) UV graph of MB Control with CA-AgNPs alone, Figure S4: Zeta Potential analysis of CA-AgNPs, Table S1: List of phytochemicals identified in aqueous extract of CAE by Gas Chromatography-Mass spectrometry (GC-MS) along with their retention times, and peak area%, similarity index and molecular weight.

Author Contributions

W.M.A. and N.H., performed the experiment, manuscript original draft and revised the manuscript; S.K.A., carried out plant extract preparation and manuscript revision; M.D.Y.O., performed the complete analysis of the CA extract using GC-MS techniques and intensively reviewed and revised the manuscript. All authors have read and agreed to the published version of the manuscript.

Funding

This research was funded by the Deanship of Scientific Research, Jazan University by Research Groups Program, Support Number: RG-2-1.

Data Availability Statement

The data are available within the article and in supporting materials.

Acknowledgments

The authors extend their appreciation to the Deanship of Scientific Research, Jazan University, for supporting this research work through the Research Groups Program, Support Number: RG-2-1.

Conflicts of Interest

The authors declare no conflict of interest.

References

  1. Ali, F.; Khan, S.B.; Kamal, T.; Alamry, K.A.; Asiri, A.M. Chitosan-titanium oxide fibers supported zero-valent nanoparticles: Highly efficient and easily retrievable catalyst for the removal of organic pollutants. Sci. Rep. 2018, 8, 6260. [Google Scholar] [CrossRef] [Green Version]
  2. Tsunoyama, H.; Sakurai, H.; Ichikuni, N.; Negishi, Y.; Tsukuda, T. Colloidal gold nanoparticles as catalyst for carbon-carbon bond formation: Application to aerobic homocoupling of phenylboronic acid in water. Langmuir 2004, 20, 11293–11296. [Google Scholar] [CrossRef]
  3. Galletto, P.; Brevet, P.F.; Girault, H.H.; Antoine, R.; Broyer, M. Enhancement of the second harmonic response by adsorbates on gold colloids: The effect of aggregation. J. Phys. Chem. B 1999, 103, 8706–8710. [Google Scholar] [CrossRef]
  4. Maier, S.A.; Brongersma, M.L.; Kik, P.G.; Meltzer, S.; Requicha, A.A.G.; Atwater, H.A. Plasmonics a route to nanoscale optical devices. Adv. Mater. 2001, 13, 1501–1505. [Google Scholar] [CrossRef]
  5. Han, M.; Gao, X.; Nie, S.J.Z. Quantum-dot-tagged microbeads for multiplexed optical coding of biomolecules. Nat. Biotechnol. 2001, 19, 631–635. [Google Scholar] [CrossRef]
  6. West, J.L.; Halas, N.J. Engineered nanomaterials for biophotonics applications: Improving sensing, imaging, and therapeutics. Annu. Rev. Biomed. Eng. 2003, 5, 285–292. [Google Scholar] [CrossRef] [Green Version]
  7. Nicewarner-Pena, S.R.; Freeman, R.G.; Reiss, B.D.; He, L.; Peña, D.J.; Walton, I.D.; Cromer, R.; Keating, C.D.; Natan, M.J. Submicrometer metallic barcodes. Science 2001, 294, 137–141. [Google Scholar] [CrossRef]
  8. Gao, Y.; Zhang, X.; Li, Y.; Liu, H.; Wang, Y.; Chang, Q.; Jiao, W.; Song, Y. Saturable absorption and reverse saturable absorption in platinum nanoparticles. Opt. Commun. 2005, 251, 429–433. [Google Scholar] [CrossRef]
  9. Yanez-Sedeno, P.; Pingarron, J.M. Gold nanoparticle-based electrochemical biosensors. Anal. Bioanal. Chem. 2005, 382, 884–886. [Google Scholar] [CrossRef]
  10. Dang, T.M.; Le, T.T.; Fribourg-Blanc, E.; Dang, M.C. The influence of solvents and surfactants on the preparation of copper nanoparticles by a chemical reduction method. Adv. Nat. Sci. Nanosci. Nanotechnol. 2011, 2, 025004. [Google Scholar] [CrossRef]
  11. Zhu, H.; Zhang, C.; Yin, Y. Rapid synthesis of copper nanoparticles by sodium hypophosphite reduction in ethylene glycol under microwave irradiation. J. Cryst. J. Growth 2004, 270, 722–728. [Google Scholar] [CrossRef]
  12. Thakkar, K.N.; Mhatre, S.S.; Parikh, R.Y. Biological synthesis of metallic nanoparticles. Nanomed. Nanotechnol. Biol. Med. 2010, 6, 257–262. [Google Scholar] [CrossRef] [PubMed]
  13. Narayanan, K.B.; Sakthivel, N. Biological synthesis of metal nanoparticles by microbes. Adv. Colloid Interface Sci. 2010, 156, 1–13. [Google Scholar] [CrossRef] [PubMed]
  14. Abdel-Halim, E.S.; El-Rafie, M.H.; Al-Deyab, S.S. Polyacrylamide/guar gum graft copolymer for preparation of silver nanoparticles. Carbohydr. Polym. 2011, 85, 692–697. [Google Scholar] [CrossRef]
  15. Jasbi, A.R. Chemistry and biological activity of secondary metabolites in Euphorbia from Iran. Phytochemistry 2006, 67, 1977–1984. [Google Scholar] [CrossRef]
  16. Dubey, S.; Lahtinen, M.; Sillanpa, M. Tansy fruit mediated greener synthesis of silver and gold nanoparticles. Process Biochem. 2010, 45, 1065–1071. [Google Scholar] [CrossRef]
  17. Zhan, G.; Huang, J.; Du, M.; Abdul-Rauf, I.; Li, Q.; Ma, Y. Green synthesis of Au–Pd bimetallic nanoparticles: Single-step bioreduction method with plant extract. Mat. Lett. 2011, 65, 2989–2991. [Google Scholar] [CrossRef]
  18. Huang, X.; Wu, H.; Pu, S.; Zhang, W.; Liao, X.; Shi, B. One-step room-temperature synthesis of Au@Pd core–shell nanoparticles with tunable structure using plant tannin as reductant and stabilizer. Green Chem. 2011, 13, 950–957. [Google Scholar] [CrossRef]
  19. Raveendran, P.; Fu, J.; Wallen, S.L. A simple and “green” method for the synthesis of Au, Ag, and Au–Ag alloy nanoparticles. Green Chem. 2006, 8, 34–38. [Google Scholar] [CrossRef]
  20. Nam, J.; Won, N.; Jin, H.; Chung, H.; Kim, S. pH-induced aggregation of gold nanoparticles for photothermal cancer therapy. J. Am. Chem Soc. 2009, 131, 13639–13645. [Google Scholar] [CrossRef]
  21. Narayanan, K.B.; Sakthivel, N. Synthesis and characterization of nano-gold composite using Cylindrocladium floridanum and its heterogeneous catalysis in the degradation of 4-nitrophenol. J. Hazard. Mater. 2011, 189, 519–525. [Google Scholar] [CrossRef] [PubMed]
  22. Li, J.; Chen, X.; Ai, N.; Hao, J.; Chen, Q.; Strauf, S.; Shi, Y. Silver nanoparticle doped TiO2 nanofiber dye sensitized solar cells. Chem. Phys. Lett. 2011, 514, 141–145. [Google Scholar] [CrossRef]
  23. Fayaz, A.M.; Girilal, M.; Mahdy, S.A.; Somsundar, S.S.; Venkatesan, R.; Kalaichelvan, P.T. Vancomycin bound biogenic gold nanoparticles: A different perspective for development of anti VRSA agents. Process Biochem 2011, 46, 636–641. [Google Scholar] [CrossRef]
  24. Raj, S.; Singh, H.; Trivedi, R.; Soni, V. Biogenic synthesis of AgNPs employing Terminalia arjuna leaf extract and its efficacy towards catalytic degradation of organic dyes. Sci. Rep. 2020, 10, 9616. [Google Scholar] [CrossRef]
  25. Atarod, M.; Nasrollahzadeh, M.; Sajadi, S.M. Euphorbia heterophylla leaf extract mediated green synthesis of Ag/TiO2 nanocomposite and investigation of its excellent catalytic activity for reduction of variety of dyes in water. J. Colloid Interface Sci. 2015, 462, 272–279. [Google Scholar] [CrossRef]
  26. Awad, M.A.; Hendi, A.A.; Ortashi, K.M.; Alzahrani, B.; Soliman, D.; Alanazi, A.; Alenazi, W.; Taha, R.M.; Ramadan, R.; El-Tohamy, M.; et al. Biogenic synthesis of silver nanoparticles using Trigonella foenum-graecum seed extract: Characterization, photocatalytic and antibacterial activities. Sens. Actuators A Phys. 2021, 323, 112670. [Google Scholar] [CrossRef]
  27. Radini, I.A.; Hasan, N.; Khan, M.A.M.Z. Biosynthesis of iron nanoparticles using Trigonella foenum-graecum seed extract for photo catalytic methyl orange dye degradation and antibacterial applications. J. Photochem. Photobiol. B Biol. 2018, 183, 154–163. [Google Scholar] [CrossRef]
  28. Reddy, N.K.; Hoskote, B.R.; Kumar, A.K.; Mandal, B.K. Bio fabricated silver nanoparticles as green catalyst in the degradation of different textile dyes. J. Environ. Chem. Eng. 2016, 4, 56–64. [Google Scholar]
  29. Al-Zaban, M.I.; Mohamad, A.M.; Al-Harbi, M.A. Catalytic Degradation of Methylene Blue Using Silver Nanoparticles Synthesized by Honey. Saudi J. Biol. Sci. 2021, 28, 2007–2013. [Google Scholar] [CrossRef] [PubMed]
  30. Edison, T.N.J.I.; Sethuraman, M.G. Instant green synthesis of silver nanoparticles using Terminalia chebula fruit extract and evaluation of their catalytic activity on reduction of methylene blue. Process Biochem. 2012, 47, 1359–5113. [Google Scholar] [CrossRef]
  31. Edison, T.N.J.I.; Atchudan, R.; Kamal, C.; Lee, Y.R. Caulerpa racemosa: A marine green alga for eco-friendly synthesis of silver nanoparticles and its catalytic degradation of methylene blue. Bioprocess Biosyst. Eng. 2016, 39, 1401–1408. [Google Scholar] [CrossRef] [PubMed]
  32. Rostami-Vartooni, A.; Nasrollahzadeh, M.; Alizadeh, M. Green synthesis of seashell supported silver nanoparticles using Bunium persicum seeds extract: Application of the particles for catalytic reduction of organic dyes. J. Colloid Interface Sci. 2016, 470, 268–275. [Google Scholar] [CrossRef]
  33. Roy, K.; Sarkar, C.K.; Ghosh, K. Photocatalytic activity of biogenic silver nanoparticles synthesized using yeast (Saccharomyces cerevisiae) extract. Appl. Nanosci. 2015, 15, 953–959. [Google Scholar] [CrossRef]
  34. Saha, J.; Begum, A.; Mukherjee, A.; Kumar, S. A novel green synthesis of silver nanoparticles and their catalytic action in reduction of Methylene Blue dye. Sustain. Environ. Res. 2017, 27, 245–250. [Google Scholar] [CrossRef]
  35. Sharma, P.; Pant, S.; Rai, S.; Yadav, R.B.; Dave, V. Green Synthesis of Silver Nanoparticle Capped with Allium cepa and Their Catalytic Reduction of Textile Dyes: An Ecofriendly Approach. J. Polym. Environ. 2018, 26, 1795–1803. [Google Scholar] [CrossRef]
  36. Suvith, V.S.; Philip, D. Catalytic degradation of methylene blue using biosynthesized gold and silver nanoparticles. Mol. Biomol. Spectrosc. 2014, 118, 526–532. [Google Scholar] [CrossRef]
  37. Al-Yahya, M.; Al-Meshal, I.; Mossa, J.; Al-Badr, A.; Tariq, M. Saudi Plants: A Phytochemical and Biological Approach; King Saud University Press: Riyadh, Saudi Arabia, 1990; p. 523. [Google Scholar]
  38. Al-Faifi, Z.I.A.; Yahya, M.; Aly, M.S.; Al-Turki, T.A. In vitro Anticancer Activity of Caralluma acutangula (Decne.) N.E.Br. Extract. Int. J. Pharm. Sci. Rev. Res. 2016, 38, 59–63. [Google Scholar]
  39. Chaudhary, S.A.; Al-Wataniya, M.; Al-Watani, A.M. Flora of the Kingdom of Saudi Arabia; National Agriculture and Water Research Center: Riyadh, Saudi Arabia, 2001; p. 2. [Google Scholar]
  40. Halaweish, F.; Huntimer, E.; Khalil, A. Polyoxy pregnane glycosides from Caralluma retrospiciens. Phytochem. Anal. 2004, 15, 189–194. [Google Scholar] [CrossRef] [PubMed]
  41. DParé; N’do, J.Y.; Hilou, A.; Sombie, N.E.; Kpemissi, M.; Bogdan, S. Anti-Obesogenic Potential of Caralluma acutangula Bioactive Fractions. Sch. Int. J. Biochem. 2020, 3, 183–192. [Google Scholar]
  42. Liu, J.; Yong, H.; Yao, X.; Hu, H.; Yun, D.; Xiao, L. Recent advances in phenolic–protein conjugates: Synthesis, characterization, biological activities and potential applications. RSC Adv. 2019, 9, 35825–35840. [Google Scholar] [CrossRef] [Green Version]
  43. Karimova, N.V.; Luo, M.; Grassian, V.H.; Gerber, B. Absorption spectra of benzoic acid in water at different pH and in the presence of salts: Insights from the integration of experimental data and theoretical cluster models. Phys. Chem. Chem. Phys. 2020, 22, 5046–5056. [Google Scholar] [CrossRef] [PubMed]
  44. Sastry, M.; Mayya, K.S.; Bandyopadhyay, K. pH Dependent changes in the optical properties of carboxylic acid derivatized silver colloidal particles. Colloids Surf. A Physicochem. Eng. Asp. 1997, 127, 221–228. [Google Scholar] [CrossRef]
  45. Sankar, R.; Karthik, A.; Prabu, A.; Karthik, S.; Shivashangari, S.K.; Ravikumar, S.V. Origanum vulgare mediated biosynthesis of silver nanoparticles for its antibacterial and anticancer activity. Colloids Surf. B Biointerfaces 2013, 108, 80–84. [Google Scholar] [CrossRef]
  46. Sireesha, M.; Venkata, N.R.; Suresh, B.K.; Sreenivasulu, M. Phytochemical library of Carulluma genus. Int. J. Res. Pharm. Sci. 2018, 9, 1201–1213. [Google Scholar]
  47. Gusrizal, G.; Santosa, S.J.; Kunarti, E.S.; Rusdiarso, B. Dual Function of p-Hydroxybenzoic Acid as Reducing and Capping Agent in Rapid and Simple Formation of Stable Silver Nanoparticles. Int. J. ChemTech Res. 2016, 9, 472–482. [Google Scholar]
  48. Gusrizal, G.; Santosa, S.J.; Kunarti, E.S.; Rusdiarso, B. Synthesis of Silver Nanoparticles by Reduction of Silver Ion with m-Hydroxybenzoic Acid. Asian J. Chem. 2017, 29, 1417–1422. [Google Scholar] [CrossRef]
  49. Susanthy, D.; Wahyuni, E.T.F.; Santosa, S. Synthesis of silver nanoparticles using o-hydroxybenzoic, p-hydroxybenzoic, and o,p-dihydroxybenzoic acids as reducing agents. Mater. Sci. Forum 2017, 901, 26–31. [Google Scholar] [CrossRef]
  50. Marimuthu, S.; Rahuman, A.A.; Rajakumar, G.; Santhoshkumar, T.; Kirthi, A.V.; Jayaseelan, C.; Bagavan, A.; Zahir, A.A.; Elango, G.; Kamaraj, C. Evaluation of green synthesized silver nanoparticles against parasites. Parasitol. Res. 2011, 108, 1541–1549. [Google Scholar] [CrossRef]
  51. Azira, W.M.K.W.; Kamyar, K.; Davoud, S.J.S.; Azizi, O.N.; Wahyuny, C.J.N.; Mohd, H.N. Biosynthesized silver nanoparticles by aqueous stem extract of entada spiralis and screening of their biomedical activity. Front. Chem. 2020, 8, 620. [Google Scholar]
  52. Lin-Vien, D.; Colthup, N.B.; Fateley, W.G.; Grasselli, J.G. Chapter 9—Compounds containing the carbonyl group. In The Handbook of Infrared and Raman Characteristic Frequencies of Organic Molecules; Lin-Vien, D., Colthup, N.B., Fateley, W.G., Grasselli, J.G., Eds.; Academic Press: Cambridge, MA, USA, 1991; pp. 117–154. [Google Scholar]
  53. Ramirez, D.; Jaramillo, F. Facile one-pot synthesis of uniform silver nanoparticles and growth mechanism. Dyna 2016, 83, 165–170. [Google Scholar] [CrossRef]
  54. Aziz, A.; Khalid, M.; Akhtar, S.M.; Nadeem, M.; Gilani, Z.; Khan, M.; Rehman, J.; Ullah, Z.; Saleem, M. Structural, morphological and optical investigations of silver nanoparticles synthesized by sol-gel auto-combustion method. Dig. J. Nanomater. Biostructures 2018, 13, 679–683. [Google Scholar]
  55. Moldovan, B.; Sincari, V.; Perde-Schrepler, M.; David, L. Biosynthesis of silver nanoparticles using Ligustrum Ovalifolium fruits and their cytotoxic effects. Nanomaterials 2018, 8, 627. [Google Scholar] [CrossRef] [PubMed] [Green Version]
  56. Sun, Q.; Cai, X.; Li, J.; Zheng, M.; Chen, Z.; Yu, C.P. Green synthesis of silver nanoparticles using tea leaf extract and evaluation of their stability and antibacterial activity. Coll. Surf. A Physicochem. Eng. Asp. 2014, 444, 226–231. [Google Scholar] [CrossRef]
  57. Yallappa, S.; Dhananjaya, J.M.L. Phytosynthesis of stable Au, Ag and Au-Ag alloy nanoparticles using J. sambac leaves extract, and their enhanced antimicrobial activity in presence of organic antimicrobials. Spectrochim. Acta. A Mol. Biomol. Spectrosc. 2015, 137, 236–243. [Google Scholar]
  58. David, L.; Moldovan, B. Green Synthesis of Biogenic Silver Nanoparticles for Efficient Catalytic Removal of Harmful Organic Dyes. Nanomaterials 2020, 10, 202. [Google Scholar] [CrossRef] [PubMed] [Green Version]
  59. Preetha, D.; Prachi, K.; Chirom, A.; Arun, R. Synthesis and characterization of silver nanoparticles using cannonball leaves and their cytotoxic activity against MCF-7 cell line. J. Nanotechnol. 2013, 2013, 598328. [Google Scholar]
  60. Roy, K.; Sarkar, C.K.; Ghosh, C.K. Plant-mediated synthesis of silver nanoparticles using parsley (Petroselinum crispum) leaf extract: Spectral analysis of the particles and antibacterial study. Appl. Nanosci. 2015, 5, 945–951. [Google Scholar] [CrossRef] [Green Version]
  61. Karuppiah, M.; Rajmohan, R. Green synthesis of silver nanoparticles using Ixora coccinea leaves extract. Mater. Lett. 2013, 97, 141–143. [Google Scholar] [CrossRef]
  62. Singha, S.; Neog, K.; Kalita, P.P.; Talukdar, N.; Sarma, M.P. Biological synthesis of silver nanoparticles by Neptunia oleraceae. Int. J. Basic Appl. Biol. 2014, 2, 55–59. [Google Scholar]
  63. Manikandan, V.; Velmurugan, P.; Park, J.H.; Chang, W.S.; Park, Y.J.; Jayanthi, P.; Cho, M.; Oh, B.T. Green synthesis of silver oxide nanoparticles and its antibacterial activity against dental pathogens. 3 Biotech 2017, 7, 72. [Google Scholar] [CrossRef] [Green Version]
  64. Sami, A.; David, E.; Fréchette, M. Procedure for evaluating the crystallinity from X-ray diffraction scans of high and low density polyethylene/SiO2 composites. In Annual Report Conference on Electrical Insulation and Dielectic Phenomena; IEEE: Manhattan, NY, USA, 2010; pp. 1–4. [Google Scholar]
  65. Naseem, K.; Begum, R.; Al-Sehemi, A.G.; Farooqi, Z.H. Catalytic reduction of toxic dyes in the presence of silver nanoparticles impregnated core-shell composite microgels. J. Clean. Prod. 2019, 211, 855–864. [Google Scholar] [CrossRef]
  66. Sengan, M.; Veeramuthu, D.; Veerappan, A. Photosynthesis of silver nanoparticles using Durio zibethinus aqueous extract and its application in catalytic reduction of nitroaromatics, degradation of hazardous dyes and selective colorimetric sensing of mercury ions. Mater. Res. Bull. 2018, 100, 386–393. [Google Scholar] [CrossRef]
  67. Fairuzi, A.A.; Bonnia, N.N.; Akhir, R.M.; Abrani, M.A.; Akil, H.M. Degradation of methylene blue using silver nanoparticles synthesized from imperata cylindrica aqueous extract. IOP Conf. Ser Earth Environ. Sci. 2018, 105, 012018. [Google Scholar] [CrossRef]
  68. Laouini, S.E.; Laouini, X.A.; Soldatov, A.V.; Algarni, H.; Tedjani, M.L.; Ali, G.A.M.; Barhoum, A. Green Synthesized of Ag/Ag2O Nanoparticles Using Aqueous Leaves Extracts of Phoenix dactylifera L. and Their Azo Dye Photodegradation. Membranes 2021, 11, 468. [Google Scholar] [CrossRef] [PubMed]
Figure 1. Schematic workflow of the study.
Crystals 12 01069 g001
Figure 2. (a) UV-visible spectra of CA Extractand Biosynthesized CA-AgNPs; (b) Bandgap plot of CA-AgNPs.
Crystals 12 01069 g002
Figure 3. (a) FTIR spectra of (I) aqueous extract of CA (II) CA-AgNPs. (b) Raman spectra of CA-AgNPs. (c) TGA graph of CA-AgNPs.
Crystals 12 01069 g003
Figure 4. XRD analysis of CA-AgNPs. * Unassigned peaks.
Crystals 12 01069 g004
Figure 5. (a) TEM, (b) size distribution histogram of CA-AgNPs.
Crystals 12 01069 g005
Figure 6. (a) SEM, (b) EDX of CA-AgNPs.Elemental mapping of CA-AgNP sample, (c) O (K) (d) Cl (K) and (e) Ag (L).
Crystals 12 01069 g006
Figure 7. Results of CR dye degradation studies with CA-AgNPs (a) UV–Visible spectra, (b) Degradation %; (c) Ct/Co vis Time graph.
Crystals 12 01069 g007
Figure 8. CR zero-order reaction rate constant and dye degradation after applications; (a) Different doses of 0.05% CA-AgNPs (15, 20, 25 and 30 µL) at constant 5.0 mM NaBH4 concentration; (b) Ct/Co vis Time plots at different CA-AgNPs concentrations; (c) Different concentration of NaBH4 (5, 10, 25 and 50 mM) at constant CA-AgNPs (20 µL, 0.05%); (d) Ct/Co vis Time plots at different NaBH4 concentrations.
Crystals 12 01069 g008
Figure 9. Results of MB dye degradation studies with CA-AgNPs (a) UV–Visible spectra, (b) Degradation %; (c) Ct/Co (%) vis time graph.
Crystals 12 01069 g009
Figure 10. PMB pseudo-zero-order reaction rate constant and dye degradation after applications; (a) Different doses of 0.05% CA-AgNPs (15, 20, 25 and 30 µL) at constant 5.0 mM NaBH4 concentration; (b) Ct/Co vis Time plots at different CA-AgNPs concentrations; (c) Different concentration of NaBH4 (5, 10, 25 and 50 mM) at constant CA-AgNPs (20 µL, 0.05%); (d) Ct/Co vis Time plots at different NaBH4 concentrations.
Crystals 12 01069 g010
Figure 11. Chemical kinetic linear equation model after using CA-AgNPs and NaBH4; For CR degradation kinetic, zero-order (a), first-order (b), second-order (c); For MB degradation at zero-order (d), first-order (e) and second-order (f).
Crystals 12 01069 g011
Figure 12. Schematic representation of the plausible speculation of the mechanism behind the synergistic CA-AgNPs and NaBH4 mode of action for the degradation of CR and MB dyes.
Crystals 12 01069 g012
Figure 13. Consolidated graph showing the comparative degradation of two dyes using CA-AgNPs.
Crystals 12 01069 g013
Table 1. Experimental proportions set for dye degradation test.
DyeIonic PhaseDye Conc. (mM)Volume of Dye (μL)Dye ppm in UV CuvetteVolume of H2O (mL)Volume of NaBH4 (5.0 mM) (mL)Volume of CA-AgNPs(0.05%) (μL)Reduction Time (min)
CRAnionic1.0 30063.151.7000.9901036
MBCationic1.0 10010.251.9000.980 2032
Table 2. Different linear equation models and their respective regression coefficient (R2) values and rate constantsfor CR and MB dye after applying CA-AgNPs (0.05%) and NaBH4 (5.0 mM).
S. No.Chemical Kinetic ModelLinear Equation
Model
Dye
CRMB
Regression Coefficient (R2) ValueRate ConstantRegression Coefficient (R2) ValueRate Constant
1Zero order C o     C t = kt 0.99050.0311
(mol.L−1.min−1)
0.93280.0431
(mol.L−1.min−1)
2First order ln ( C t C o ) = kt 0.81110.0715 (min−1)0.74910.1090 (min−1)
3Second order 1 C t 1 C o = kt 0.44460.2645
(L.mol−1.min−1)
0.51670.5196
(L.mol−1.min−1)
Table 3. Comparison of catalytic activity efficiency of CA-AgNPs for dye degradations.
S. NoPlant Used for NPs SynthesisMetal NPs/Electron Donor NaBH4Degradation %Degradation TimeReferences
1Terminalia arjunaAgMB (93.60%), CR (92.20%),19 min for MB, 14 min for CR[24]
2Fruit extract of Gmelina arboreaAgMB (100%)30 min[66]
3Imperata cylindrica aqueous extractAgMB (92.06%)14 min[34]
4Zingiber officinale aqueous extractAgMB (99.9%)10 min[67]
5Phoenix Dactylifera L. a queous Leaves ExtractAg/Ag2OCR (80%), MB (84.60%)60 min for CR
50 min for MB
[68]
6Caralluma acutangulaAgCR (95.24%) and MB (96.72%)36 min for CR
32 min for MB
This reported work
Publisher’s Note: MDPI stays neutral with regard to jurisdictional claims in published maps and institutional affiliations.

