
Titanite Spectroscopy and In Situ LA-ICP-MS U–Pb Geochronology of Mogok, Myanmar


Abstract
:1. Introduction
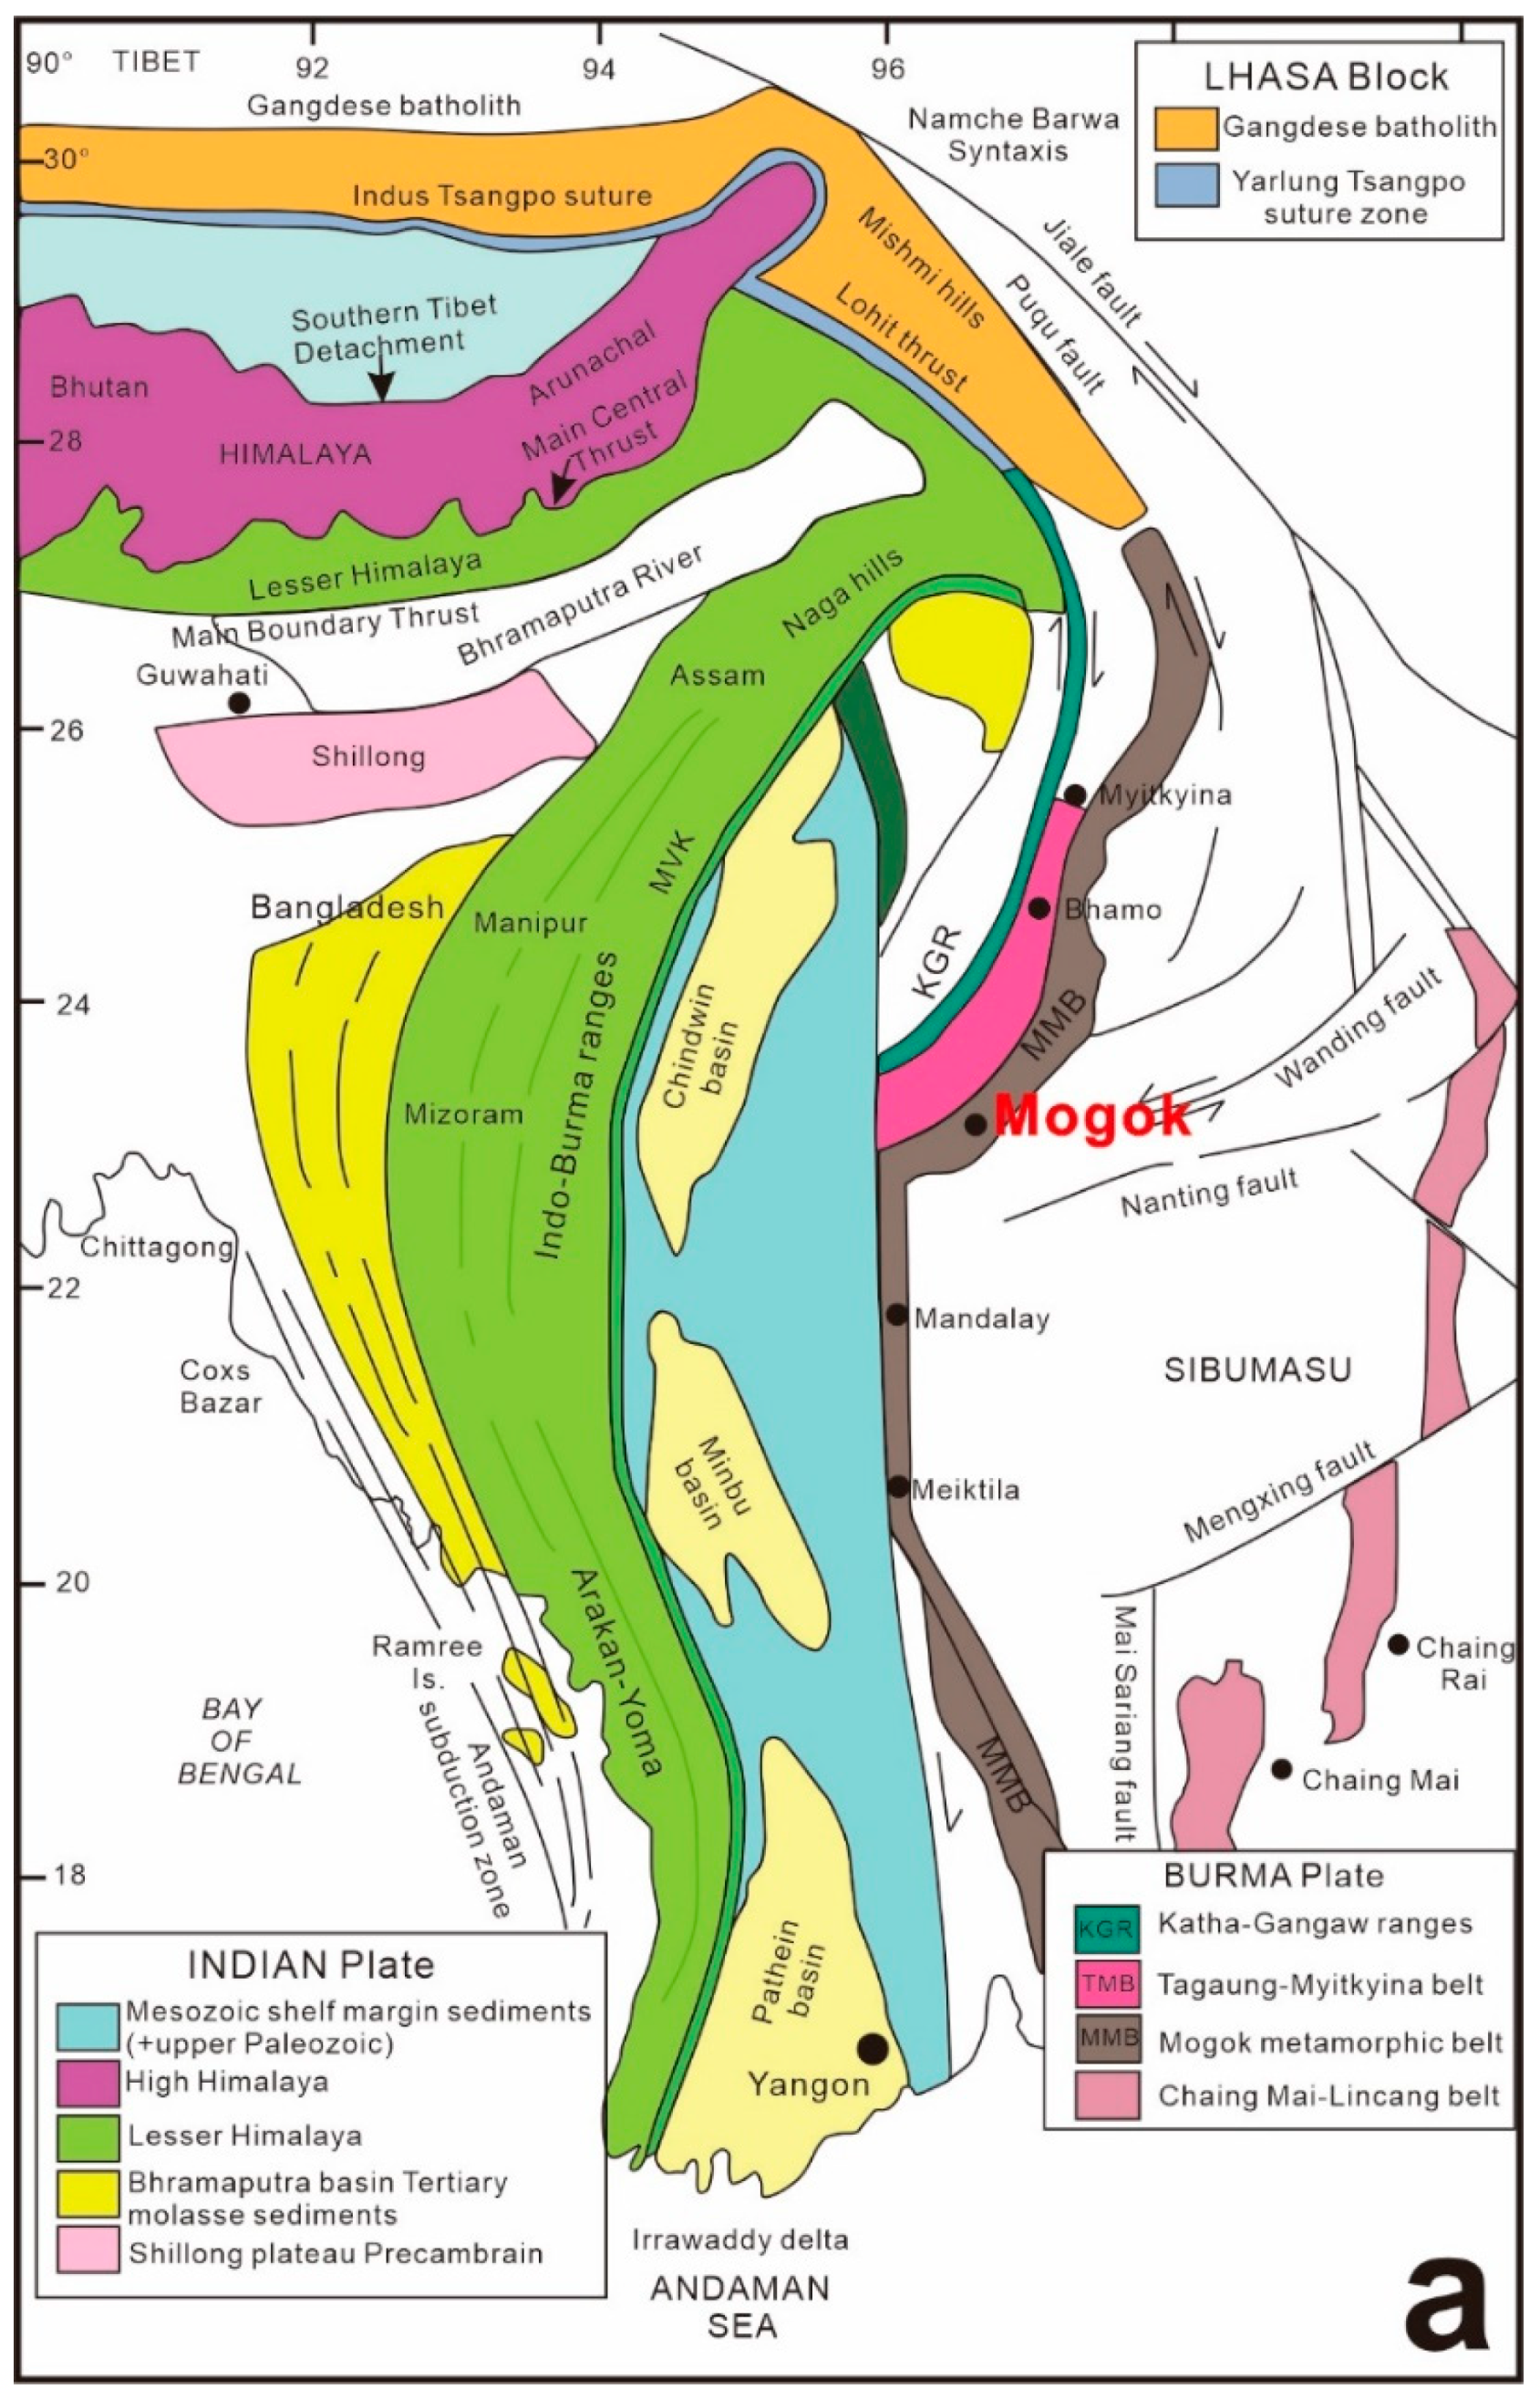
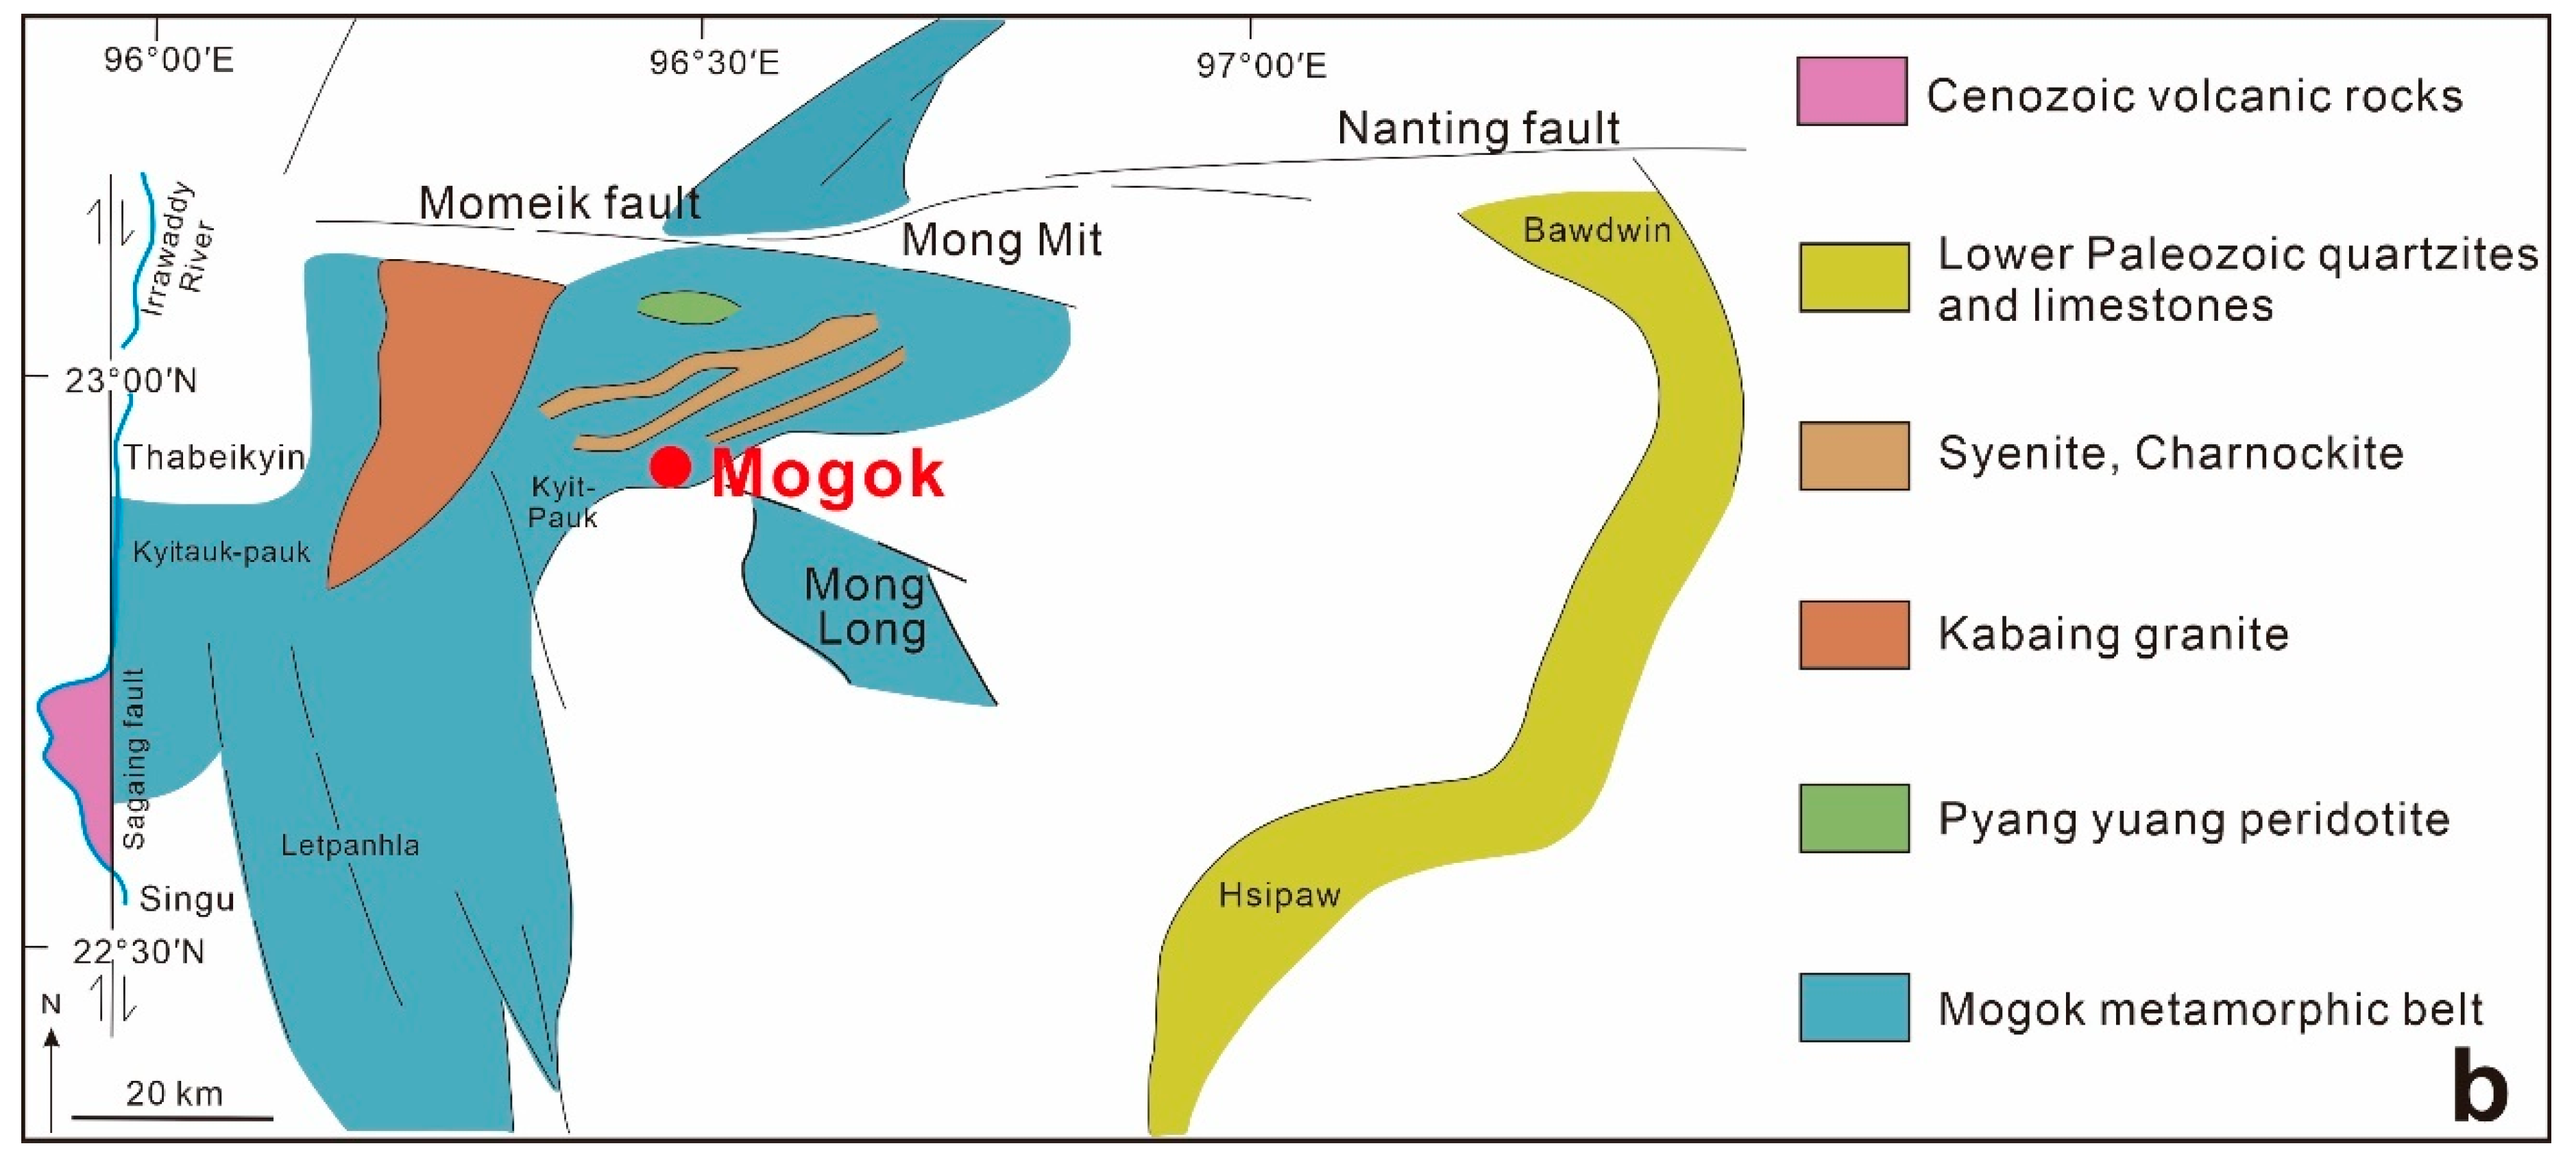
2. Geological Setting
3. Materials and Methods
4. Results
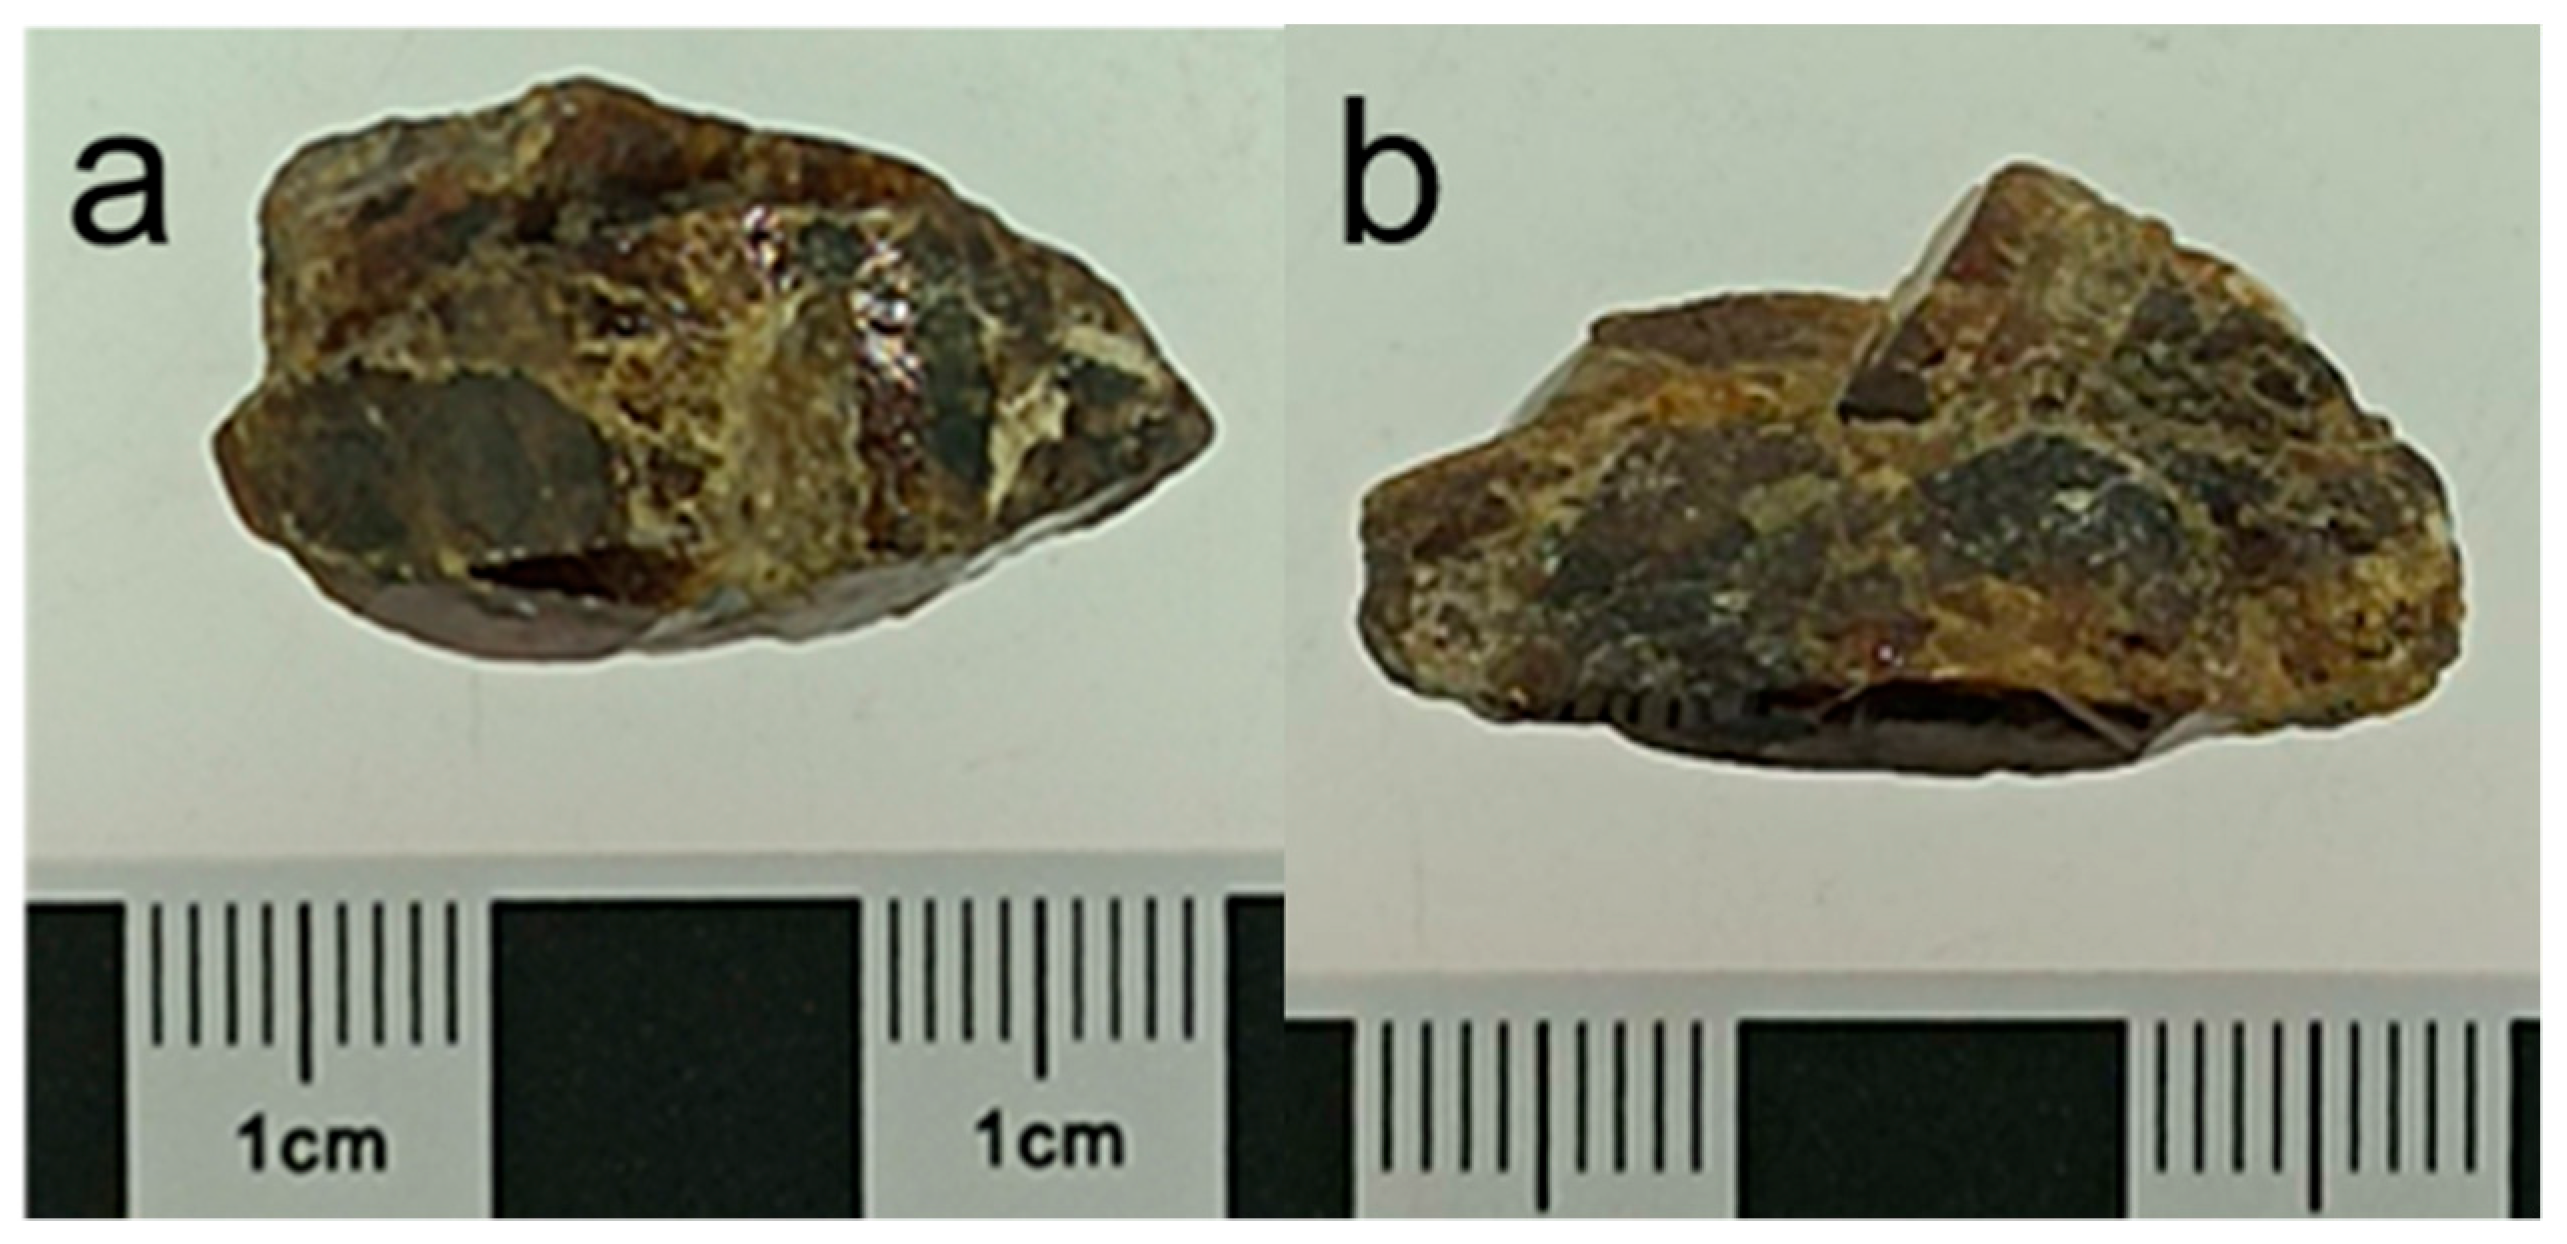
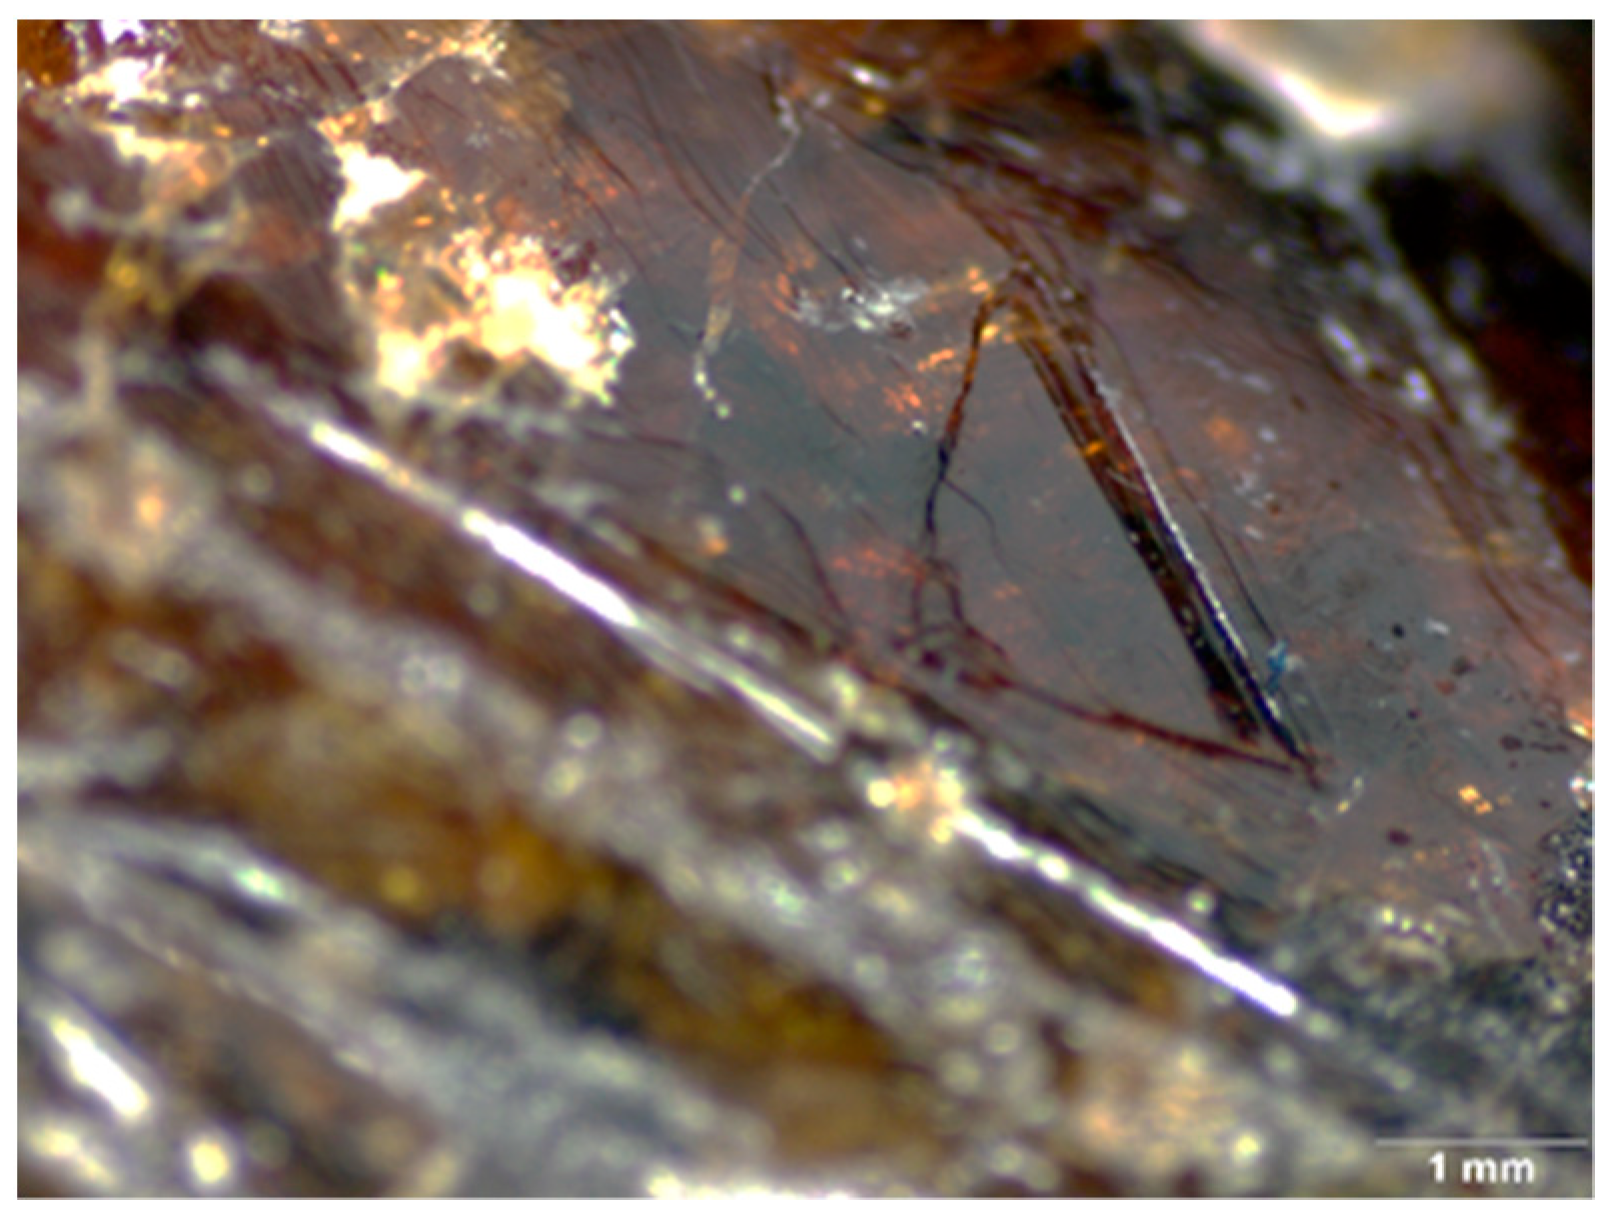
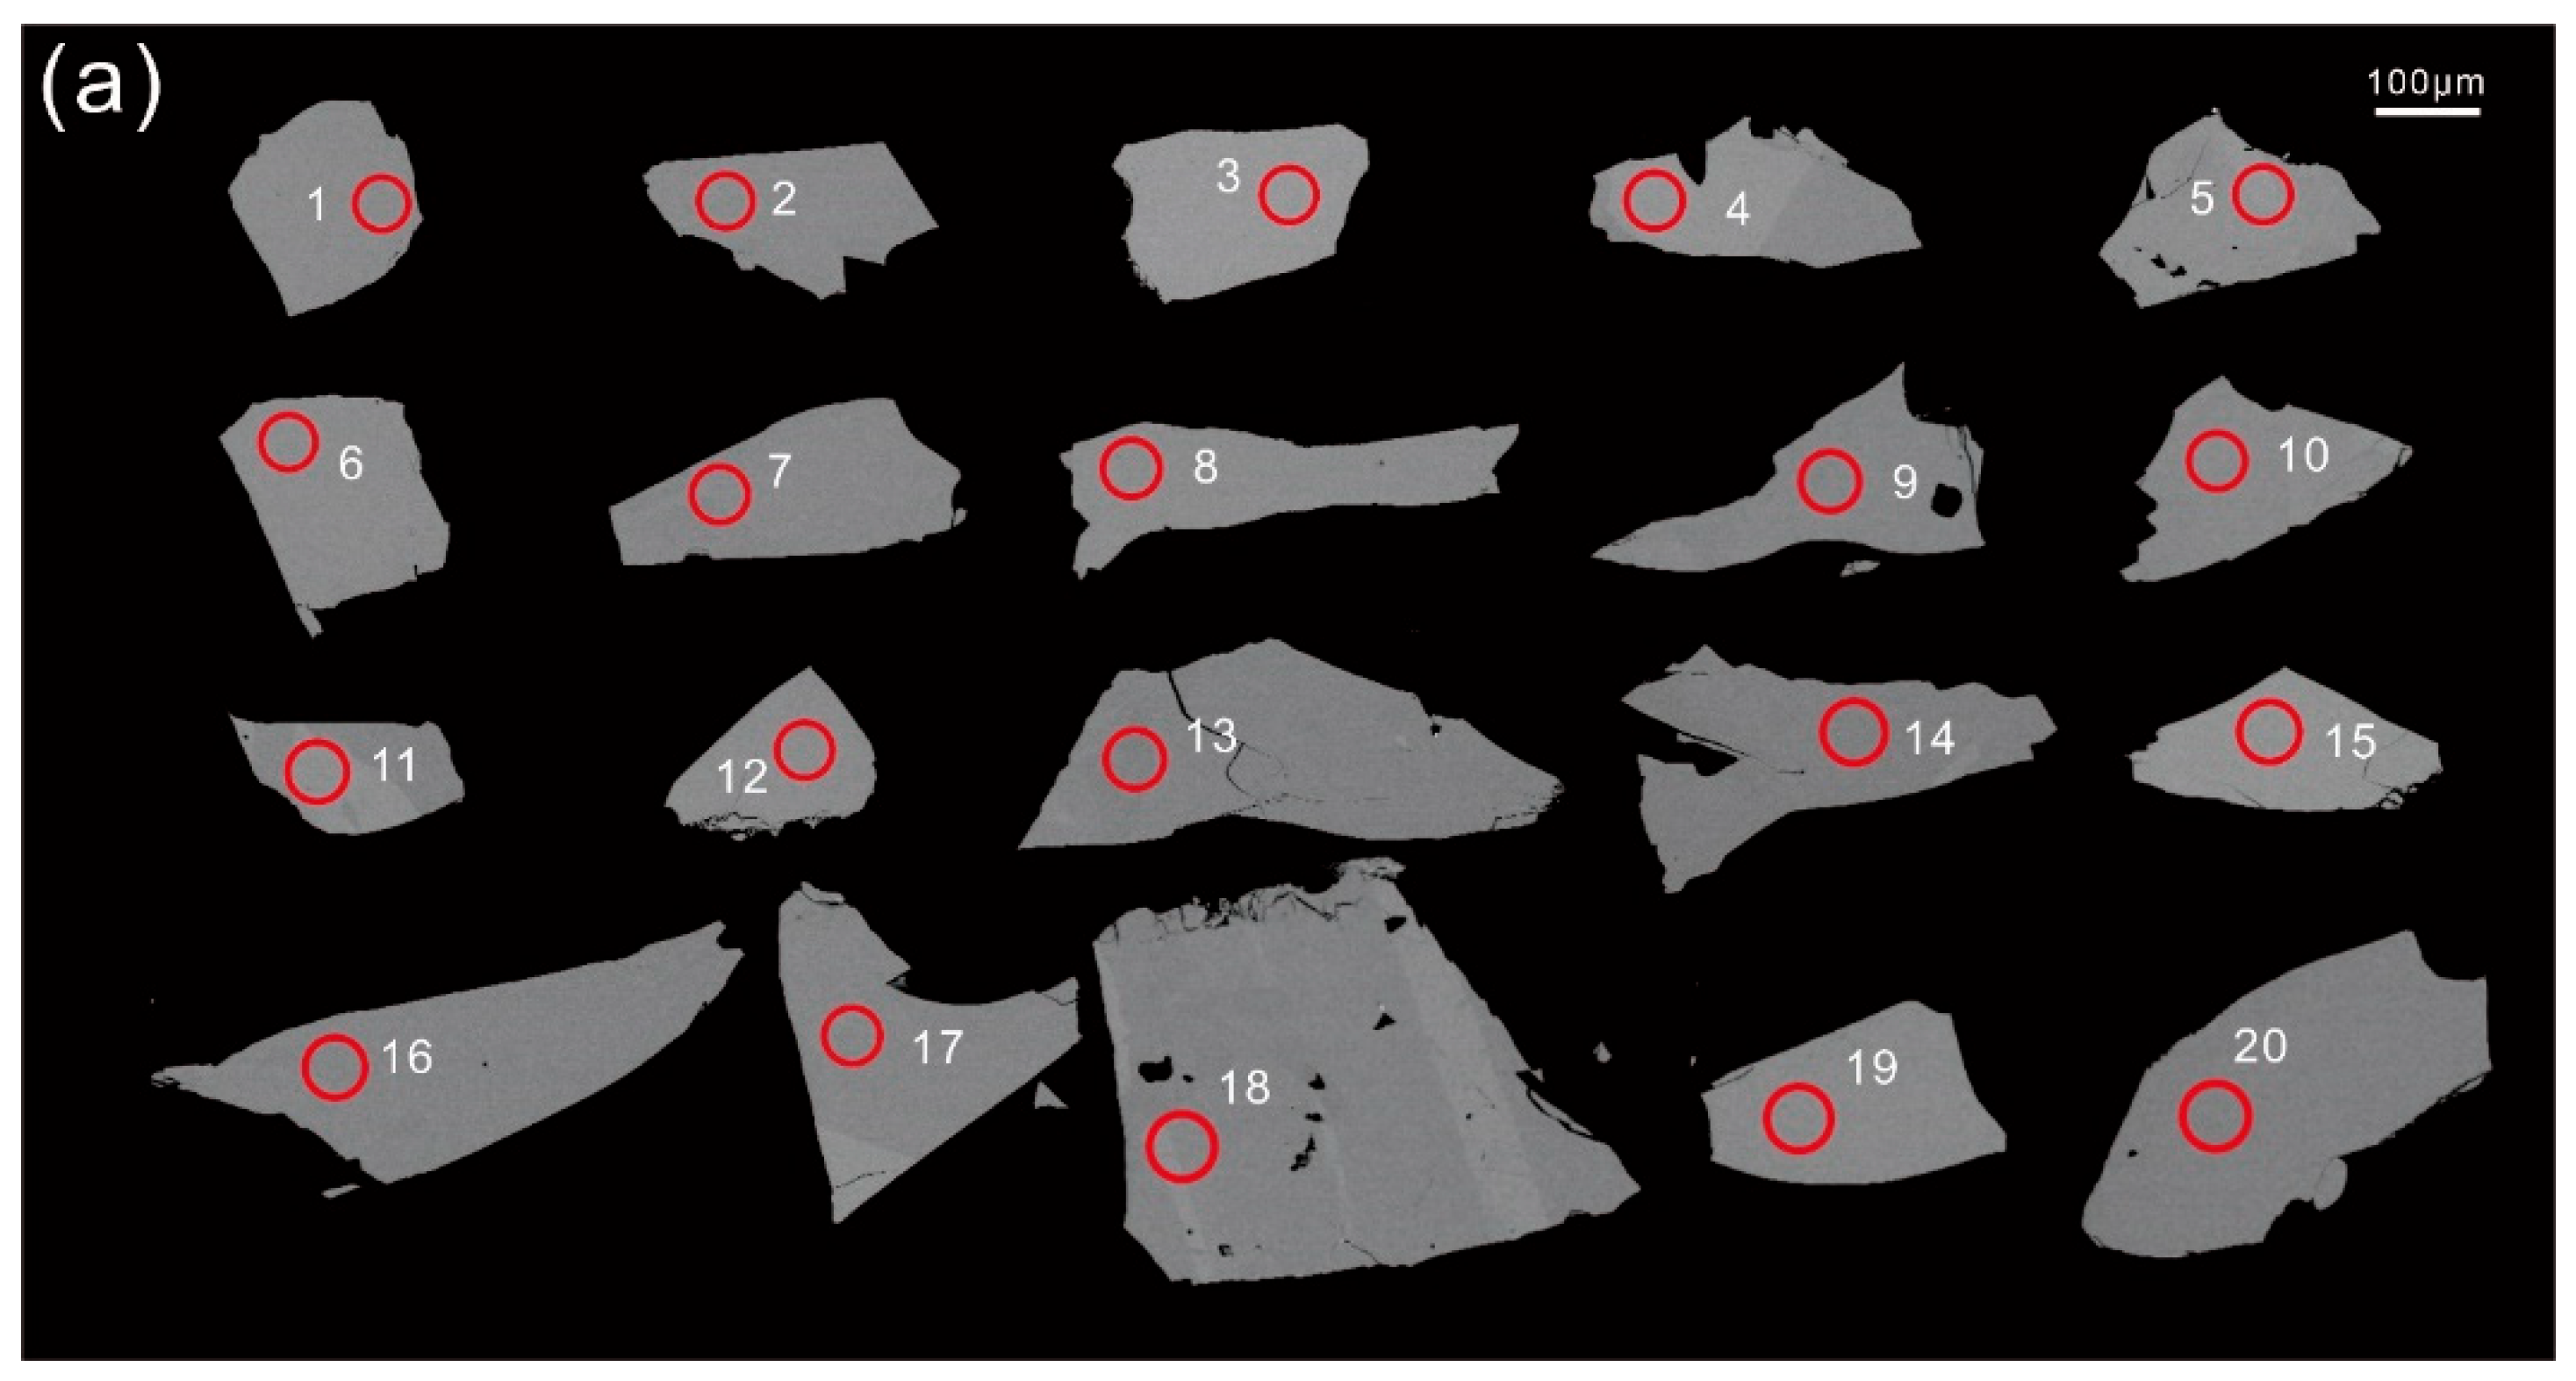
4.1. Visual Appearance and Gemmological Properties
4.2. Spectral Characteristics
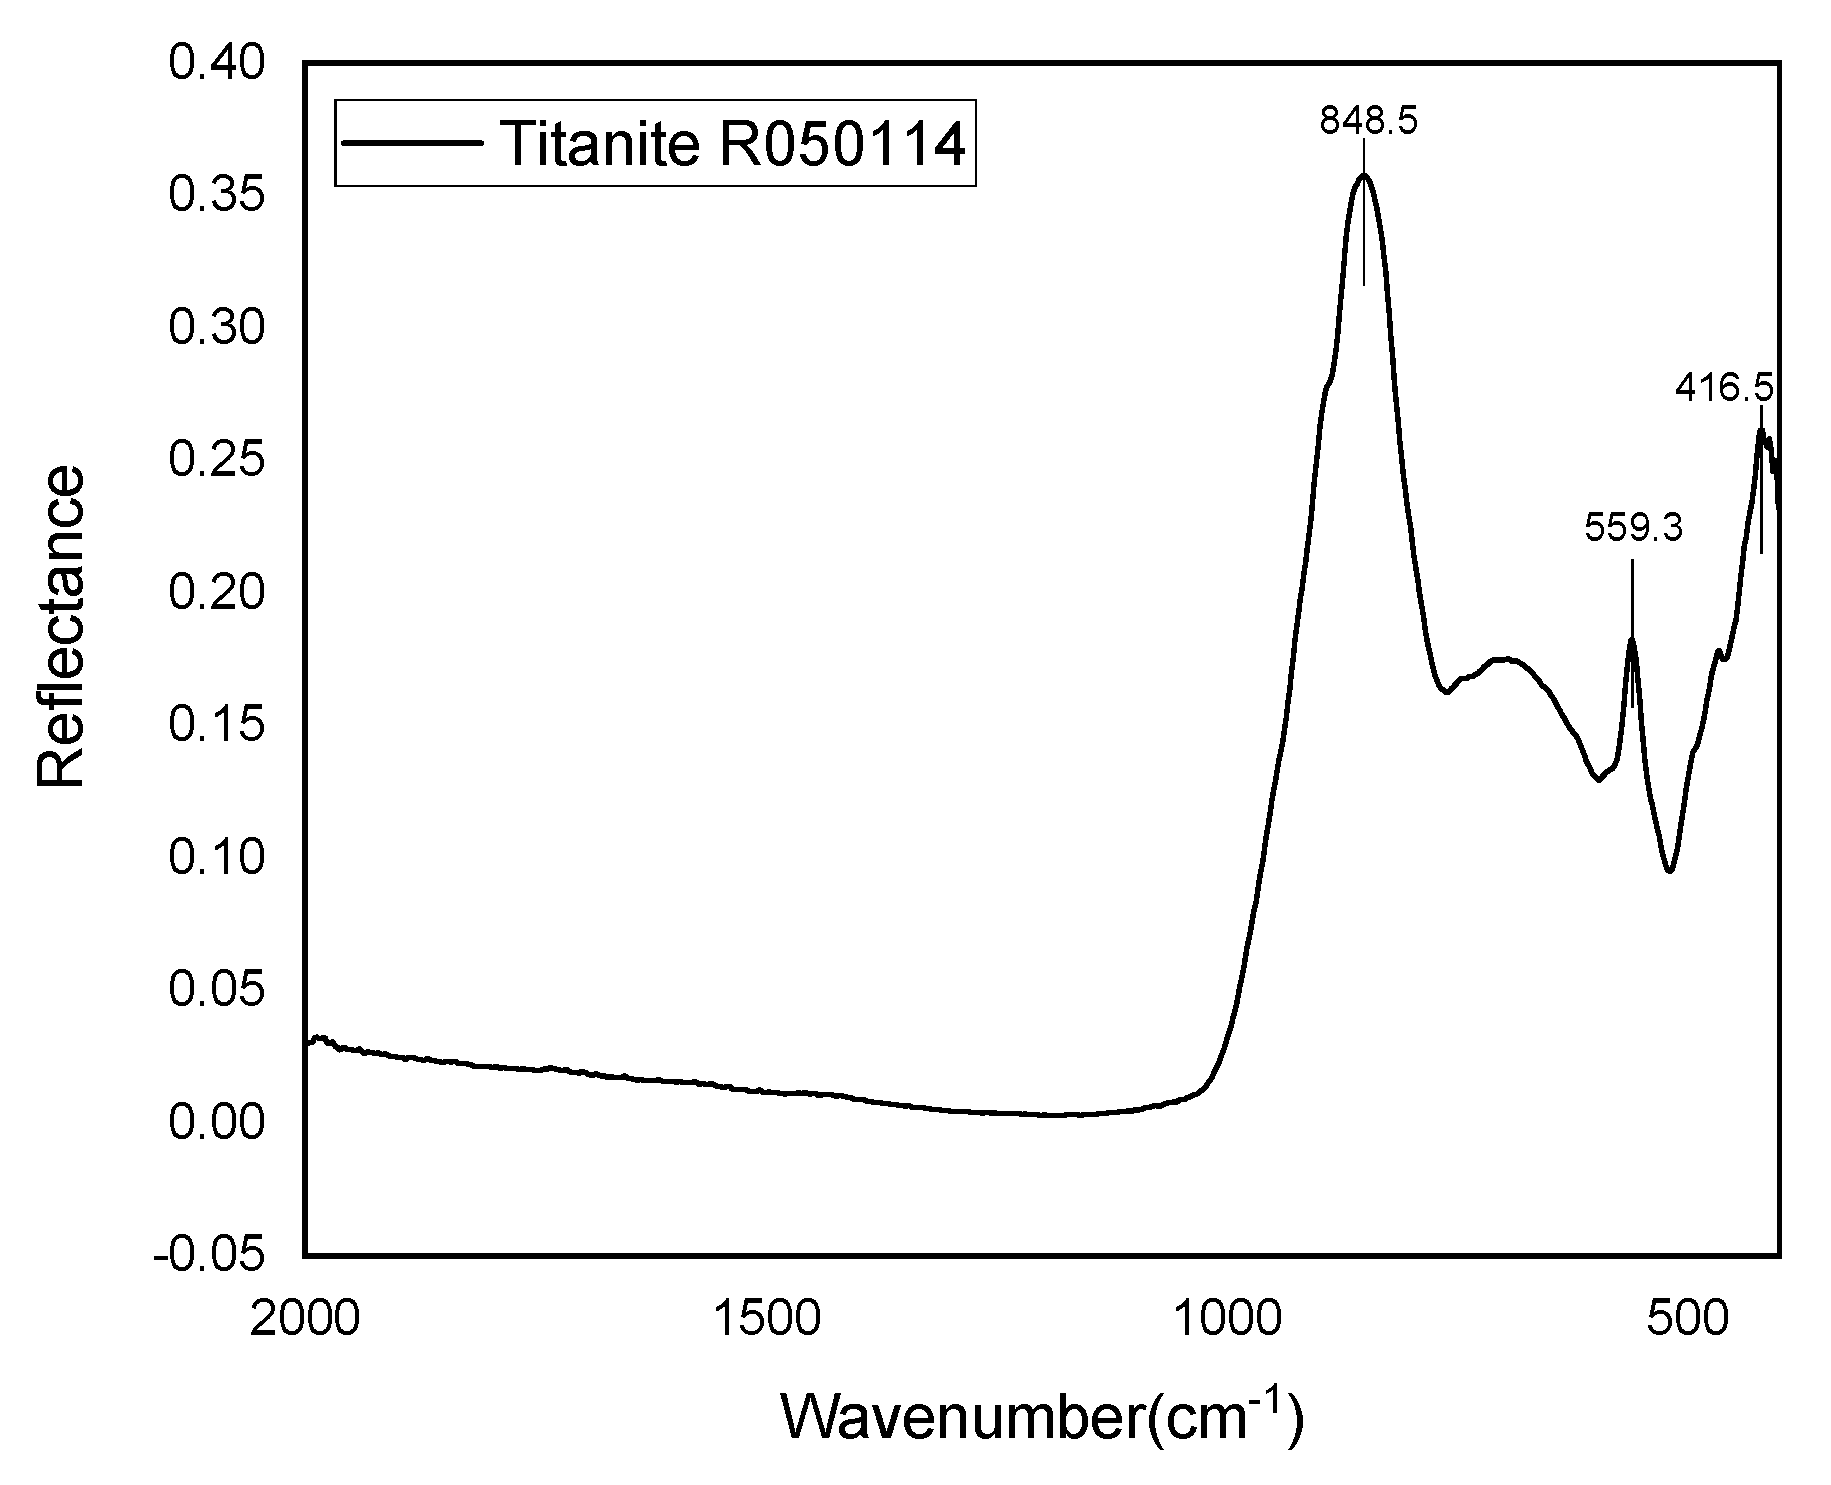
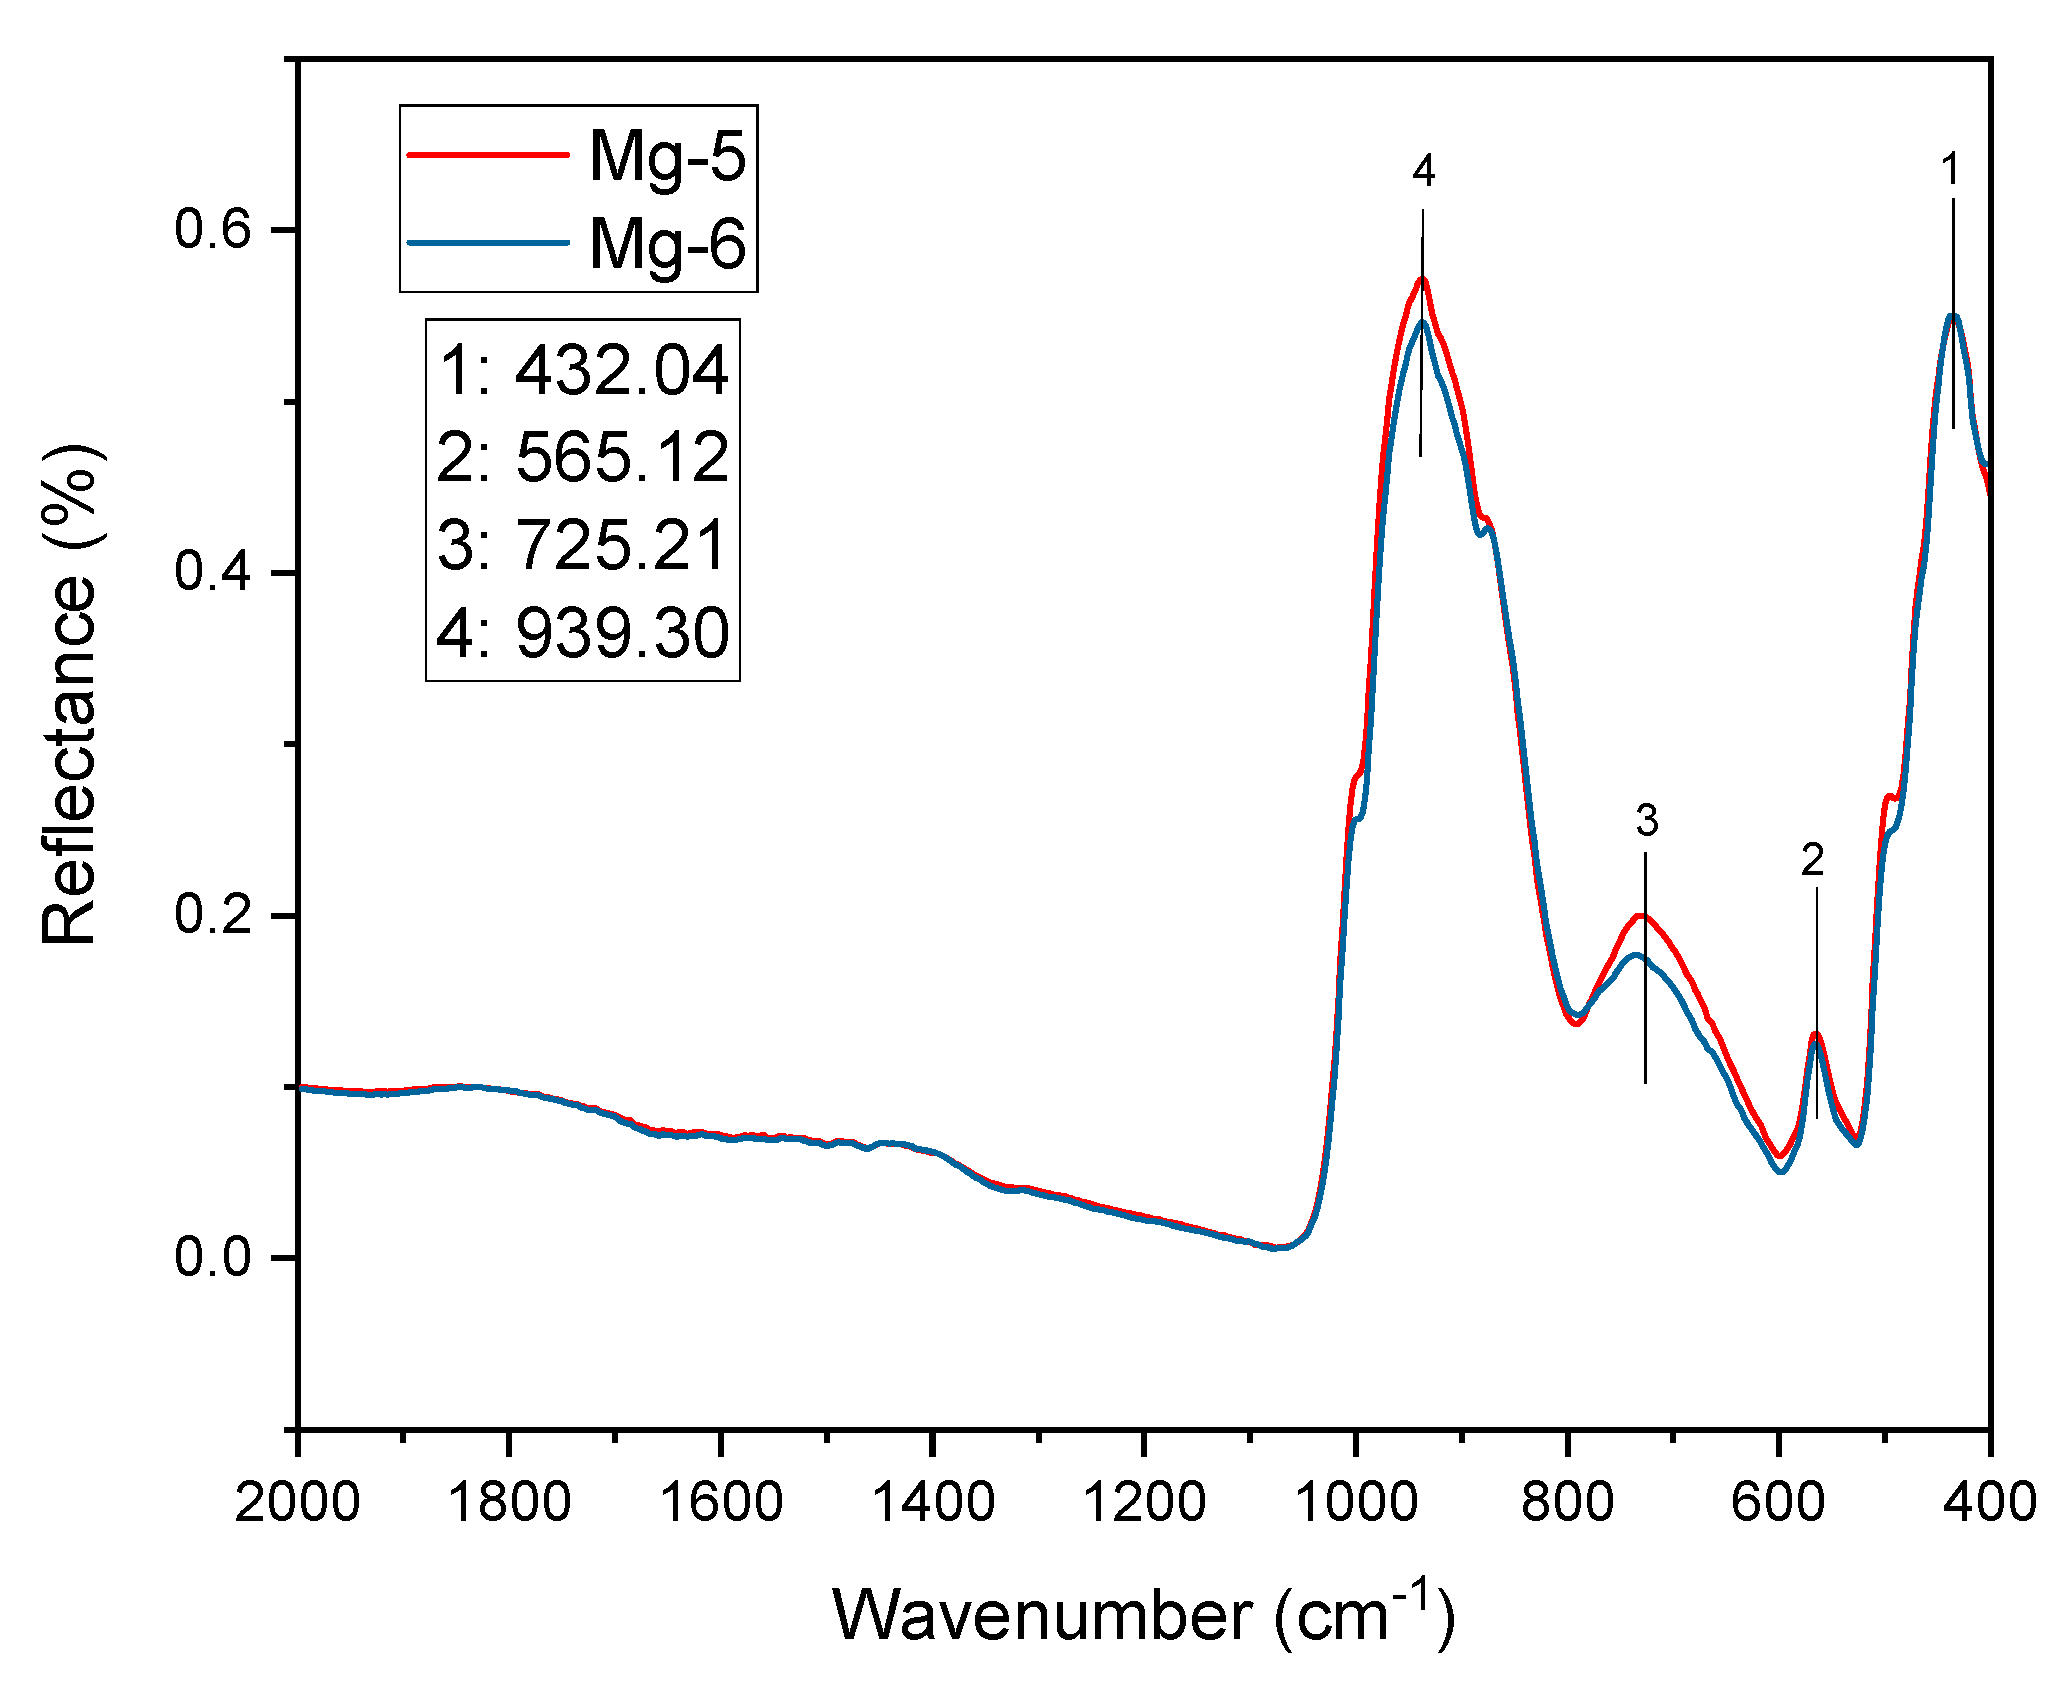
4.2.1. Fourier Transform Infrared Spectrum
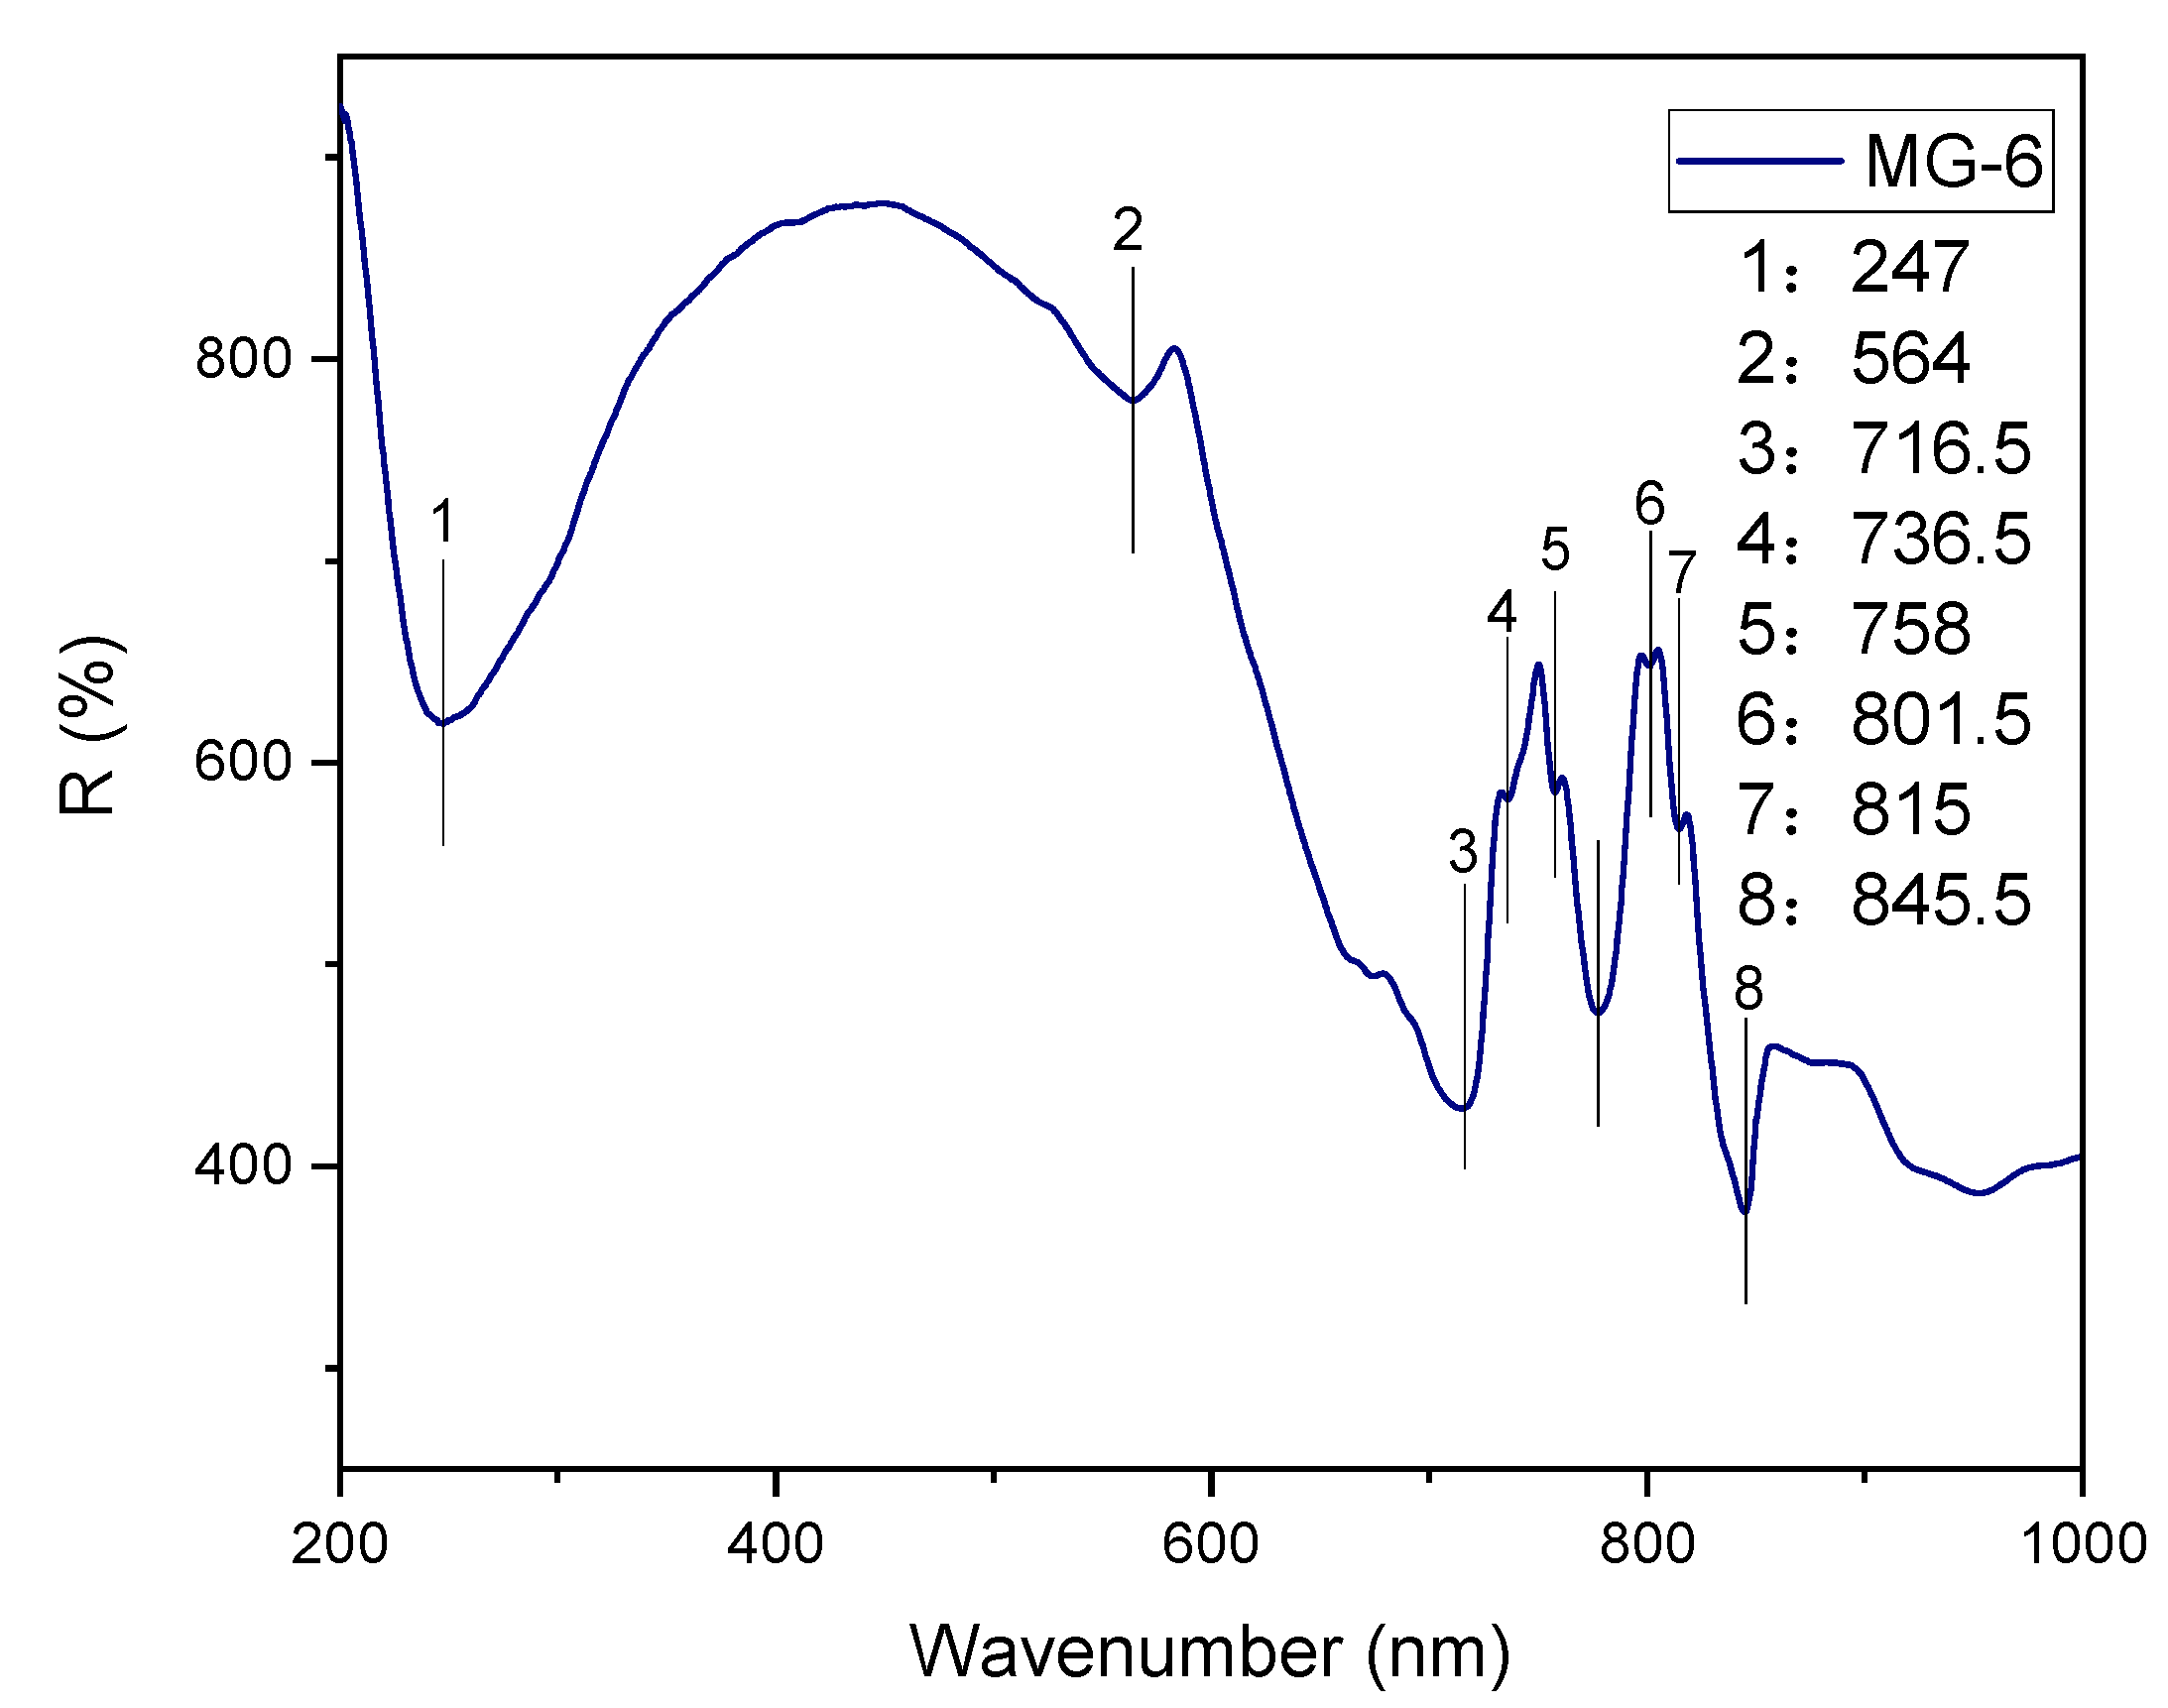
4.2.2. UV–Vis Spectrum
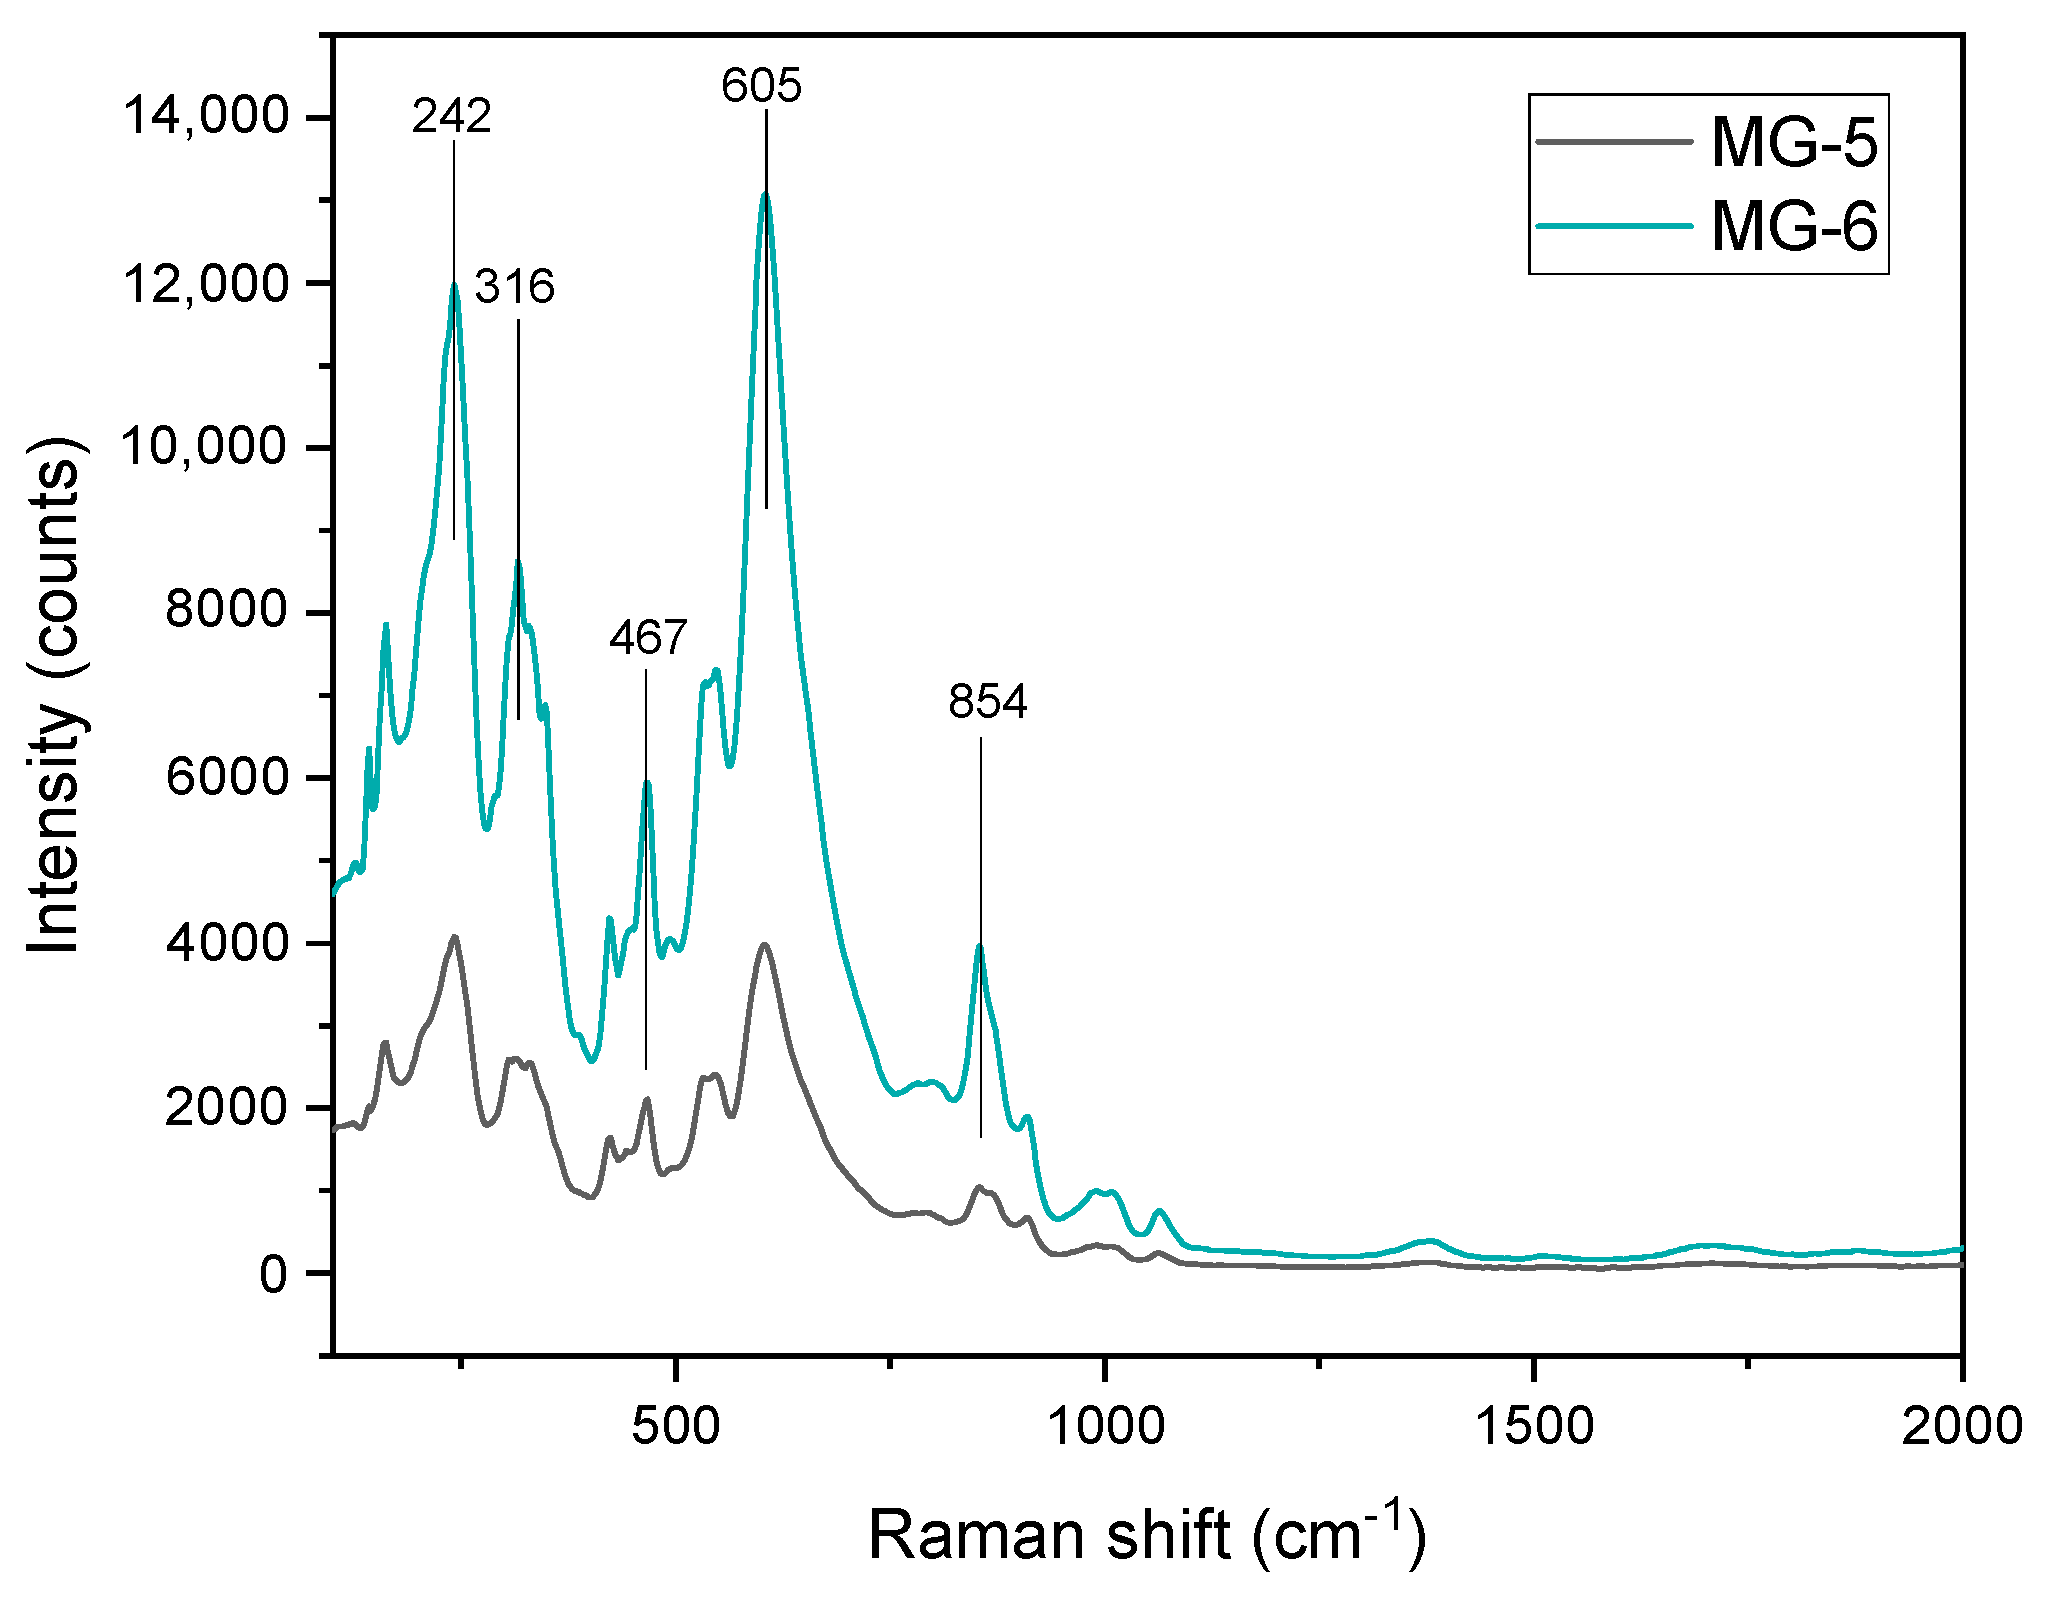
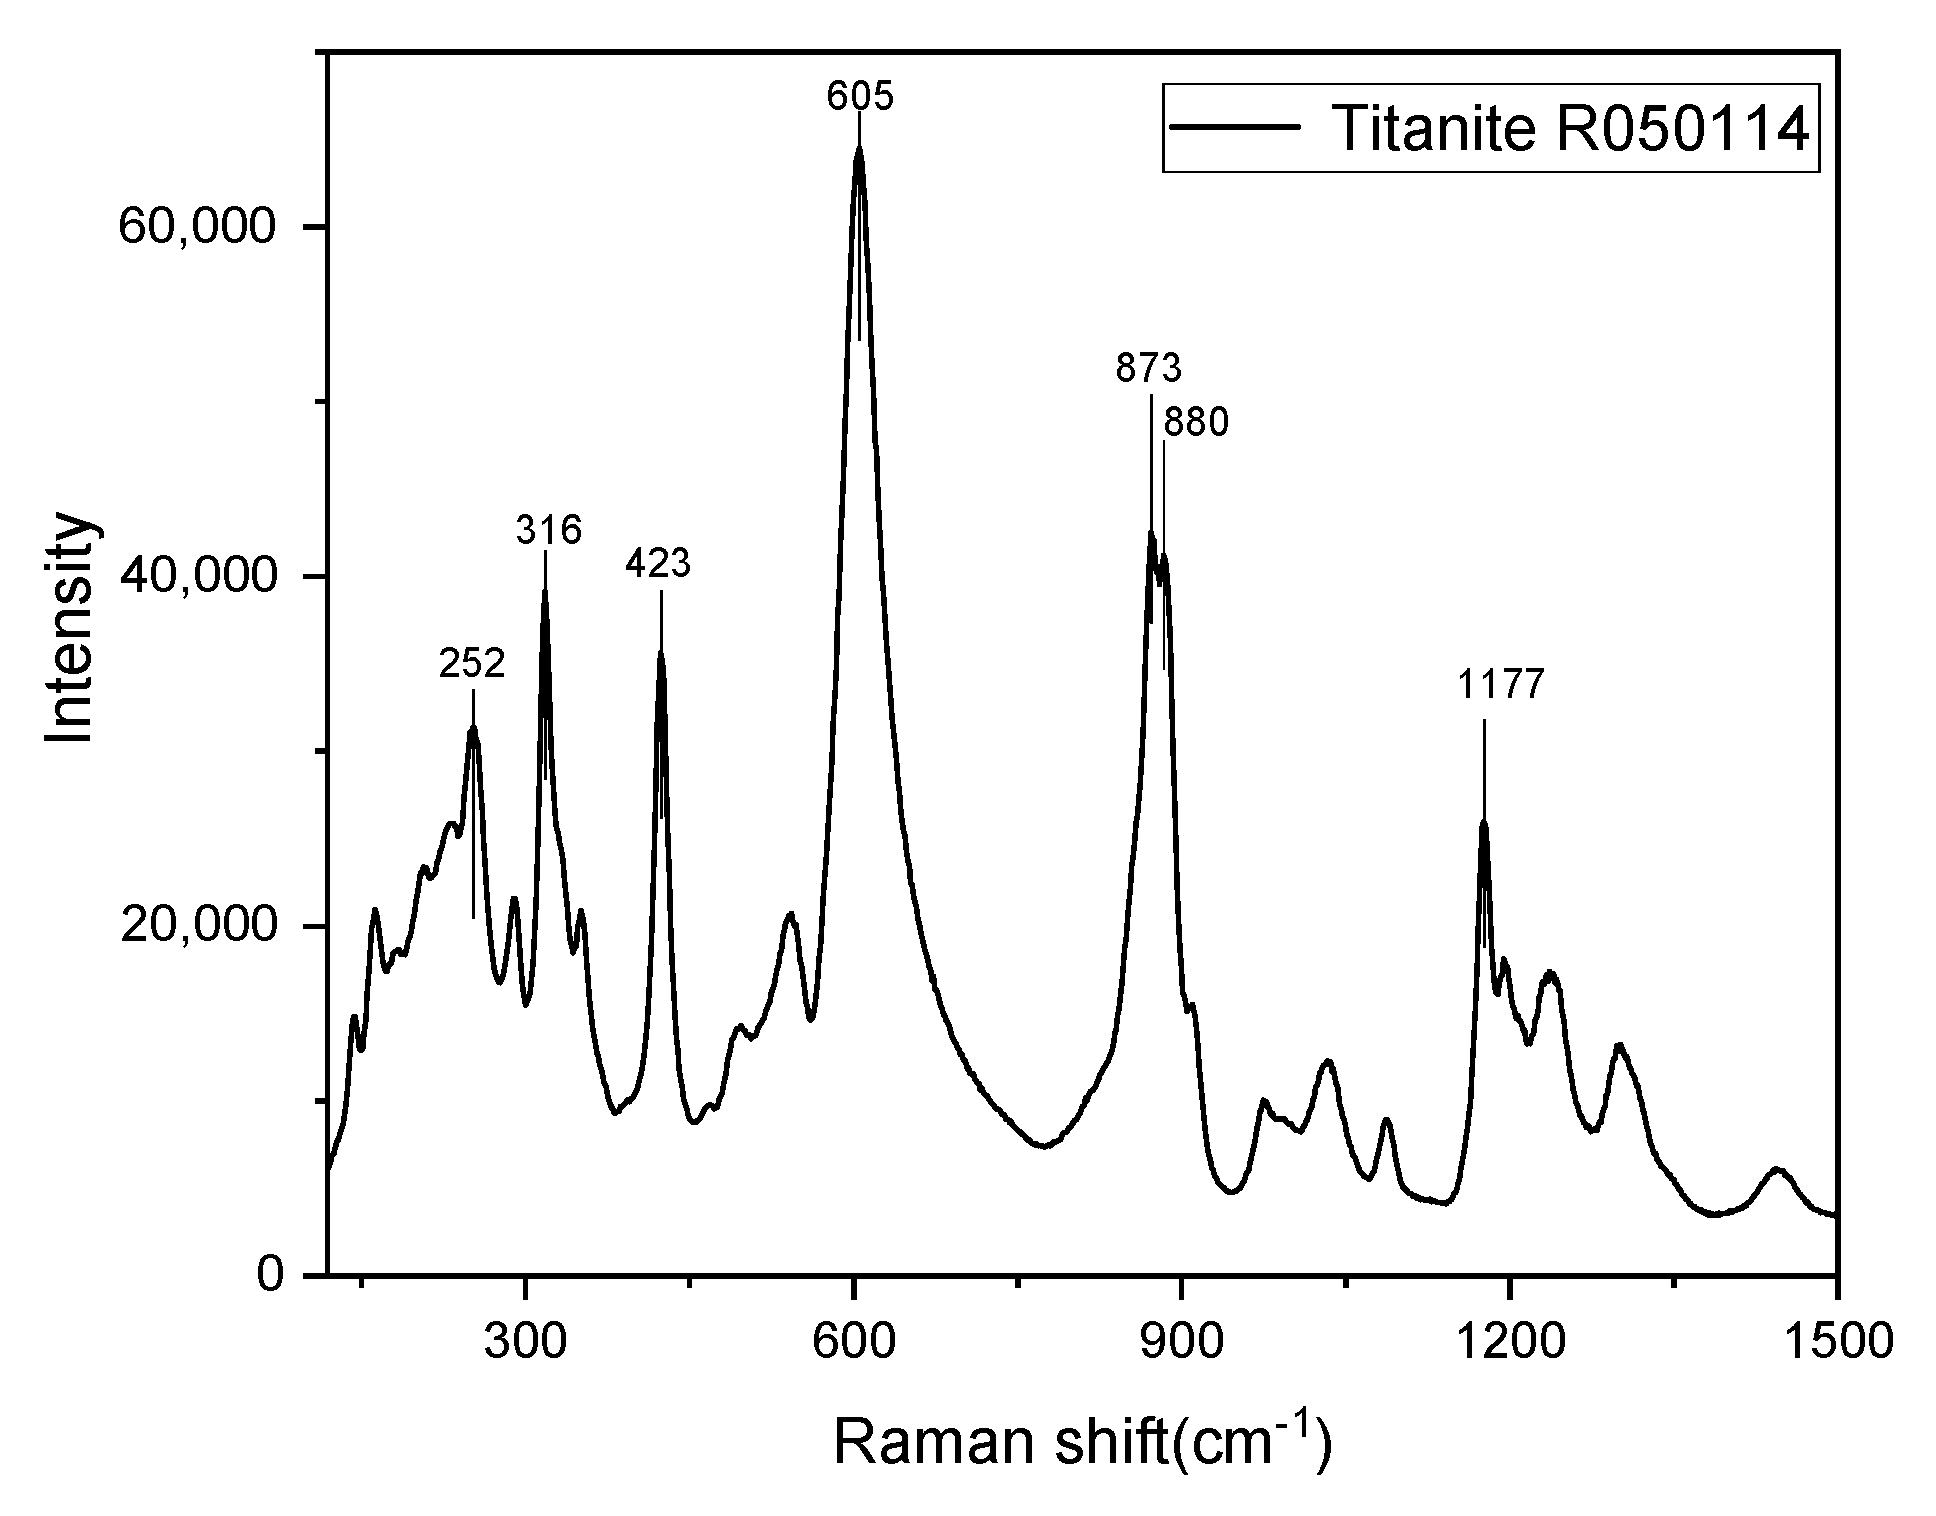
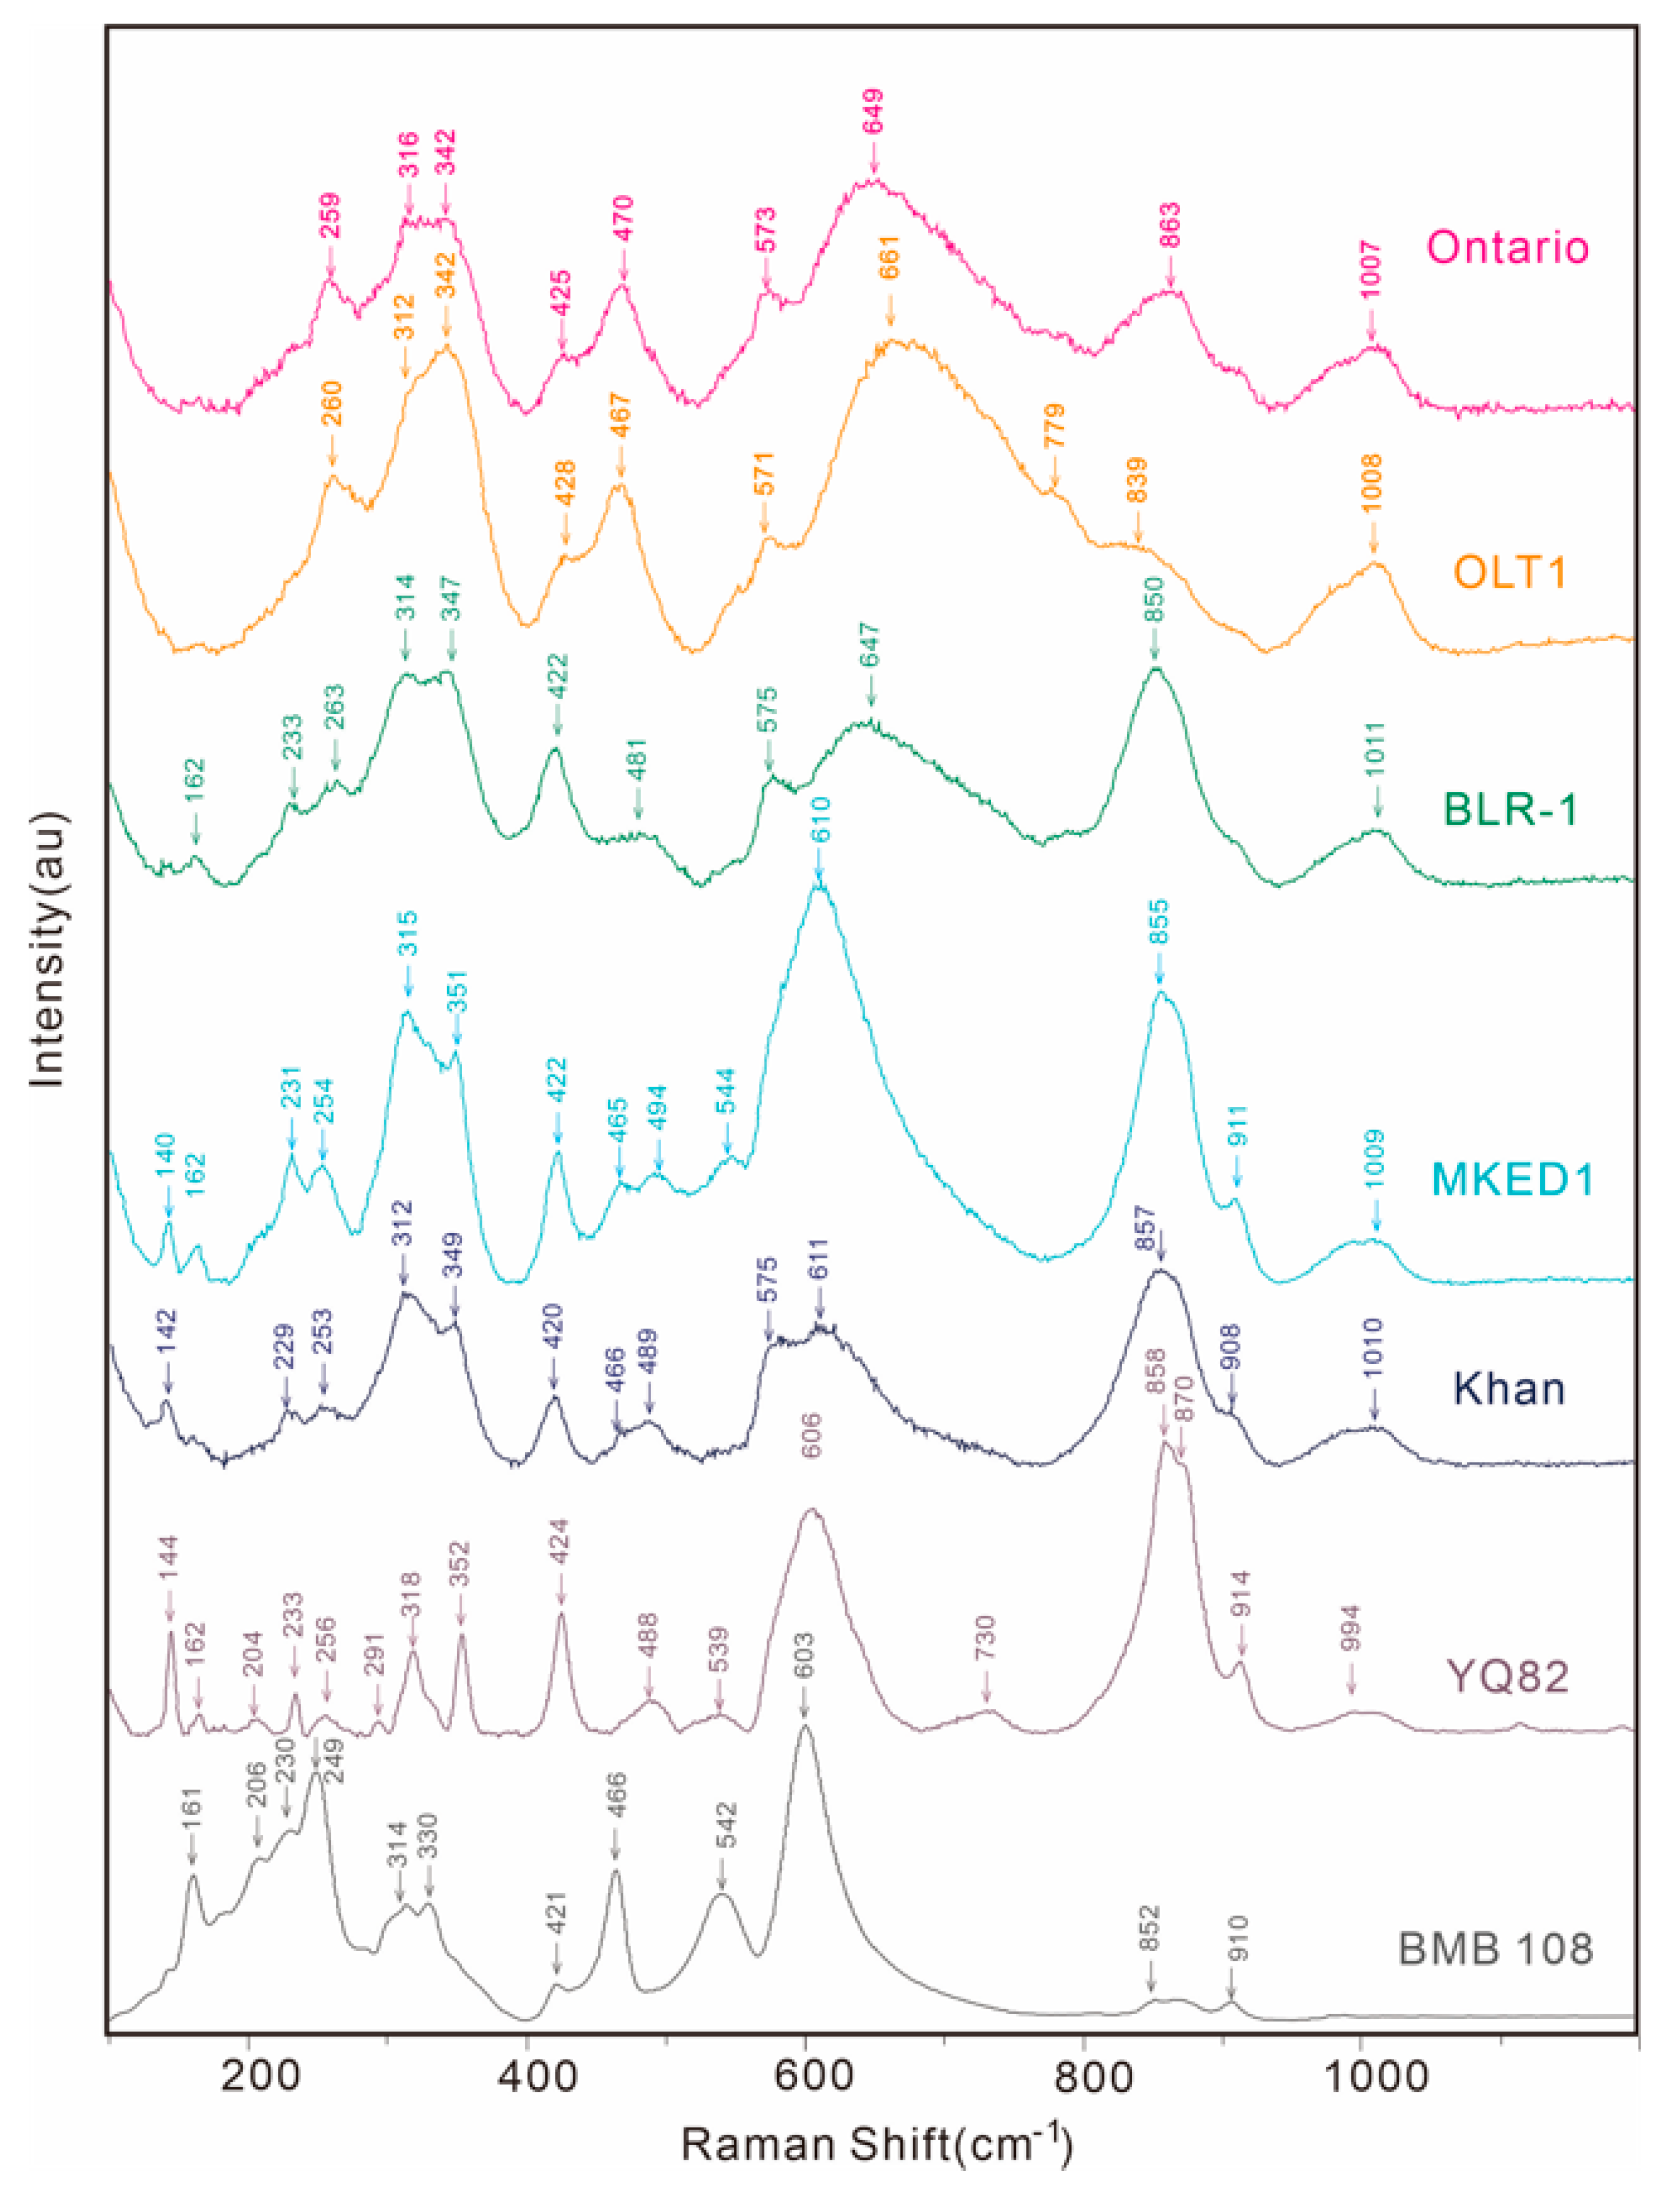
4.2.3. Raman Spectrum
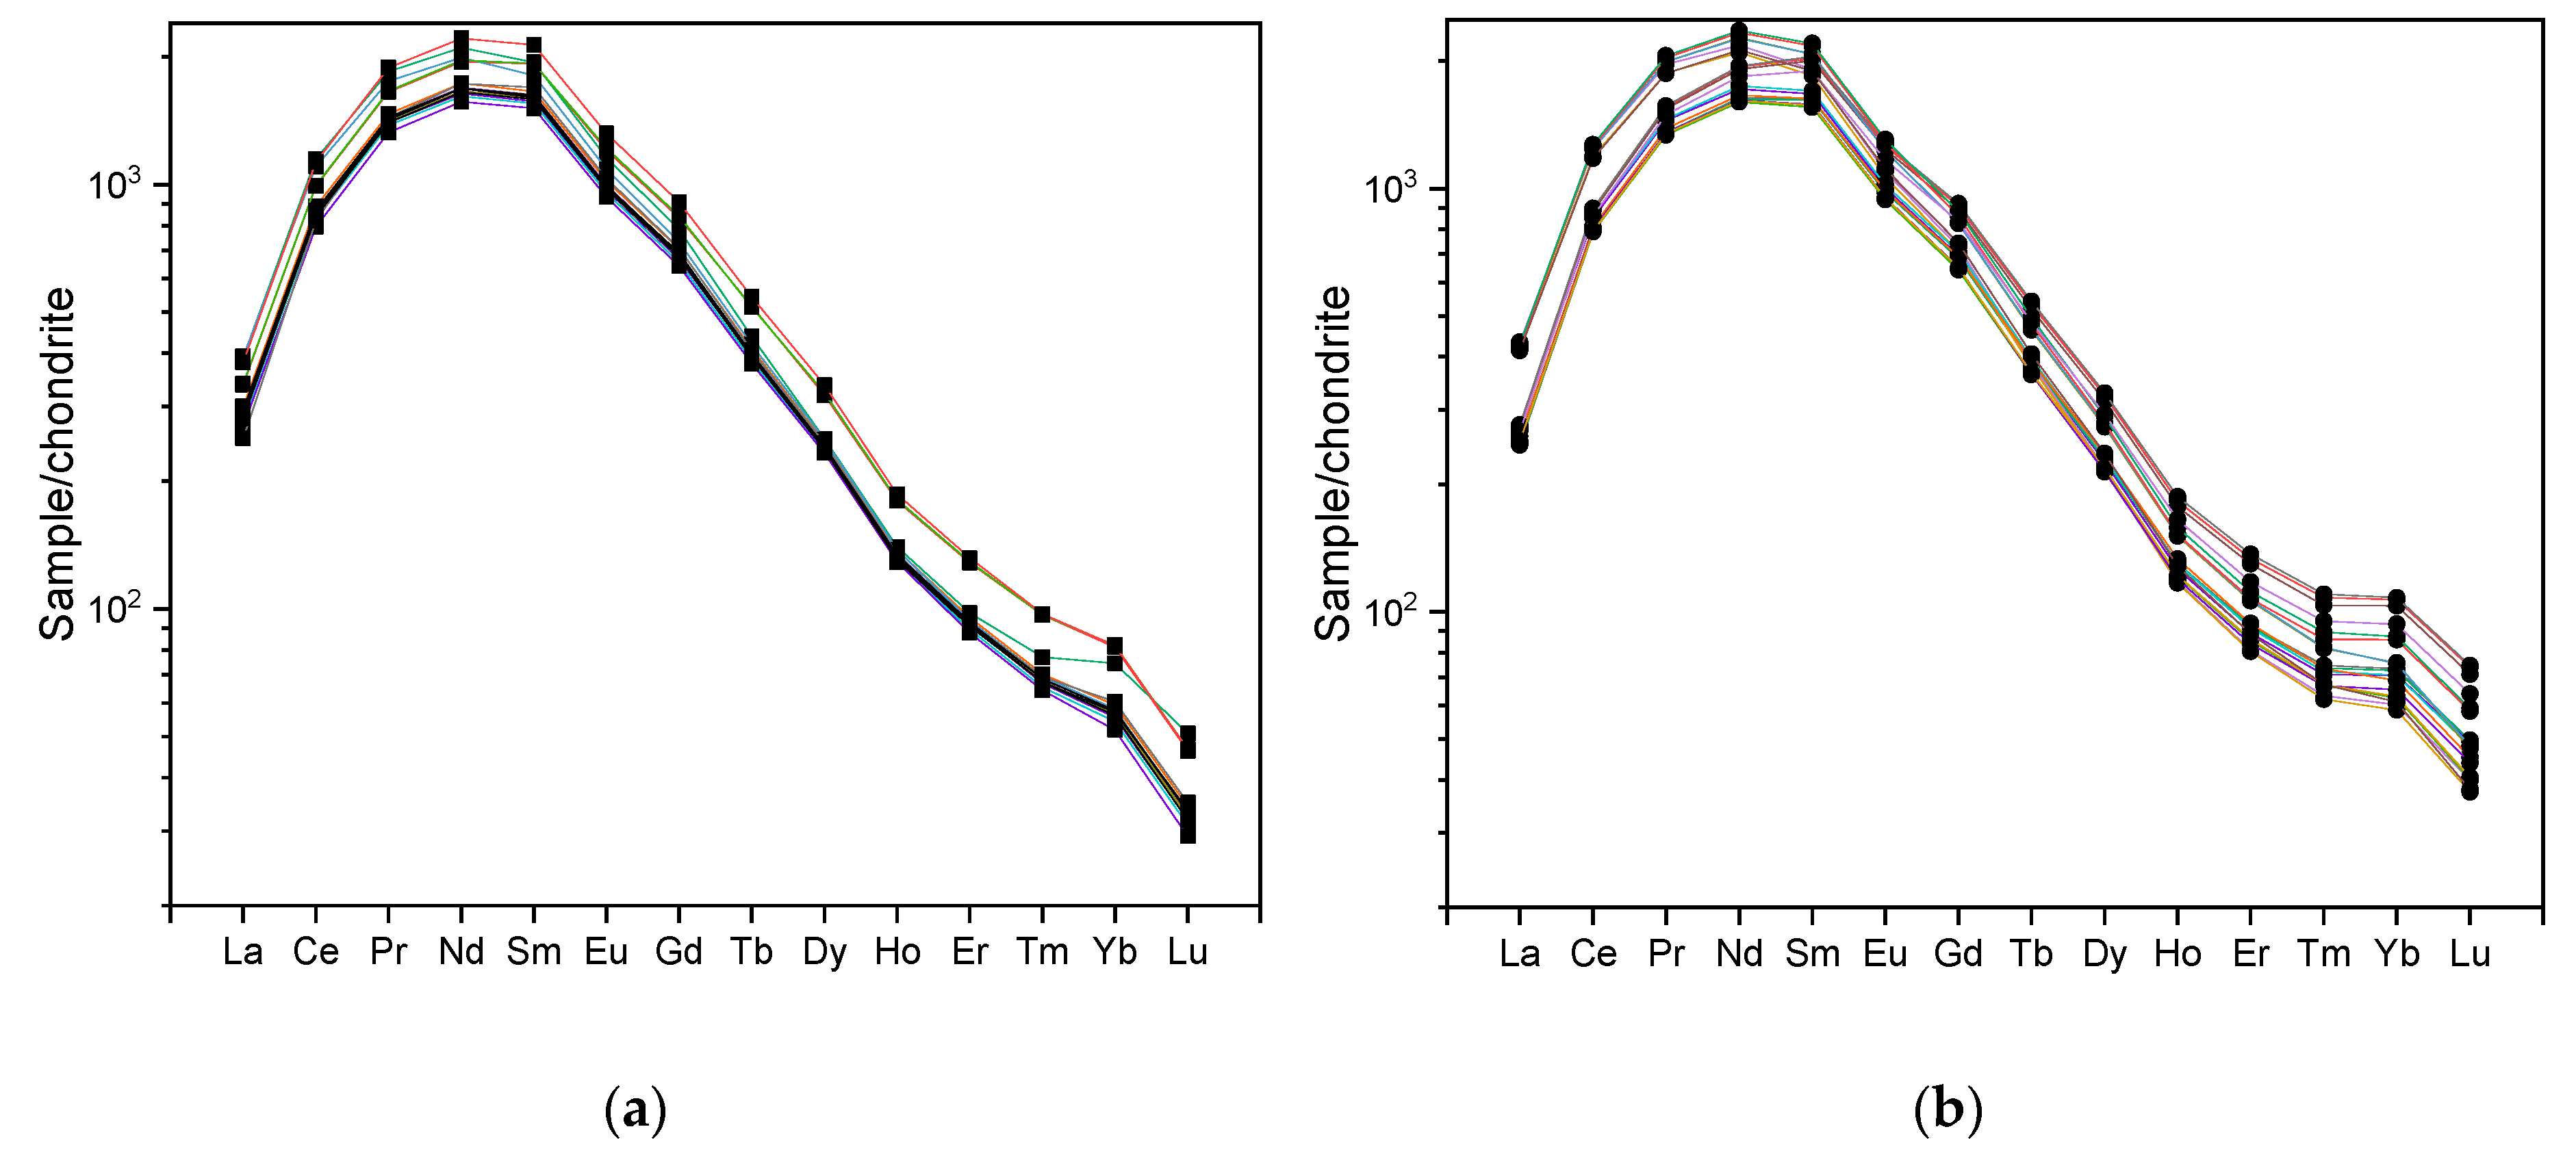
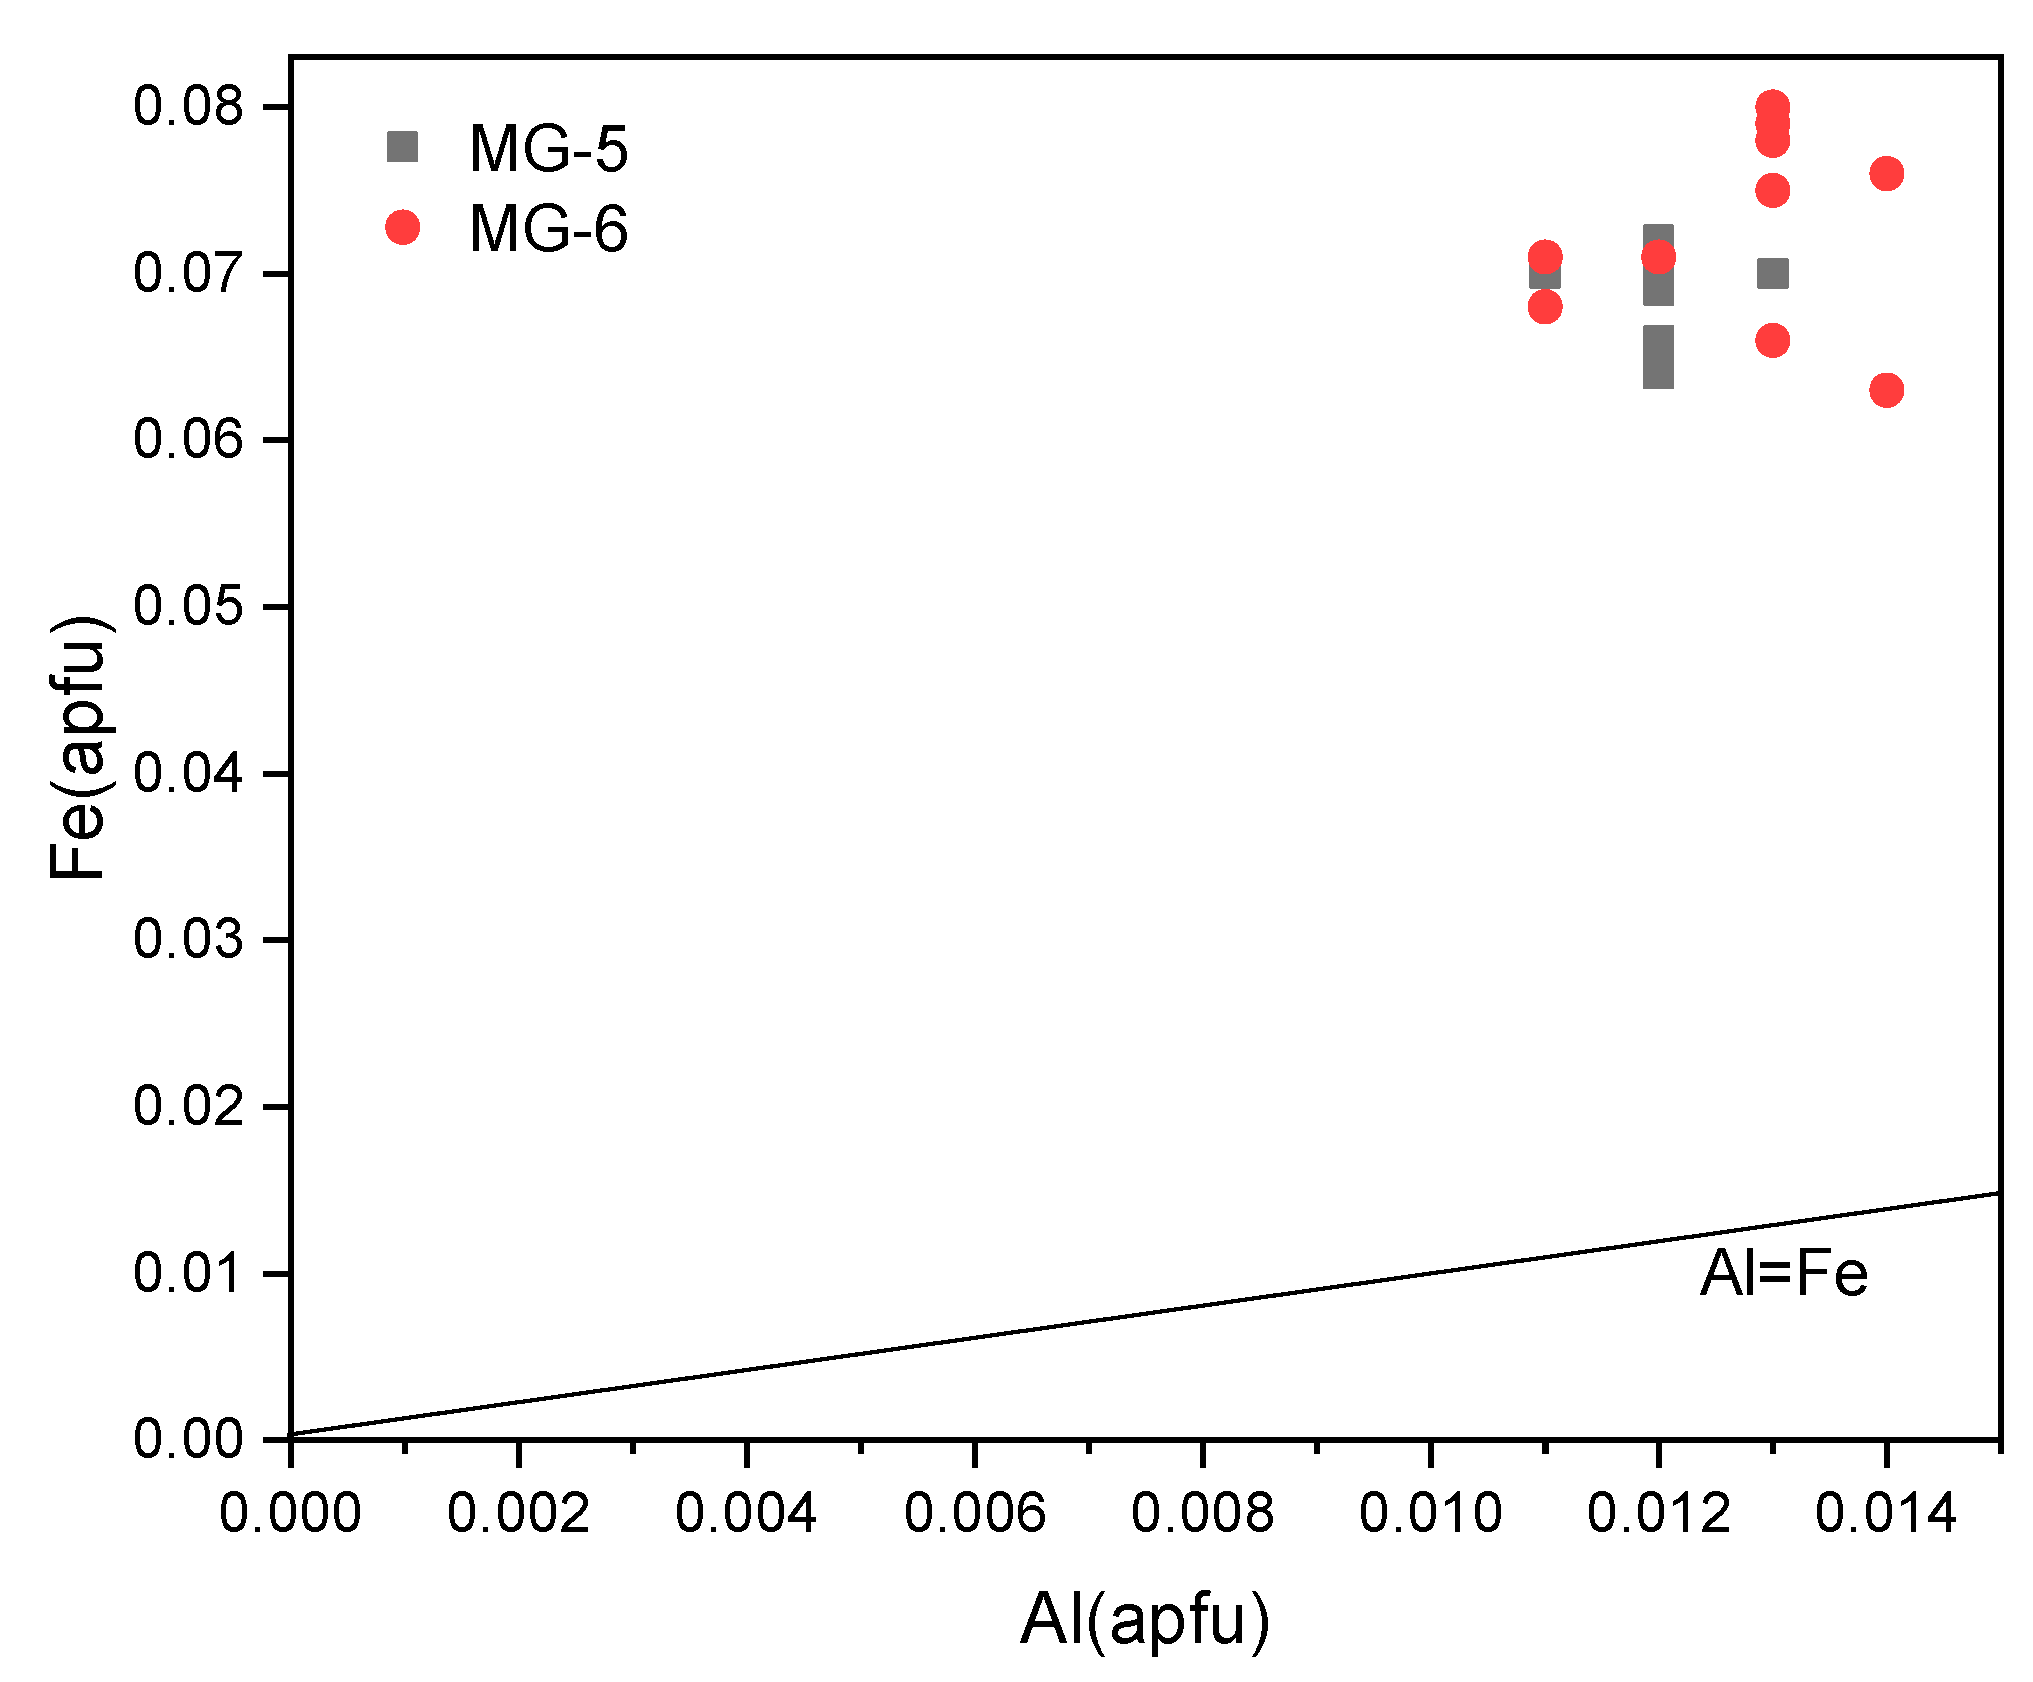
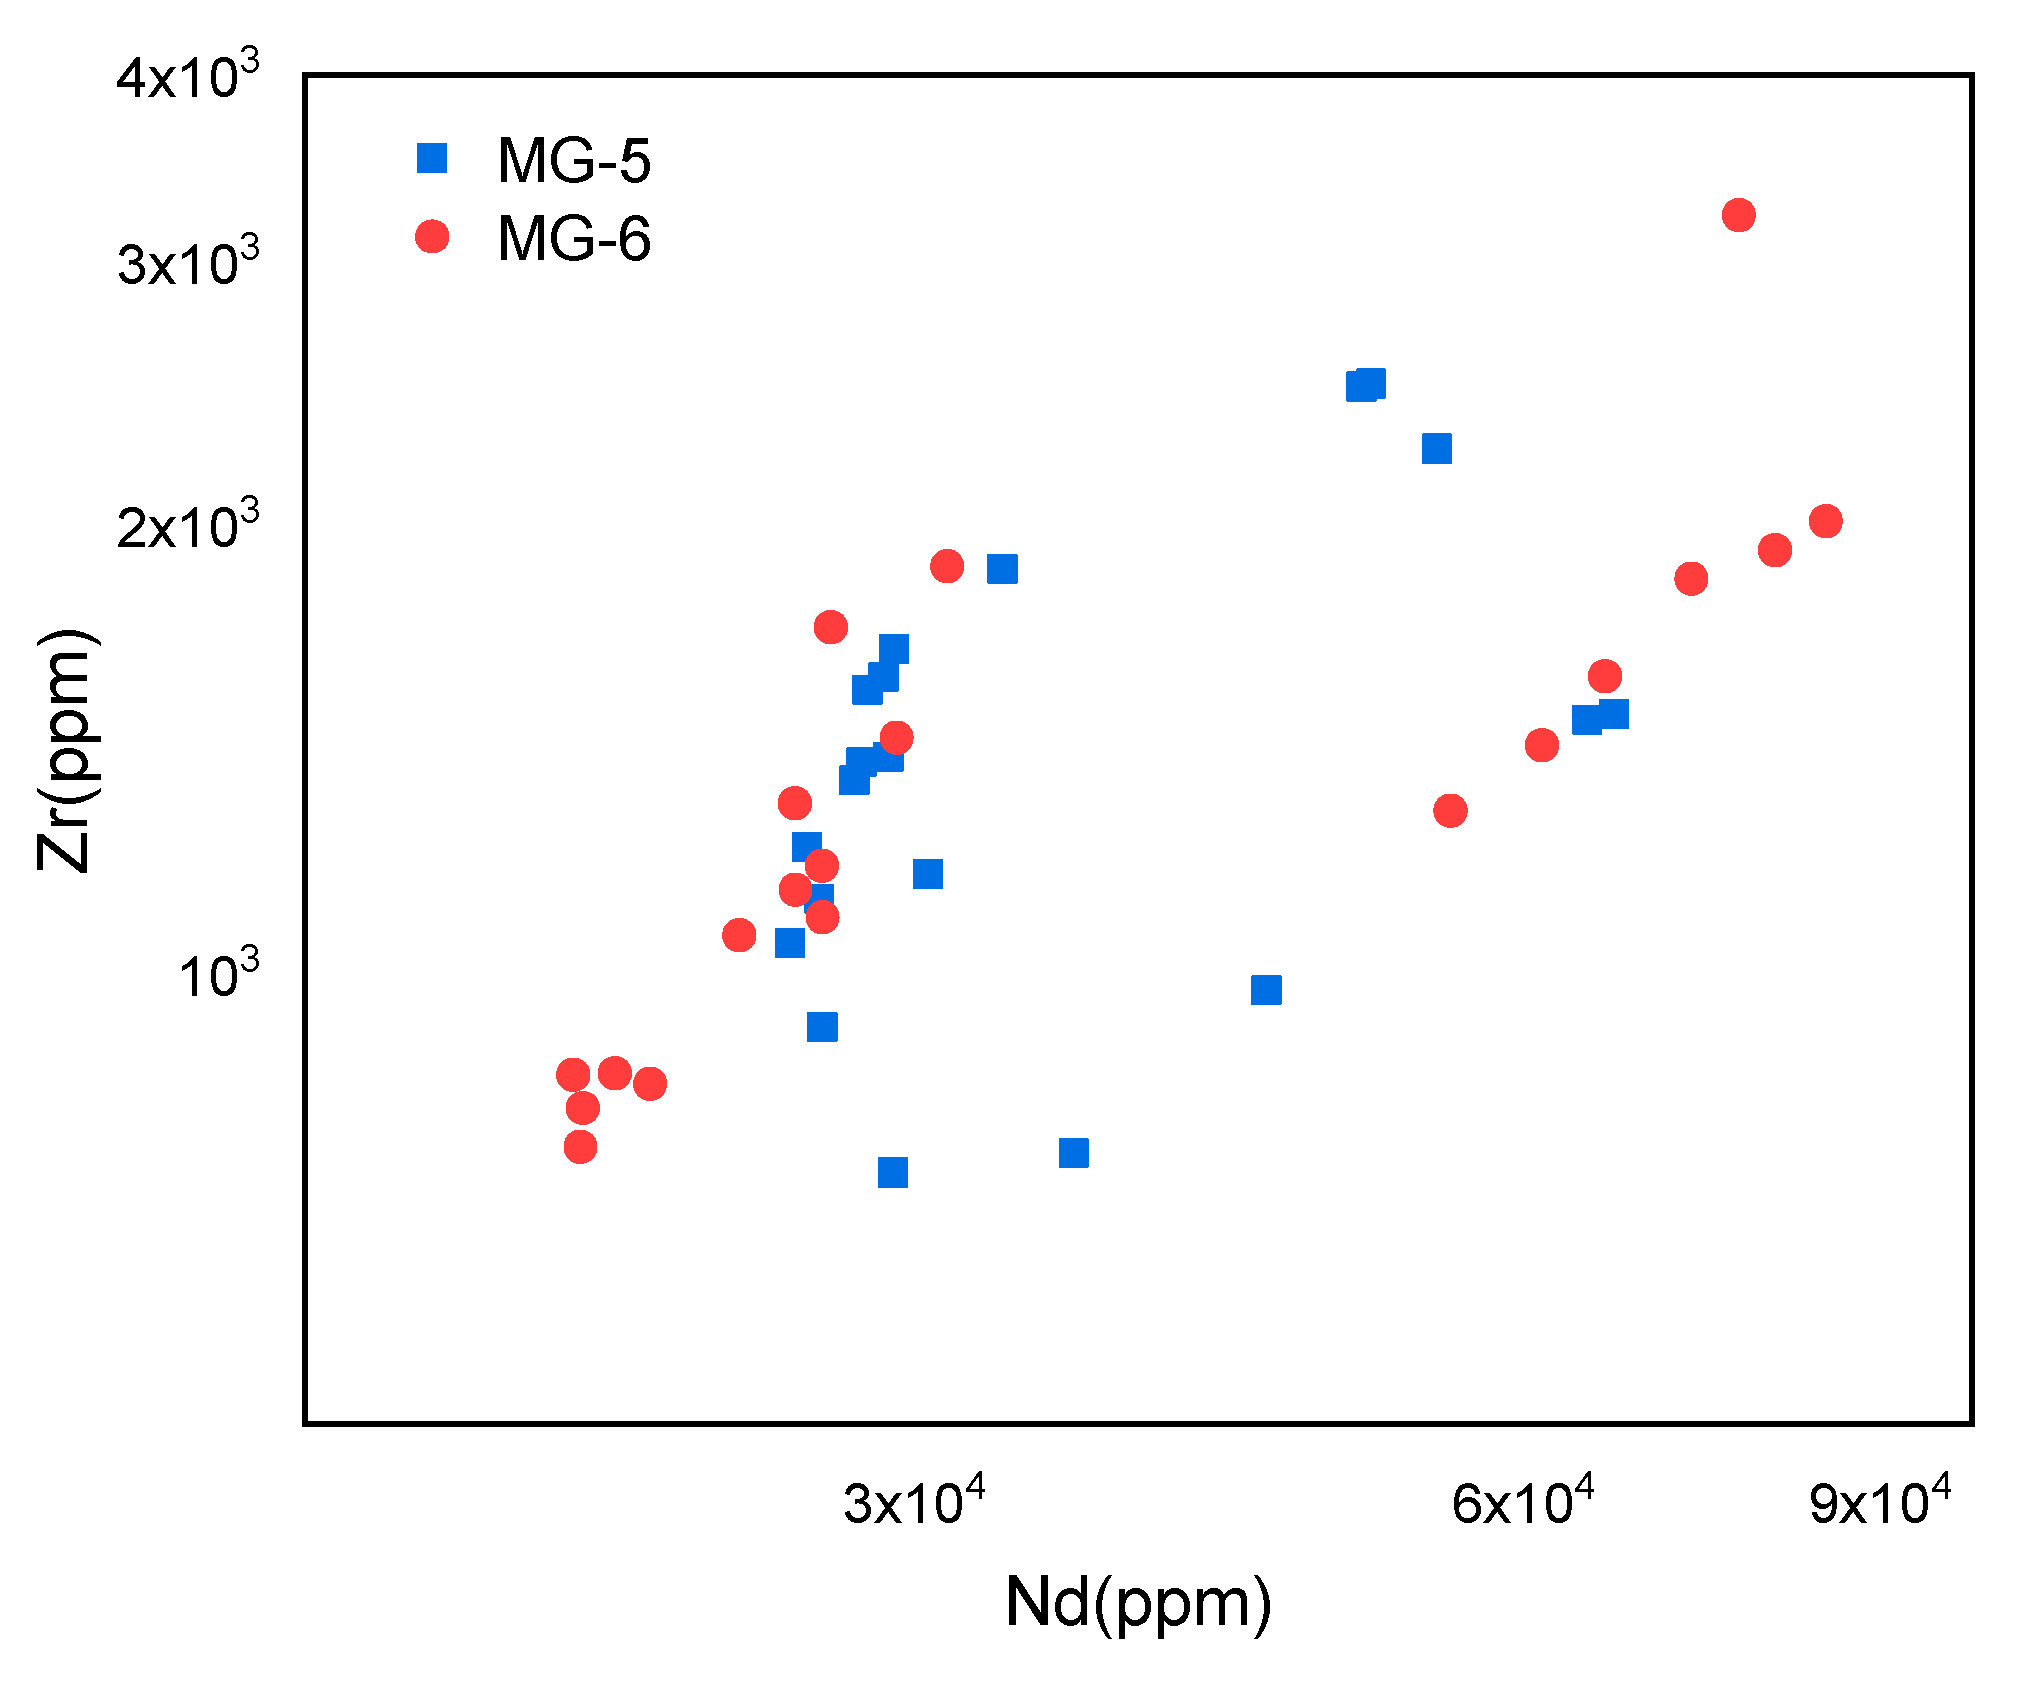
4.3. Major and Trace Elements
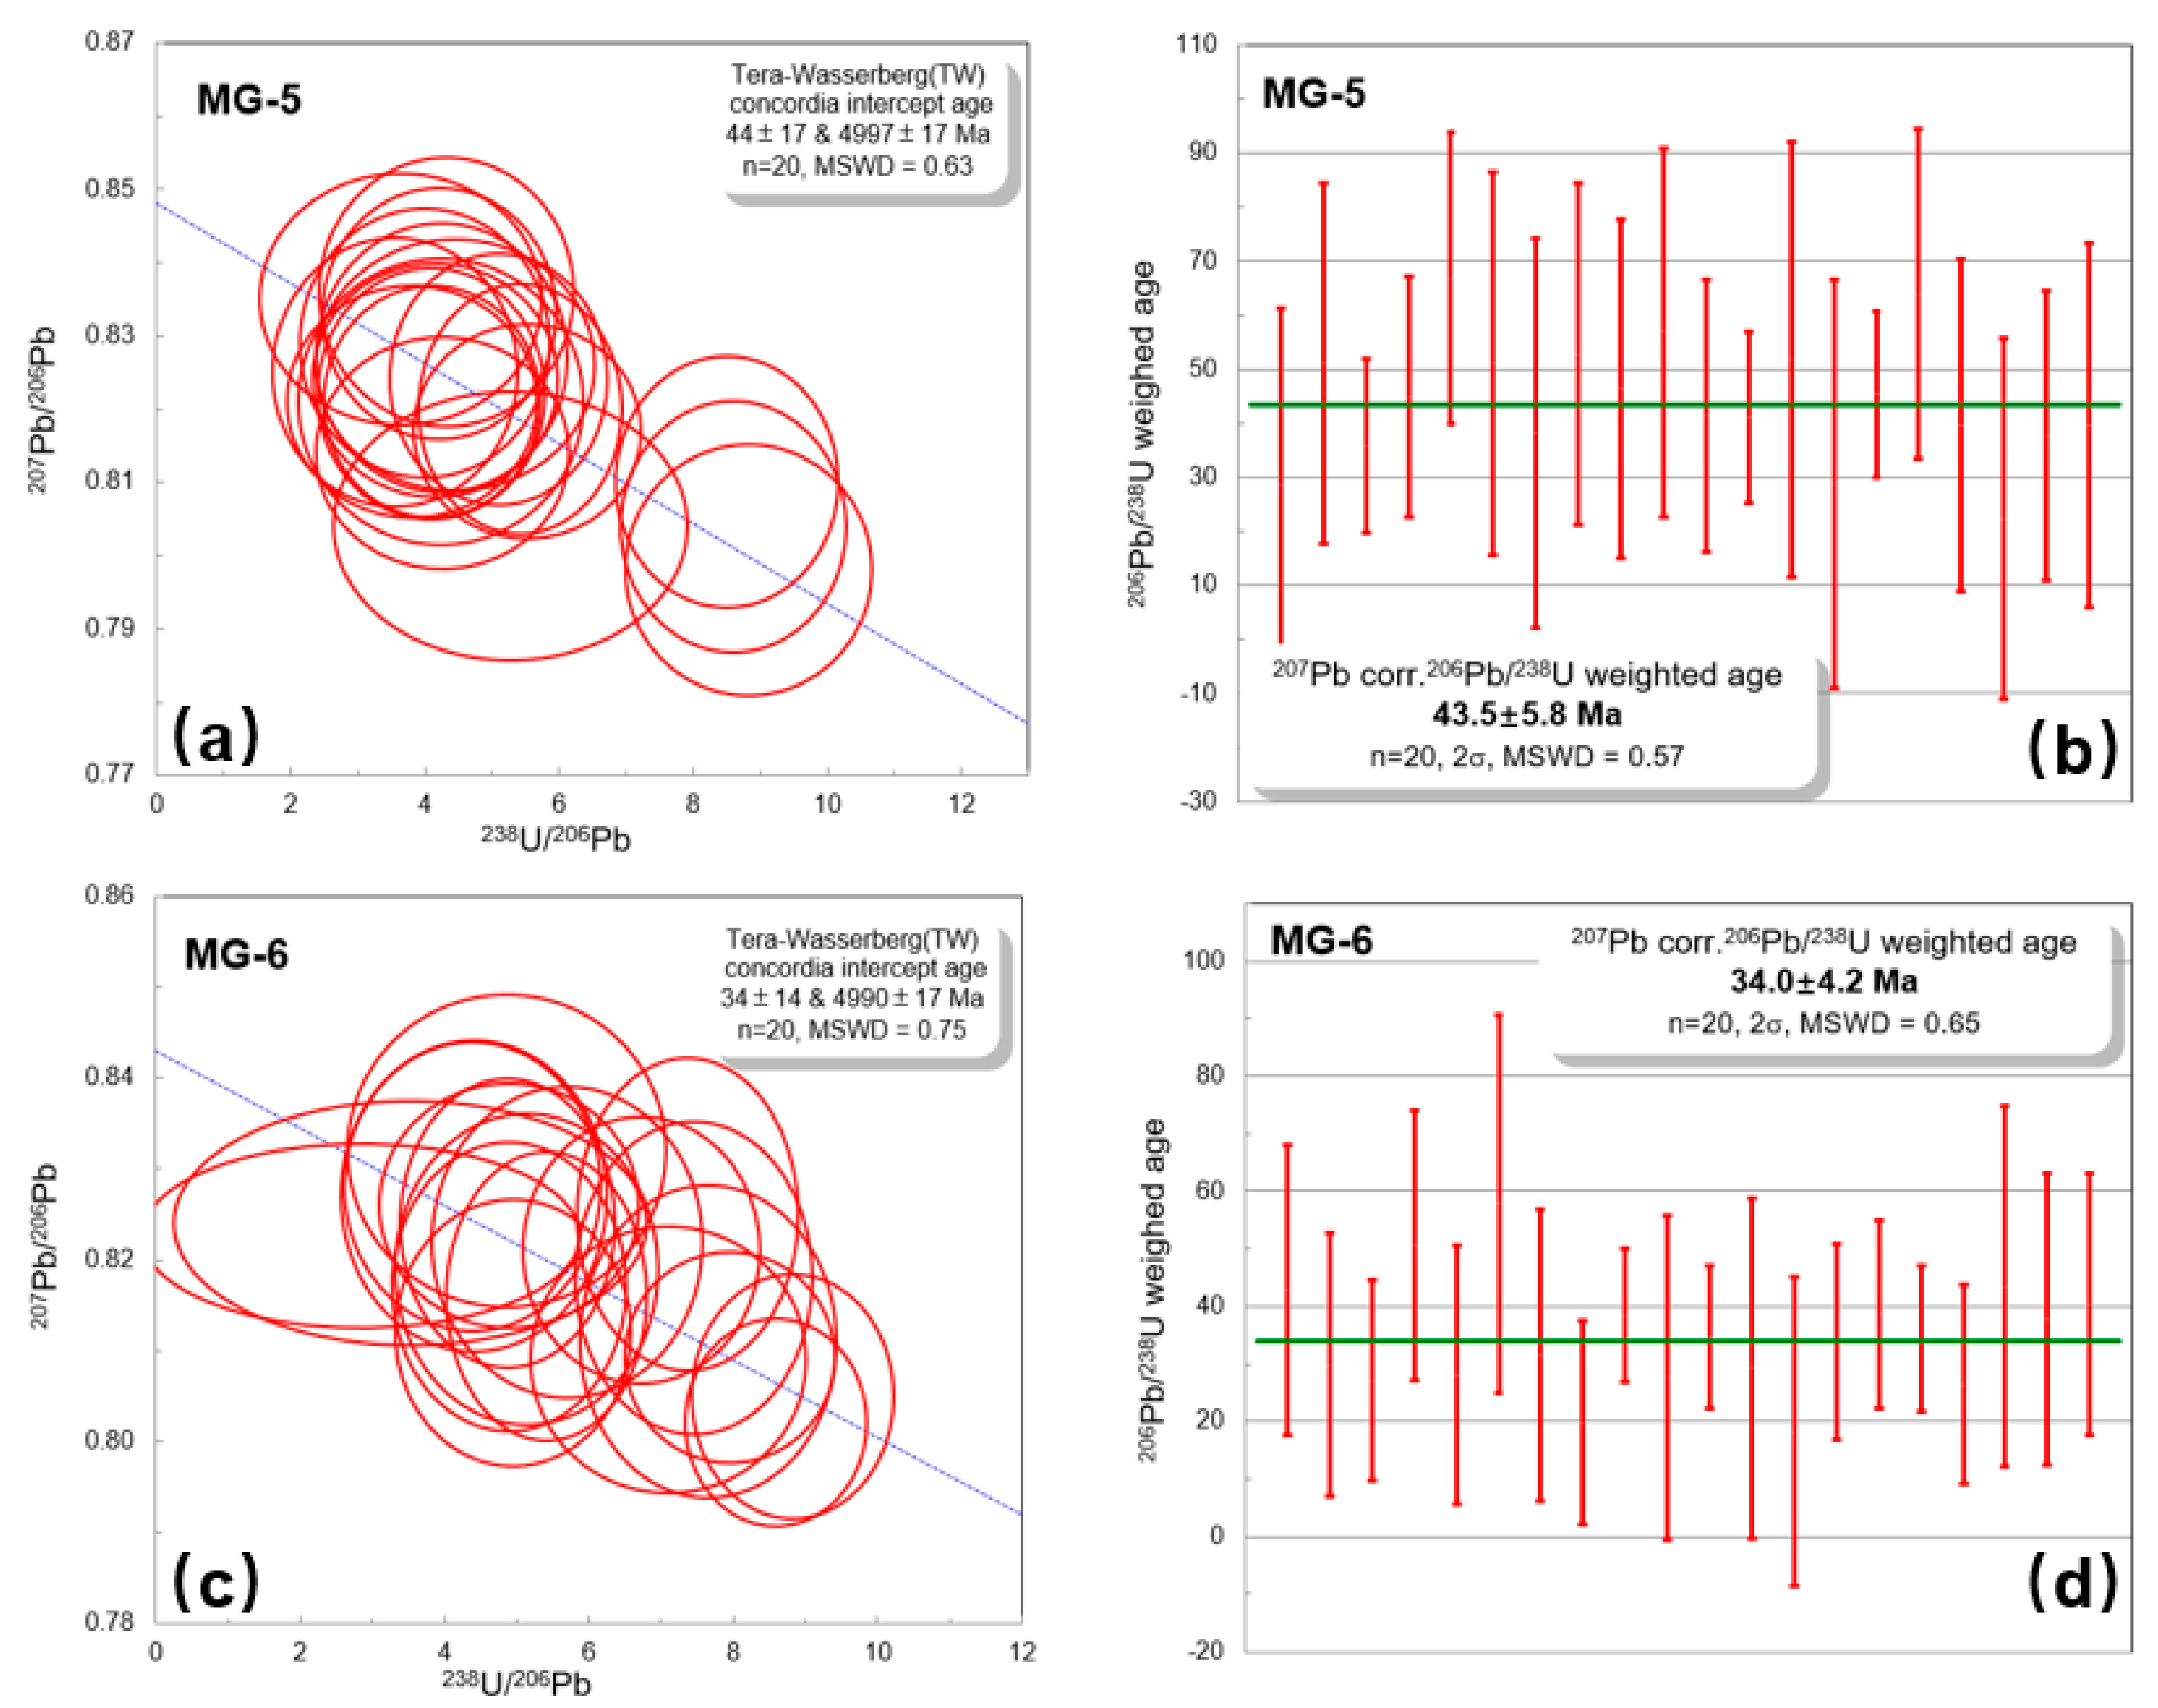
4.4. Titanite U–Pb Ages
5. Discussion
5.1. Comparision with RRUFF Database
5.2. Formation Temperature of Titanite
5.3. Genesis of Analysed Titanite
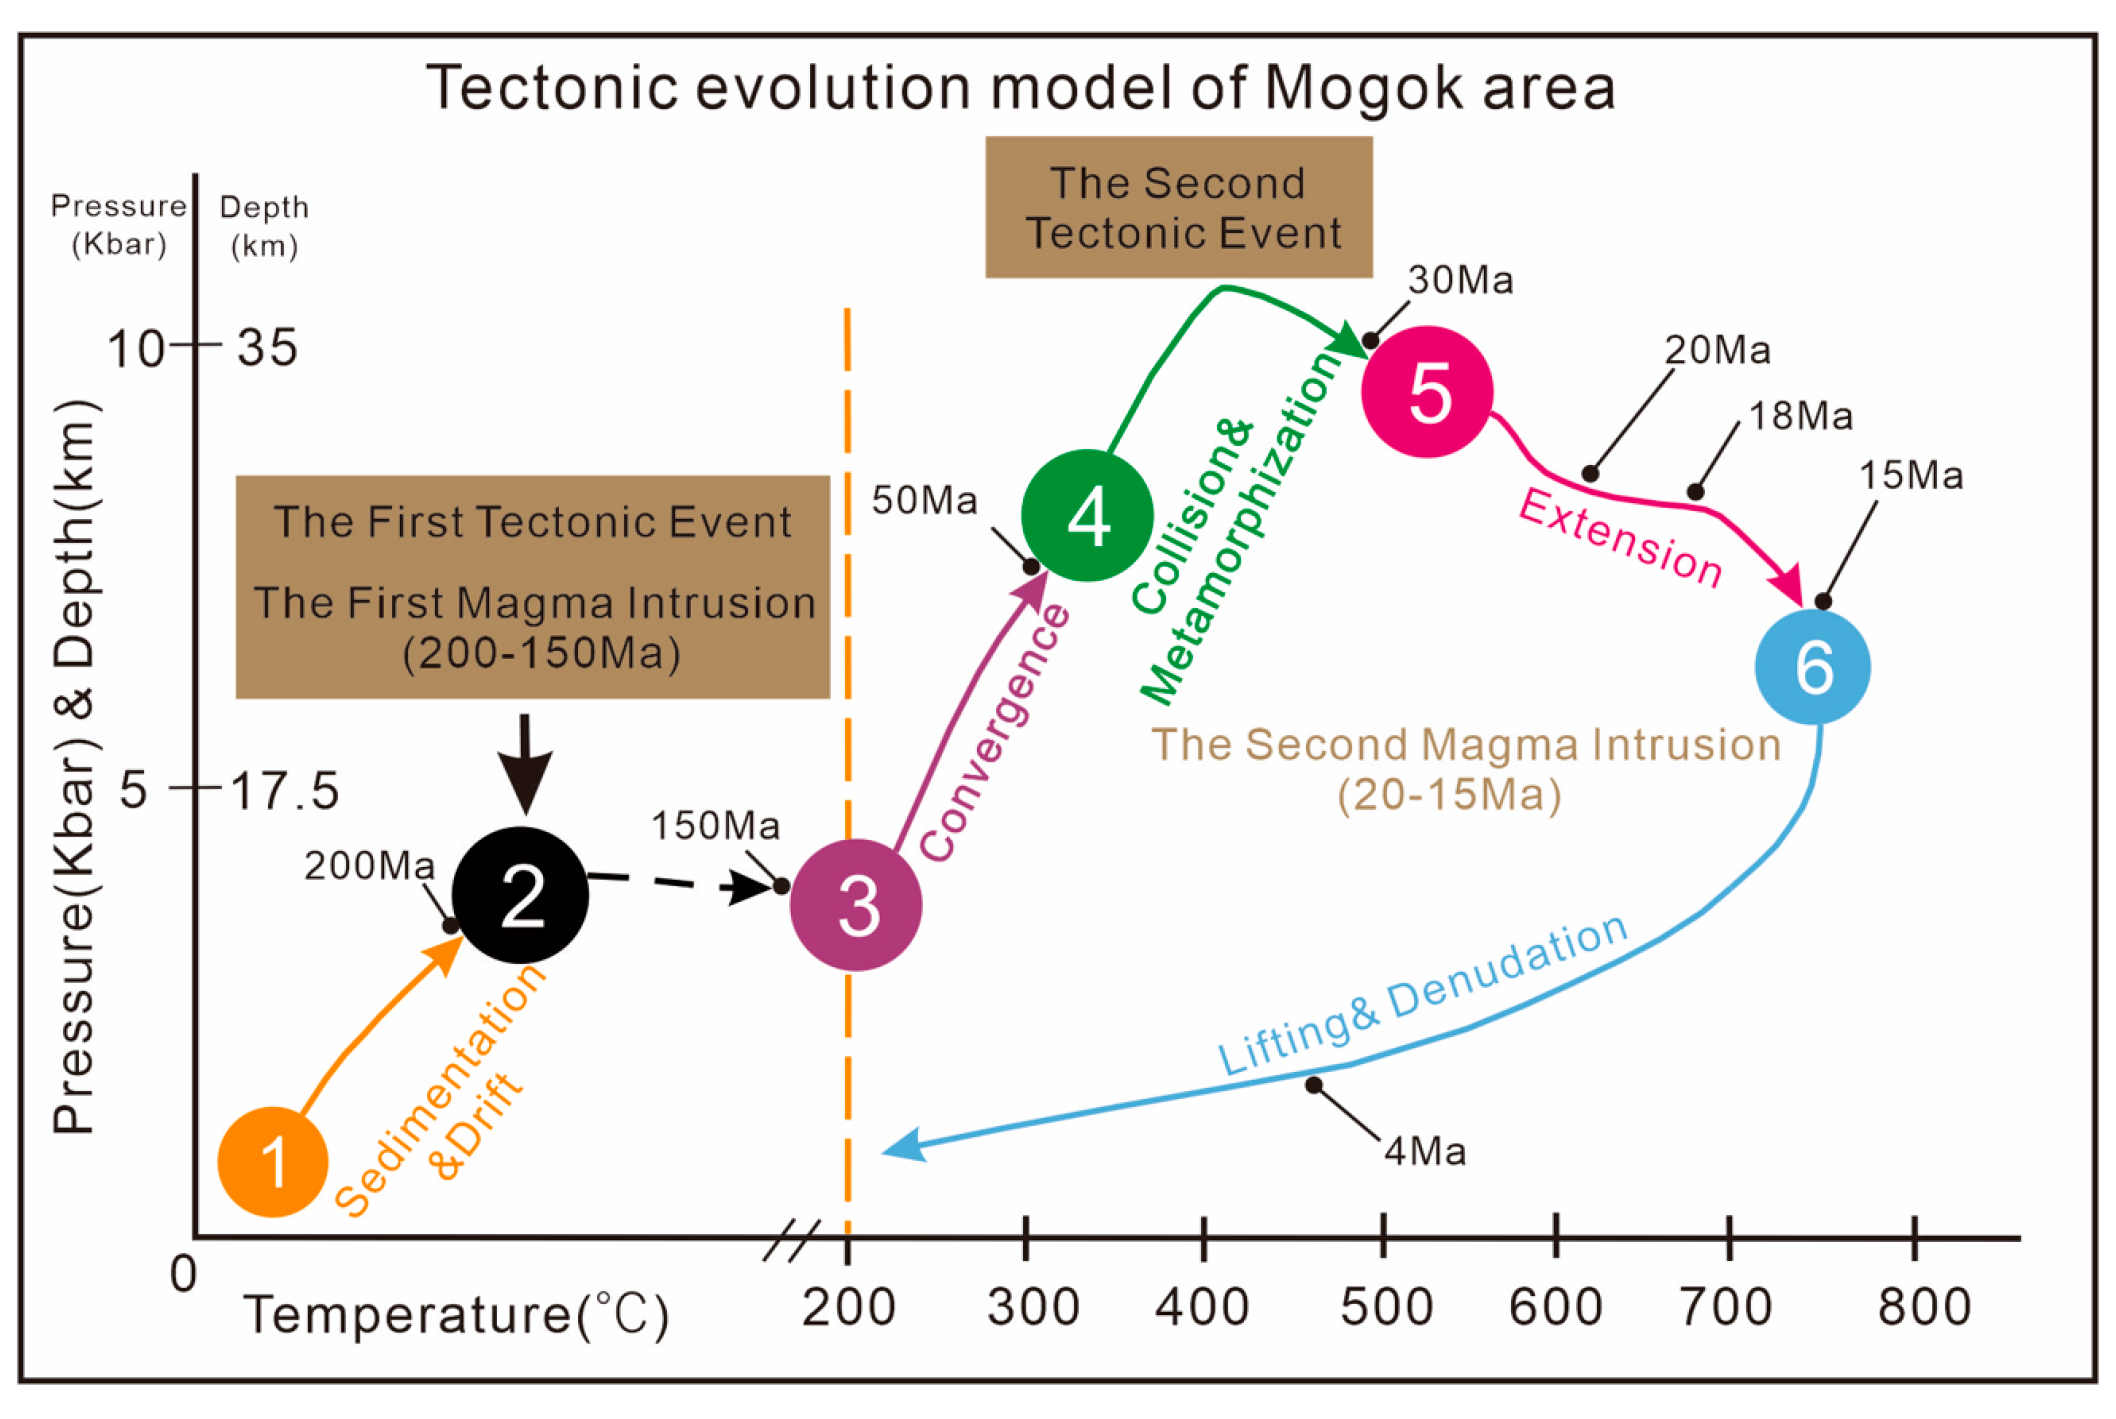
5.4. Tectonic Evolutionary History
6. Conclusions
Author Contributions
Funding
Data Availability Statement
Acknowledgments
Conflicts of Interest
Appendix A

| MG-5-1 | MG-5-2 | MG-5-3 | MG-5-4 | MG-5-5 | MG-5-6 | MG-5-7 | MG-5-8 | MG-5-9 | MG-5-10 | MG-6-1 | MG-6-2 | MG-6-3 | MG-6-4 | MG-6-5 | MG-6-6 | MG-6-7 | MG-6-8 | MG-6-9 | MG-6-10 | |||||
|---|---|---|---|---|---|---|---|---|---|---|---|---|---|---|---|---|---|---|---|---|---|---|---|---|
| SiO2 | 29.904 | 30.071 | 29.686 | 29.504 | 30.033 | 30.125 | 29.555 | 29.954 | 29.962 | 30.069 | 30.219 | 30.094 | 30.177 | 29.889 | 29.779 | 30.47 | 29.619 | 29.733 | 29.979 | 30.032 | ||||
| TiO2 | 37.147 | 36.929 | 38.246 | 38.016 | 37.133 | 38.153 | 37.695 | 38.016 | 37.371 | 37.324 | 37.037 | 36.668 | 37.176 | 37.662 | 37.977 | 37.417 | 37.951 | 37.224 | 37.099 | 37.497 | ||||
| Al2O3 | 0.308 | 0.303 | 0.326 | 0.312 | 0.301 | 0.308 | 0.31 | 0.304 | 0.289 | 0.301 | 0.277 | 0.343 | 0.331 | 0.348 | 0.342 | 0.352 | 0.271 | 0.338 | 0.334 | 0.313 | ||||
| FeO | 2.488 | 2.322 | 2.533 | 2.587 | 2.299 | 2.567 | 2.456 | 2.353 | 2.485 | 2.308 | 2.554 | 2.811 | 2.825 | 2.722 | 2.364 | 2.283 | 2.405 | 2.855 | 2.669 | 2.547 | ||||
| MnO | 0.044 | 0.014 | 0.039 | 0 | 0 | 0 | 0 | 0 | 0.004 | 0.092 | 0.012 | 0 | 0.016 | 0.014 | 0.025 | 0.045 | 0.143 | 0 | 0 | 0.131 | ||||
| MgO | 0.029 | 0.008 | 0.042 | 0.009 | 0 | 0.01 | 0.012 | 0.008 | 0.019 | 0.029 | 0.036 | 0.017 | 0.025 | 0.021 | 0.009 | 0.024 | 0.013 | 0.037 | 0.028 | 0.005 | ||||
| CaO | 26.839 | 27.075 | 26.363 | 26.559 | 26.748 | 26.477 | 27.119 | 26.459 | 26.519 | 26.578 | 26.994 | 27.612 | 26.707 | 27.065 | 26.553 | 26.376 | 26.583 | 26.259 | 25.928 | 26.975 | ||||
| Na2O | 0.431 | 0.44 | 0.552 | 0.518 | 0.441 | 0.43 | 0.388 | 0.422 | 0.425 | 0.44 | 0.381 | 0.343 | 0.413 | 0.369 | 0.599 | 0.511 | 0.393 | 0.456 | 0.591 | 0.345 | ||||
| K2O | 0.013 | 0 | 0.007 | 0.009 | 0.008 | 0 | 0.014 | 0.005 | 0.002 | 0.018 | 0.001 | 0.007 | 0.012 | 0.02 | 0 | 0.014 | 0.006 | 0.008 | 0.02 | 0.002 | ||||
| F | 0.179 | 0.131 | 0.151 | 0.13 | 0.377 | 0.097 | 0.193 | 0.172 | 0.22 | 0.213 | 0.248 | 0.315 | 0.001 | 0.001 | 0.14 | 0.21 | 0.013 | 0.396 | 0.049 | 0.055 | ||||
| Cr2O3 | 0.008 | 0 | 0 | 0 | 0.036 | 0 | 0 | 0 | 0.016 | 0.081 | 0 | 0.028 | 0.007 | 0 | 0 | 0.055 | 0 | 0.025 | 0 | 0 | ||||
| NiO | 0.035 | 0.009 | 0 | 0.067 | 0.078 | 0.057 | 0.051 | 0.002 | 0 | 0 | 0.016 | 0 | 0 | 0 | 0.019 | 0.066 | 0 | 0.028 | 0.079 | 0.073 | ||||
| V2O5 | 0.385 | 0.485 | 0.522 | 0.422 | 0.358 | 0.333 | 0.383 | 0.477 | 0.4 | 0.363 | 0.521 | 0.447 | 0.488 | 0.377 | 0.371 | 0.52 | 0.332 | 0.522 | 0.415 | 0.458 | ||||
| La2O3 | 0 | 0.033 | 0 | 0.064 | 0 | 0 | 0 | 0 | 0.104 | 0 | 0 | 0.007 | 0 | 0 | 0 | 0.141 | 0.007 | 0.097 | 0 | 0 | ||||
| Ce2O3 | 0.816 | 0.9 | 1.193 | 1.414 | 0.918 | 0.705 | 0.918 | 0.997 | 0.891 | 1.092 | 0.768 | 0.948 | 0.833 | 0.985 | 1.195 | 1.097 | 0.958 | 0.736 | 1.089 | 1.062 | ||||
| Total | 98.627 | 98.719 | 99.66 | 99.612 | 98.73 | 99.26 | 99.095 | 99.169 | 98.709 | 98.906 | 99.066 | 99.642 | 99.01 | 99.472 | 99.373 | 99.58 | 98.696 | 98.714 | 98.28 | 99.495 | ||||
| Cations (apfu) | ||||||||||||||||||||||||
| Si | 1.003 | 1.008 | 0.988 | 0.986 | 1.003 | 1.002 | 0.988 | 0.998 | 1.003 | 1.005 | 1.007 | 1.001 | 1.010 | 0.998 | 0.993 | 1.011 | 0.995 | 0.995 | 1.011 | 1.002 | ||||
| Al | 0.012 | 0.012 | 0.013 | 0.012 | 0.012 | 0.012 | 0.012 | 0.012 | 0.011 | 0.012 | 0.011 | 0.013 | 0.013 | 0.014 | 0.013 | 0.014 | 0.011 | 0.013 | 0.013 | 0.012 | ||||
| Ti | 0.937 | 0.931 | 0.957 | 0.955 | 0.933 | 0.955 | 0.948 | 0.953 | 0.941 | 0.938 | 0.929 | 0.917 | 0.936 | 0.946 | 0.953 | 0.934 | 0.959 | 0.937 | 0.941 | 0.941 | ||||
| Fe | 0.070 | 0.065 | 0.070 | 0.072 | 0.064 | 0.071 | 0.069 | 0.066 | 0.070 | 0.065 | 0.071 | 0.078 | 0.079 | 0.076 | 0.066 | 0.063 | 0.068 | 0.080 | 0.075 | 0.071 | ||||
| Mn | 0.001 | 0.000 | 0.001 | 0.000 | 0.000 | 0.000 | 0.000 | 0.000 | 0.000 | 0.003 | 0.000 | 0.000 | 0.000 | 0.000 | 0.001 | 0.001 | 0.004 | 0.000 | 0.000 | 0.004 | ||||
| Mg | 0.001 | 0.000 | 0.002 | 0.000 | 0.000 | 0.000 | 0.001 | 0.000 | 0.001 | 0.001 | 0.002 | 0.001 | 0.001 | 0.001 | 0.000 | 0.001 | 0.001 | 0.002 | 0.001 | 0.000 | ||||
| Ca | 0.964 | 0.972 | 0.940 | 0.951 | 0.957 | 0.944 | 0.972 | 0.945 | 0.951 | 0.952 | 0.964 | 0.984 | 0.958 | 0.968 | 0.949 | 0.938 | 0.957 | 0.941 | 0.936 | 0.964 | ||||
| Na | 0.028 | 0.029 | 0.036 | 0.034 | 0.029 | 0.028 | 0.025 | 0.027 | 0.028 | 0.029 | 0.025 | 0.022 | 0.027 | 0.024 | 0.039 | 0.033 | 0.026 | 0.030 | 0.039 | 0.022 | ||||
| K | 0.001 | 0.000 | 0.000 | 0.000 | 0.000 | 0.000 | 0.001 | 0.000 | 0.000 | 0.001 | 0.000 | 0.000 | 0.001 | 0.001 | 0.000 | 0.001 | 0.000 | 0.000 | 0.001 | 0.000 | ||||
| F | 0.019 | 0.014 | 0.016 | 0.014 | 0.040 | 0.010 | 0.020 | 0.018 | 0.023 | 0.023 | 0.026 | 0.033 | 0.000 | 0.000 | 0.015 | 0.022 | 0.001 | 0.042 | 0.005 | 0.006 | ||||
| Cr | 0.000 | 0.000 | 0.000 | 0.000 | 0.001 | 0.000 | 0.000 | 0.000 | 0.000 | 0.002 | 0.000 | 0.001 | 0.000 | 0.000 | 0.000 | 0.001 | 0.000 | 0.001 | 0.000 | 0.000 | ||||
| Ni | 0.001 | 0.000 | 0.000 | 0.002 | 0.002 | 0.002 | 0.001 | 0.000 | 0.000 | 0.000 | 0.000 | 0.000 | 0.000 | 0.000 | 0.001 | 0.002 | 0.000 | 0.001 | 0.002 | 0.002 | ||||
| V | 0.010 | 0.013 | 0.014 | 0.011 | 0.010 | 0.009 | 0.010 | 0.013 | 0.011 | 0.010 | 0.014 | 0.012 | 0.013 | 0.010 | 0.010 | 0.014 | 0.009 | 0.014 | 0.011 | 0.012 | ||||
| La | 0.000 | 0.000 | 0.000 | 0.001 | 0.000 | 0.000 | 0.000 | 0.000 | 0.001 | 0.000 | 0.000 | 0.000 | 0.000 | 0.000 | 0.000 | 0.002 | 0.000 | 0.001 | 0.000 | 0.000 | ||||
| Ce | 0.010 | 0.011 | 0.015 | 0.017 | 0.011 | 0.009 | 0.011 | 0.012 | 0.011 | 0.013 | 0.009 | 0.012 | 0.010 | 0.012 | 0.015 | 0.013 | 0.012 | 0.009 | 0.013 | 0.013 | ||||
| La | Ce | Pr | Nd | Sm | Eu | Gd | Tb | Dy | Ho | Er | Tm | Yb | Lu | |
|---|---|---|---|---|---|---|---|---|---|---|---|---|---|---|
| MG-5-1 | 66.78 | 517.4 | 129.8 | 748.5 | 232.6 | 54.66 | 132.7 | 14.26 | 58.06 | 7.215 | 14.68 | 1.648 | 8.94 | 0.784 |
| MG-5-2 | 67.10 | 522.8 | 131.1 | 758.9 | 237.6 | 55.37 | 135.7 | 14.46 | 59.12 | 7.359 | 14.94 | 1.699 | 9.23 | 0.8233 |
| MG-5-3 | 79.89 | 607.7 | 153.2 | 889.1 | 284.8 | 67.84 | 166.3 | 18.67 | 78.31 | 9.806 | 20.55 | 2.386 | 13.09 | 1.138 |
| MG-5-4 | 92.81 | 703.2 | 171.2 | 961 | 287 | 65.01 | 155.9 | 15.83 | 61.89 | 7.636 | 15.64 | 1.899 | 11.99 | 1.252 |
| MG-5-5 | 68.72 | 531.4 | 133.7 | 773.9 | 240.7 | 56.22 | 135.8 | 14.50 | 59.56 | 7.355 | 14.83 | 1.693 | 9.33 | 0.8161 |
| MG-5-6 | 66.88 | 515.4 | 129.9 | 753.2 | 235.6 | 54.84 | 134.1 | 14.24 | 58.14 | 7.236 | 14.74 | 1.668 | 9.10 | 0.811 |
| MG-5-7 | 65.41 | 508.4 | 127.9 | 737.4 | 229.5 | 53.79 | 130.3 | 13.91 | 57.4 | 7.081 | 14.29 | 1.615 | 8.74 | 0.760 |
| MG-5-8 | 67.35 | 519.0 | 130.2 | 758.4 | 235.4 | 55.19 | 135.2 | 14.35 | 58.74 | 7.289 | 14.82 | 1.67 | 9.13 | 0.803 |
| MG-5-9 | 67.61 | 519.7 | 130.3 | 757.1 | 236.3 | 55.28 | 134.6 | 14.36 | 59.14 | 7.294 | 14.79 | 1.663 | 9.11 | 0.794 |
| MG-5-10 | 70.98 | 544.2 | 136.0 | 791.1 | 245.1 | 57.46 | 140.3 | 14.82 | 60.63 | 7.495 | 15.27 | 1.732 | 9.55 | 0.840 |
| MG-5-11 | 93.26 | 674.7 | 162.5 | 909.4 | 267.1 | 61.19 | 145.5 | 15.14 | 61.63 | 7.506 | 15.04 | 1.707 | 9.35 | 0.811 |
| MG-5-12 | 80.34 | 609.1 | 153.9 | 896.5 | 285.6 | 68.46 | 167.7 | 18.58 | 79.41 | 9.865 | 20.67 | 2.389 | 13.22 | 1.149 |
| MG-5-13 | 63.76 | 487.2 | 122.8 | 715.7 | 223.8 | 52.57 | 127.8 | 13.66 | 57.27 | 7.033 | 14.04 | 1.585 | 8.35 | 0.716 |
| MG-5-14 | 59.66 | 502.9 | 133.4 | 790.6 | 250.9 | 58.18 | 140.9 | 14.66 | 60.32 | 7.334 | 14.90 | 1.707 | 9.725 | 0.858 |
| MG-5-15 | 90.41 | 691.7 | 174.7 | 1009.9 | 315.2 | 74.28 | 180.9 | 19.63 | 82.84 | 10.171 | 21.08 | 2.400 | 13.2 | 1.147 |
| MG-5-16 | 66.65 | 514.6 | 129.7 | 754.0 | 234.7 | 54.88 | 134.0 | 14.17 | 58.94 | 7.210 | 14.70 | 1.656 | 9.02 | 0.7811 |
| MG-5-17 | 69.77 | 532.1 | 133.5 | 770.0 | 237.2 | 55.29 | 135.0 | 14.13 | 58.25 | 7.104 | 14.56 | 1.658 | 9.19 | 0.824 |
| MG-5-18 | 67.59 | 524.5 | 131.8 | 768.8 | 238.9 | 55.65 | 135.6 | 14.30 | 59.27 | 7.290 | 14.80 | 1.687 | 9.28 | 0.819 |
| MG-5-19 | 99.32 | 715.4 | 171.3 | 957.5 | 282.4 | 65.35 | 155.4 | 16.18 | 66.19 | 7.979 | 16.02 | 1.782 | 9.56 | 0.817 |
| MG-5-20 | 67.54 | 523.6 | 132.1 | 771.0 | 240.0 | 55.87 | 137.2 | 14.40 | 59.43 | 7.316 | 14.87 | 1.689 | 9.266 | 0.816 |
| La | Ce | Pr | Nd | Sm | Eu | Gd | Tb | Dy | Ho | Er | Tm | Yb | Lu | |
|---|---|---|---|---|---|---|---|---|---|---|---|---|---|---|
| MG-6-1 | 64.07 | 522.5 | 134.4 | 785.6 | 247.7 | 56.53 | 138.2 | 13.95 | 55.57 | 6.881 | 14.22 | 1.753 | 11.38 | 1.210 |
| MG-6-2 | 58.69 | 484.0 | 125.8 | 748.5 | 241.3 | 55.56 | 137.0 | 14.05 | 57.23 | 7.093 | 14.85 | 1.845 | 11.79 | 1.217 |
| MG-6-3 | 64.10 | 543.8 | 144.7 | 885.8 | 300.4 | 71.00 | 180.8 | 19.23 | 79.70 | 9.980 | 21.35 | 2.666 | 17.2 | 1.819 |
| MG-6-4 | 59.31 | 486.6 | 126.0 | 743.1 | 239.8 | 55.22 | 136.0 | 13.90 | 56.39 | 7.065 | 14.76 | 1.817 | 11.69 | 1.223 |
| MG-6-5 | 102.70 | 761.7 | 182.3 | 997.2 | 283.4 | 61.75 | 144.4 | 13.94 | 53.83 | 6.420 | 12.96 | 1.563 | 9.71 | 0.982 |
| MG-6-6 | 99.27 | 729.9 | 174.0 | 958.5 | 273.7 | 59.93 | 140.7 | 13.69 | 53.40 | 6.378 | 12.87 | 1.534 | 9.43 | 0.922 |
| MG-6-7 | 65.05 | 531.1 | 135.3 | 798.2 | 251.6 | 57.47 | 140.8 | 14.33 | 57.05 | 7.066 | 14.63 | 1.782 | 11.38 | 1.182 |
| MG-6-8 | 64.43 | 541.9 | 143.1 | 873.7 | 297.0 | 69.64 | 177.0 | 18.73 | 77.45 | 9.675 | 20.75 | 2.557 | 16.61 | 1.749 |
| MG-6-9 | 101.66 | 763.8 | 185.2 | 1039.0 | 307.5 | 69.15 | 164.6 | 16.72 | 67.20 | 8.235 | 16.96 | 2.022 | 12.18 | 1.167 |
| MG-6-10 | 61.39 | 498.6 | 128.6 | 759.1 | 241.2 | 55.76 | 137.2 | 14.13 | 57.80 | 7.274 | 15.01 | 1.811 | 11.07 | 1.112 |
| MG-6-11 | 101.31 | 761.5 | 185.2 | 1034.5 | 307.7 | 69.18 | 164.6 | 16.84 | 67.66 | 8.280 | 17.04 | 2.031 | 12.13 | 1.184 |
| MG-6-12 | 59.55 | 484.7 | 124.2 | 731.5 | 230.2 | 52.96 | 127.7 | 13.11 | 53.24 | 6.633 | 13.68 | 1.654 | 10.06 | 0.988 |
| MG-6-13 | 60.03 | 491.6 | 125.8 | 738.4 | 233.8 | 53.56 | 129.6 | 13.14 | 52.68 | 6.516 | 13.44 | 1.65 | 10.52 | 1.080 |
| MG-6-14 | 65.50 | 550.3 | 145.4 | 890.2 | 303.7 | 71.89 | 183.2 | 19.55 | 80.81 | 10.215 | 21.87 | 2.715 | 17.39 | 1.836 |
| MG-6-15 | 100.36 | 769.8 | 188.8 | 1067.0 | 321.5 | 72.25 | 171.4 | 17.3 | 68.59 | 8.308 | 17.17 | 2.124 | 13.81 | 1.43 |
| MG-6-16 | 101.48 | 778.1 | 191.1 | 1079.0 | 326.0 | 73.59 | 175.4 | 17.87 | 71.09 | 8.629 | 17.82 | 2.208 | 14.06 | 1.454 |
| MG-6-17 | 63.18 | 526.9 | 138.6 | 841.2 | 280.5 | 65.76 | 166.2 | 17.47 | 72.07 | 9.016 | 18.81 | 2.345 | 15.03 | 1.573 |
| MG-6-18 | 59.89 | 486.4 | 125.1 | 737.0 | 232.8 | 53.51 | 129.4 | 13.23 | 53.71 | 6.652 | 13.79 | 1.660 | 10.15 | 0.999 |
| MG-6-19 | 59.54 | 492.9 | 127.2 | 754.7 | 239.4 | 55.06 | 133.6 | 13.65 | 54.92 | 6.779 | 14.20 | 1.765 | 11.38 | 1.191 |
| MG-6-20 | 98.19 | 722.4 | 173.6 | 971.2 | 280.6 | 62.69 | 147.8 | 14.66 | 58.18 | 6.994 | 14.16 | 1.662 | 9.85 | 0.935 |
| Point | Isotopic Ratios | 207Pb Corrected Age | ||||||||
|---|---|---|---|---|---|---|---|---|---|---|
| 238U/206Pb | 1σ | 207Pb/206Pb | 1σ | 207Pb/235U | 1σ | 206Pb/238U | 1σ | 206Pb/238U | ±σ | |
| Mg-5-01 | 4.210526 | 1.431579 | 0.833 | 0.014 | 27.18 | 0.38 | 0.2375 | 0.0034 | 28.59291 | 32.64977 |
| Mg-5-02 | 4.08998 | 1.390593 | 0.822 | 0.014 | 27.67 | 0.46 | 0.2445 | 0.0034 | 50.96108 | 33.38145 |
| Mg-5-03 | 8.503401 | 1.360544 | 0.810 | 0.014 | 13.04 | 0.15 | 0.1176 | 0.0016 | 35.85306 | 16.00427 |
| Mg-5-04 | 5.534034 | 1.383509 | 0.817 | 0.012 | 20.28 | 0.25 | 0.1807 | 0.0025 | 44.92061 | 22.32279 |
| Mg-5-05 | 5.274262 | 2.162447 | 0.804 | 0.015 | 20.82 | 0.41 | 0.1896 | 0.0041 | 66.82096 | 26.94427 |
| Mg-5-06 | 4.231909 | 1.735083 | 0.821 | 0.016 | 26.67 | 0.37 | 0.2363 | 0.0041 | 51.14577 | 35.41699 |
| Mg-5-07 | 3.996803 | 1.518785 | 0.829 | 0.015 | 28.36 | 0.48 | 0.2502 | 0.0038 | 38.13497 | 35.96065 |
| Mg-5-08 | 4.106776 | 1.314168 | 0.821 | 0.013 | 27.53 | 0.34 | 0.2435 | 0.0032 | 52.69982 | 31.64773 |
| Mg-5-09 | 4.152824 | 1.495017 | 0.824 | 0.013 | 27.25 | 0.40 | 0.2408 | 0.0036 | 46.3405 | 31.3618 |
| Mg-5-10 | 3.805175 | 1.52207 | 0.821 | 0.013 | 29.62 | 0.40 | 0.2628 | 0.004 | 56.86429 | 34.14393 |
| Mg-5-11 | 5.422993 | 1.247289 | 0.820 | 0.014 | 20.76 | 0.26 | 0.1844 | 0.0023 | 41.41196 | 25.17982 |
| Mg-5-12 | 8.591065 | 1.37457 | 0.804 | 0.014 | 12.85 | 0.15 | 0.1164 | 0.0016 | 41.07903 | 15.79509 |
| Mg-5-13 | 3.558719 | 1.494662 | 0.825 | 0.015 | 31.84 | 0.47 | 0.281 | 0.0042 | 51.80851 | 40.26918 |
| Mg-5-14 | 3.640335 | 1.710957 | 0.835 | 0.014 | 31.54 | 0.51 | 0.2747 | 0.0047 | 28.66183 | 37.79578 |
| Mg-5-15 | 8.833922 | 1.501767 | 0.798 | 0.014 | 12.44 | 0.16 | 0.1132 | 0.0017 | 45.387 | 15.32068 |
| Mg-5-16 | 4.260758 | 1.533873 | 0.814 | 0.013 | 26.29 | 0.37 | 0.2347 | 0.0036 | 63.92638 | 30.37737 |
| Mg-5-17 | 4.450378 | 1.691144 | 0.826 | 0.014 | 25.57 | 0.34 | 0.2247 | 0.0038 | 39.65274 | 30.76729 |
| Mg-5-18 | 4.317789 | 1.554404 | 0.836 | 0.015 | 26.62 | 0.41 | 0.2316 | 0.0036 | 22.31356 | 33.43115 |
| Mg-5-19 | 5.104645 | 1.327208 | 0.824 | 0.014 | 22.27 | 0.30 | 0.1959 | 0.0026 | 37.71706 | 26.80495 |
| Mg-5-20 | 4.249894 | 1.529962 | 0.827 | 0.015 | 26.89 | 0.36 | 0.2353 | 0.0036 | 39.63593 | 33.78872 |
| Point | Isotopic Ratios | 207Pb Corrected Age | ||||||||
|---|---|---|---|---|---|---|---|---|---|---|
| 238U/206Pb | 1σ | 207Pb/206Pb | 1σ | 207Pb/235U | 1σ | 206Pb/238U | 1σ | 206Pb/238U | ±σ | |
| Mg-6-01 | 4.892368 | 1.320939 | 0.817 | 0.013 | 23.10 | 0.32 | 0.2044 | 0.0027 | 42.88900 | 25.15391 |
| Mg-6-02 | 5.698006 | 1.538462 | 0.822 | 0.014 | 19.86 | 0.24 | 0.1755 | 0.0027 | 29.76397 | 22.87941 |
| Mg-6-03 | 7.446016 | 1.340283 | 0.818 | 0.014 | 15.14 | 0.18 | 0.1343 | 0.0018 | 27.11887 | 17.49094 |
| Mg-6-04 | 4.940711 | 1.333992 | 0.812 | 0.012 | 22.71 | 0.29 | 0.2024 | 0.0027 | 50.61581 | 23.47389 |
| Mg-6-05 | 4.901961 | 1.470588 | 0.826 | 0.011 | 23.17 | 0.25 | 0.204 | 0.003 | 28.01006 | 22.50032 |
| Mg-6-06 | 2.84576 | 2.475811 | 0.823 | 0.008 | 39.90 | 1.00 | 0.3514 | 0.0087 | 57.80704 | 32.76922 |
| Mg-6-07 | 4.863813 | 1.215953 | 0.824 | 0.013 | 23.33 | 0.33 | 0.2056 | 0.0025 | 31.54496 | 25.39222 |
| Mg-6-08 | 7.36377 | 1.251841 | 0.825 | 0.014 | 15.46 | 0.23 | 0.1358 | 0.0017 | 19.75142 | 17.73803 |
| Mg-6-09 | 8.591065 | 1.030928 | 0.802 | 0.009 | 12.91 | 0.14 | 0.1164 | 0.0012 | 38.43003 | 11.50474 |
| Mg-6-10 | 4.391744 | 1.449275 | 0.828 | 0.013 | 25.92 | 0.32 | 0.2277 | 0.0033 | 27.58666 | 28.17365 |
| Mg-6-11 | 8.826125 | 1.147396 | 0.805 | 0.011 | 12.62 | 0.13 | 0.1133 | 0.0013 | 34.76102 | 12.3742 |
| Mg-6-12 | 4.413063 | 1.500441 | 0.827 | 0.014 | 25.83 | 0.34 | 0.2266 | 0.0034 | 29.28097 | 29.58775 |
| Mg-6-13 | 4.863813 | 1.799611 | 0.832 | 0.014 | 23.59 | 0.38 | 0.2056 | 0.0037 | 18.27579 | 26.91974 |
| Mg-6-14 | 7.651109 | 1.453711 | 0.811 | 0.014 | 14.60 | 0.18 | 0.1307 | 0.0019 | 33.76972 | 16.97535 |
| Mg-6-15 | 7.102273 | 1.5625 | 0.809 | 0.012 | 15.73 | 0.30 | 0.1408 | 0.0022 | 38.64302 | 16.33509 |
| Mg-6-16 | 7.942812 | 1.191422 | 0.809 | 0.009 | 14.05 | 0.13 | 0.1259 | 0.0015 | 34.35823 | 12.57437 |
| Mg-6-17 | 6.72495 | 1.34499 | 0.821 | 0.012 | 16.83 | 0.21 | 0.1487 | 0.002 | 26.42441 | 17.34914 |
| Mg-6-18 | 3.526093 | 2.679831 | 0.824 | 0.011 | 32.14 | 0.88 | 0.2836 | 0.0076 | 43.48483 | 31.21685 |
| Mg-6-19 | 5.13347 | 1.488706 | 0.819 | 0.014 | 21.89 | 0.29 | 0.1948 | 0.0029 | 37.74075 | 25.35068 |
| Mg-6-20 | 5.405405 | 1.135135 | 0.816 | 0.013 | 20.76 | 0.23 | 0.1850 | 0.0021 | 40.31684 | 22.76337 |
References
- Cao, M.; Qin, K.; Li, G.; Evans, N.J.; Jin, L. In situ LA-(MC)-ICP-MS trace element and Nd isotopic compositions and genesis of polygenetic titanite from the Baogutu reduced porphyry Cu deposit, Western Junggar, NW China. Ore Geol. Rev. 2015, 65, 940–954. [Google Scholar] [CrossRef]
- Harlov, D.; Tropper, P.; Seifert, W.; Nijland, T.; Förster, H.-J. Formation of Al-rich titanite (CaTiSiO4O–CaAlSiO4OH) reaction rims on ilmenite in metamorphic rocks as a function of fH2O and fO2. Lithos 2006, 88, 72–84. [Google Scholar] [CrossRef]
- Li, J.-W.; Deng, X.-D.; Zhou, M.-F.; Liu, Y.-S.; Zhao, X.-F.; Guo, J.-L. Laser ablation ICP-MS titanite U–Th–Pb dating of hydrothermal ore deposits: A case study of the Tonglushan Cu–Fe–Au skarn deposit, SE Hubei Province, China. Chem. Geol. 2010, 270, 56–67. [Google Scholar] [CrossRef]
- Kretz, R. Symbols for rock-forming minerals. Am. Mineral. 1983, 68, 277–279. [Google Scholar]
- Kohn, M.J. Titanite Petrochronology. Rev. Mineral. Geochem. 2017, 83, 419–441. [Google Scholar] [CrossRef]
- Higgins, J.B.; Ribbe, P.H. The crystal chemistry and space groups of natural and synthetic titanites. Am. Mineral. 1976, 61, 878–888. [Google Scholar]
- Xu, B.; Hou, Z.-Q.; Griffin, W.L.; O’Reilly, S.Y.; Zheng, Y.-C.; Wang, T.; Fu, B.; Xu, J.-F. In-situ mineralogical interpretation of the mantle geophysical signature of the Gangdese Cu-porphyry mineral system. Gondwana Res. 2022, 111, 53–63. [Google Scholar] [CrossRef]
- Fineberg, S.J.; Nandyala, S.V.; Marquez-Lara, A.; Oglesby, M.; Patel, A.A.; Singh, K. Incidence and risk factors for postoperative delirium after lumbar spine surgery (Phila Pa 1976). Spine 2013, 38, 1790–1796. [Google Scholar] [CrossRef]
- Yu, J.-X.; Xu, B.; Zhao, Y.; Wang, Z.-X.; Zhang, Y.-F.; Kou, G.-Y. In situ Sr-O isotopic and elemental compositions of apatite and zircon from Pengcuolin granodiorites: Implications for Jurassic metallogenic variation in the southern tibet. Ore Geol. Rev. 2022, 145, 104869. [Google Scholar] [CrossRef]
- Bonamici, C.E.; Fanning, C.M.; Kozdon, R.; Fournelle, J.H.; Valley, J.W. Combined oxygen-isotope and U–Pb zoning studies of titanite: New criteria for age preservation. Chem. Geol. 2015, 398, 70–84. [Google Scholar] [CrossRef] [Green Version]
- Kohn, M.J.; Corrie, S.L. Preserved Zr-temperatures and U–Pb ages in high-grade metamorphic titanite: Evidence for a static hot channel in the Himalayan orogen. Earth Planet. Sci. Lett. 2011, 311, 136–143. [Google Scholar] [CrossRef]
- Smith, M.; Storey, C.; Jeffries, T.E.; Ryan, C.G. In Situ U–Pb and Trace Element Analysis of Accessory Minerals in the Kiruna District, Norrbotten, Sweden: New Constraints on the Timing and Origin of Mineralization. J. Pet. 2009, 50, 2063–2094. [Google Scholar] [CrossRef] [Green Version]
- Aleinikoff, J.N.; Wintsch, R.P.; Fanning, C.M.; Dorais, M.J. U–Pb geochronology of zircon and polygenetic titanite from the Glastonbury Complex, Connecticut, USA: An integrated SEM, EMPA, TIMS, and SHRIMP study. Chem. Geol. 2002, 188, 125–147. [Google Scholar] [CrossRef]
- Paul, A.N.; Spikings, R.A.; Ulianov, A.; Ovtcharova, M. High temperature (>350 °C) thermal histories of the long lived (>500 Ma) active margin of Ecuador and Colombia: Apatite, titanite and rutile U–Pb thermochronology. Geochim. Cosmochim. Acta 2018, 228, 275–300. [Google Scholar] [CrossRef]
- Schoene, B.; Bowring, S.A. Determining accurate temperature–time paths from U–Pb thermochronology: An example from the Kaapvaal craton, southern Africa. Geochim. Cosmochim. Acta 2007, 71, 165–185. [Google Scholar] [CrossRef]
- Archibald, D.B.; Macquarrie, L.M.; Murphy, J.B.; Strachan, R.A.; McFarlane, C.R.; Button, M.; Larson, K.P.; Dunlop, J. The construction of the Donegal composite batholith, Irish Caledonides: Temporal constraints from U–Pb dating of zircon and titanite. GSA Bull. 2021, 33, 2335–2354. [Google Scholar] [CrossRef]
- Xiao, X.; Zhou, T.; White, N.C.; Zhang, L.; Fan, Y.; Chen, X. Multiple generations of titanites and their geochemical characteristics record the magmatic-hydrothermal processes and timing of the Dongguashan porphyry-skarn Cu-Au system, Tongling district, Eastern China. Miner. Deposita 2020, 56, 363–380. [Google Scholar] [CrossRef]
- Li, J.; Xu, L.L.; Bi, X.W.; Tang, Y.Y.; Sheng, X.Y.; Yu, H.J.; Liu, G.; Ma, R. New titanite U–Pb and molybdenite Re–Os ages for a hydrothermal vein-type Cu deposit in the Lanping Basin, Yunnan, SW China: Constraints on regional metallogeny and implications for exploration. Miner. Deposita 2020, 56, 441–456. [Google Scholar] [CrossRef]
- Hart-Madigan, L.; Wilkinson, J.J.; Lasalle, S.; Armstrong, R.N. U–Pb dating of hydrothermal titanite resolves multiple phases of propylitic alteration in the Oyu tolgoi porphyry district, mongolia. Econ. Geol. 2020, 115, 1605–1618. [Google Scholar] [CrossRef]
- Cao, M.; Qin, K.; Evans, N.J.; Li, G.; Ling, X.; McInnes, B.I.A.; Zhao, J. Titanite in situ SIMS U–Pb geochronology, elemental and Nd isotopic signatures record mineralization and fluid characteristics at the Pusangguo skarn deposit, Tibet. Miner. Deposita 2020, 56, 907–916. [Google Scholar] [CrossRef]
- Olierook, H.K.; Taylor, R.J.; Erickson, T.M.; Clark, C.; Reddy, S.M.; Kirkland, C.L.; Jahn, I.; Barham, M. Unravelling complex geologic histories using U–Pb and trace element systematics of titanite. Chem. Geol. 2018, 504, 105–122. [Google Scholar] [CrossRef]
- Song, S.; Mao, J.; Xie, G.; Chen, L.; Santosh, M.; Chen, G.; Rao, J.; Ouyang, Y. In situ LA-ICP-MS U–Pb geochronology and trace element analysis of hydrothermal titanite from the giant Zhuxi W (Cu) skarn deposit, South China. Miner. Deposita 2018, 54, 569–590. [Google Scholar] [CrossRef]
- Gawęda, A.; Szopa, K.; Chew, D.; O’Sullivan, G.J.; Burda, J.; Klötzli, U.; Golonka, J. Variscan post-collisional cooling and uplift of the Tatra Mountains crystalline block constrained by integrated zircon, apatite and titanite LA-(MC)-ICP-MS U–Pb dating and rare earth element analyses. Chem. Geol. 2018, 484, 191–209. [Google Scholar] [CrossRef] [Green Version]
- Fu, Y.; Sun, X.; Hollings, P.; Li, D.; Yang, T. Geochronology and trace element geochemistry of titanite in the Machangqing Cu-Mo-dominated polymetallic deposit, Yunnan Province, southwest China. J. Southeast Asian Earth Sci. 2018, 158, 398–414. [Google Scholar] [CrossRef]
- Fu, Y.; Sun, X.; Zhou, H.; Lin, H.; Yang, T. In-situ LA–ICP–MS U–Pb geochronology and trace elements analysis of polygenetic titanite from the giant Beiya gold–polymetallic deposit in Yunnan Province, Southwest China. Ore Geol. Rev. 2016, 77, 43–56. [Google Scholar] [CrossRef]
- Xu, L.; Bi, X.; Hu, R.; Tang, Y.; Wang, X.; Xu, Y. LA-ICP-MS mineral chemistry of titanite and the geological implications for exploration of porphyry Cu deposits in the Jinshajiang—Red River alkaline igneous belt, SW China. Miner. Pet. 2014, 109, 181–200. [Google Scholar] [CrossRef]
- Paul, A.N.; Spikings, R.A.; Chew, D.; Daly, J.S. The effect of intra-crystal uranium zonation on apatite U–Pb thermochronology: A combined ID-TIMS and LA-MC-ICP-MS study. Geochim. Cosmochim. Acta 2019, 251, 15–35. [Google Scholar] [CrossRef]
- Cochrane, R.; Spikings, R.A.; Chew, D.; Wotzlaw, J.-F.; Chiaradia, M.; Tyrrell, S.; Schaltegger, U.; van der Lelij, R. High temperature (>350 °C) thermochronology and mechanisms of Pb loss in apatite. Geochim. Cosmochim. Acta 2014, 127, 39–56. [Google Scholar] [CrossRef]
- Kennedy, A.K.; Kamo, S.L.; Nasdala, L.; Timms, N. Grenville skarn titanite: Potential reference material for Sims U-Th-Pb analysis. Can. Miner. 2010, 48, 1423–1443. [Google Scholar] [CrossRef]
- RRUFF Database. Available online: https://rruff.info/titanite/display=default/ (accessed on 1 June 2022).
- Phyo, M.M.; Bieler, E.; Franz, L.; Balmer, W.; Krzemnicki, M.S. Spinel from Mogok, Myanmar-A Detailed Inclusion Study by Raman Microspectroscopy and Scanning Electron Microscopy. J. Gemmol. 2019, 36, 418–435. [Google Scholar] [CrossRef]
- Xu, B.; Hou, Z.-Q.; Griffin, W.L.; Lu, Y.; Belousova, E.; Xu, J.-F.; O’Reilly, S.Y. Recycled volatiles determine fertility of porphyry deposits in collisional settings. Am. Miner. 2021, 106, 656–661. [Google Scholar] [CrossRef]
- Xu, B.; Griffin, W.L.; Xiong, Q.; Hou, Z.-Q.; O’Reilly, S.Y.; Guo, Z.; Pearson, N.J.; Gréau, Y.; Yang, Z.; Zheng, Y.-C. Ultrapotassic rocks and xenoliths from South Tibet: Contrasting styles of interaction between lithospheric mantle and asthenosphere during continental collision. Geology 2016, 45, 51–54. [Google Scholar] [CrossRef]
- Seneewong-Na-Ayutthaya, M.; Chongraktrakul, W.; Sripoonjan, T. Gemological Characterization of Peridot from Pyaung-Gaung in Mogok, Myanmar. Gems Gemol. 2022, 57, 318–337. [Google Scholar] [CrossRef]
- Mitchell, A.; Htay, M.T.; Htun, K.M.; Win, M.N.; Oo, T.; Hlaing, T. Rock relationships in the Mogok metamorphic belt, Tatkon to Mandalay, central Myanmar. J. Southeast Asian Earth Sci. 2007, 29, 891–910. [Google Scholar] [CrossRef]
- Xu, B.; Hou, Z.-Q.; Griffin, W.L.; Zheng, Y.-C.; Wang, T.; Guo, Z.; Hou, J.; Santosh, M.; O’Reilly, S.Y. Cenozoic lithospheric architecture and metallogenesis in Southeastern Tibet. Earth-Science Rev. 2020, 214, 103472. [Google Scholar] [CrossRef]
- Nikischer, T. Gems & Mines of Mogok Ted Themelis. Miner. News 2010, 26, 10. [Google Scholar]
- Zhang, D.; Guo, S.; Chen, Y.; Li, Q.; Ling, X.; Liu, C.; Sein, K. ~25 Ma Ruby Mineralization in the Mogok Stone Tract, Myanmar: New Evidence from SIMS U–Pb Dating of Coexisting Titanite. Minerals 2021, 11, 536. [Google Scholar] [CrossRef]
- Searle, M.P.; Garber, J.M.; Hacker, B.R.; Htun, K.; Gardiner, N.J.; Waters, D.J.; Robb, L.J. Timing of Syenite-Charnockite Magmatism and Ruby and Sapphire Metamorphism in the Mogok Valley Region, Myanmar. Tectonics 2020, 39, e2019TC005998. [Google Scholar] [CrossRef]
- Lamont, T.; Searle, M.; Hacker, B.; Htun, K.; Htun, K.M.; Morley, C.; Waters, D.; White, R. Late Eocene-Oligocene granulite facies garnet-sillimanite migmatites from the Mogok Metamorphic belt, Myanmar, and implications for timing of slip along the Sagaing Fault. Lithos 2021, 386–387, 106027. [Google Scholar] [CrossRef]
- Xu, B.; Hou, Z.Q.; Griffin, W.L.; O’Reilly, S.Y. Apatite halogens and Sr–O and zircon Hf–O isotopes: Recycled volatiles in Jurassic porphyry ore systems in southern Tibet. Chem. Geol. 2022, 10, 120924. [Google Scholar] [CrossRef]
- Win, M.M.; Enami, M.; Kato, T.; Thu, Y.K. A mechanism for Nb incorporation in rutile and application of Zr-in-rutile thermometry: A case study from granulite facies paragneisses of the Mogok metamorphic belt, Myanmar. Miner. Mag. 2017, 81, 1503–1521. [Google Scholar] [CrossRef]
- Horie, K.; Hidaka, H.; Gauthier-Lafaye, F. Elemental distribution in apatite, titanite and zircon during hydrothermal alteration: Durability of immobilization mineral phases for actinides. Phys. Chem. Earth Parts A/B/C 2008, 33, 962–968. [Google Scholar] [CrossRef]
- McDonough, W.F.; Sun, S.S. The composition of the Earth. Chem. Geol. 1995, 120, 223–253. [Google Scholar] [CrossRef]
- Bonamici, C.E.; Blum, T.B. Reconsidering initial Pb in titanite in the context of in situ dating. Am. Miner. 2020, 105, 1672–1685. [Google Scholar] [CrossRef]
- Ling, X.-X.; Li, Q.-L.; Huyskens, M.H.; Liu, Y.; Yin, Q.-Z.; Tang, G.-Q.; Li, J.; Zhang, H.-F.; Skublov, S.G.; Melnik, A.E.; et al. Matrix effects and improved calibration procedures for SIMS titanite U Pb dating. Chem. Geol. 2022, 593, 120755. [Google Scholar] [CrossRef]
- Erdmann, S.; Wang, R.; Huang, F.; Scaillet, B.; Zhao, K.; Liu, H.; Chen, Y.; Faure, M. Titanite: A potential solidus barometer for granitic magma systems. Comptes Rendus Geosci. 2019, 351, 551–561. [Google Scholar] [CrossRef]
- Hayden, L.A.; Watson, E.B.; Wark, D.A. A thermobarometer for sphene (titanite). Contrib. Mineral. Petrol. 2007, 155, 529–540. [Google Scholar] [CrossRef]
- Pan, L.-C.; Hu, R.-Z.; Bi, X.-W.; Li, C.; Wang, X.-S.; Zhu, J.-J. Titanite major and trace element compositions as petrogenetic and metallogenic indicators of Mo ore deposits: Examples from four granite plutons in the southern Yidun arc, SW China. Am. Miner. 2018, 103, 1417–1434. [Google Scholar] [CrossRef]
- Xie, L.; Wang, R.-C.; Chen, J.; Zhu, J.-C. Mineralogical evidence for magmatic and hydrothermal processes in the Qitianling oxidized tin-bearing granite (Hunan, South China): EMP and (MC)-LA-ICPMS investigations of three types of titanite. Chem. Geol. 2010, 276, 53–68. [Google Scholar] [CrossRef]
- Xu, B.; Hou, Z.-Q.; Zheng, Y.-C.; Wang, R.; He, M.-Y.; Zhou, L.-M.; Wang, Z.-X.; He, W.-Y.; Zhou, Y.; Yang, Y. In situ elemental and isotopic study of diorite intrusions: Implication for Jurassic arc magmatism and porphyry Cu-Au mineralisation in southern Tibet. Ore Geol. Rev. 2017, 90, 1063–1077. [Google Scholar] [CrossRef]
- Xu, B.; Hou, Z.Q.; Griffin, W.L.; Zhou, Y.; Zhang, Y.F.; Lu, Y.J.; Belousova, E.A.; Xu, J.F.; O’Reilly, S.Y. Elevated Magmatic Chlorine and Sulfur Concentrations in the Eocene–Oligocene Machangqing Cu–Mo Porphyry System. SEG Spec. Publ. 2021, 24, 257–276. [Google Scholar]


Publisher’s Note: MDPI stays neutral with regard to jurisdictional claims in published maps and institutional affiliations. |
© 2022 by the authors. Licensee MDPI, Basel, Switzerland. This article is an open access article distributed under the terms and conditions of the Creative Commons Attribution (CC BY) license (https://creativecommons.org/licenses/by/4.0/).
Share and Cite
Gu, J.; Xu, B.; Li, S.; Zhao, Y. Titanite Spectroscopy and In Situ LA-ICP-MS U–Pb Geochronology of Mogok, Myanmar. Crystals 2022, 12, 1050. https://doi.org/10.3390/cryst12081050
Gu J, Xu B, Li S, Zhao Y. Titanite Spectroscopy and In Situ LA-ICP-MS U–Pb Geochronology of Mogok, Myanmar. Crystals. 2022; 12(8):1050. https://doi.org/10.3390/cryst12081050
Chicago/Turabian StyleGu, Jialu, Bo Xu, Shu Li, and Yi Zhao. 2022. "Titanite Spectroscopy and In Situ LA-ICP-MS U–Pb Geochronology of Mogok, Myanmar" Crystals 12, no. 8: 1050. https://doi.org/10.3390/cryst12081050
APA StyleGu, J., Xu, B., Li, S., & Zhao, Y. (2022). Titanite Spectroscopy and In Situ LA-ICP-MS U–Pb Geochronology of Mogok, Myanmar. Crystals, 12(8), 1050. https://doi.org/10.3390/cryst12081050