
Anisotropy of the Electric Field Gradient in Two-Dimensional α-MoO3 Investigated by 57Mn(57Fe) Emission Mössbauer Spectroscopy

 ,
,  , , , , , ,
  , ,
, ,  ,
,
Abstract
:1. Introduction
Effects of Fe Doping in MoOx
2. Materials and Methods
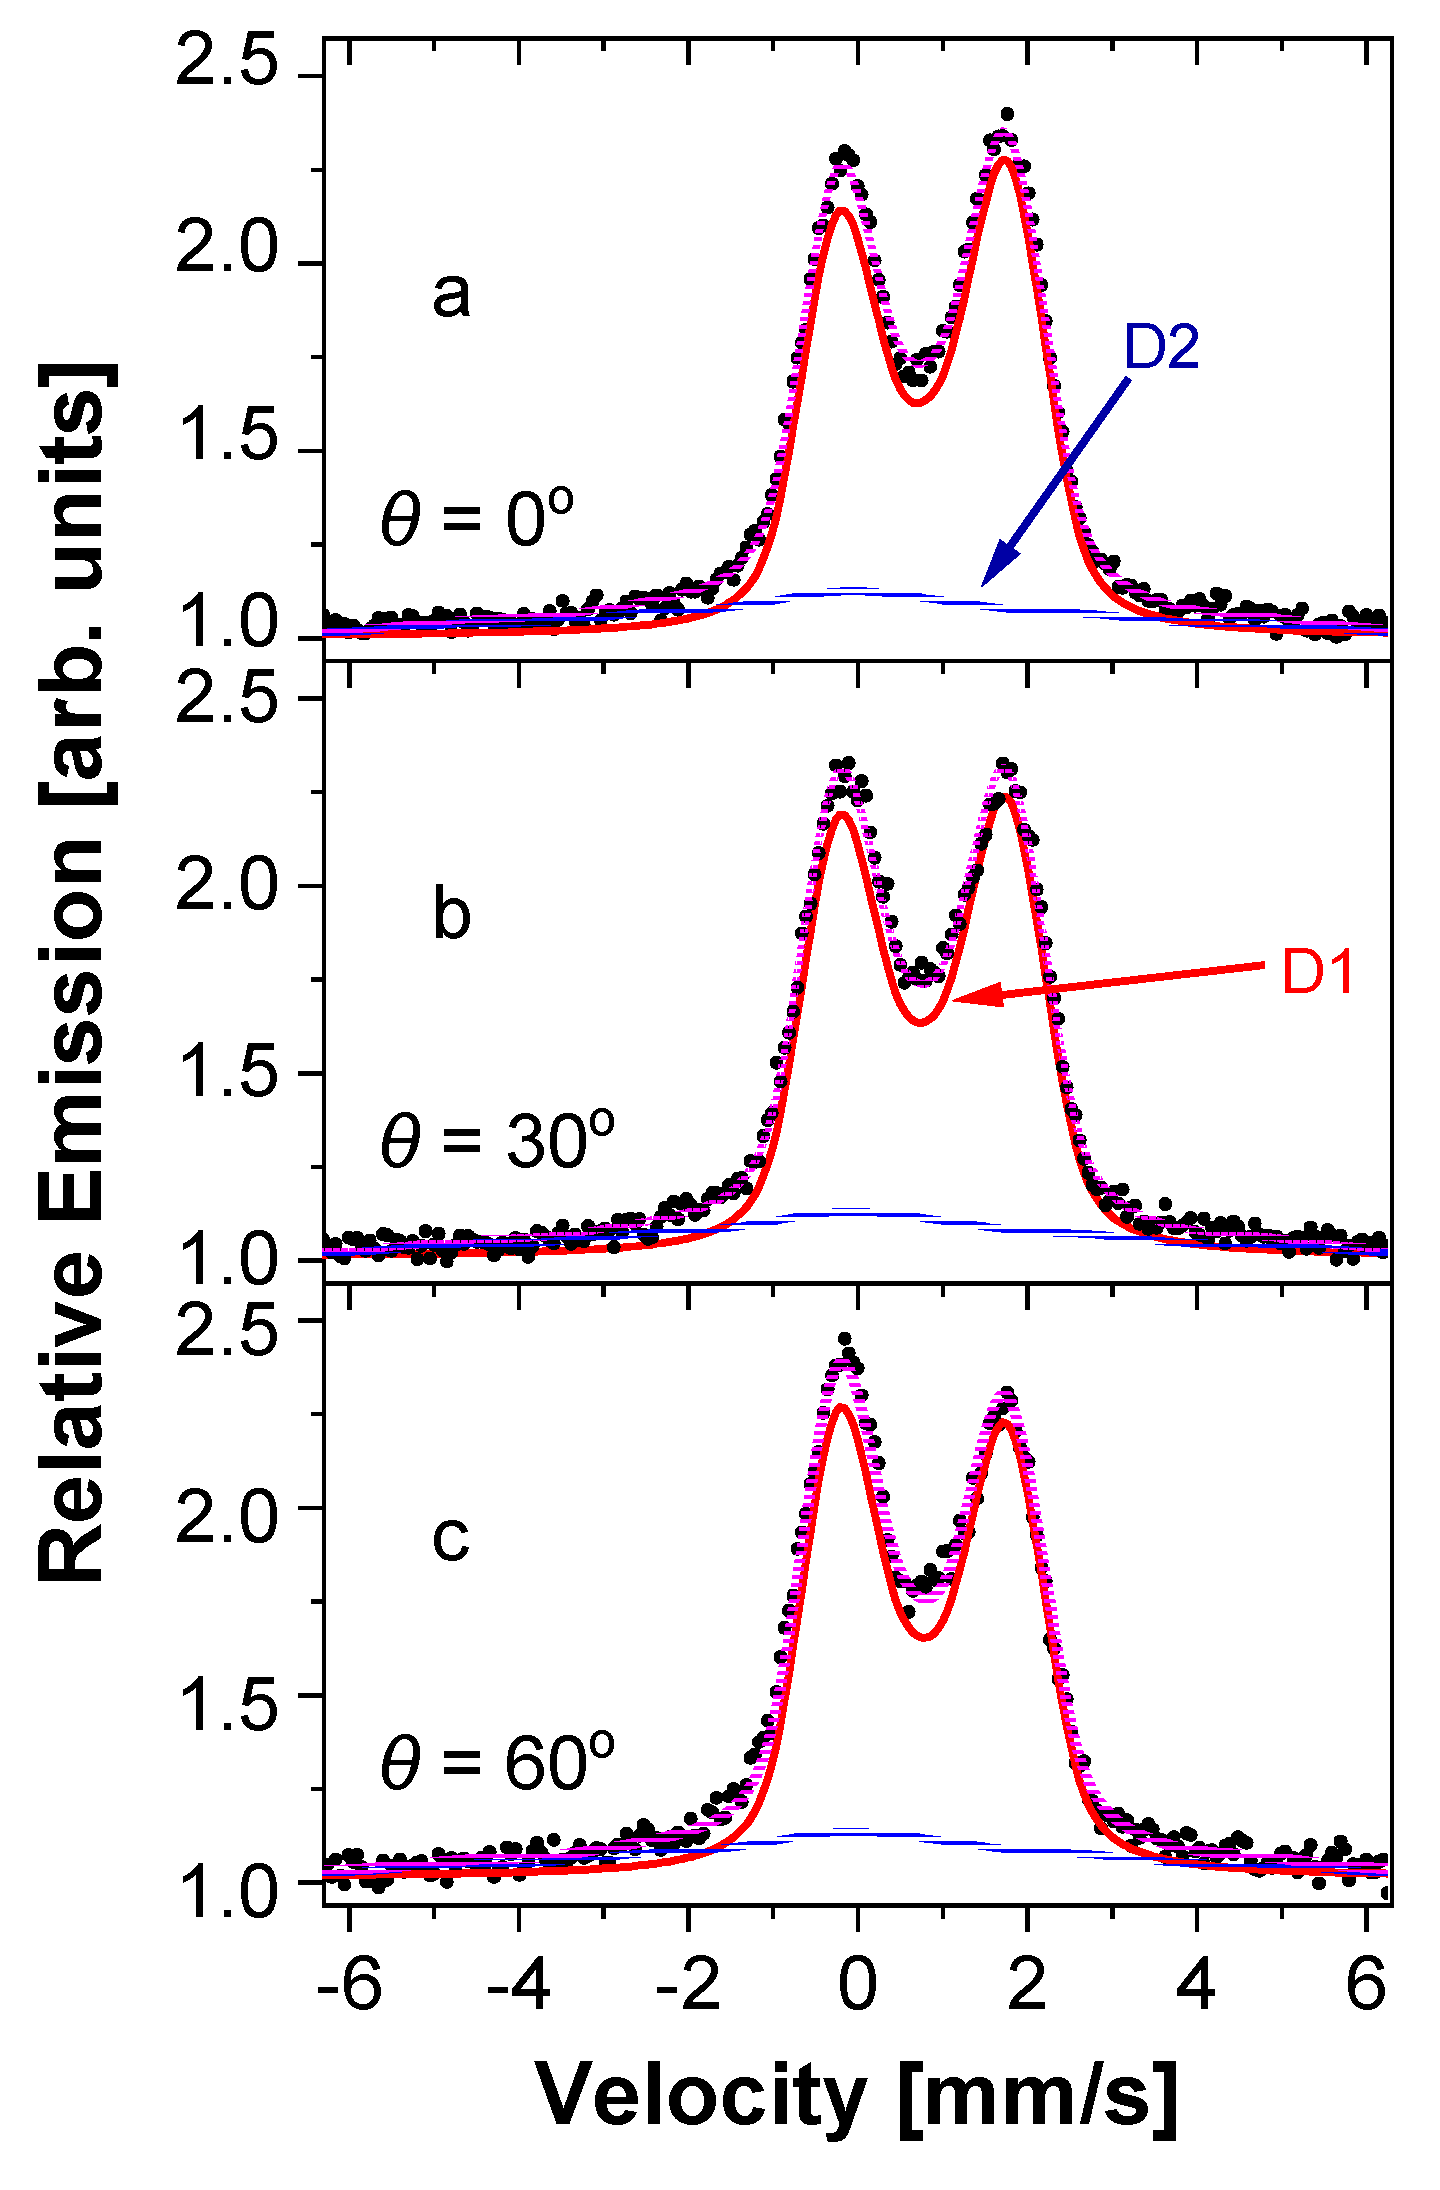
3. Results
4. Discussion
4.1. Local Environment 1 (D1)
4.2. Local Environment 2 (D2)
5. Conclusions
Author Contributions
Funding
Institutional Review Board Statement
Informed Consent Statement
Data Availability Statement
Acknowledgments
Conflicts of Interest
References
- Girotto, C.; Voroshazi, E.; Cheyns, D.; Heremans, P.; Rand, B.P. Solution-processed MoO3 thin films as a hole-injection layer for organic solar cells. ACS Appl. Mater. Interfaces 2011, 3, 3244–3247. [Google Scholar] [CrossRef] [PubMed]
- Labanowska, M. EPR monitoring of redox processes in transition metal oxide catalysts. Chem. Phys. Chem. 2001, 2, 712–731. [Google Scholar] [CrossRef]
- Comini, E.; Yubao, L.; Brando, Y.; Sberveglieri, G. Gas sensing properties of MoO3 nanorods to CO and CH3OH. Chem. Phys. Lett. 2005, 407, 368–371. [Google Scholar]
- Zhou, J.; Xu, N.-S.; Deng, S.-Z.; Chen, J.; She, J.-C.; Wang, Z.L. Large-area nanowire arrays of molybdenum and molybdenum oxides: Synthesis and field emission properties. Adv. Mater. 2003, 15, 1835–1840. [Google Scholar] [CrossRef]
- Hu, X.; Zhang, W.; Liu, X.; Mei, Y.; Huang, Y. Nanostructured Mo-based electrode materials for electrochemical energy storage. Chem. Soc. Rev. 2015, 44, 2376–2404. [Google Scholar] [CrossRef]
- Yao, J.N.; Hashimoto, K.; Fujishima, A. Photochromism induced in an electrolytically pretreated MoO3 thin film by visible light. Nature 1992, 355, 624–626. [Google Scholar] [CrossRef]
- Madhuri, K.V.; Dixit, D. Study on structural and optical properties of thermally evaporated MoO3 thin films. Bull. Mater. Sci. 2022, 45, 83. [Google Scholar] [CrossRef]
- Huang, P.-R.; He, Y.; Cao, C.; Lu, Z.-H. Impact of lattice distortion and electron doping on α-MoO3 electronic structure. Sci. Rep. 2014, 4, 7131. [Google Scholar] [CrossRef] [Green Version]
- Chen, H.Y.; Su, H.-C.; Chen, C.-H.; Liu, K.-L.; Tsai, C.-M.; Yen, S.-J.; Yew, T.-R. Indium-doped molybdenum oxide as a new p-type transparent conductive oxide. Mater. Chem. 2011, 21, 5745–5752. [Google Scholar] [CrossRef]
- Vila, M.; Díaz-Guerra, C.; Jerez, D.; Lorenz, K.; Piqueras, J.; Alves, E. Intense luminescence emission from rare-earth doped MoO3 nanoplates and lamellar crystals for optoelectronic applications. J. Phys. D Appl. Phys. 2014, 47, 355105. [Google Scholar] [CrossRef]
- Pereira, D.R.; Díaz-Guerra, C.; Peres, M.; Magalhaes, S.; Correia, J.G.; Marques, J.G.; Silva, A.G.; Alves, E.; Lorenz, K. Engineering strain and conductivity of MoO3 by ion implantation. Acta Mater. 2019, 169, 15–27, Erratum in 2020, 199, 425–428. [Google Scholar] [CrossRef]
- Pereira, D.R.; Peresa, M.; Alves, L.C.; Correia, J.G.; Díaz-Guerra, C.; Silva, A.G.; Alves, E.; Lorenz, K. Electrical characterization of molybdenum oxide lamellar crystals irradiated with UV light and proton beams. Surf. Coat. Technol. 2018, 355, 50–54. [Google Scholar] [CrossRef]
- Zhetbaev, A.; Ibragimov, S.S.; Shokanov, A. Mössbauer study of molybdenum oxidation kinetics. J. Phys. Colloq. 1980, 41, C1-387–C1-388. [Google Scholar] [CrossRef]
- Qi, B.; Gunnlaugsson, H.P.; Ólafsson, S.; Gislason, H.P.; Thorsteinsson, E.B.; Arnalds, U.B.; Mantovan, R.; Unzueta, I.; Zyabkin, D.V.; Bharuth-Ram, K.; et al. Metal-insulator transition in crystalline V2O3 thin films probed at atomic scale using emission Mössbauer spectroscopy. Thin Solid Films 2020, 714, 138389. [Google Scholar] [CrossRef]
- Zyabkin, D.V.; Gunnlaugsson, H.P.; Gonçalves, J.N.; Bharuth-Ram, K.; Qi, B.; Unzueta, I.; Naidoo, D.; Mantovan, R.; Masenda, H.; Ólafsson, S.; et al. Experimental and theoretical study of electronic and hyperfine properties of hydrogenated anatase (TiO2): Defect interplay and thermal stability. J. Phys. Chem. C. 2020, 124, 7511–7522. [Google Scholar] [CrossRef] [Green Version]
- Stevens, J.G. Isomer shift reference scales. Hyperfine Interact. 1983, 13, 221–236. [Google Scholar] [CrossRef]
- Peelaers, H.; Chabinyc, M.L.; Van de Walle, C.G. Controlling n-type doping in MoO3. Chem. Mater. 2017, 29, 2563–2567. [Google Scholar] [CrossRef]
- Ouyang, Q.-Y.; Li, L.; Wang, Q.-S.; Zhang, Y.; Wang, T.-S.; Meng, F.-N.; Chen, Y.-J.; Gao, P. Facile synthesis and enhanced H2S sensing performances of Fe-doped α-MoO3 micro-structures. Sens. Actuators B Chem. 2012, 169, 17–25. [Google Scholar] [CrossRef]
- Tiwari, S.; Master, R.; Choudhary, R.J.; Phase, D.M.; Ahuja, B.L. Effect of oxygen partial pressure and Fe doping on growth and properties of metallic and insulating molybdenum oxide thin films. J. Appl. Phys. 2012, 111, 083905. [Google Scholar] [CrossRef]
- Weyer, G.; The ISOLDE Collaboration. Mössbauer spectroscopy at ISOLDE. Hyperfine Interact. 2000, 129, 371–390. [Google Scholar] [CrossRef]
- Weyer, G. Defects in semiconductors—results from Mössbauer spectroscopy. Hyperfine Interact. 2007, 177, 1–13. [Google Scholar] [CrossRef]
- Johnston, K.; Schell, J.; Correia, J.G.; Deicher, M.; Gunnlaugsson, H.P.; Fenta, A.S.; David-Bosne, E.; Costa, A.R.G.; Lupascu, D.C. The solid state physics programme at ISOLDE: Recent developments and perspectives. J. Phys. G Nucl. Part. Phys. 2017, 44, 104001. [Google Scholar] [CrossRef]
- Catherall, R.; Andreazza, W.; Breitenfeldt, M.; Dorsival, A.; Focker, G.J.; Gharsa, T.P.; Giles, T.; Grenard, J.-L.; Locci, F.; Martins, P.; et al. The ISOLDE facility. J. Phys. G Nucl. Part. Phys. 2017, 44, 094002. [Google Scholar] [CrossRef] [Green Version]
- Mantovan, R.; Fallica, R.; Gerami, A.M.; Mølholt, T.E.; Wiemer, C.; Longo, M.; Gunnlaugsson, H.P.; Johnston, K.; Masenda, H.; Naidoo, D.; et al. Atomic-scale study of the amorphous-to-crystalline phase transition mechanism in GeTe thin films. Sci. Rep. 2017, 7, 8234. [Google Scholar] [CrossRef] [PubMed] [Green Version]
- Ziegler, J.F.; Ziegler, M.D.; Biersack, J.P. SRIM—The Stopping and Range of Ions in Matter. Nucl. Instr. Meth. 2010, B268, 1818–1823. [Google Scholar] [CrossRef] [Green Version]
- Kresse, G.; Furthmüller, J. Efficient iterative schemes for ab initio total-energy calculations using a plane-wave basis set. Phys. Rev. B 1996, 54, 11169–11186. [Google Scholar] [CrossRef]
- Blöchl, P.E. Projector augmented-wave method. Phys. Rev. B 1994, 50, 17953–17979. [Google Scholar] [CrossRef] [Green Version]
- Perdew, J.P.; Burke, K.; Ernzerhof, M. Generalized gradient approximation made simple. Phys. Rev. Lett. 1996, 77, 3865–3868. [Google Scholar] [CrossRef] [Green Version]
- Dudarev, S.L.; Botton, G.A.; Savrasov, S.Y.; Humphreys, C.J.; Sutton, A.P. Electron-energy-loss spectra and the structural stability of nickel oxide: An LSDA + U study. Phys. Rev. B 1998, 57, 1505–1509. [Google Scholar] [CrossRef]
- Zheng, H.C. Vapour phase growth of orthorhombic molybdenum trioxide crystals at normal pressure of purified air. J. Cryst. Growth 1998, 186, 393–402. [Google Scholar] [CrossRef]
- Py, M.A.; Maschke, K. Intra- and interlayer contributions to the lattice vibrations in MoO3. Physica B+C 1981, 105, 370–374. [Google Scholar] [CrossRef]
- Dieterle, M.; Weinberg, G.; Mestl, G. Raman spectroscopy of molybdenum oxides: Part I. Structural characterization of oxygen defects in MoO3−x by DR UV/VIS, Raman spectroscopy and x-ray diffraction. Phys. Chem. Chem. Phys. 2002, 4, 812–821. [Google Scholar] [CrossRef]
- Vila, M.; Díaz-Guerra, C.; Lorenz, K.; Piqueras, J.; Píš, I.; Magnano, E.; Munuera, C.; Alves, E.; García-Hernández, M. Effects of thermal annealing on the structural and electronic properties of rare earth-implanted MoO3 nanoplates. CrystEngComm 2017, 19, 2339–2348. [Google Scholar] [CrossRef]
- Mølholt, T.E.; Gunnlaugsson, H.P.; Johnston, K.; Mantovan, R.; Masenda, H.; Ólafsson, S.; Bharuth-Ram, K.; Gislason, H.P.; Langouche, G.; Weyer, G. ISOLDE Collaboration. Spin-lattice relaxations of paramagnetic Fe3+ in ZnO. Phys. Scr. 2012, 2012, 014006. [Google Scholar] [CrossRef]
- Mølholt, T.E.; Mantovan, R.; Gunnlaugsson, H.P.; Naidoo, D.; Ólafsson, S.; Bharuth-Ram, K.; Fanciulli, M.; Johnston, K.; Kobayashi, Y.; Langouche, G.; et al. Observation of spin-lattice relaxations of dilute Fe3+ in MgO by Mössbauer spectroscopy. Hyperfine Interact. 2010, 197, 89–94. [Google Scholar] [CrossRef]
- Gunnlaugsson, H.P. A simple model to extract hyperfine interaction distributions from Mössbauer spectra. Hyperfine Interact. 2006, 167, 851–854. [Google Scholar] [CrossRef]
- Gunnlaugsson, H.P. Spreadsheet based analysis of Mössbauer spectra. Hyperfine Interact. 2016, 237, 79. [Google Scholar] [CrossRef]
- Gütlich, P.; Bill, E.; Trautwein, A.X. Mössbauer Spectroscopy and Transition Metal Chemistry: Fundamentals and Applications; Springer: Berlin/Heidelberg, Germany, 2011. [Google Scholar]
- Sitepu, H.; O’Connor, B.H.; Li, D. Comparative evaluation of the march and generalized spherical harmonic preferred orientation models using X-ray diffraction data for molybdite and calcite powders. J. Appl. Crystallogr. 2005, 38, 158–167. [Google Scholar] [CrossRef]
- Momma, K.; Izumi, F. VESTA 3 for three-dimensional visualization of crystal, volumetric and morphology data. J. Appl. Crystallogr. 2011, 44, 1272–1276. [Google Scholar] [CrossRef]
- Ma, W.; Alonso-González, P.; Li, S.; Nikitin, A.Y.; Yuan, J.; Martín-Sánchez, J.; Taboada-Gutiérrez, J.; Amenabar, I.; Li, P.; Vélez, S.; et al. In-plane anisotropic and ultra-low-loss polaritons in a natural van der Waals crystal. Nature 2018, 562, 557–563. [Google Scholar] [CrossRef] [Green Version]
- Greenwood, N.N.; Gibb, T.C. Mössbauer Spectroscopy; Chapman and Hall: London, UK, 1971. [Google Scholar]
- Wdowik, U.D.; Ruebenbauer, K. Calibration of the isomer shift for the 14.4-keV transition in 57Fe using the full-potential linearized augmented plane-wave method. Phys. Rev. B 2007, 76, 155118-1–155118-6. [Google Scholar] [CrossRef]
- Blaha, P.; Schwarz, K.; Tran, F.; Laskowski, R.; Madsen, G.K.H.; Marks, L.D. WIEN2k: An APW+lo program for calculating the properties of solids. J. Chem. Phys. 2020, 152, 074101. [Google Scholar] [CrossRef] [PubMed]
- Car, R.; Parrinello, M. Unified approach for molecular dynamics and density-functional theory. Phys. Rev. Lett. 1985, 55, 2471–2474. [Google Scholar] [CrossRef] [PubMed] [Green Version]
- Gunnlaugsson, H.P.; Mantovan, R.; Masenda, H.; Mølholt, T.E.; Johnston, K.; Bharuth-Ram, K.; Gislason, H.; Langouche, G.; Naidoo, D.; Ólafsson, S.; et al. ISOLDE Collaboration. Defect annealing in Mn/Fe-implanted TiO2 (rutile). J. Phys. D Appl. Phys. 2014, 47, 065501-1–065501-7. [Google Scholar] [CrossRef]
- Gunnlaugsson, H.P.; Johnston, K.; Mølholt, T.E.; Weyer, G.; Mantovan, R.; Masenda, H.; Naidoo, D.; Ólafsson, S.; Bharuth-Ram, K.; Gíslason, H.P.; et al. ISOLDE Collaboration. Lattice locations and properties of Fe in Co/Fe co-implanted ZnO. Appl. Phys. Lett. 2012, 100, 042109-1–042109-4. [Google Scholar] [CrossRef]
- Schell, J.; Correia, J.G.M.; Lorenz, K.; Peres, M.; Díaz-Guerra, C.; Gunnlaugsson, H.P.; Tarazaga, A.; Deicher, M. Study of Molybdenum Oxide by Means of Perturbed Angular Correlations and Mössbauer Spectroscopy. Proposal to the ISOLDE and Neutron Time-of-Flight Committee. 2016, CERN-INTC-2016-004/INTC-P-454. Available online: https://cds.cern.ch/record/2119980/files/INTC-P-454.pdf (accessed on 31 May 2022).


| Emission Angle | 0° | |
|---|---|---|
| D1 | δ (mm/s) | 0.81(3) |
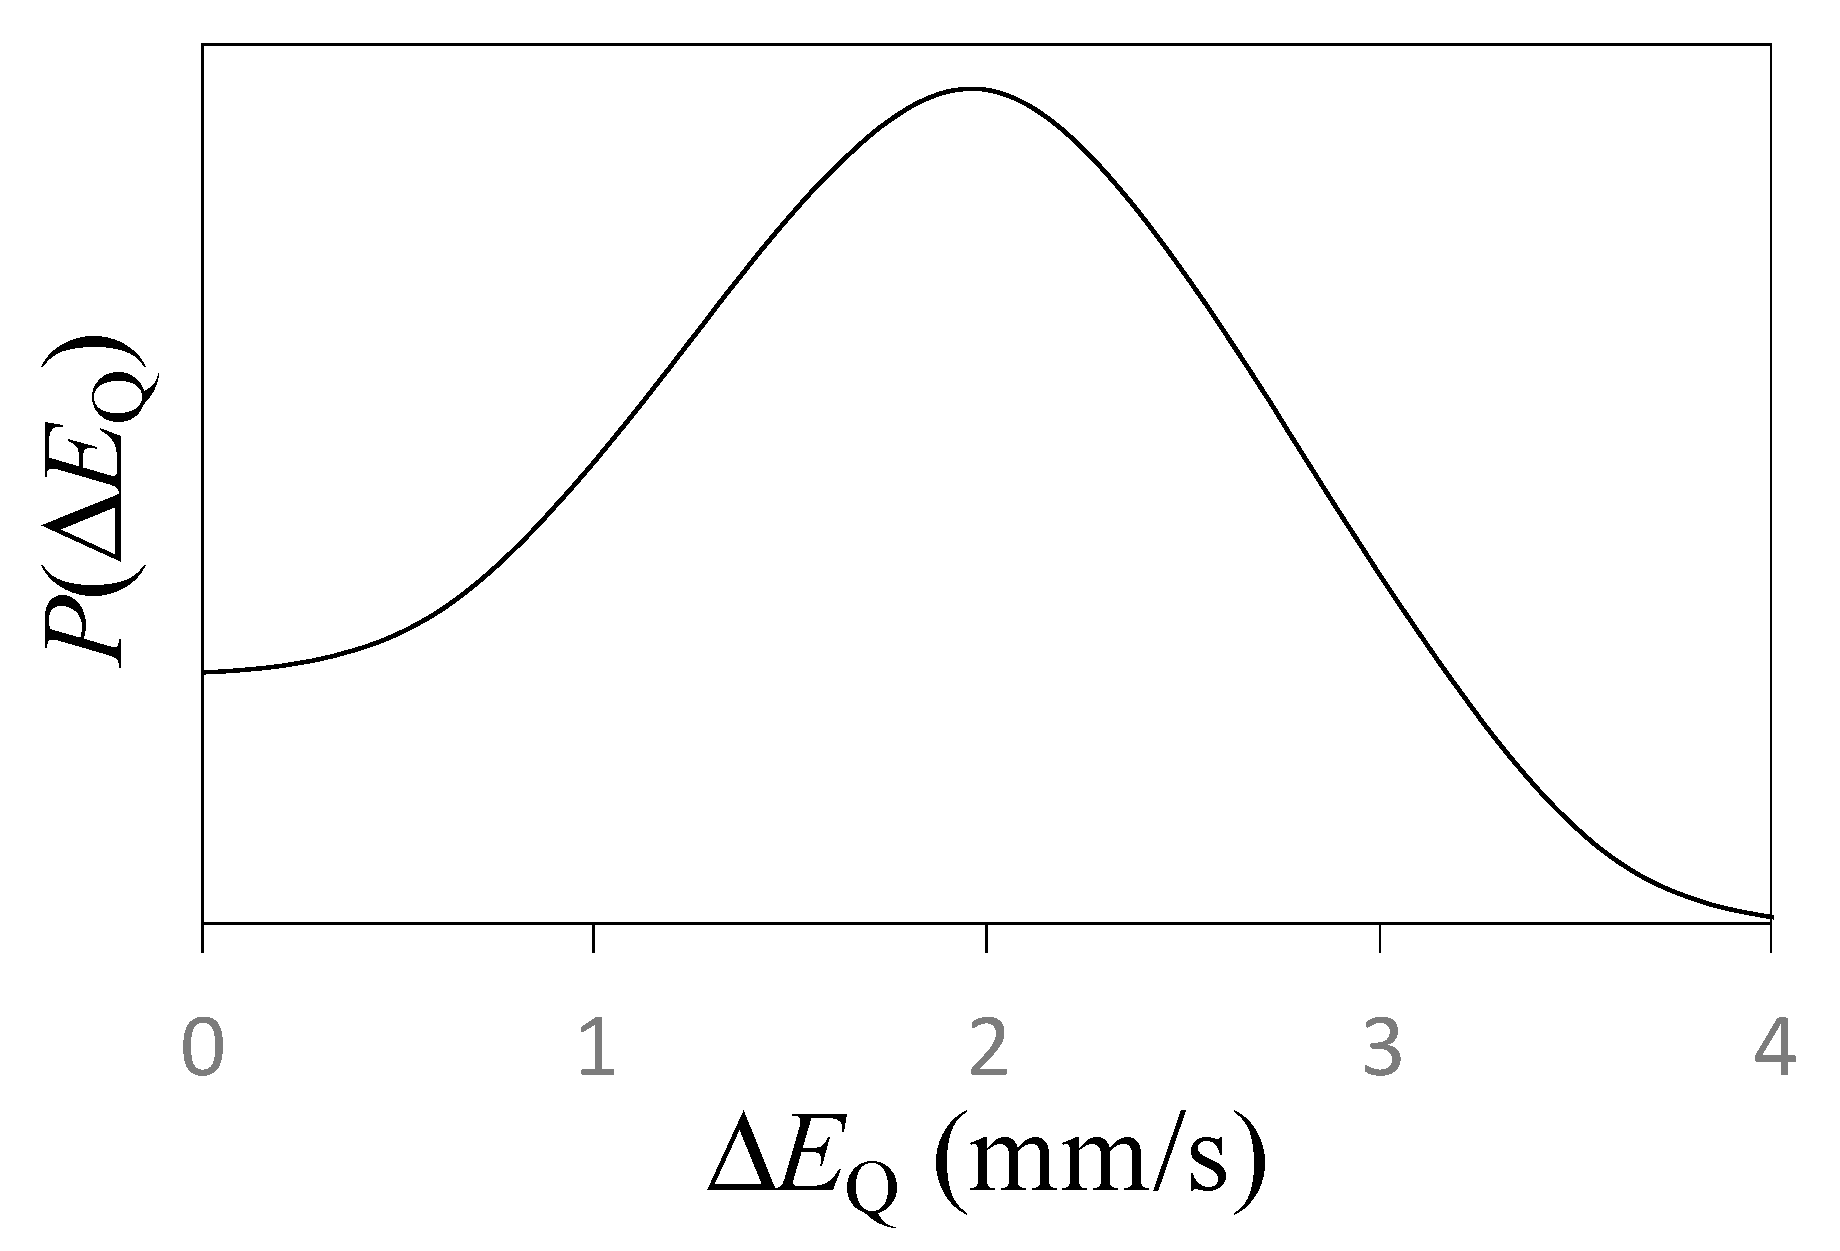
| <ΔEQ> (mm/s) | 1.81(6) | |
| Area (%) | 69(6) | |
| Fe Configuration | Vzz (1021 V/m2) | η | ΔEQ (mm/s) | Energy (meV/f.u.) |
|---|---|---|---|---|
| Substitutional to Mo | 2.83 | 0.30 | 0.51 | -- |
| Substitutional to Mo with O(1) vacancy | 10.18 | 0.00 | 1.81 | 0 |
| Substitutional to Mo with O(2) vacancies | −7.94 | 0.15 | 1.41 | 39 |
| Substitutional to Mo with O(3) vacancy | −3.90 | 0.40 | 0.71 | 96 |
Publisher’s Note: MDPI stays neutral with regard to jurisdictional claims in published maps and institutional affiliations. |
© 2022 by the authors. Licensee MDPI, Basel, Switzerland. This article is an open access article distributed under the terms and conditions of the Creative Commons Attribution (CC BY) license (https://creativecommons.org/licenses/by/4.0/).
Share and Cite
Schell, J.; Zyabkin, D.; Bharuth-Ram, K.; Gonçalves, J.N.; Díaz-Guerra, C.; Gunnlaugsson, H.P.; Martín-Luengo, A.T.; Schaaf, P.; Bonanni, A.; Masenda, H.; et al. Anisotropy of the Electric Field Gradient in Two-Dimensional α-MoO3 Investigated by 57Mn(57Fe) Emission Mössbauer Spectroscopy. Crystals 2022, 12, 942. https://doi.org/10.3390/cryst12070942
Schell J, Zyabkin D, Bharuth-Ram K, Gonçalves JN, Díaz-Guerra C, Gunnlaugsson HP, Martín-Luengo AT, Schaaf P, Bonanni A, Masenda H, et al. Anisotropy of the Electric Field Gradient in Two-Dimensional α-MoO3 Investigated by 57Mn(57Fe) Emission Mössbauer Spectroscopy. Crystals. 2022; 12(7):942. https://doi.org/10.3390/cryst12070942
Chicago/Turabian StyleSchell, Juliana, Dmitry Zyabkin, Krish Bharuth-Ram, João N. Gonçalves, Carlos Díaz-Guerra, Haraldur P. Gunnlaugsson, Aitana Tarazaga Martín-Luengo, Peter Schaaf, Alberta Bonanni, Hilary Masenda, and et al. 2022. "Anisotropy of the Electric Field Gradient in Two-Dimensional α-MoO3 Investigated by 57Mn(57Fe) Emission Mössbauer Spectroscopy" Crystals 12, no. 7: 942. https://doi.org/10.3390/cryst12070942
APA StyleSchell, J., Zyabkin, D., Bharuth-Ram, K., Gonçalves, J. N., Díaz-Guerra, C., Gunnlaugsson, H. P., Martín-Luengo, A. T., Schaaf, P., Bonanni, A., Masenda, H., Dang, T. T., Mølholt, T. E., Ólafsson, S., Unzueta, I., Mantovan, R., Johnston, K., Gíslason, H. P., Krastev, P. B., Naidoo, D., & Qi, B. (2022). Anisotropy of the Electric Field Gradient in Two-Dimensional α-MoO3 Investigated by 57Mn(57Fe) Emission Mössbauer Spectroscopy. Crystals, 12(7), 942. https://doi.org/10.3390/cryst12070942