Article

Behavior of B- and Z-DNA Crystals under High Hydrostatic Pressure

by
Thierry Prangé
1,*,
Nathalie Colloc’h
2,
Anne-Claire Dhaussy
3,
Marc Lecouvey
4,
Evelyne Migianu-Griffoni
4 and
Eric Girard
5
1
CiTCoM, UMR 8038 CNRS, Faculté de Pharmacie, Université de Paris, 75006 Paris, France
2
ISTCT, UMR 6030 CNRS, Centre Cyceron, Université de Caen-Normandie, 14000 Caen, France
3
Ensicaen, Unicaen, CNRS, CRISMAT UMR 6508, Université de Normandie, 14000 Caen, France
4
CSPBAT, UMR 7244 CNRS, Université Sorbonne Paris Nord, 93000 Bobigny, France
5
CEA, CNRS, IBS, Université Grenoble Alpes, 38000 Grenoble, France
*
Author to whom correspondence should be addressed.
Crystals 2022, 12(6), 871; https://doi.org/10.3390/cryst12060871
Submission received: 31 May 2022 / Revised: 17 June 2022 / Accepted: 17 June 2022 / Published: 20 June 2022
(This article belongs to the Special Issue Crystalline Phases under Extreme Conditions)

Abstract

:
Single crystals of B-DNA and Z-DNA oligomers were analyzed under high hydrostatic pressure and their behavior was compared to the A-DNA crystals already known. The amplitude of the base compression, when compared to the A-form of DNA (0.13 Å/GPa), was higher for the Z-DNA (0.32 Å/GPa) and was the highest for the B-DNA (0.42 Å/GPa). The B-DNA crystal degraded rapidly around 400–500 MPa, while the Z-structure was more resistant, up to 1.2 GPa.

1. Introduction

Nucleic acids are universally accepted as the components of a self-replicating system in the very first stages of the emergence of life on Earth [1,2,3]. The base pairing mechanism provides the most elegant mechanism by which the molecule directs the synthesis of its complement from mononucleotides or short oligonucleotides, while no equivalent mechanism is known for the replication of polypeptides. As the seminal DNA/RNA world is supposed to have emerged in very harsh conditions, the stability of DNA was widely investigated versus time, temperature, and environmental conditions including pressure [4,5,6,7]. Recent studies highlighted, using DNA amplification techniques on prehistoric/ancient samples [8,9], that DNA fragments can survive very long periods of time. In the present paper, we focused on pressure effects on the double stranded helix of DNA, and, more precisely, on the stability and resistance of DNA in the crystalline state. In this study, we selected two short oligomers: the dodecamer d(CGCGTTAACGCG)2 and the hexamer d(CGCGCG)2 with the aim to compare their behavior in relation with the A-DNA already analyzed under pressure [10]. The first oligomer is the prototype of the B form, also called the Dickerson’s DNA [11]. The second crystallizes in the left-handed Z form of DNA (the Rich’s DNA) [12] and leads to diffraction to high resolution. Both structures are well-documented with several depositions in the Protein Data Bank, free or in complex with various ligands.

2. Materials and Methods

The two sequences d(CGCGTTAACGCG)2 and d(CGCGCG)2 were synthesized using the standard phosphoramidite chemistry on solid support [13] in an Applied Biosystem 391 DNA synthesizer. The two compounds were lyophilized as ammonium salts and were stored at −20 °C for further use.

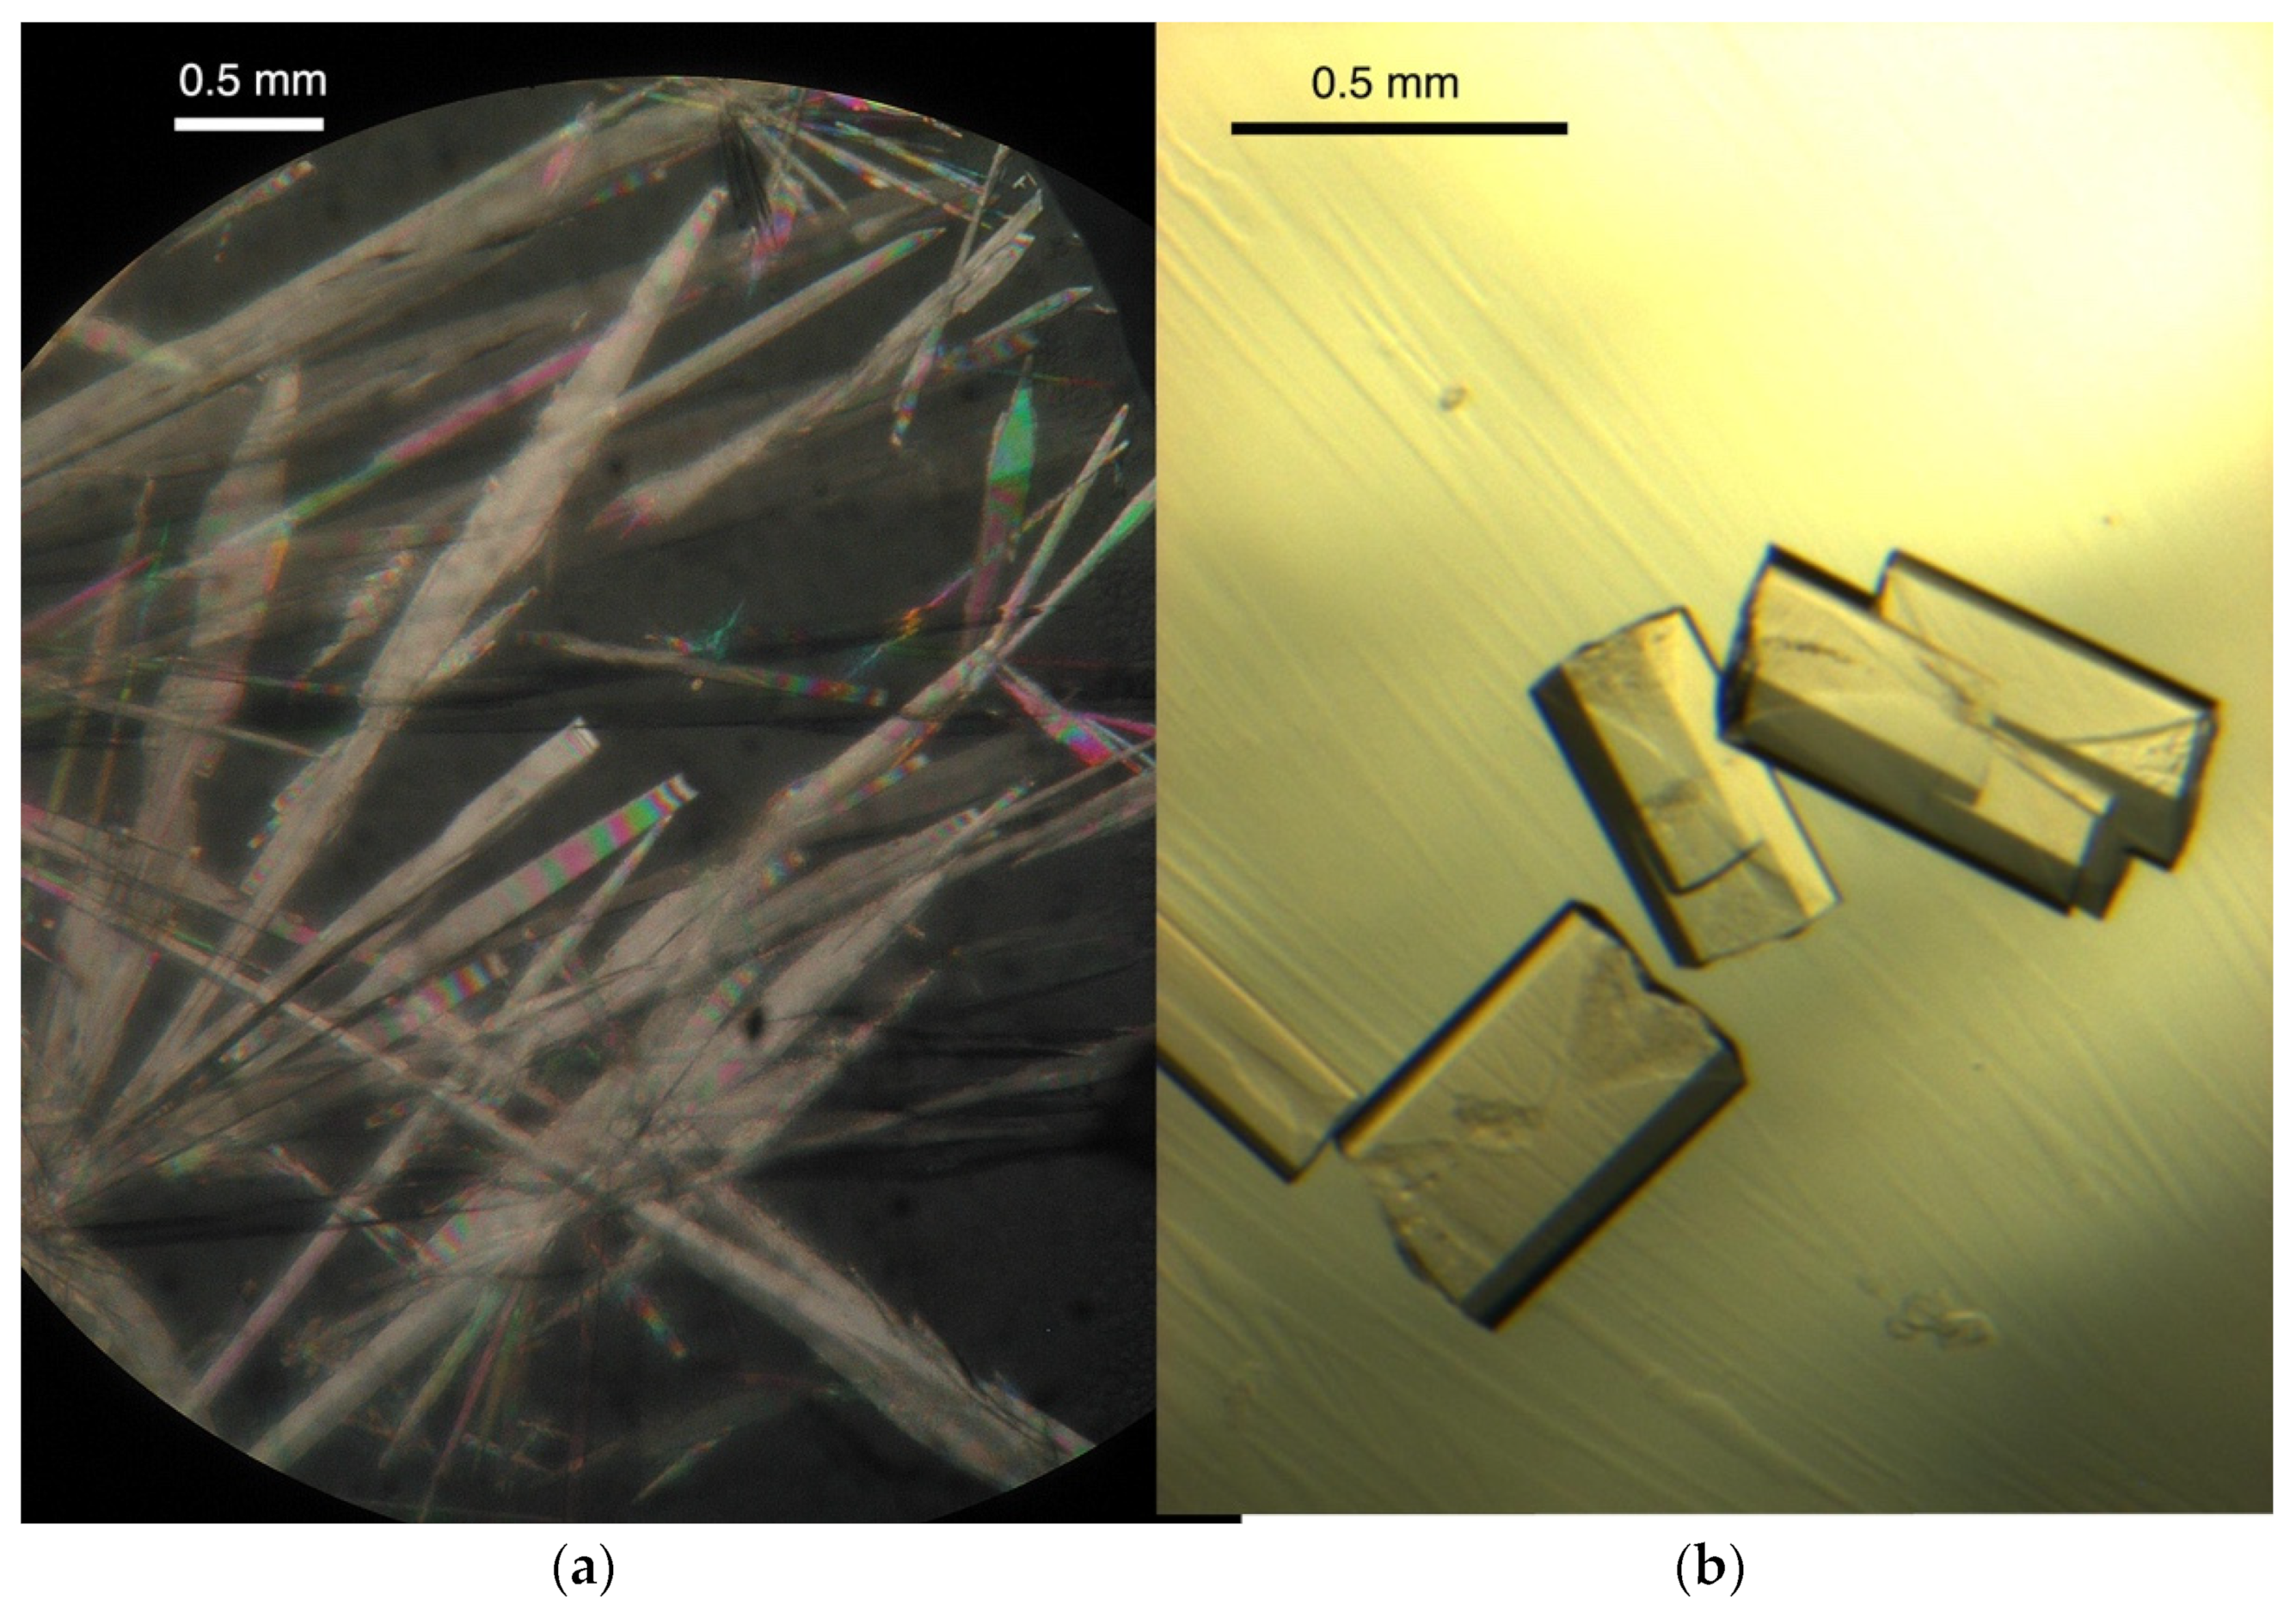
2.1. Crystalizations

DNA oligomer crystals are best grown in the presence of 2-methyl 2,4-pentanediol (MPD) as the crystallizing agent [14]. High pressure crystallography (HPMX) requires crystals, typically 200 µm to 400 µm in length. Dodecamer and hexamer crystals were produced according to the “batch” methodology, using appropriate crystallization glass plates containing rows of 3-spot wells that were previously siliconized. In each row, the central well is connected to the two others by channels cut in the glass to allow vapor diffusion and equilibration between them. A siliconized slide isolates each three-well system from the exterior. To each central well, is typically added a solution of 20–30% MPD (w:w) in cacodylate buffer 0.1 M (pH = 6.9 and 0.01 M MgCl2) while in the two lateral wells are added 10 μL of the nucleotide solution (10 mg/mL in the same cacodylate buffer) plus 10 μL of the central well. Each three-well system is covered by a slide and left to equilibrate. Crystals are usually obtained in two to three days. They are stable in their mother liquor at 290 K for a few weeks (Figure 1).

2.2. Pressurization and Compression Monitorings

Crystals were hydrostatically compressed in a diamond anvil cell (DAC) [15], as previously described [16,17,18]. The solution used as the compression medium consisted of the mother liquor with a higher concentration of MPD (25–30%) so as to stabilize the crystals inside the DAC chamber. The pressure within the DAC compression chamber was monitored through the pressure-dependent fluorescence of a ruby chip used as an internal probe (R1 line, 694.2 nm) [19]. All recordings were performed at room temperature (298 K).

2.3. B-DNA and Z-DNA Data Recordings

Full data recordings were performed with only one crystal for each data set, thanks to the large aperture of the DAC. As data collections were realized at room temperature, the crystals were translated in the beam every 15° of rotation to limit the degradation by irradiating fresh portions of the crystal. In all cases, the angular aperture of the DAC limited the number of independent reflections that could be recorded to about 75–80% of the total available [20]. The validity and usefulness of the corresponding refinements performed with uncompleted data will be discussed later, especially regarding the accuracy we were expecting on the geometric parameters of the DNA scaffold.
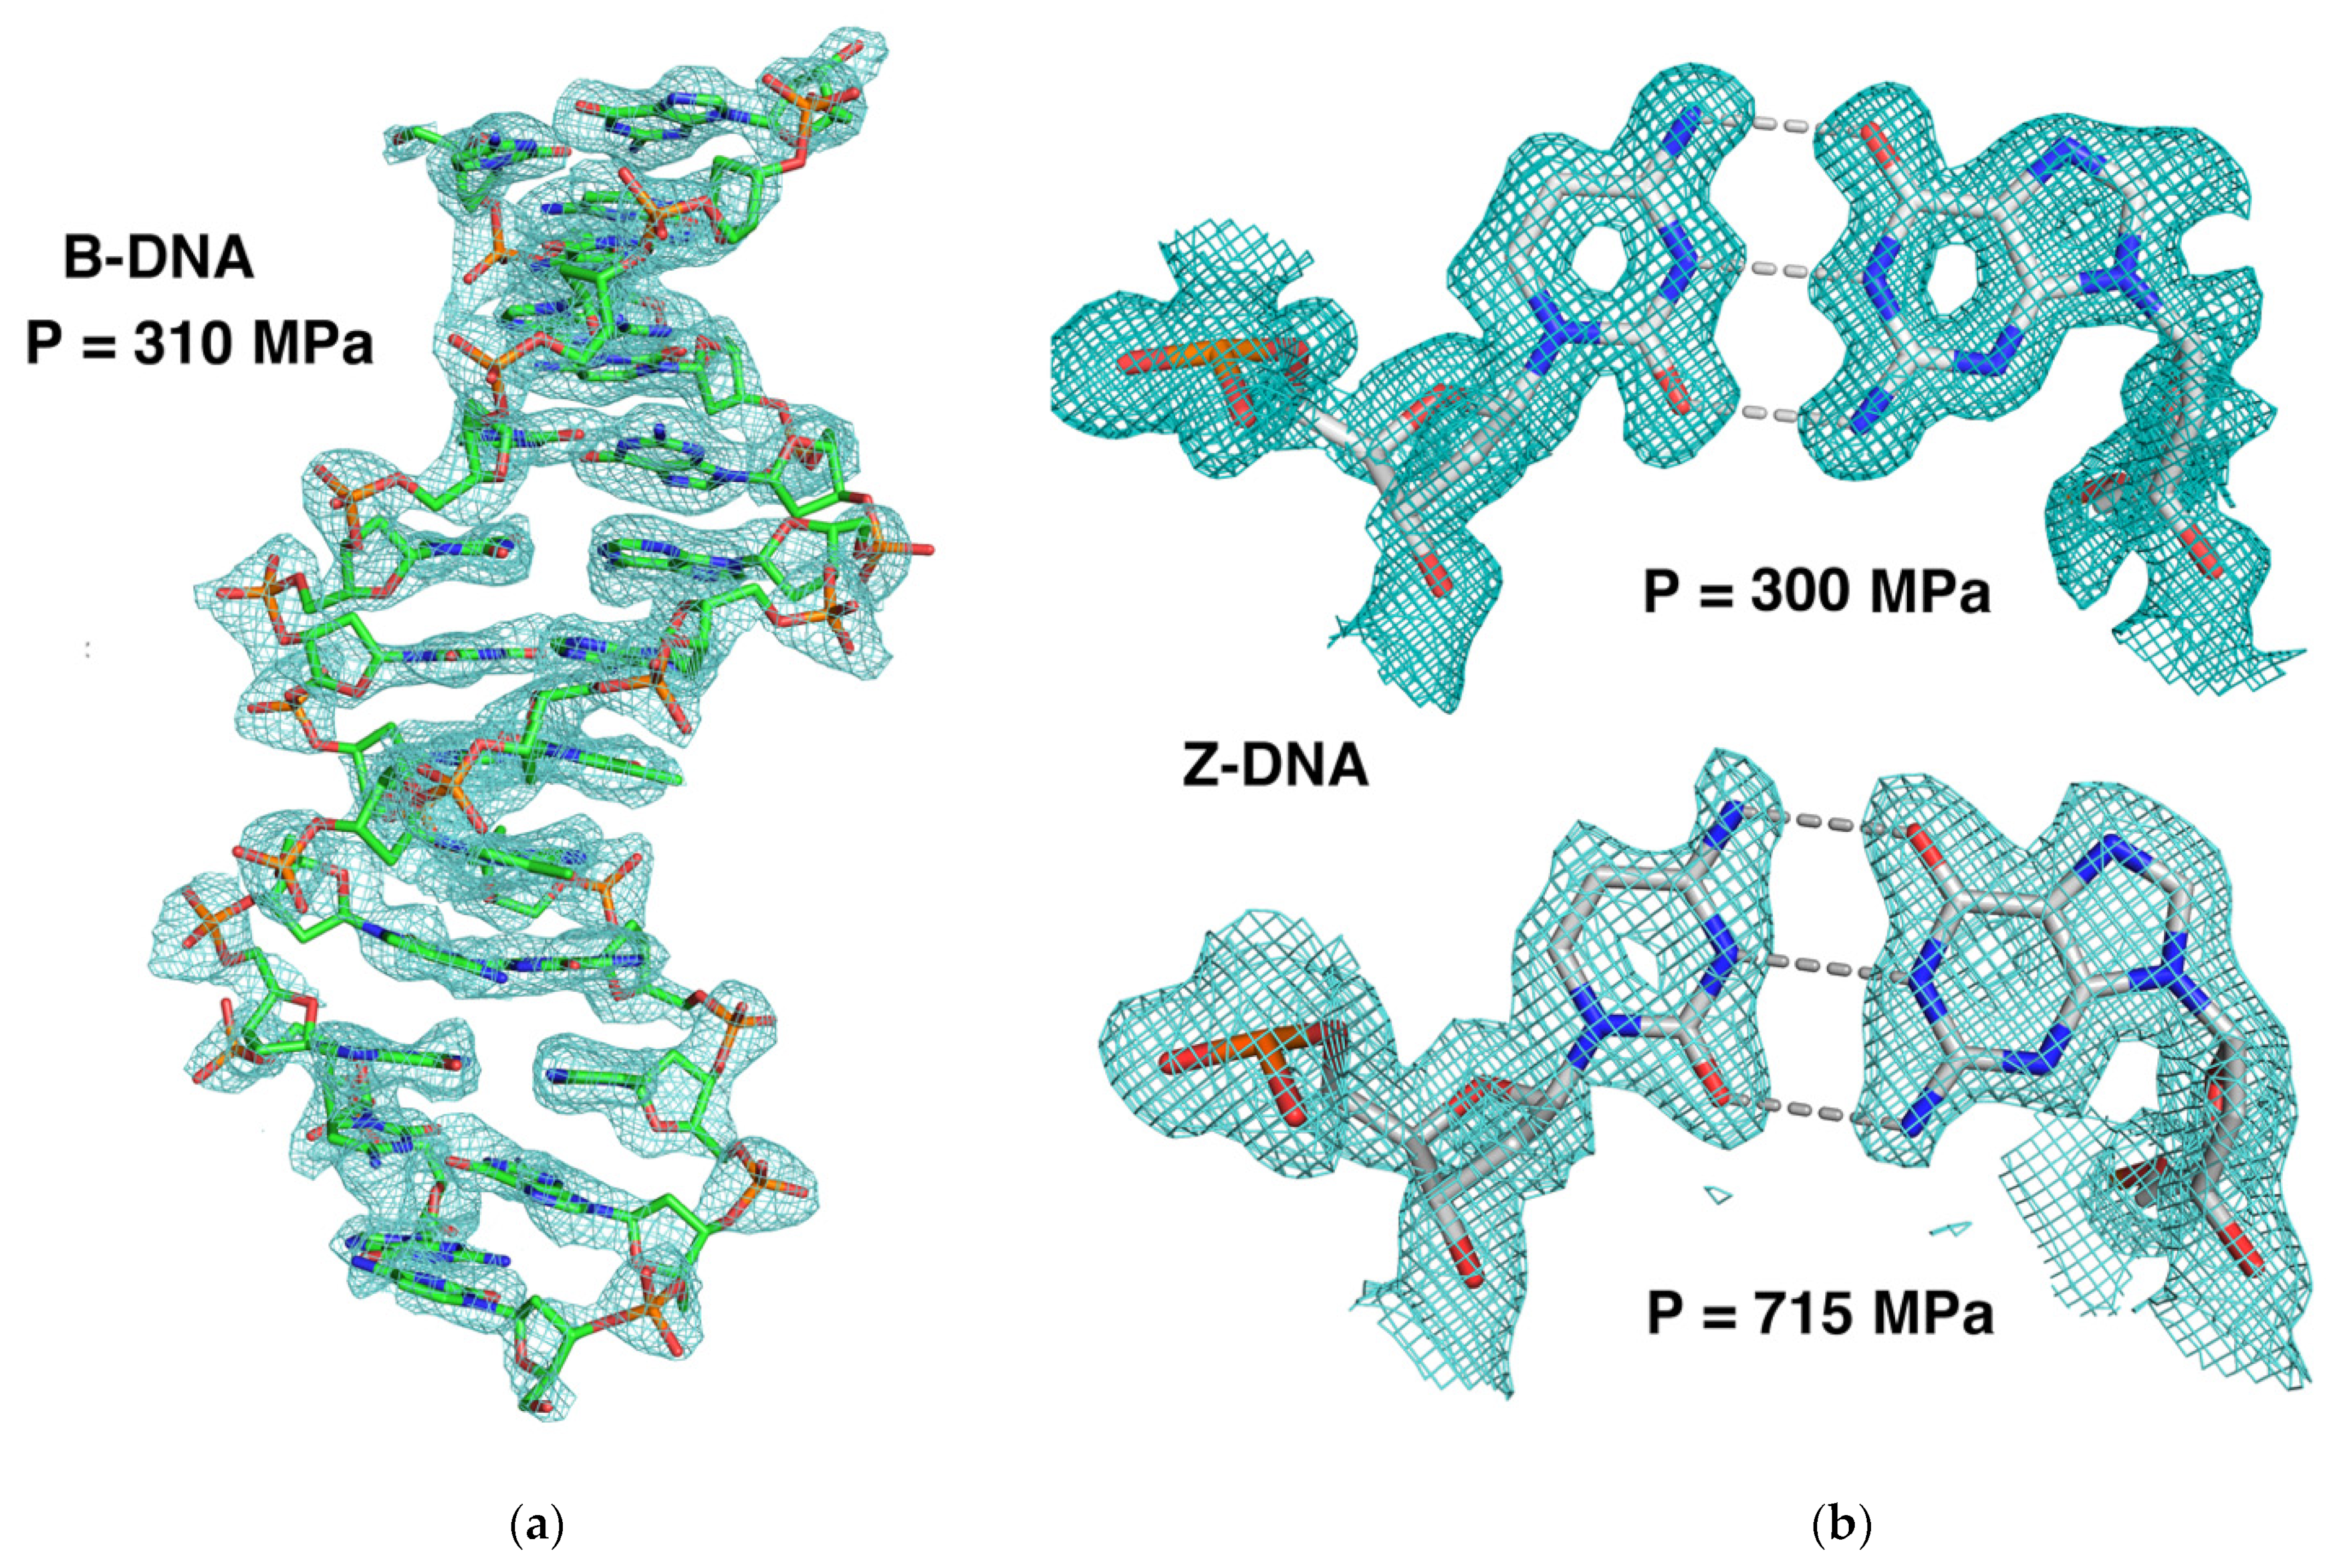
  • B-DNA: The crystals were relatively fragile and difficult to handle under pressure. Diffraction data were recorded on the ID27 beamline at the ESRF synchrotron (Grenoble, France) at a wavelength of 0.38 Å (Iodine K absorption edge). We used the DAC specially designed for protein crystallography based on previous developments [12,13,14] with an aperture of 55°, enough to record most of the Ewald sphere in a single rotation thanks to the high symmetry of the crystals. The detector was a MarResearch MarCCD165. The lifetime of the crystals and the geometry of the beamline were sufficient to record at ambient pressure at a resolution of 2 Å about 70 to 75% of the Ewald sphere (or the total unique reflections). Under pressure, the crystals decayed rapidly above 400–500 MPa. In these conditions, we were able to record a data set at 310 MPa before the crystal lost its diffraction ability.
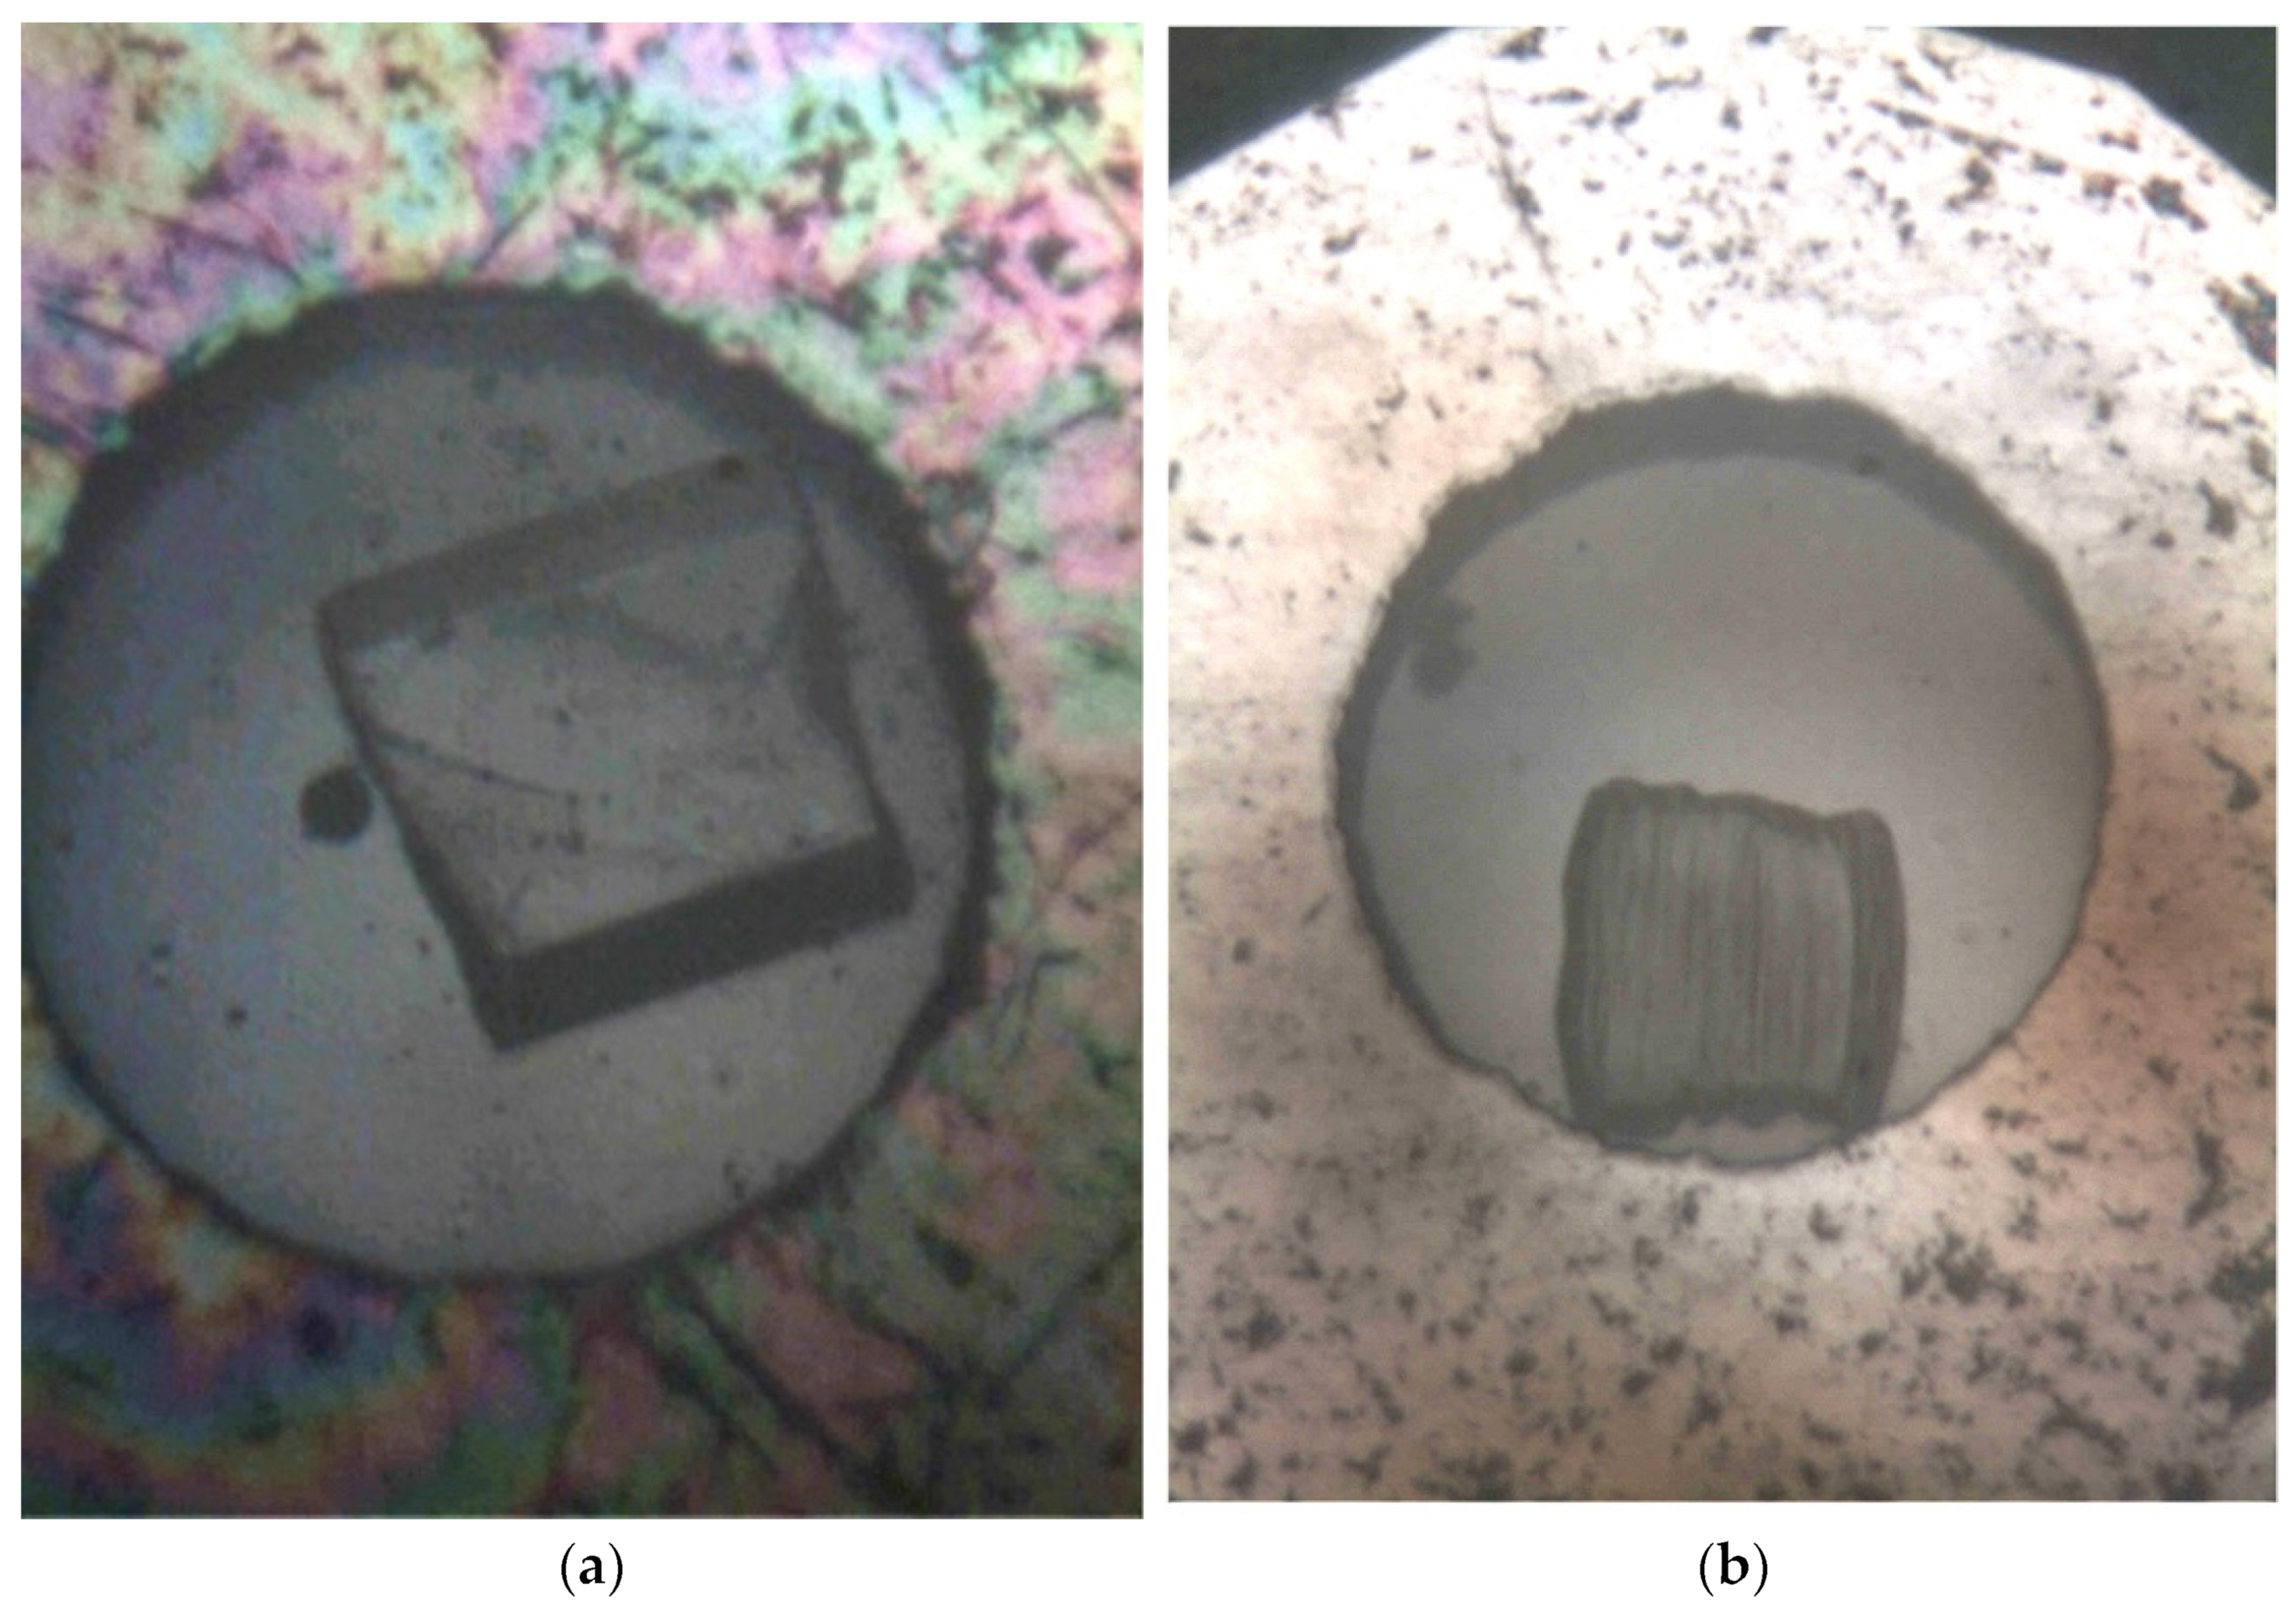
  • Z-DNA: Experiments were performed at ESRF (Grenoble) at the BM30A (FIP) beamline using a new DAC with a larger angular aperture (90°) [15]. The wavelength was set to 0.75003 Å. In these conditions, the maximum resolution expected at the edge of the detector (a Quantum ADSC Q315r CCD) was limited to about 1.4 Å, though the crystals usually diffracted to a better resolution. The X-ray beam was collimated to 50 × 50 μm2. Exposure times were 20 or 30 s, depending on the sample, for a rotation step of 1°. Several data sets were obtained at pressures of 300, 540, and 715 MPa (estimated ± 20 MPa) using one crystal per pressure step. Crystals are much more pressure-resistant than B-DNA crystals. Figure 2 shows the fate of a Z-DNA crystal following a compression cycle.
The compressibility parameters of the B- and Z-DNA crystals were monitored by slowly increasing the pressure, then recording a few numbers of diffraction frames, enough to index the reflections and determine, in each case, the unit-cell parameters (program XDS [21]).
For comparisons, crystal metrics (unit-cell parameters) were obtained at ambient pressure by collecting a small set of diffraction frames in similar DAC set-up and conditions. For structural comparisons of the DNA scaffolds, we used the already deposited structures of the B- and Z-DNA at ambient pressure and temperature, that were extracted from the protein data bank: the 1bna was used for the B-DNA dodecamer, and 2elg for the Z-DNA.

2.4. Data Processings and Structure Refinements

All diffraction frames were integrated using XDS [21]. When crystal slippage within the DAC cavity was detected, the corresponding data set was divided into two or three parts that were integrated separately. The different data sets were then put on an absolute scale and merged using XSCALE, or SCALA [22] from the CCP4 suite of programs [23]. The statistics of the four data collections of B- and Z-DNA are given in Table 1. The refinements were started, in each case, by a rigid-body refinement using the coordinates extracted from the protein data bank (PDB) [24] as mentioned earlier (IDs = 1bna and 2elg, for the B-dodecamer and the Z-hexamer, respectively), after removing all the ligands and water molecules. This was followed by individual, restrained atomic refinements with the REFMAC5 program [25]. The rounds of refinements were interspersed with reconstruction and water localization steps using the graphic tool Coot, based on |2Fo-Fc| and |Fo-Fc| electron density maps [26]. The final refinement statistics are reported in Table 2.
To minimize any bias, the base-to-base polar distances (the Watson–Crick pairs) were kept unrestrained because they are precisely the parameters we discuss in the next sections. This was accomplished by using the real-space fitting of each individual base in their flat electron density, as available in the Coot program.

3. Results

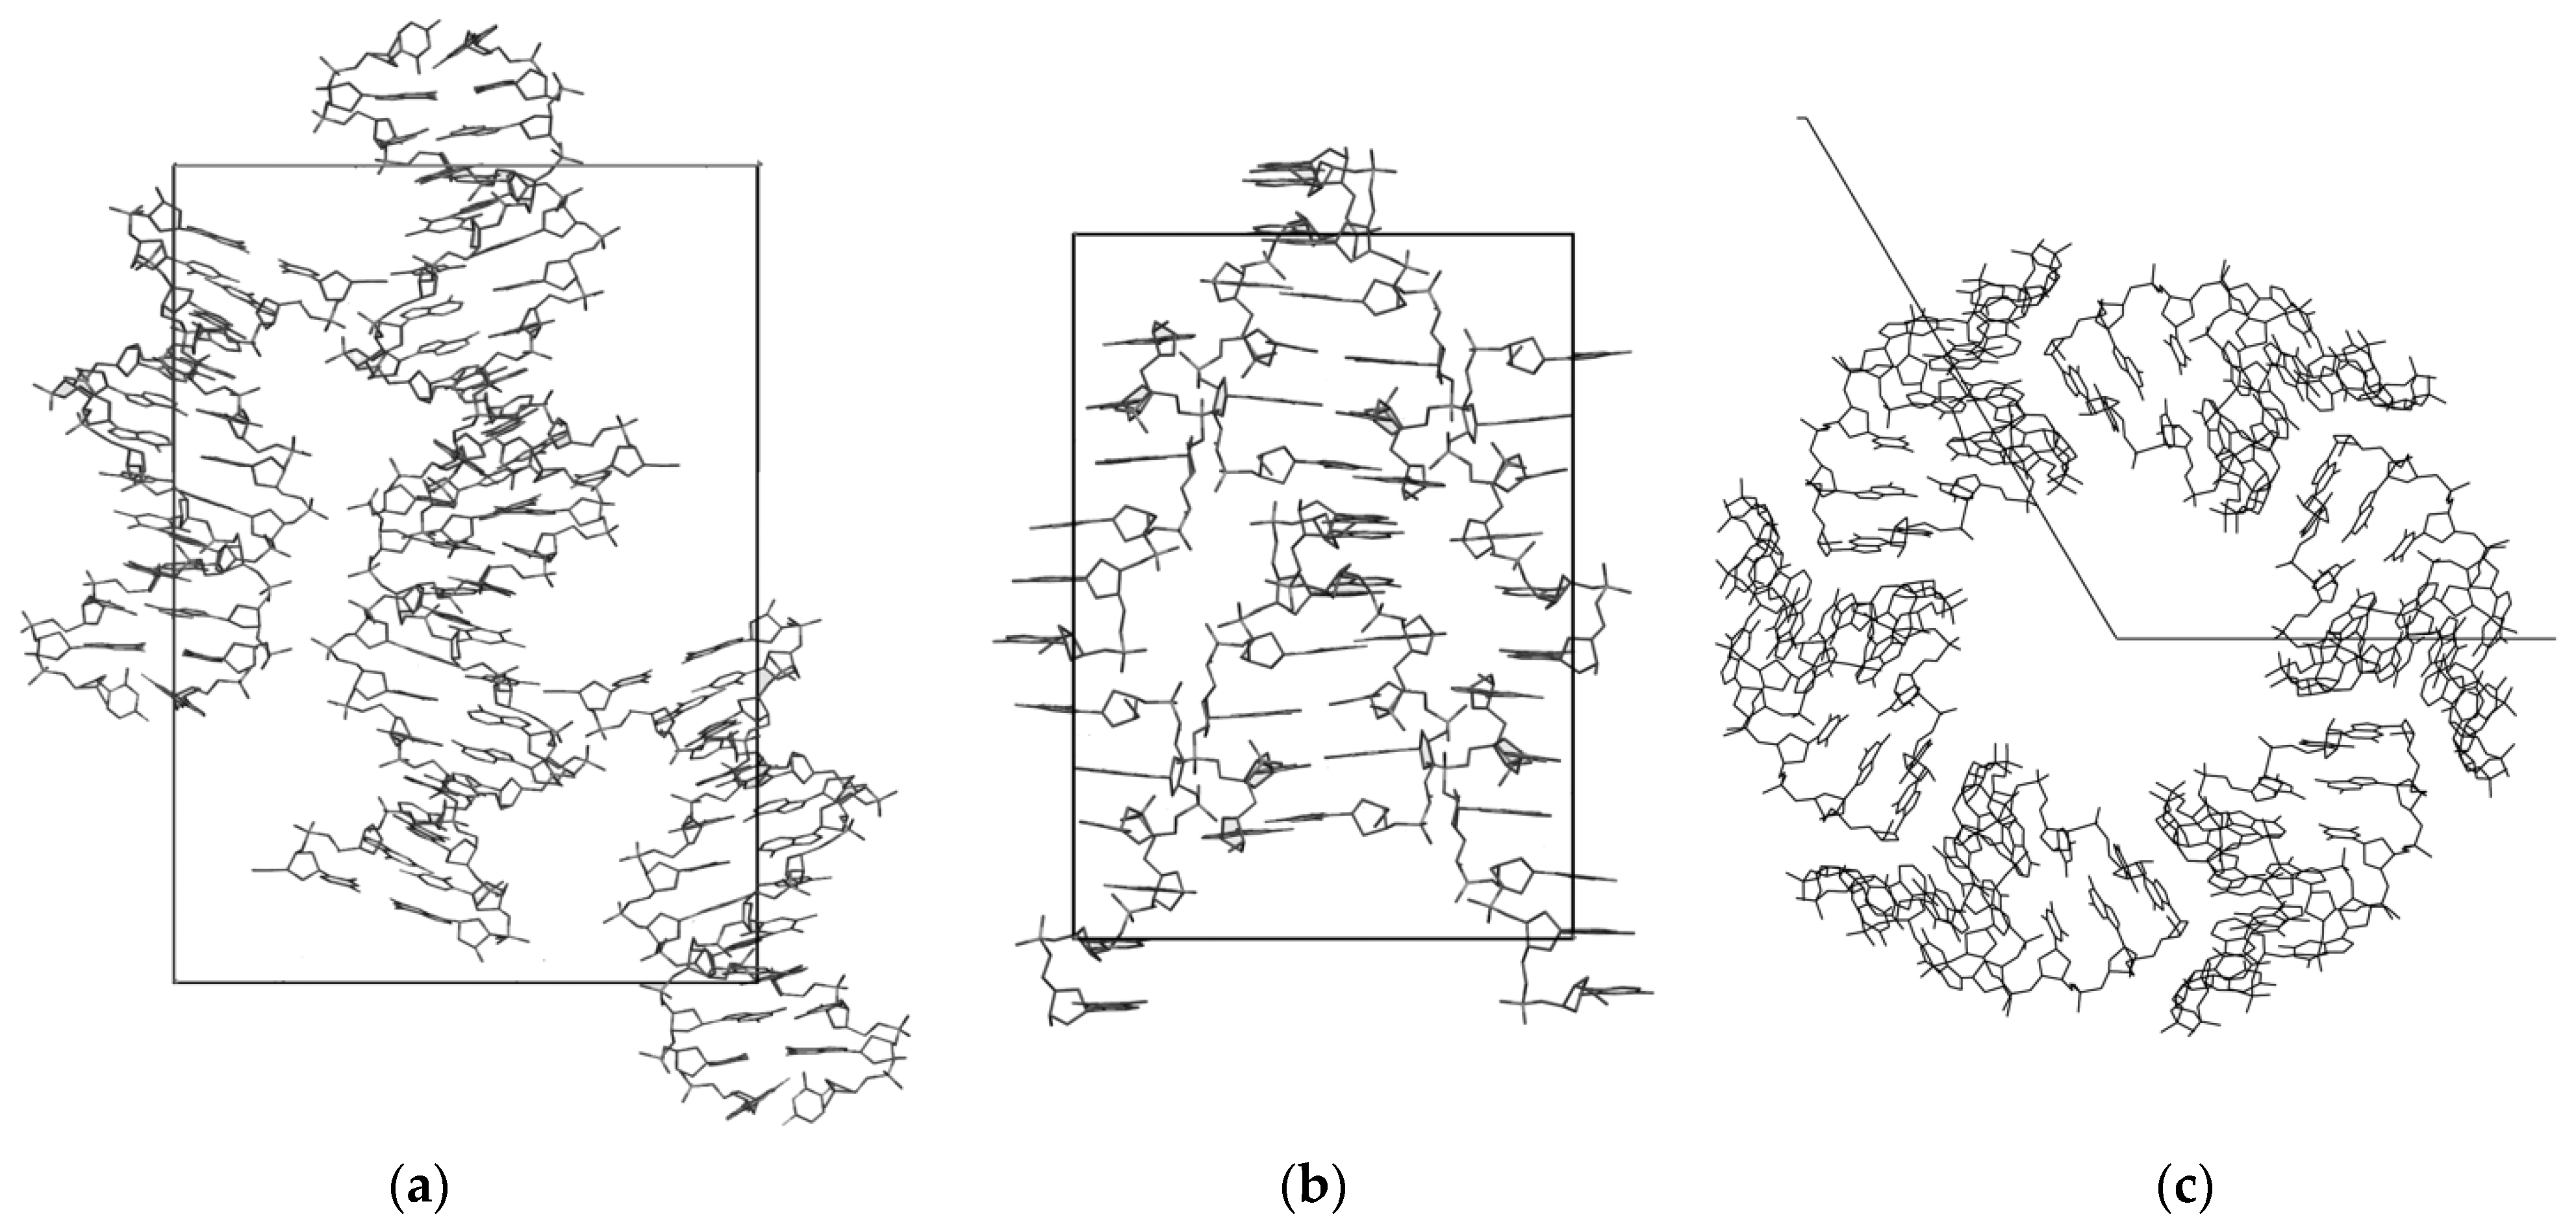
3.1. The DNA Crystal Packings

The following Table 3 reports the unit-cell parameters and volumes measured at ambient pressure for the two B-DNA and Z-DNA crystals. For comparison purposes, the A-DNA parameters taken from [10] are also reported in the last column of the Table. The compactness coefficient, calculated as the volume per residue, and the maximum pressure Pmax the crystals accepted are reported at the end of Table 3. Pmax is deduced from the diffraction loss.
Contrary to the hexagonal A-DNA octamer, the two B- and Z-crystals are in the same orthorhombic space group P212121 but with very different compactness coefficients, giving the Z-form a more compact structure. The B-, Z- and A-DNA crystal packings are shown in Figure 3. The B-DNA packing results from the head-to-tail alignment of dodecamer duplexes forming an infinite helix running along the c-axis with little interhelix contacts, while in the Z-DNA (Figure 3b), the lefthanded helices are interspaced together with numerous contacts that strengthen their packing. The case of A-DNA is different: the packing arrangement, given in Figure 3c, is characterized by a huge void channel running along the z-axis, responsible both for its low compactness and for an interesting feature: it hosts, not only freely running water molecules, but also some disordered DNA molecules oriented along the same z-axis in the B-form, resulting in a fiber like diffraction pattern superposed to the Bragg spots of the ordered crystal lattice [10,27].

3.2. DNA Crystals’ Response to Hydrostatic Pressure—The “Reversible” Domain

The stability of the crystals is directly connected to how the DNA molecules pack together in the cell. Though the applied pressure is isotropic, the adaptation to the pressure of the three a, b, and c unit-cell parameters is not equal.
The thermodynamic parameter XV that governs the pressure effects on the metric of unit-cell constants, or the specific compressibility coefficient is defined as:
X V = 1 V × ( V P ) T
that can be simply approximated as xV = −ΔV(ΔP/V) within a short interval of pressure. Similarly, xa, xb, and xc can be defined for the three cell parameters’ dependencies.
Assuming a linear dependency in pressure intervals, the calculated χ parameters, as well as the volume compressions, are reported in Table 4, they are given in GPa−1.
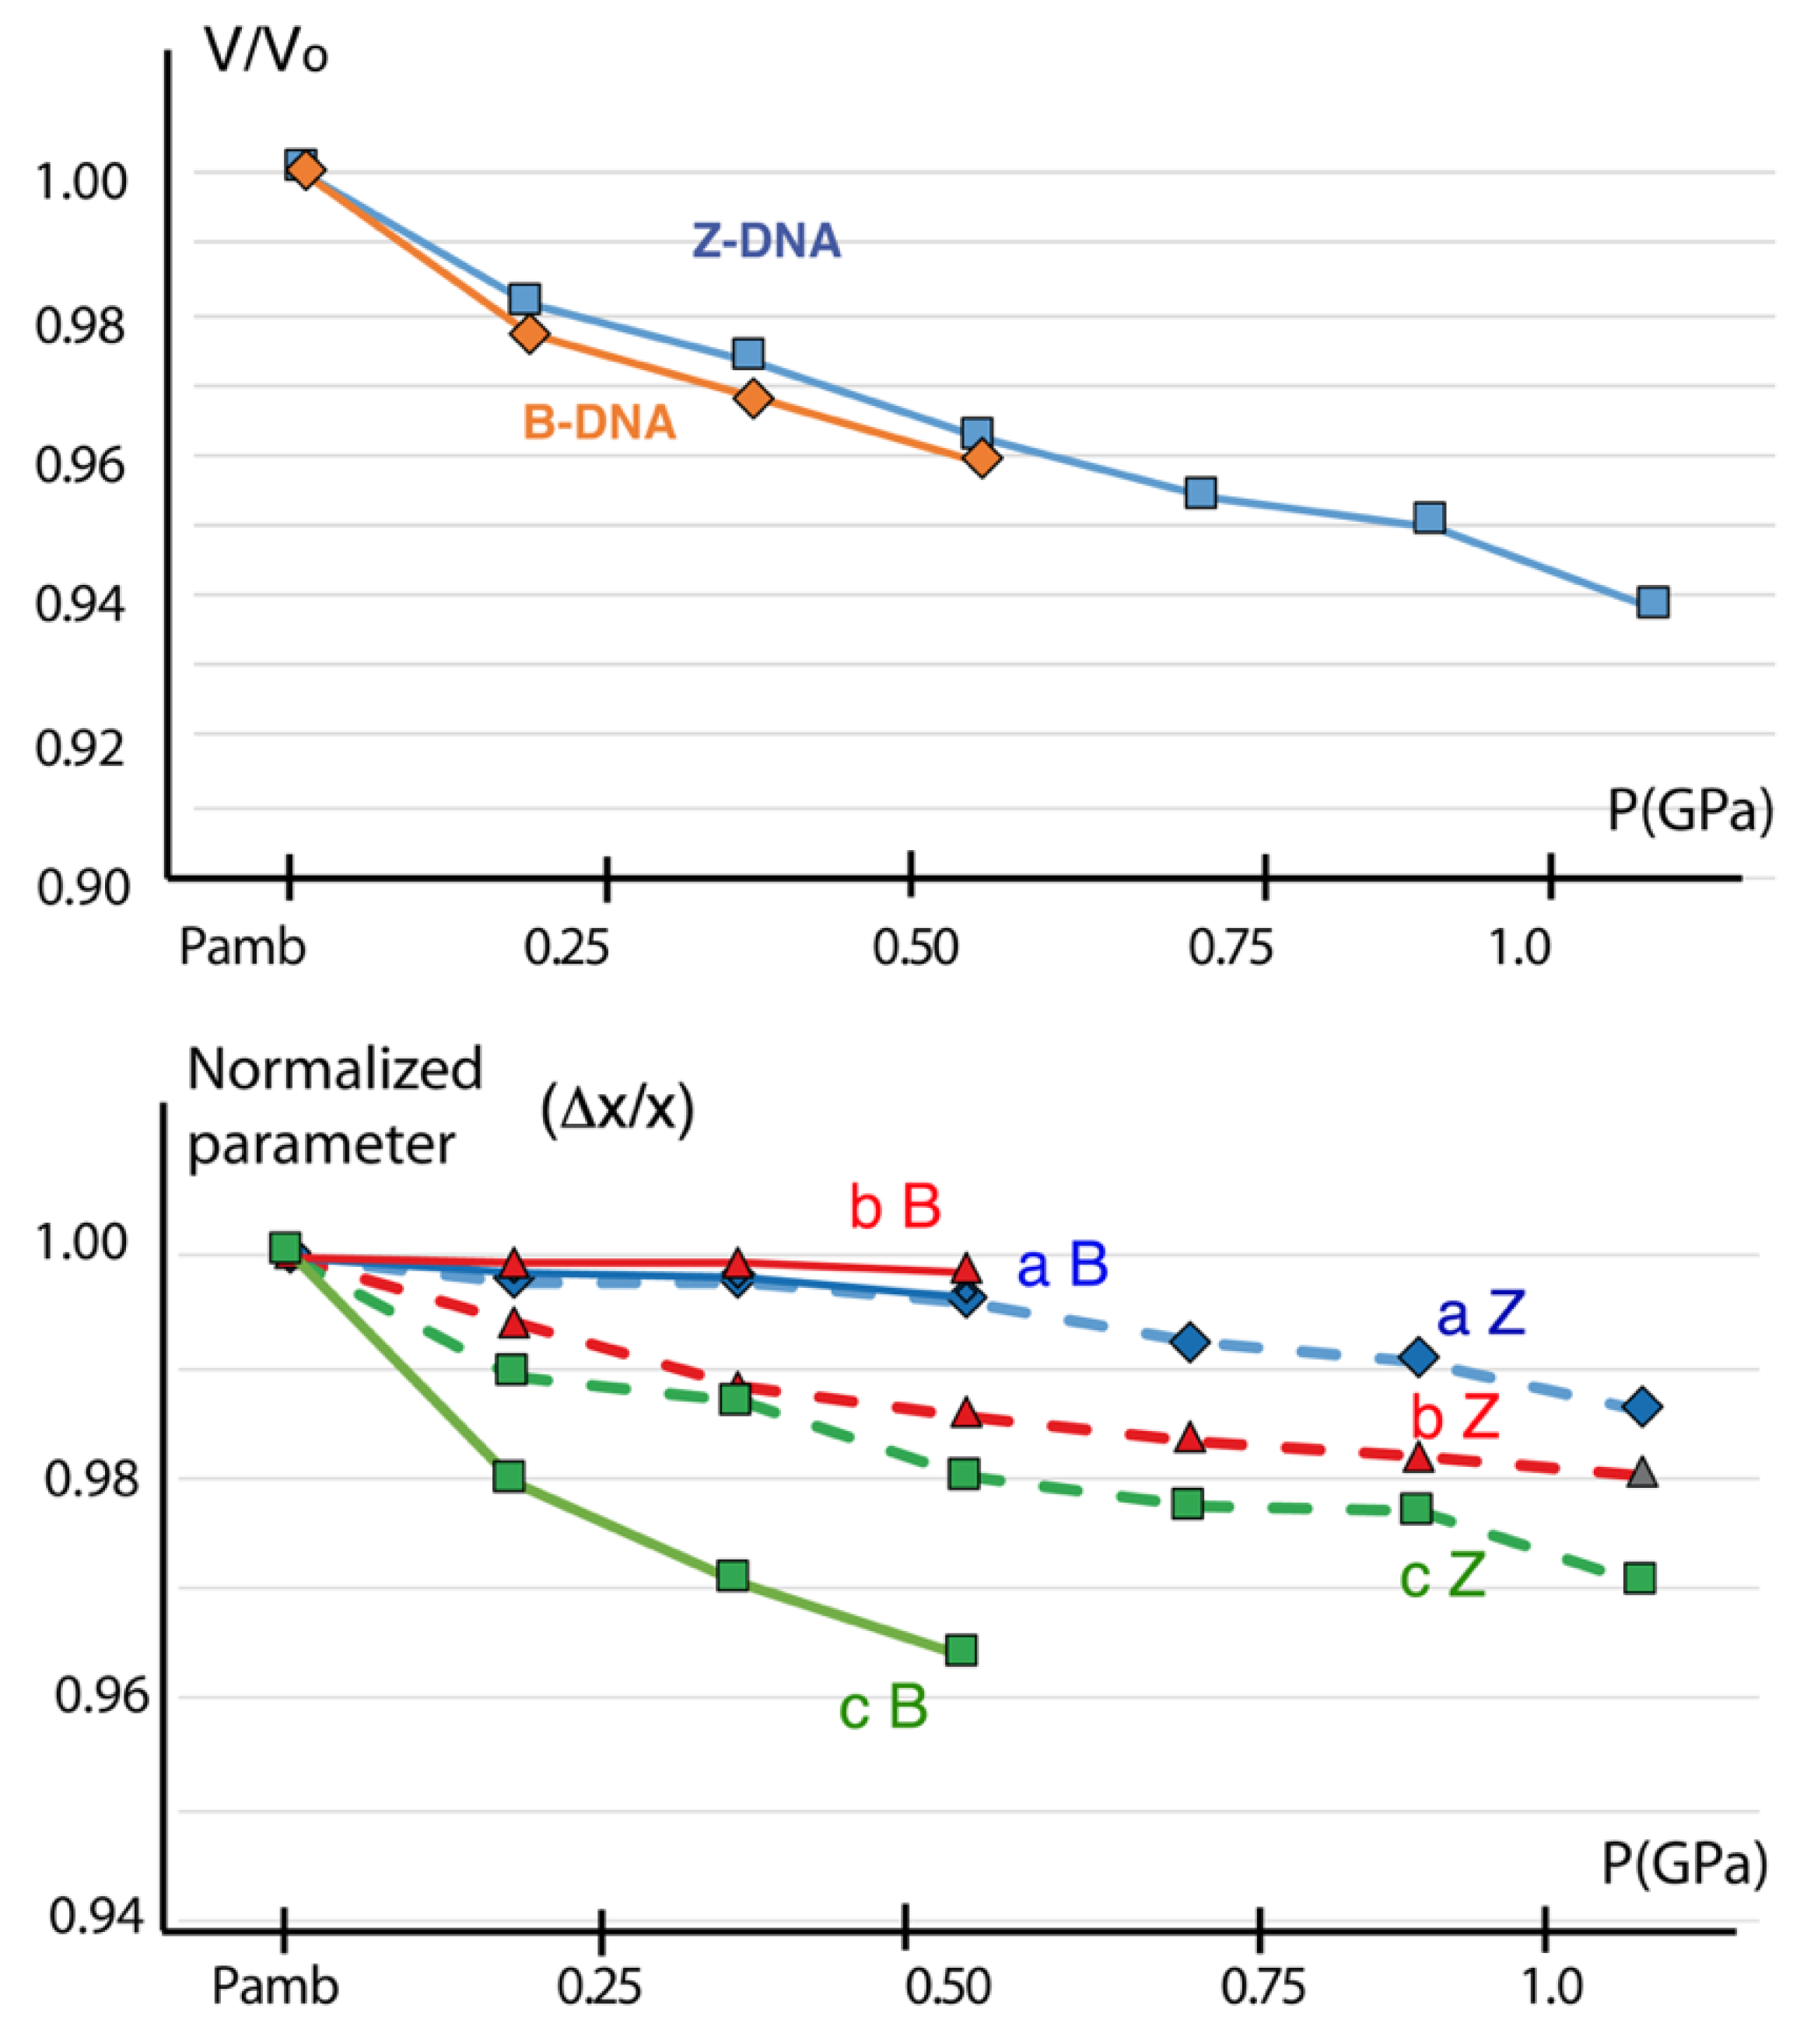
  • Volumes: Figure 4 Top shows that the xV evolutions were similar in B and Z crystals. While the B-DNA crystals were destroyed above 400–500 GPa, the Z-DNA crystals entered a linear and constant compression domain up to their end of life estimated around 1.2–1.5 GPa.
  • Cell parameters: (Figure 4 bottom). A strong anisotropy was evidenced for the B-DNA (xa and xb unaffected, xc strongly affected by pressure), whereas an isotropic compression was observed for the Z-DNA (the three x values were nearly equal).

4. Discussion

The stability of the DNA duplex has long been investigated as a function of temperature [4,5], but there have been relatively few studies of the effects of hydrostatic pressure [7,28,29]. The helix-coil transition temperature Tm is the characteristic parameter that defines how the duplex resists unwinding and the denaturation (separation in single strands) induced by heat. As far as pressure is concerned, exhaustive studies were less documented until recently [28,29]. As the Watson–Crick base pairing is associated with a negative DV, it was just concluded that DNA would be stabilized by (or at least very resistant to) external pressure [6]. Altogether, these studies concluded that, in the case of linear DNA duplexes “H-bonding and p-p-stacking interactions are marginally affected by pressure” [7,29]. However, this would be less true in the case of RNAs [30,31] or ribozymes, where structural bends, twists, and cavities are, as in proteins, dominant structural features, and, consequently, pressure-induced changes may alter their biochemical activities. The tools available to study pressure effects are mainly spectroscopic techniques, IR and UV spectroscopy, and NMR and X-ray crystallography, for a review see [32]. For the dependency of Tm versus pressure, see [29,33].

4.1. The DNA Scaffold Adaptation within the “Reversible Domain” of Pressure

The double-stranded molecule of DNA reacts to pressure through two main adaptations. The first is the shrinkage of the Watson–Crick base pairings (lateral effect), and the second is the base stacking compression (longitudinal effect). A third variable, but affecting preferentially the crystal lattice, is the water hydration input/output induced by pressure, which leads to the swelling/narrowing of the crystal lattice and hence affects its 3D architecture. This last effect is well-documented in the case of proteins [34,35,36,37]. These three parameters, concerning the DNA molecule itself, are also in balance with the crystal packing resistance, which in turn is mainly dependent on the number of contacts between the intermolecular DNA duplexes in the cell (van der Waals contacts, salt bridges, Hydrogen bond, etc.). In the following, we analyzed all these effects.
In addition, for reliable refinements and model building, the completeness of the diffraction data should be higher than 90%, because all reflections contribute to the calculation of the electron-density map, and for values less than 80%, the quality of maps calculated from incomplete data are estimated and poorly defined and dealing with missing data becomes a real problem below 70% [30]. Here, due to both the DAC angular limitation and the symmetry of the orthorhombic crystals, we were close to the usually accepted limits of 70–80%. We think that there is only one golden rule: the graphic inspection of electron-density maps. The Figure 5 shows the final |2Fo-Fc| maps of the dodecamer B-DNA at 310 MPa (2.55 Å resolution) and of the hexamer Z-DNA at 300 and 715 MPa (resolution 1.41 Å). They all indicate that we relied on acceptable data. This was strengthened following data analysis using the SFCHECK program [38].

4.1.1. The Watson–Crick Base Pairings: The Transversal Compression

The Watson–Crick type of base-pair association, the archetype of the genetic code transmission, is the main breathing mechanism for the helix to accommodate, transversally, the pressure. In proteins, within the elastic compression regime, salt bridges and H-bond lengths are usually shortened by ~ 0.1 Å.GPa−1 [39,40]. In the case of DNA duplexes, the polar atom distances within G–C and A–T base pairs would follow equivalent shortenings. The C1′-C1′ vector, between sugars in each A-T or C-G base pair, measured over all the steps of the duplex, is another indicator of a lateral compression we believe to be more reliable as it does not depend on the twist, wobble, and other deformations of the base pairs that may influence and introduce bias on their effective compression. The average C1′-C1′ distances are also reported in Table 5.
The base-pair geometry is best characterized by six rigid-body parameters, four are in-the-plane: shear, stretch, stagger (in Å), opening (in degree), and two are deformations out-of-the-plane: propeller and buckle (in degree) [41].
  • B-DNA: The average C1′-C1′ distances were in favor of a small lateral compression at 310 MPa (in the range 0.1–0.2 Å for the two A-T and C-G base pairs). However, the base planes were found to be relatively rigid as the calculated shear, stretch, and stagger parameter changes were within the estimated standard variations (< 0.1 Å) at 310 MPa. The only significant perturbation we observed concerned the opening parameter of the four first C-G steps of the duplex, with a Δ-opening increase of 8° at the 5′ end of the dodecamer. This small change could also be deduced from the decrease of O2-N2 distances and the increase of N4/N6-O6 distances (Table 5). This tendency to rotate in the plane with respect to the central N1-N3 distances indicated that the major groove tends to become wider and the minor groove narrower. In addition, a packing effect was clearly present on the 3′-end regarding the propeller parameter of the last C-G base pair (Δ-propeller ~ −10°).
  • Z-DNA: The base-pair geometries remained remarkably constant during the pressurization up to 715 MPa. All variations of the six base-pair parameters varied less than 0.1 Å (Δ-shear, Δ-stretch, Δ-stagger) and less than 1° (Δ-buckle, Δ-propeller, and Δ-opening) between ambient pressure and 715 MPa. This illustrated the rigidity and stability of the Z-duplex under high pressure.

4.1.2. The Base Stackings: The Longitudinal Compression

The main adaptation of DNA to pressure is a springlike longitudinal compression of the base along the DNA axis (the so-called rise parameter). This behavior was first reported in the case of the A-DNA octamer d(GGTATACC)2 and was particularly clear for the free B-DNA molecules occluded in the central channel of which the diffuse scattering bands of the base stackings reported a squeeze from 3.34 to 3.07 Å at 2 GPa [10]. This spring-effect was also observed in the two B- and Z-DNAs we analyzed here.
Similarly to the χ parameter, we could define for the base stacking a compressibility-specific coefficient δT, that is, equivalent to the pressure dependency of the rise parameter. Here, x is the average base-to-base distance at a given pressure P and ∂x/∂p the base compressibility. The coefficient ∂x/∂p can be compared, or assimilated, to the spring coefficient in the classic mechanistic (though expressed in different units). It also follows a nonlinear dependency with pressure (Table 6).
  • Z-DNA:
In the usually accepted canonical forms of DNA [42], the average base spacing of the standard lefthanded Z-DNA was the highest compared to the two other forms A- and B-: 3.78 Å instead of 3.34 Å, and 2.9 Å for the B- and A-DNA, respectively. Here, upon pressurization, the Z-duplex squeezed in full length by 0.8 Å (from 18.0 to 17.2 Å at 715 MPa). This corresponded, for the average base stacking, to a compression of 0.16 Å, (d = 3.47 Å at 715 MPa). The last column indicates the compressibility per base, given in Å per GPa.
  • B-DNA:
The longitudinal compressibility of the duplex is shown in Figure 6, as the least-squares superposition of the B-DNA scaffold at ambient and 310 MPa pressure.
The overall length of the helix was squeezed by 1.0 Å between ambient pressure and 310 MPa, which corresponded to an average stacking distance between base planes reducing from 3.39 to 3.26 Å and a per base pressure-dependency ∂x/∂p around 0.4 Å.GPa−1. This value was determined assuming a linear dependency with the applied pressure, which was only approximate in the domain (0.1–310 MPa). Above, the growing of the repulsive van der Waals π-π term between electron clouds that progressively limited the stacking compression was responsible for the nonlinearity of ∂x/∂p.
Interestingly in the B-DNA, the initial specific compressibility parameter was about two times higher when compared to Z-DNA (Table 6) before the disruption of the crystal. However, the reverse was expected because of a weaker base stacking in Z-DNA (~3.60 Å) compared to B-DNA (~3.40 Å). In fact, the linear conformation of B-DNA favors such a mechanism. Conversely, the helix of Z-DNA, though also stacked on each other, is not linear, with a curved structure and numerous intermolecular contacts, and aqueous mediations, which limit a directional compression. In that sense, the B-DNA was more longitudinally reactive to pressure than the Z-form.

4.2. The Water Mediation

The hydration network around the DNA molecule and salt bridges are features that have long been investigated as they play a crucial role in DNA stability, transitions from one state to another (B/A/Z), and in the helix/coil transition, or denaturation [43,44,45,46]. The water molecules were described to both stabilize the grooves of the duplex and to make interphosphate bridges. The two effects had a different influence depending on the kinds of DNA. The first was more important in B-DNA, while the second became predominant in A- and Z-DNA [47,48,49,50]. In the oligomer A-DNA previously investigated [10], there was a continuous increase of hydration by ordered water molecules, up to a point where the integrity of the crystal could not be maintained (57 water molecules at ambient pressure to 71 water molecules at 1.39 GPa). In the present study, we observed in the Z-DNA hexamer, which diffracts to high resolution, a heavily hydrated duplex. Conversely to the A-form, the number of water molecules decreased continuously from 62 at 300 MPa to 52 at 540 MPa, then to 47 at 715 MPa.
We believe that this paradox is only apparent in A-DNA, where the compactness is low (Table 3) compared to the structure of Z-DNA. Thus, the free, unordered water molecules (not observed in crystallographic structure), reorganize around the DNA and become visible in electron densities, and therefore involved in the hydration network. In Z-DNA, the structure was too compact, the free—unobserved—water molecules were very few. The only mechanism for the crystal to adapt to a negative ΔV would be, therefore, to expel some solvent water molecules around the DNA during the compression.
This mechanism corresponds to a dehydration that would be conducted by rearrangement of water molecules around the DNA to destabilize both the duplex and the interduplex contacts that strengthen the crystal packing.
In the case of the dodecamer B-DNA, it was difficult to conclude because of the moderate resolution that did not allow a clear treatment of the hydration network, although the 19 water molecules (see Table 2) were also observed at the ambient pressure but slightly displaced.

4.3. The Irreversible Zone of Pressure: A Phase Transition as a Response to Pressure?

The adaptation of the crystal to pressure is the sum of several parameters, the first is the molecular adaptation of the macromolecule we analyzed previously, which is a continuous and reversible conformational evolution of the duplex in a rigid grid built by the crystal packing, according to the symmetries of the space group that define the crystal. This adaptation could be considered reversible up to a given point where the strength of pressure on the crystal packing, associated with the destabilization of the duplex hydrogen-bond network, becomes more and more constrained to finally lead to the destabilization of the crystal packing, well before that of the duplex itself.
Another behavior might be invoked. In a relevant study, Krzyzaniak and colleagues [51] reported that, under pressure, a transition of DNA from B to Z occurs. In the case of the B-DNA dodecamer we analyzed here, the question can be asked. If such a transformation occurs, it would correspond to a deep structural rearrangement, and the crystal packing will not accommodate such a transition and will disaggregate.
This would explain either the sensitivity of B-DNA crystals to pressure, or the stability of the Z-DNA crystals that would be the stable form of DNA at high hydrostatic pressure.

5. Conclusions

How DNA crystals behave vs. an external hydrostatic pressure can be summarized as the following graphical representation (Scheme 1):
The way crystal packings are affected depends mainly on the intermolecular networks stabilizing the different duplexes between them in the packing and would define the limit between the two reversible and irreversible pressure-dependent domains. The most affected is the B-DNA crystal packing where few, if any, polar interactions (or hydrogen bonds) are observed between helices aligned side by side in the packing.
Within the “reversible” domain, the B-DNA oligomer appears more flexible than the Z-DNA and able to better cope with the pressure. However, above a given pressure, around 400 to 500 MPa, the crystal lattice of the B-DNA dodecamer is destroyed while the Z-DNA crystals still diffract up to 1.2 GPa, due to many more polar interactions in the packing. Ranking the DNA crystal stabilities thus becomes A-DNA > Z-DNA >> B-DNA. However, this does not concern the molecule of the DNA itself. As observed embedded in the packing of the A-DNA structure [10], the molecular duplex of the B-DNA that presents all the characteristics of a fiberlike diffraction pattern remains stable up to 2 GPa, the limit of pressure we were able to achieve within our DAC, and certainly the B-DNA molecule would be degraded only at a much higher pressure, a behavior that definitively makes DNA the most resistant biological species to pressure compared to proteins.

Author Contributions

Conceptualization, T.P. and E.G.; methodology, E.G. and A.-C.D.; syntheses, M.L. and E.M.-G.; validation, T.P., E.G., A.-C.D. and N.C.; formal analysis, T.P., E.G. and N.C.; writing—original draft preparation, T.P.; writing—review and editing, E.G., T.P., N.C., M.L. and E.M.-G. All authors have read and agreed to the published version of the manuscript.

Funding

This research received no external funding.

Institutional Review Board Statement

Not applicable.

Informed Consent Statement

Not applicable.

Data Availability Statement

The structures have been deposited with the Protein Data Bank (PDB) and are available at www.rcsb.org with ID: B-DNA (310 MPa): 7zql; Z-DNA (300 MPa): 7zqm, Z-DNA(540 MPa): 7zqn and Z-DNA(715 MPa): 7zqo.

Acknowledgments

HPMX data collection was performed in the context of a Long-Term Project (mx421) at the ESRF synchrotron (Grenoble, France) led by Roger Fourme. We thank the staff of the ID27 beamline—and especially Mohamed Mezouar—for help and advice during experiments. We also thank the BM30A (FIP) beamline staff with a special thought to Jean-Luc Ferrer. IBS acknowledges integration into the Interdisciplinary Research Institute of Grenoble (IRIG, CEA).

Conflicts of Interest

The authors declare no conflict of interest.

References

  1. Levy, M.; Miller, S.L. The Stability of the RNA Bases: Implications for the Origin of Life. Proc. Natl. Acad. Sci. USA 1998, 95, 7933. [Google Scholar] [CrossRef] [PubMed] [Green Version]
  2. Lindahl, T. Instability and Decay of the Primary Structure of DNA. Nature 1993, 362, 709–715. [Google Scholar] [CrossRef] [PubMed]
  3. Xu, J.; Chmela, V.; Green, N.J.; Russell, D.A.; Janicki, M.J.; Góra, R.W.; Szabla, R.; Bond, A.D.; Sutherland, J.D. Selective Prebiotic Formation of RNA Pyrimidine and DNA Purine Nucleosides. Nature 2020, 582, 60–66. [Google Scholar] [CrossRef] [PubMed]
  4. Marguet, E.; Forterre, P. DNA Stability at Temperatures Typical for Hyperthermophiles. Nucleic Acids Res. 1994, 22, 1681–1686. [Google Scholar] [CrossRef] [PubMed] [Green Version]
  5. Karni, M.; Zidon, D.; Polak, P.; Zalevsky, Z.; Shefi, O. Thermal Degradation of DNA. DNA Cell Biol. 2013, 32, 298–301. [Google Scholar] [CrossRef] [Green Version]
  6. Dubins, D.N.; Lee, A.; Macgregor, R.B.; Chalikian, T.V. On the Stability of Double Stranded Nucleic Acids. J. Am. Chem. Soc. 2001, 123, 9254–9259. [Google Scholar] [CrossRef]
  7. Macgregor, R.B. Effect of Hydrostatic Pressure on Nucleic Acids. Biopolymers 1998, 48, 253. [Google Scholar] [CrossRef]
  8. Green, R.E.; Malaspinas, A.-S.; Krause, J.; Briggs, A.W.; Johnson, P.L.F.; Uhler, C.; Meyer, M.; Good, J.M.; Maricic, T.; Stenzel, U.; et al. A Complete Neandertal Mitochondrial Genome Sequence Determined by High-Throughput Sequencing. Cell 2008, 134, 416–426. [Google Scholar] [CrossRef] [Green Version]
  9. Stiller, M.; Fulton, T.L. Multiplex PCR Amplification of Ancient DNA. In Ancient DNA; Shapiro, B., Hofreiter, M., Eds.; Methods in Molecular Biology; Humana Press: Totowa, NJ, USA, 2012; Volume 840, pp. 133–141. ISBN 978-1-61779-515-2. [Google Scholar]
  10. Girard, E.; Prangé, T.; Dhaussy, A.-C.; Migianu-Griffoni, E.; Lecouvey, M.; Chervin, J.-C.; Mezouar, M.; Kahn, R.; Fourme, R. Adaptation of the Base-Paired Double-Helix Molecular Architecture to Extreme Pressure. Nucleic Acids Res. 2007, 35, 4800–4808. [Google Scholar] [CrossRef] [Green Version]
  11. Wing, R.; Drew, H.; Takano, T.; Broka, C.; Tanaka, S.; Itakura, K.; Dickerson, R.E. Crystal Structure Analysis of a Complete Turn of B-DNA. Nature 1980, 287, 755–758. [Google Scholar] [CrossRef]
  12. Wang, A.H.-J.; Quigley, G.J.; Kolpak, F.J.; Crawford, J.L.; van Boom, J.H.; van der Marel, G.; Rich, A. Molecular Structure of a Left-Handed Double Helical DNA Fragment at Atomic Resolution. Nature 1979, 282, 680–686. [Google Scholar] [CrossRef]
  13. Roy, S.; Caruthers, M. Synthesis of DNA/RNA and Their Analogs via Phosphoramidite and H-Phosphonate Chemistries. Molecules 2013, 18, 14268–14284. [Google Scholar] [CrossRef] [Green Version]
  14. Timsit, Y.; Moras, D. Crystallization of DNA. In Methods in Enzymology; Elsevier: Amsterdam, The Netherlands, 1992; Volume 211, pp. 409–429. ISBN 978-0-12-182112-8. [Google Scholar]
  15. Chervin, J.C.; Canny, B.; Besson, J.M.; Pruzan, P. A Diamond Anvil Cell for IR Microspectroscopy. Rev. Sci. Instrum. 1995, 66, 2595–2598. [Google Scholar] [CrossRef]
  16. Fourme, R.; Kahn, R.; Mezouar, M.; Girard, E.; Hoerentrup, C.; Prangé, T.; Ascone, I. High-Pressure Protein Crystallography (HPPX): Instrumentation, Methodology and Results on Lysozyme Crystals. J. Synchrotron Radiat. 2001, 8, 1149–1156. [Google Scholar] [CrossRef] [Green Version]
  17. Fourme, R.; Ascone, I.; Kahn, R.; Mezouar, M.; Bouvier, P.; Girard, E.; Lin, T.; Johnson, J.E. Opening the High-Pressure Domain beyond 2 Kbar to Protein and Virus Crystallography—Technical Advance. Structure 2002, 10, 1409–1414. [Google Scholar] [CrossRef]
  18. Girard, E.; Dhaussy, A.-C.; Couzinet, B.; Chervin, J.-C.; Mezouar, M.; Kahn, R.; Ascone, I.; Fourme, R. Toward Fully Fledged High-Pressure Macromolecular Crystallography. J. Appl. Crystallogr. 2007, 40, 912–918. [Google Scholar] [CrossRef]
  19. Shen, G.; Wang, Y.; Dewaele, A.; Wu, C.; Fratanduono, D.E.; Eggert, J.; Klotz, S.; Dziubek, K.F.; Loubeyre, P.; Fat’yanov, O.V.; et al. Toward an International Practical Pressure Scale: A Proposal for an IPPS Ruby Gauge (IPPS-Ruby2020). High Press. Res. 2020, 40, 299–314. [Google Scholar] [CrossRef]
  20. Dauter, Z. Data-Collection Strategies. Acta Crystallogr. D Biol. Crystallogr. 1999, 55, 1703–1717. [Google Scholar] [CrossRef] [Green Version]
  21. Kabsch, W. XDS. Acta Crystallogr. D Biol. Crystallogr. 2010, 66, 125–132. [Google Scholar] [CrossRef] [Green Version]
  22. Evans, P.R. An Introduction to Data Reduction: Space-Group Determination, Scaling and Intensity Statistics. Acta Crystallogr. D Biol. Crystallogr. 2011, 67, 282–292. [Google Scholar] [CrossRef] [Green Version]
  23. Winn, M.D.; Ballard, C.C.; Cowtan, K.D.; Dodson, E.J.; Emsley, P.; Evans, P.R.; Keegan, R.M.; Krissinel, E.B.; Leslie, A.G.W.; McCoy, A.; et al. Overview of the CCP4 Suite and Current Developments. Acta Crystallogr. D Biol. Crystallogr. 2011, 67, 235–242. [Google Scholar] [CrossRef] [Green Version]
  24. Berman, H.M. The Protein Data Bank. Nucleic Acids Res. 2000, 28, 235–242. [Google Scholar] [CrossRef] [Green Version]
  25. Murshudov, G.N.; Vagin, A.A.; Dodson, E.J. Refinement of Macromolecular Structures by the Maximum-Likelihood Method. Acta Crystallogr. D Biol. Crystallogr. 1997, 53, 240–255. [Google Scholar] [CrossRef]
  26. Emsley, P.; Cowtan, K. Coot: Model-Building Tools for Molecular Graphics. Acta Crystallogr. D Biol. Crystallogr. 2004, 60, 2126–2132. [Google Scholar] [CrossRef] [Green Version]
  27. Doucet, J.; Benoit, J.-P.; Cruse, W.B.T.; Prangé, T.; Kennard, O. Coexistence of A- and B-Form DNA in a Single Crystal Lattice. Nature 1989, 337, 190–192. [Google Scholar] [CrossRef]
  28. Chen, Y.Z.; Prohofsky, E.W. Theory of Pressure-Dependent Melting of the DNA Double Helix: Role of Strained Hydrogen Bonds. Phys. Rev. E 1993, 47, 2100–2108. [Google Scholar] [CrossRef]
  29. Knop, J.-M.; Mukherjee, S.K.; Gault, S.; Cockell, C.S.; Winter, R. Structural Responses of Nucleic Acids to Mars-Relevant Salts at Deep Subsurface Conditions. Life 2022, 12, 677. [Google Scholar] [CrossRef]
  30. Hervé, G.; Tobé, S.; Heams, T.; Vergne, J.; Maurel, M.-C. Hydrostatic and Osmotic Pressure Study of the Hairpin Ribozyme. Biochim. Biophys. Acta BBA-Proteins Proteomics 2006, 1764, 573–577. [Google Scholar] [CrossRef] [Green Version]
  31. Giel-Pietraszuk, M.; Barciszewski, J. A Nature of Conformational Changes of Yeast TRNAPhe. Int. J. Biol. Macromol. 2005, 37, 109–114. [Google Scholar] [CrossRef] [PubMed]
  32. Fourme, R.; Girard, E.; Akasaka, K. High-Pressure Macromolecular Crystallography and NMR: Status, Achievements and Prospects. Curr. Opin. Struct. Biol. 2012, 22, 636–642. [Google Scholar] [CrossRef] [PubMed]
  33. Takahashi, S.; Sugimoto, N. Effect of Pressure on Thermal Stability of G-Quadruplex DNA and Double-Stranded DNA Structures. Molecules 2013, 18, 13297–13319. [Google Scholar] [CrossRef] [PubMed] [Green Version]
  34. Nagae, T.; Kawamura, T.; Chavas, L.M.G.; Niwa, K.; Hasegawa, M.; Kato, C.; Watanabe, N. High-Pressure-Induced Water Penetration into 3-Isopropylmalate Dehydrogenase. Acta Crystallogr. D Biol. Crystallogr. 2012, 68, 300–309. [Google Scholar] [CrossRef] [PubMed] [Green Version]
  35. Ascone, I.; Kahn, R.; Girard, E.; Prangé, T.; Dhaussy, A.-C.; Mezouar, M.; Ponikwicki, N.; Fourme, R. Isothermal Compressibility of Macromolecular Crystals and Macromolecules Derived from High-Pressure X-Ray Crystallography. J. Appl. Crystallogr. 2010, 43, 407–416. [Google Scholar] [CrossRef]
  36. Wlodawer, A. Stereochemistry and Validation of Macromolecular Structures. In Protein Crystallography; Wlodawer, A., Dauter, Z., Jaskolski, M., Eds.; Methods in Molecular Biology; Springer New York: New York, NY, 2017; Volume 1607, pp. 595–610. ISBN 978-1-4939-6998-2. [Google Scholar]
  37. Blanc, E.; Roversi, P.; Vonrhein, C.; Flensburg, C.; Lea, S.M.; Bricogne, G. Refinement of Severely Incomplete Structures with Maximum Likelihood in BUSTER–TNT. Acta Crystallogr. D Biol. Crystallogr. 2004, 60, 2210–2221. [Google Scholar] [CrossRef] [Green Version]
  38. Vaguine, A.A.; Richelle, J.; Wodak, S.J. SFCHECK: A Unified Set of Procedures for Evaluating the Quality of Macromolecular Structure-Factor Data and Their Agreement with the Atomic Model. Acta Crystallogr. D Biol. Crystallogr. 1999, 55, 191–205. [Google Scholar] [CrossRef]
  39. Fourme, R.; Ascone, I.; Kahn, R.; Girard, E.; Mezouar, M.; Lin, T.; Johnson, J.E. New Trends in Macromolecular Crystallography at High Hydrostatic Pressure. In Proceedings of the Advances in High Pressure Bioscience and Biotechnology II; Winter, R., Ed.; Springer: Berlin/Heidelberg, Germany, 2003; pp. 161–170. [Google Scholar]
  40. Li, H.; Yamada, H.; Akasaka, K. Effect of Pressure on Individual Hydrogen Bonds in Proteins. Basic Pancreatic Trypsin Inhibitor. Biochemistry 1998, 37, 1167–1173. [Google Scholar] [CrossRef]
  41. Lu, X.-J. 3DNA: A Software Package for the Analysis, Rebuilding and Visualization of Three-Dimensional Nucleic Acid Structures. Nucleic Acids Res. 2003, 31, 5108–5121. [Google Scholar] [CrossRef] [Green Version]
  42. Sinden, R.R. DNA Structure and Function; Academic Press: San Diego, CA, USA, 1994; ISBN 978-0-12-645750-6. [Google Scholar]
  43. Westhof, E.; Prangé, T.; Chevrier, B.; Moras, D. Solvent Distribution in Crystals of B- and Z-Oligomers. Biochimie 1985, 67, 811–817. [Google Scholar] [CrossRef]
  44. Westhof, E. Water: An Integral Part of Nucleic Acid Structure. Annu. Rev. Biophys. Biophys. Chem. 1988, 17, 125–144. [Google Scholar] [CrossRef]
  45. Berman, H.M. Hydration of DNA. Curr. Opin. Struct. Biol. 1991, 1, 423–427. [Google Scholar] [CrossRef]
  46. Jeffrey, G.A.; Saenger, W. Hydrogen Bonding in Biological Structures; Springer: Berlin/Heidelberg, Germany, 1991; ISBN 978-3-642-85135-3. [Google Scholar]
  47. Schneider, B.; Cohen, D.; Berman, H.M. Hydration of DNA Bases: Analysis of Crystallographic Data. Biopolymers 1992, 32, 725–750. [Google Scholar] [CrossRef]
  48. Likhtenshtein, G.I. Nucleic Acids Hydration. In Biological Water; Soft and Biological Matter; Springer International Publishing: Cham, Switzerland, 2021; ISBN 978-3-030-82502-7. [Google Scholar]
  49. Saenger, W. Water and Nucleic Acids. In Principles of Nucleic Acid Structure; Springer Advanced Texts in Chemistry; Springer: New York, NY, USA, 1984; ISBN 978-0-387-90761-1. [Google Scholar]
  50. Barciszewski, J.; Jurczak, J.; Porowski, S.; Specht, T.; Erdmann, V.A. The Role of Water Structure in Conformational Changes of Nucleic Acids in Ambient and High-Pressure Conditions: Nucleic Acids at High Pressure. Eur. J. Biochem. 2001, 260, 293–307. [Google Scholar] [CrossRef]
  51. Krzyźaniak, A.; Salański, P.; Jurczak, J.; Barciszewski, J. B-Z DNA Reversible Conformation Changes Effected by High Pressure. FEBS Lett. 1991, 279, 1–4. [Google Scholar] [CrossRef] [Green Version]
Figure 1. Crystals of the dodeca-nucleotide B-DNA (a) and of the hexa-nucleotide Z-DNA (b). The first crystallizes as elongated needles, typically 100 × 800 μm in size, while the Z-DNA hexamer produces thicker crystals of about 200 × 400 μm in size.
Crystals 12 00871 g001
Figure 2. A Z-DNA d(CGCGCG)2 crystal in the DAC chamber seen at ambient pressure, (a) before and (b) after pressurization at 1 GPa. Although optically strongly affected by the compression cycle and the data collection, the crystal in (b) was still diffracting to 2.5 Å resolution when they initially diffracted up to 1.1 Å at ambient pressure.
Crystals 12 00871 g002
Figure 3. The three DNA crystal packings. (a) The B-DNA dodecamer and (b) the Z-DNA hexamer both with their c-axis vertically oriented. (c) The A-DNA octamer is viewed along the c-axis showing the associations of the twisted duplexes that form a superhelix delimiting a central void channel.
Crystals 12 00871 g003
Figure 4. Top: Volume compressibility V(P) normalized as V/Vo for the B-dodecamer (in orange) and the Z-hexamer (in blue). In both cases, a rapid decrease is first observed at P ≤ 250 MPa, followed by a linear dependency. Bottom: Evolution of the corresponding normalized cell parameters showing the anisotropy of the compression. The a unit-cell parameter is in blue, b in red, and c in green. Solid lines for the B-DNA, dotted lines for the Z-DNA.
Crystals 12 00871 g004
Figure 5. Electron densities of (a) B-DNA at 310 MPa (side view) and (b) the Z-DNA C3-G10 base-pair along the helix axis at 300 and 715 MPa. The map contouring is at the 1.5 σ level.
Crystals 12 00871 g005
Figure 6. Superposition of the B-DNA (left) and Z-DNA (right) structures at ambient pressure (in blue) and 310 MPa and 715 Mpa, respectively (in red), showing, in both cases, the amplitude of the base compression.
Crystals 12 00871 g006
Scheme 1. A schematic representation of the two pressure-dependent regimes of the DNA crystals as a function of increasing pressure (elastic or reversible in black, irreversible in red).
Crystals 12 00871 sch001
Table 1. Summary of data collection and processing statistics (space group P212121, Z = 4 for all). Values in parentheses are for the highest resolution shell.
DNA 1—Pressure (MPa)B–310Z–300Z–540Z–715
Resolution all (Å)34–2.5525.1–1.4125.1–1.4125.1–1.41
Resolution high (Å)2.6–2.551.44–1.411.44–1.411.44–1.41
Cell dimensions
a (Å)25.2317.9017.8717.80
b (Å)40.6631.0430.9630.89
c (Å)65.2044.1943.8943.77
Cell volume (Å3)66 88524 55424 28224 066
Completeness (%)78 (70)91.2 (79.1)77.4 (75.1)69.9 (66.6)
Redundancy4.1 (3.3)5.2 (4.9)5.8 (5.7)5.6 (5.7)
Unique reflections2412 (277)4712 (291)3922 (271)3464 (255)
Rmerge (%)11.2 (35.3)14.6 (20.6)11.2 (18.9)10.4 (42.5)
Rpim (%)5.4 (23.3)7.8 (17.7)4.7 (17.9)6.6 (30.1)
I/σ (I)8.1 (1.9)9.6 (4.9)7.8 (2.1)10.6 (2.4)
1 The Z-DNA hexamer d(CGCGCG)2 diffracts to atomic resolution (1.1 Å), but the cell environment limits the practical resolution to 1.41 Å.
Table 2. Summary of refinements statistics.
DNA 1–Pressure (MPa)B−310Z−300Z−540Z−715
PDB ID’s7zql7zqm7zqn7zqo
Rwork (%)18.019.119.020.7
Rfree (%)23.529.522.526.8
Estimated coords error (Å)0.2500.0530.0600.062
Mean standard deviations
from ideality
1–2 distances (Å)0.0050.0090.0080.006
1–2 Angles (°)1.9472.4932.4221.967
Planes (Å)0.0180.0230.0220.022
No of waters19625247
Average B factors (Å2)
Overall22.29.910.810.9
Bases (A-T, C-G)17.86.47.59.2
Deoxy-riboses25.87.88.79.5
Phosphates30.311.412.612.0
Water22.723.422.520.4
1 The Z-DNA hexamer d(CGCGCG)2 diffracts to atomic resolution (1.1 Å), but the cell environment limits the practical resolution to 1.41 Å.
Table 3. DNA crystal characteristics at ambient pressure.
B-DNAZ-DNAA-DNA 1
compoundd(CGCGAATTCGCG)2d(CGCGCG)2d(GGTATACC)2
System/space groupOrthorhombic
P212121
Orthorhombic
P212121
Hexagonal
P61
Z =446
Cell parameters (Å)
a =25.2217.9445.034
b =40.6631.4145.034
c =67.1944.7841.747
Vo3)68,899.725,233.373,322.4
Resolution (Å)2.41.4 21.6
Compactness(Å3/resid.)717525763
Pmax (GPa)0.4–0.51.3–1.5>1.9
1 The A-DNA data are from [10]; 2 Maximum resolution limited by the beamline geometry.
Table 4. Dependency of the unit-cell parameters vs. the applied pressure. Pressures are in GPa, unit-cell dimensions are in Å, volume in Å3, and compressibility coefficients χ in GPa−1. The grey rows in the Table correspond to values from full data collections, the others from frames collected only in a short rotation range. Estimated standard deviations on cell parameters are in the range of 0.005–0.01 Å (1 to 3 Å3 on volumes). In each case, the last column reports the specific compressibility coefficient χ.
B-DNA Dodecamer Z-DNA Hexamer
PressureabcVxVPressureabcVxV
Ambient25.2240.6667.1968,899 Ambient17.9431.4144.7825,233
0.2125.2440.6665.8067,5280.080.2217.9031.2244.3024,7570.10
0.3125.2340.6665.2066,8850.090.3017.9031.0444.1924,5530.08
0.4525.1940.6464.7566,2860.090.5417.8730.9643.8924,2820.05
0.7117.8030.8943.7724,0670.05
0.8017.7730.8443.7423,9710.04
1.117.6930.7943.4523,6660.04
Table 5. The average values of the Watson–Crick base pair distances in Å versus the applied pressure measured in the refined structures. To avoid bias resulting from refinement steps, the distances within the base pairs were not restrained. Pressures are in MPa. (Ambient structures are 1bna and 2elv for B- and Z-DNAs).
B-DNA Dodecamer 1Z-DNA Hexamer 1
Base pairA-TC-G C-G
PressureN1-N3N6-O4C1′-C1′N4-O6N3-N1O2-N2C1′-C1′PressureN4-O6N3-N1O2-N2C1′-C1′
Ambient2.813.0110.532.852.892.8610.71Ambient2.902.962.8810.86
3102.813.1310.372.872.872.8110.633002.862.902.8610.72
5402.872.922.8510.76
7152.862.942.9010.78
1 Estimated standard deviations (e.s.d.) are calculated as 0.03 and 0.02 Å in B-DNA and Z-DNA distances, respectively.
Table 6. Pressure dependencies of the longitudinal compression distances and base stackings. The ∂x/∂p parameters were estimated as linear within each bin of pressure. Grey lines correspond to structures fully determined. The ∂x/∂p term is given in the direction of compression (positive).
B-DNAZ-DNA
Pressure (MPa)Height (Å)Base Stack (Å)∂x/∂p (Å·GPa−1)Pressure (MPa)Height (Å)Base Stack (Å)∂x/∂p (Å·GPa−1)
Ambient36.603.39-Ambient18.03.58-
210-3.30 10.43 130017.633.530.23
31035.453.260.4054017.403.480.21
450-3.20 10.43 171517.243.470.17
1100 117.103.420.13
1 Values interpolated from the experimental c-axis compression (e.s.d.s estimated as 0.03 Å). Uncertainties on ∂x/∂p values are estimated ± 0.02 Å/GPa).
Publisher’s Note: MDPI stays neutral with regard to jurisdictional claims in published maps and institutional affiliations.

