Article

Four-Coordinate Monoboron Complexes with 8-Hydroxyquinolin-5-Sulfonate: Synthesis, Crystal Structures, Theoretical Studies, and Luminescence Properties

by
Glenda Y. Ruelas-Álvarez
1,
A. Jaquelin Cárdenas-Valenzuela
1,
Luis L. Galaviz-Moreno
1,
Adriana Cruz-Enríquez
1,*,
José J. Campos-Gaxiola
1,
Herbert Höpfl
2,
Jesús Baldenebro-López
1,
Eva C. Vargas-Olvera
2,
Valentín Miranda-Soto
3,
Blanca A. García Grajeda
1 and
Daniel Glossman-Mitnik
4
1
Facultad de Ingeniería Mochis, Universidad Autónoma de Sinaloa, Fuente de Poseidón y Prol. A. Flores S/N, C.U., Los Mochis C.P. 81223, Sinaloa, Mexico
2
Centro de Investigaciones Químicas, Instituto de Investigación en Ciencias Básicas y Aplicadas, Universidad Autónoma del Estado de Morelos, Av. Universidad 1001, Cuernavaca C.P. 62209, Morelos, Mexico
3
Tecnológico Nacional de México/Instituto Tecnológico de Tijuana/Centro de Graduados e Investigación en Química, Apartado Postal 1166, Tijuana C.P. 22000, Baja California, Mexico
4
Centro de Investigación en Materiales Avanzados, S. C., Miguel de Cervantes 120, Complejo Industrial Chihuahua, Chihuahua C.P. 31136, Chihuahua, Mexico
*
Author to whom correspondence should be addressed.
Crystals 2022, 12(6), 783; https://doi.org/10.3390/cryst12060783
Submission received: 1 May 2022 / Revised: 22 May 2022 / Accepted: 23 May 2022 / Published: 28 May 2022
(This article belongs to the Special Issue Photoresponsive Organic Molecular Crystals)

Abstract

:
8-Hydroxyquinolin-5-sulfonic acid (8HQSA) was combined with 3-pyridineboronic acid (3PBA) or 4-pyridineboronic acid (4PBA) to give two zwitterionic monoboron complexes in crystalline form. The compounds were characterized by elemental analysis, single-crystal X-ray diffraction studies, and IR, 1H NMR, UV-Visible, and luminescence spectroscopy. The analyses revealed compounds with boron atoms adopting tetrahedral geometry. In the solid state, the molecular components are linked by charge-assisted (B)(O−H⋯O(S) and N+−H⋯O(S) hydrogen bonds aside from C−H⋯O contacts and π⋯π interactions, as shown by Hirshfeld surface analyses and 2D fingerprint plots. The luminescence properties were characterized in terms of the emission behavior in solution and the solid state, showing emission in the bluish-green region in solution and large positive solvatofluorochromism, caused by intramolecular charge transfer. According to TD-DFT calculations at the M06-2X/6-31G(d) level of theory simulating an ethanol solvent environment, the emission properties are originated from π-π * and n-π * HOMO-LUMO transitions.

1. Introduction

The last few decades have featured the design and synthesis of a large number of luminescent organic and organometallic compounds with outstanding electronic and optical properties [1,2], and a broad spectrum of applications in various fields such as organic light-emitting diodes (OLEDs) [3], laser dyes [4], fluorescence imaging probes [5], solar cells [6], sensors [7], and photodynamic therapy [8], In the past decade, much research progress and important discoveries have been achieved with π-conjugated three- and four-coordinate boron compounds [9,10]. Frequently, such organoboron compounds are targeted to study the influence on the electronic and photophysical properties of the ligand and substituents attached at different positions, because they can exhibit tunable fluorescence emission ranging from green to orange in the solid state [11,12]. Furthermore, zwitterionic four-coordinate organoboron compounds with rigid π-conjugated structures are promising luminescent materials because of their intense luminescence, good thermal stability, and high carrier mobility, which enable them to be applied as emitters not only for OLEDs, but also for other optoelectronic applications such as sensory, biological imaging materials, and photoresponsive materials [10].
Fluorescent organoboron compounds have been achieved with N,O-, N,N- and O,O-chelating ligands, such as 2,2′-dipyrromethenes [13,14], quinolates [15,16,17,18], diketonates [19,20], subphthalocyanines [21,22], and hydrazine-bispyrroles (BOPHY) [23,24]. Four-coordinate boron compounds based on π-conjugated chelate ligands have emerged recently as attractive materials for various optoelectronic applications, including emitters, electron-transport materials, and host/hole-blocking devices for organic light-emitting diodes (OLEDs) [25,26,27]. Frequently, boron-based four-coordinate complexes are obtained by incorporating an aromatic nitrogen-donor atom into the vacant p-orbital of sp2-hybridized boron atoms, with the low-energy π*-orbital of the nitrogen donor acting simultaneously as an electron-accepting unit [28,29,30].
Boron dipyrromethenes (BODIPYs) based on N,N-chelating dipyrrinato ligands are versatile fluorophores with outstanding optical properties, including high fluorescence quantum yields, molar extinction coefficients, and good chemical and physical photostability [31,32]. In contrast, boron complexes containing monoanionic bidentate N,O-ligands show large Stokes shifts, enhanced fluorescence emission (particularly in the solid state) and rich structural diversity. Moreover, since boron atoms in four-coordinate monoboron complexes adopt typically sp3-hybridization, the electron communication among a chelating ligand and additional monodentate ligands bound to the same boron atom is blocked, providing the opportunity for designing fluorophores having multiple emissive centers, constituting an interesting option for developing functional molecular systems via intermolecular interactions [28,30]. Organoboron quinolinolates such as κ2-(N,O)-8-quinolato diphenylborane (Ph2Bq) exhibit efficient luminescence in the blue region, as well as good stability due to the increased covalent-bonding character of the boron–ligand bonds [33]. Recent studies with the purpose of examining the effects of electron-withdrawing substituents at the ligands in organoboron quinoline demonstrated that these have a significant impact on the emission characteristics [34].
The above-mentioned examples demonstrate a high potential of boracyclic complexes for applications in optoelectronic devices, which has encouraged us to conduct a comprehensive study on boron complexes with a novel N,O-chelating ligand. In this contribution, we report the synthesis, structural characterization, and photophysical properties of two novel zwitterionic organoboron complexes derived from 3-pyridineboronic acid (3PBA) or 4-pyridineboronic acid (4PBA) and 8-hydroxyquinoline-5-sulfonic acid (8HQSA) as N,O-chelating ligand, see Scheme 1. In addition, density functional theory was used to identify trends in the electronic structures and optical properties. Organoboron compounds 12 exhibit a bluish-green emission in solution (MeOH) and in the solid state, and have potential for tuning the emission characteristics, which might lead to the development of emissive materials for practical applications.

2. Materials and Methods

2.1. General

All reagents and solvents were commercially available from Sigma-Aldrich and used as received without further purification. All preparative methods were performed under normal ambient conditions without use of inert atmosphere.
IR spectra were measured on a Bruker Alpha Tensor 27 spectrophotometer using KBr pellets in the 4000–500 cm−1 region. 1H NMR spectra were recorded in CD3OD at 400 MHz with a BrukerAvance III spectrometer at 30 °C unless otherwise specified. Chemical shifts are reported in ppm and were referenced based on residual solvent resonances. Complexes exhibit low solubility in organic solvents, and therefore the signals referred to carbon and boron atoms were not detected in the corresponding 13C NMR and 11B NMR spectra, even after prolonged acquisition. UV–Vis absorption spectra were recorded on a Shimadzu UV-1800 UV spectrophotometer. Emission spectra in solution and the solid state were obtained on a PerkinElmer LS-55 fluorescence spectrophotometer. Elemental analyses were performed on a Vario Micro (Elementar) spectrometer. Melting points were determined with a Büchi B-540 digital apparatus.

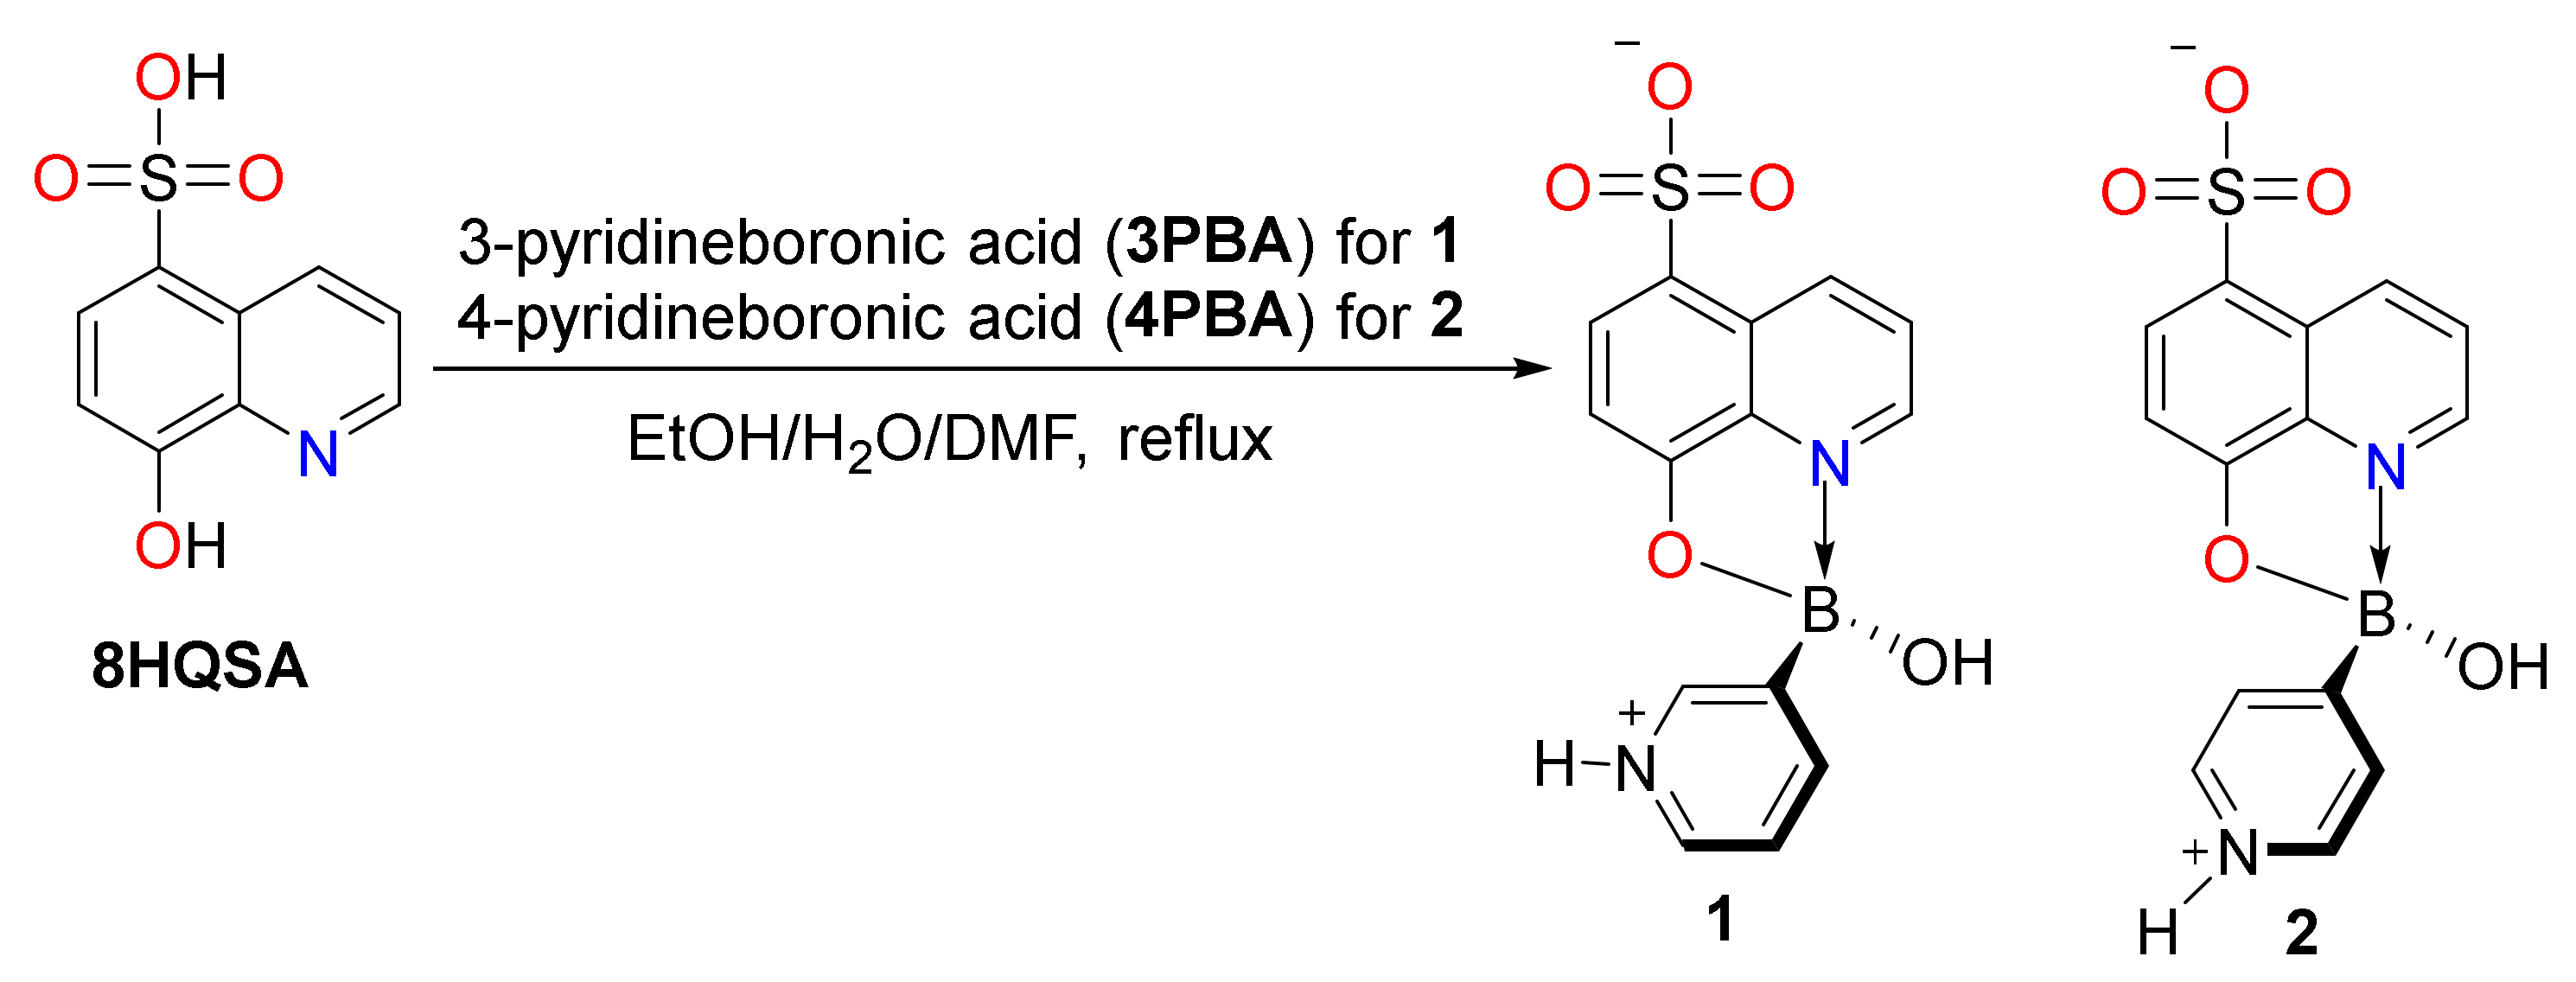
2.2. Preparation of Boronic Ester Complex 1

In a round-bottom flask, 3-pyridineboronic acid (0.030 g, 0.244 mmol) and 8-hydroxy-5-quinolinesulfonic acid hydrate (0.055 g, 0.244 mmol) were dissolved in the solvent mixture ethanol/H2O/DMF (15:4:1, v/v/v, 20 mL). The reaction mixture was refluxed for 1 h. After cooling to room temperature, yellow crystals suitable for X-ray diffraction analysis were obtained. Yield 0.021 g (64%). Mp: 272–275 °C. FTIR(KBr) ṽ = 3406 (m), 3252 (s), 3125(m), 3071 (s), 2926 (w), 2648 (m), 2187 (w), 1622 (m), 1504 (s), 1464 (m), 1400 (m), 1375 (m), 1229 (s), 1170 (s), 1093 (m), 1037 (m), 897 (m), 846 (w), 770 (m), 725 (w), 690 (m), 644 (w), 605 (w), 583 (w), 550 (w) cm−1. 1H NMR (400 MHz, CD3OD) δ = 9.46 (m, 1H), 8.89 (s, 1 H), 8.77 (s, 1 H), 8.68–8.66 (m, 1 H), 8.61(d, J = 8 Hz, 1 H), 8.30 (d, J = 4 Hz, 1 H)), 8.01 (m, 1 H), 7.92 (t, J = 8 Hz, 1 H), 7.22 (d, J = 8 Hz, 1 H) ppm. Elemental analysis for C14H13BN2O6S (348.14 g/mol) Calcd. C, 48.30; H, 3.76; N, 8.05; found C, 48.40; H, 3.48; N, 8.07%.

2.3. Preparation of Boronic Ester Complex 2

Compound 2 was prepared according to the methodology described for 1, except that 4-pyridineboronic acid (0.03 g, 0.244 mmol) was utilized instead of 3-pyridineboronic acid. After three weeks of slow solvent evaporation, yellow crystals suitable for X-ray diffraction analysis had formed. Yield: 0.059 (73%). Mp dec: >300 °C. FTIR (KBr) ṽ = 3412 (s), 3260 (m), 3136 (m), 3011 (s), 2883 (s), 2791 (s), 2703 (s), 2075 (m), 1982 (m), 1866 (m), 1620 (s), 1580 (m), 1505 (s), 1470 (w), 1428 (w), 1400 (m), 1376 (m), 1226 (m), 1186 (s), 1164 (s), 1034 (m), 891 (m), 838 (m), 822 (m), 768 (m), 755 (m), 715 (m), 621 (w), 595 (m), 572 (w), 526 (w) cm−1. 1H NMR (400 MHz, CD3OD) δ = 9.70–9.41 (m, 1 H), 9.02–8.81 (m, 1 H), 8.65–8.46 (m, 2 H), 8.36–8.19 (m, 1 H), 8.13–7.91 (m, 3 H), 7.31–7.19 (m, 1 H) ppm. Elemental analysis for C14H11BN2O5S (330.12 g/mol) Calcd. C, 50.94; H, 3.36; N, 8.49%; found C, 51.11; H, 3.28; N, 8.61.

2.4. Crystallography

Single-crystal X-ray diffraction analyses of complexes 1 and 2 were carried out on an Agilent Technologies SuperNova diffractometer equipped with a CCD area detector (EosS2) using Cu-Kα radiation (1.54184 Å) from a microfocus X-ray source and an Oxford Instruments Cryojet cooler. Data for compounds 1 and 2 were collected at T = 100 K. The measured intensities were reduced to F2 and corrected for absorption using spherical harmonics (CrysAlisPro) [35]. Structure solution, refinement, and data output were performed with the OLEX2 [36] program package using SHELXTL [37] for the structure solution and SHELXL-2014 [38] for the refinement. Nonhydrogen atoms were refined anisotropically. C-H hydrogen atoms were placed in geometrically calculated positions using the riding model. O-H and N-H hydrogen atoms in 1 and 2 were located from difference Fourier maps and refined with distance restraints (AFIX 147 for the (B)O-H, AFIX 43 for the N-H and DFIX 0.85 for the Ow-H hydrogen atoms). Hydrogen-bonding interactions in the crystal lattice were calculated with the MERCURY program package [39] DIAMOND was used for the creation of figures [40].
1: C14H11BN2O5S·H2O, Mr = 348.13 g mol−1, yellow block, monoclinic, space group P21/c, a = 11.91173(18), b = 8.04684(10), c = 16.1126(2) Å, α = 90, β = 107.0046(16), γ = 90°, V = 1476.90(4)Å3, Dc = 1.566 g cm−3, T = 100 K, Z = 4, µ(Cu) = 2.288 mm−1. Total 5179 reflections, 2865 unique (Rint = 0.0131). Refinement of 2768 reflections (224 parameters) with I > 2σ(I) converged at final R1 = 0.0312 (R1 all data = 0.0321), wR2 = 0.0828 (wR2 all data = 0.0836), F(000) = 720, gof = 1.067. CCDC 1587893.
2: C14H11BN2O5S, Mr = 330.12 g mol−1, yellow block, triclinic, space group P-1, a = 6.60091(19), b = 9.4469(3), c = 11.8991(3) Å, α = 69.045(3), β = 80.625(2), γ = 78.120(3)°, V = 674.85(4)Å3, Dc = 1.625 g cm−3, T = 100 K, Z = 2, µ(Cu) = 2.413 mm−1. Total 8409 reflections, 2605 unique (Rint = 0.0385). Refinement of 2577 reflections (209 parameters) with I > 2σ(I) converged at final R1 = 0.0458 (R1 all data = 0.0462), wR2 = 0.1355 (wR2 all data = 0.1360), F(000) = 340, gof = 1.097. CCDC 1587894.
Phase purity was examined by powder X-ray diffraction (PXRD) analysis performed at ~295 K, using a BRUKER D8-ADVANCE diffractometer equipped with a LynxEye detector (λCuKα1 = 1.5406 Å, monochromator: germanium). The equipment was operated at 40 kV and 40 mA, and data were collected at room temperature in the range of 2θ = 5–50°. The powder XRD patterns of 1 and 2 at room temperature match well with the simulated XRD patterns based on the respective crystal structure (see, Figures S8 and S9), in terms of the peak positions, confirming that the powder samples are single phases, which can be used for the investigation of the photoluminescence properties described in Section 3.5.

2.5. Computational Details

Hirshfeld surface analyses and fingerprint plots of 1 and 2 were generated based on the crystallographic information files (CIFs) using Crystal Explorer 3.1 [41,42,43]. The Hirshfeld surface (dnorm), shape index and curvedness were mapped over the range –0.7 to +1.8, –1.0 to +1.0 and –4.0 to +4.0, respectively.
Quantum chemical calculations for compounds 1 and 2 were performed by density functional theory [44,45] with the GAUSSIAN09 package [46]. Visualization of calculated parameters was performed by the GaussView molecular visualization program [47]. Minimum energy structures were calculated and confirmed through a frequency calculation (without imaginary frequencies). Transitions between the different orbitals were evaluated with time-dependent density functional theory (TD-DFT) [48,49] at the calculation level M06-2X/6-31G(d) [50,51]. The effects of a solvated environment were evaluated with the integral equation formalism for the polarizable continuum model (IEF-PCM) and the implementation of the nonequilibrium solvation model [52]. The solvent considered for this analysis was ethanol.

3. Results and Discussion

Organoboron complexes 1 and 2 were obtained from reactions of 8-hydroxyquinoline-5-sulfonic acid (8HQSA) with 3-pyridineboronic (3PBA) or 4-pyridineboronic acid (4PBA) using a solvent mixture EtOH/H2O/DMF (15:4:1 v/v/v) (Scheme 1). The novel compounds were obtained in good yields (64 and 73%) as yellow solids, which are slightly soluble in common polar organic solvents. The products were characterized by elemental analysis, powder, and single-crystal X-ray diffraction analysis, as well as IR, 1H NMR, UV-vis and luminescence spectroscopy (Figures S1–S9, in Supplementary Materials).

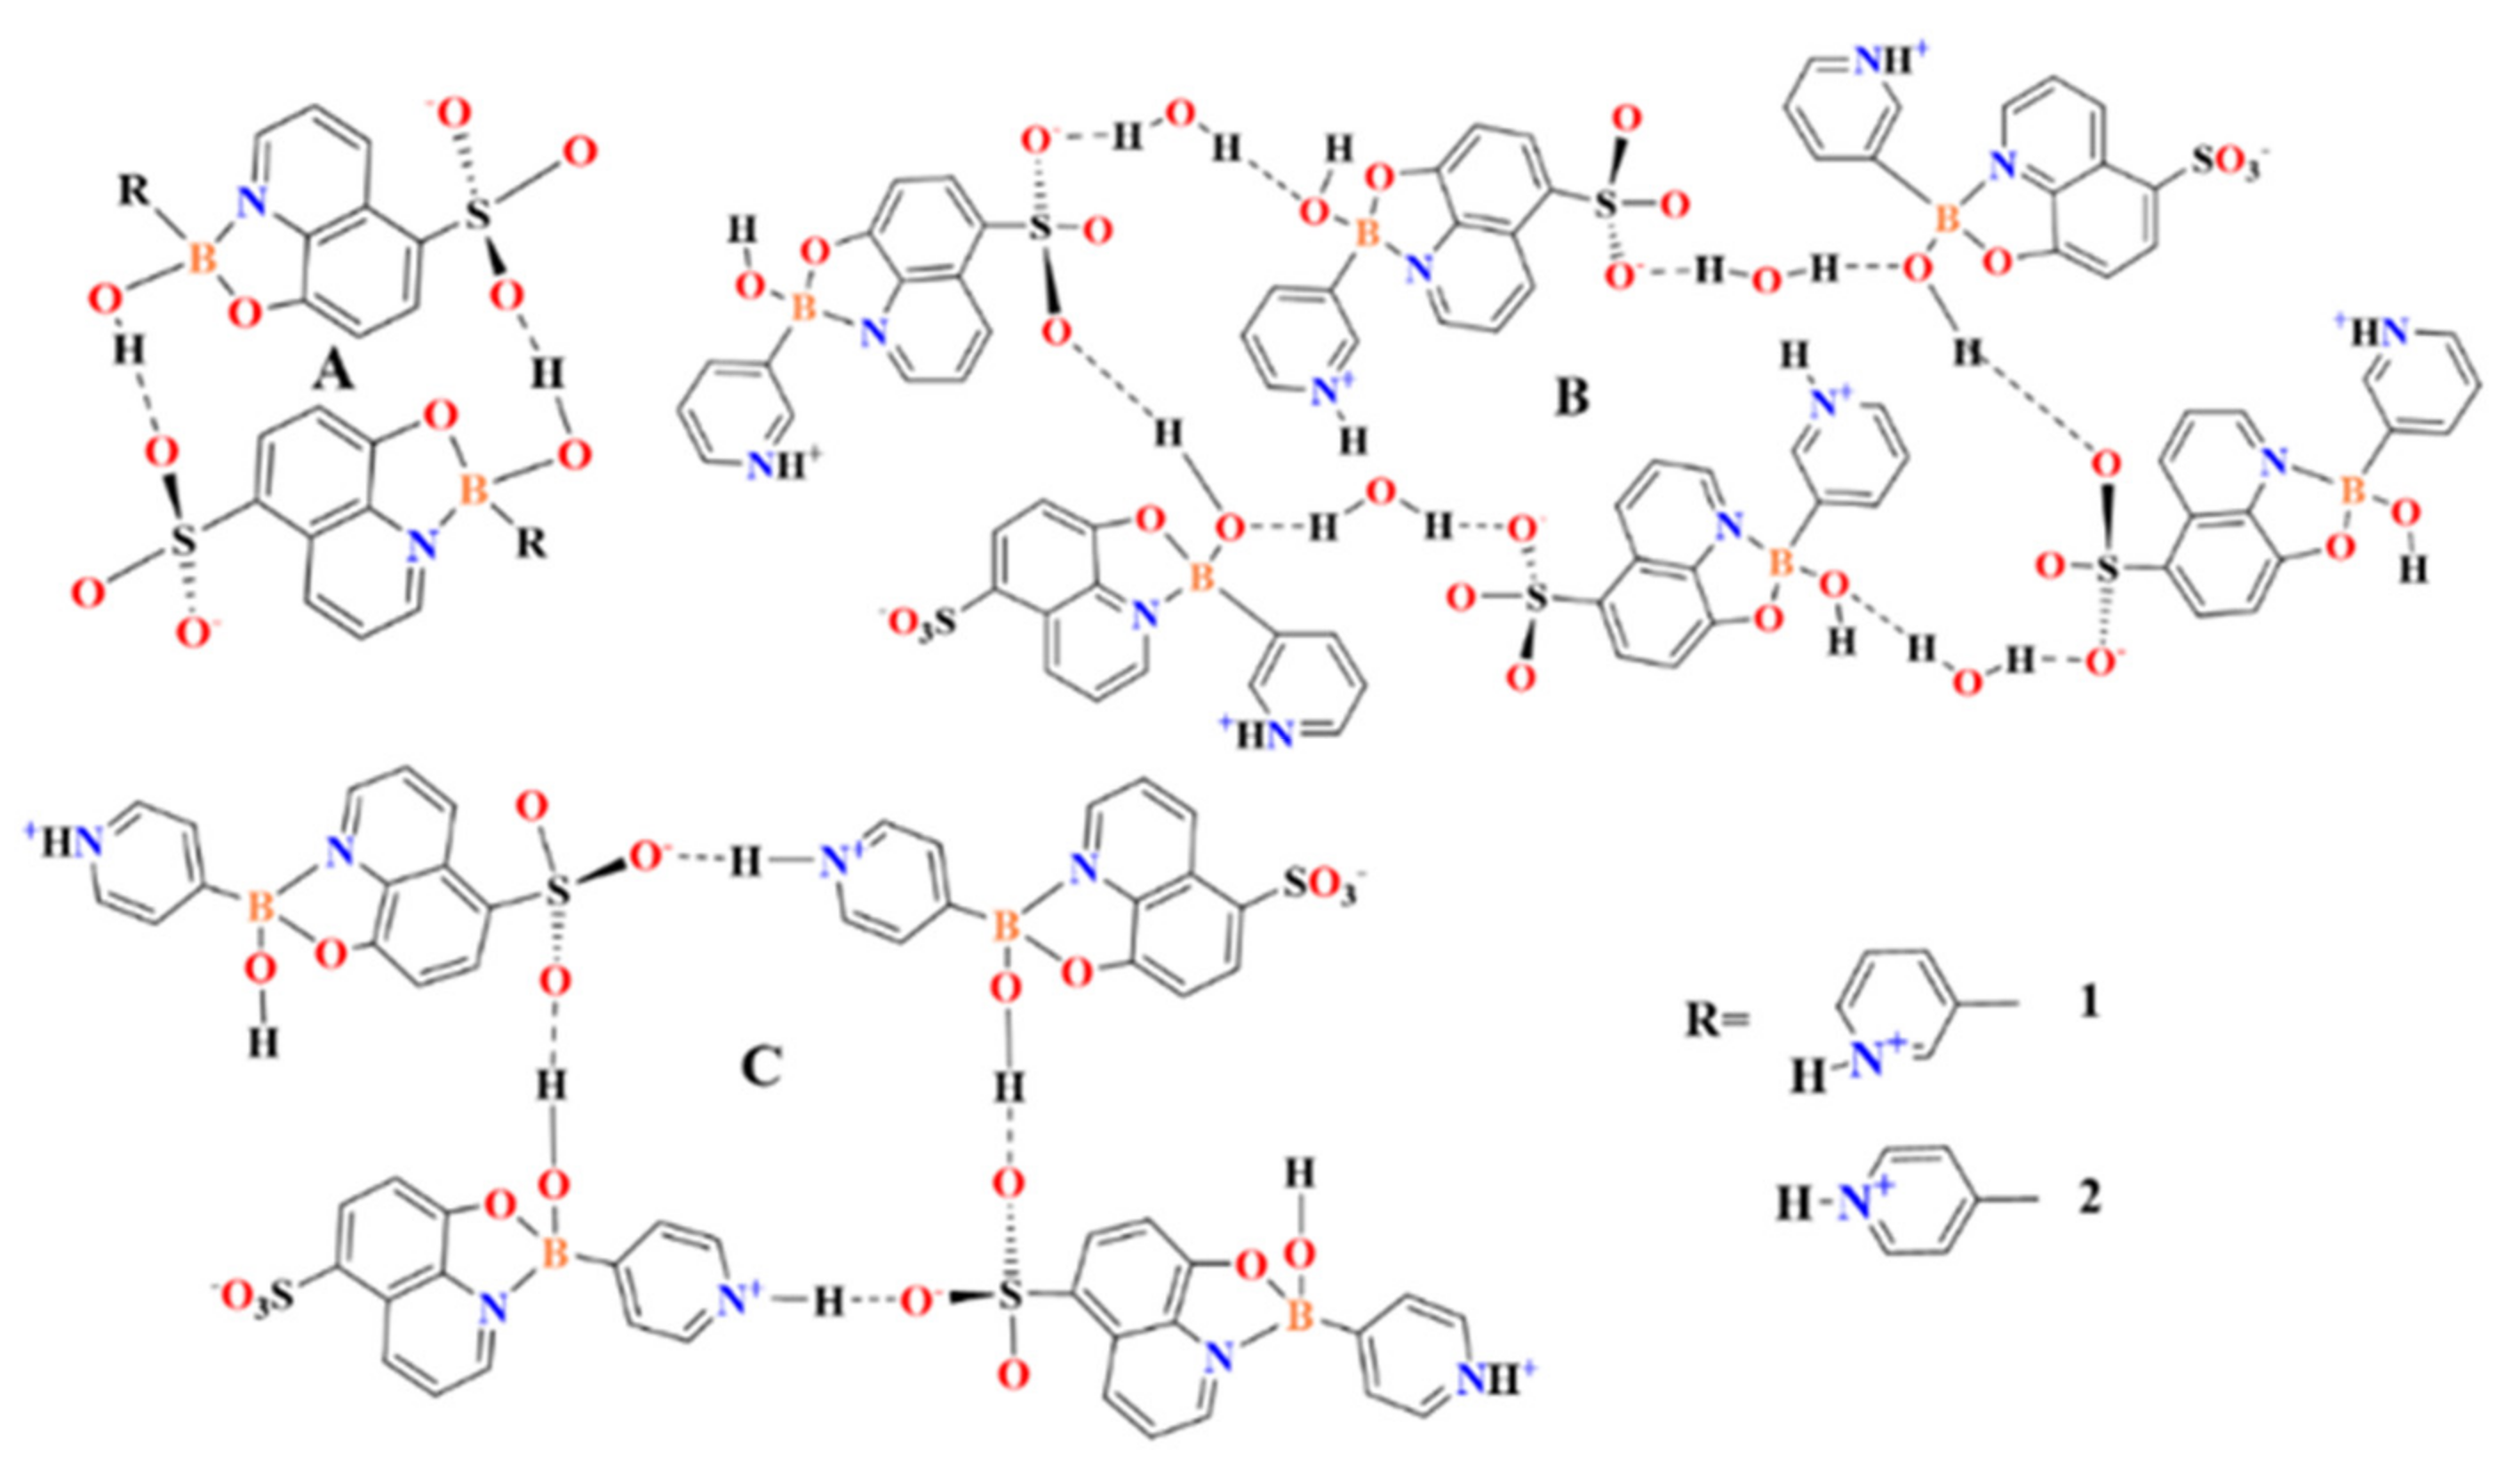
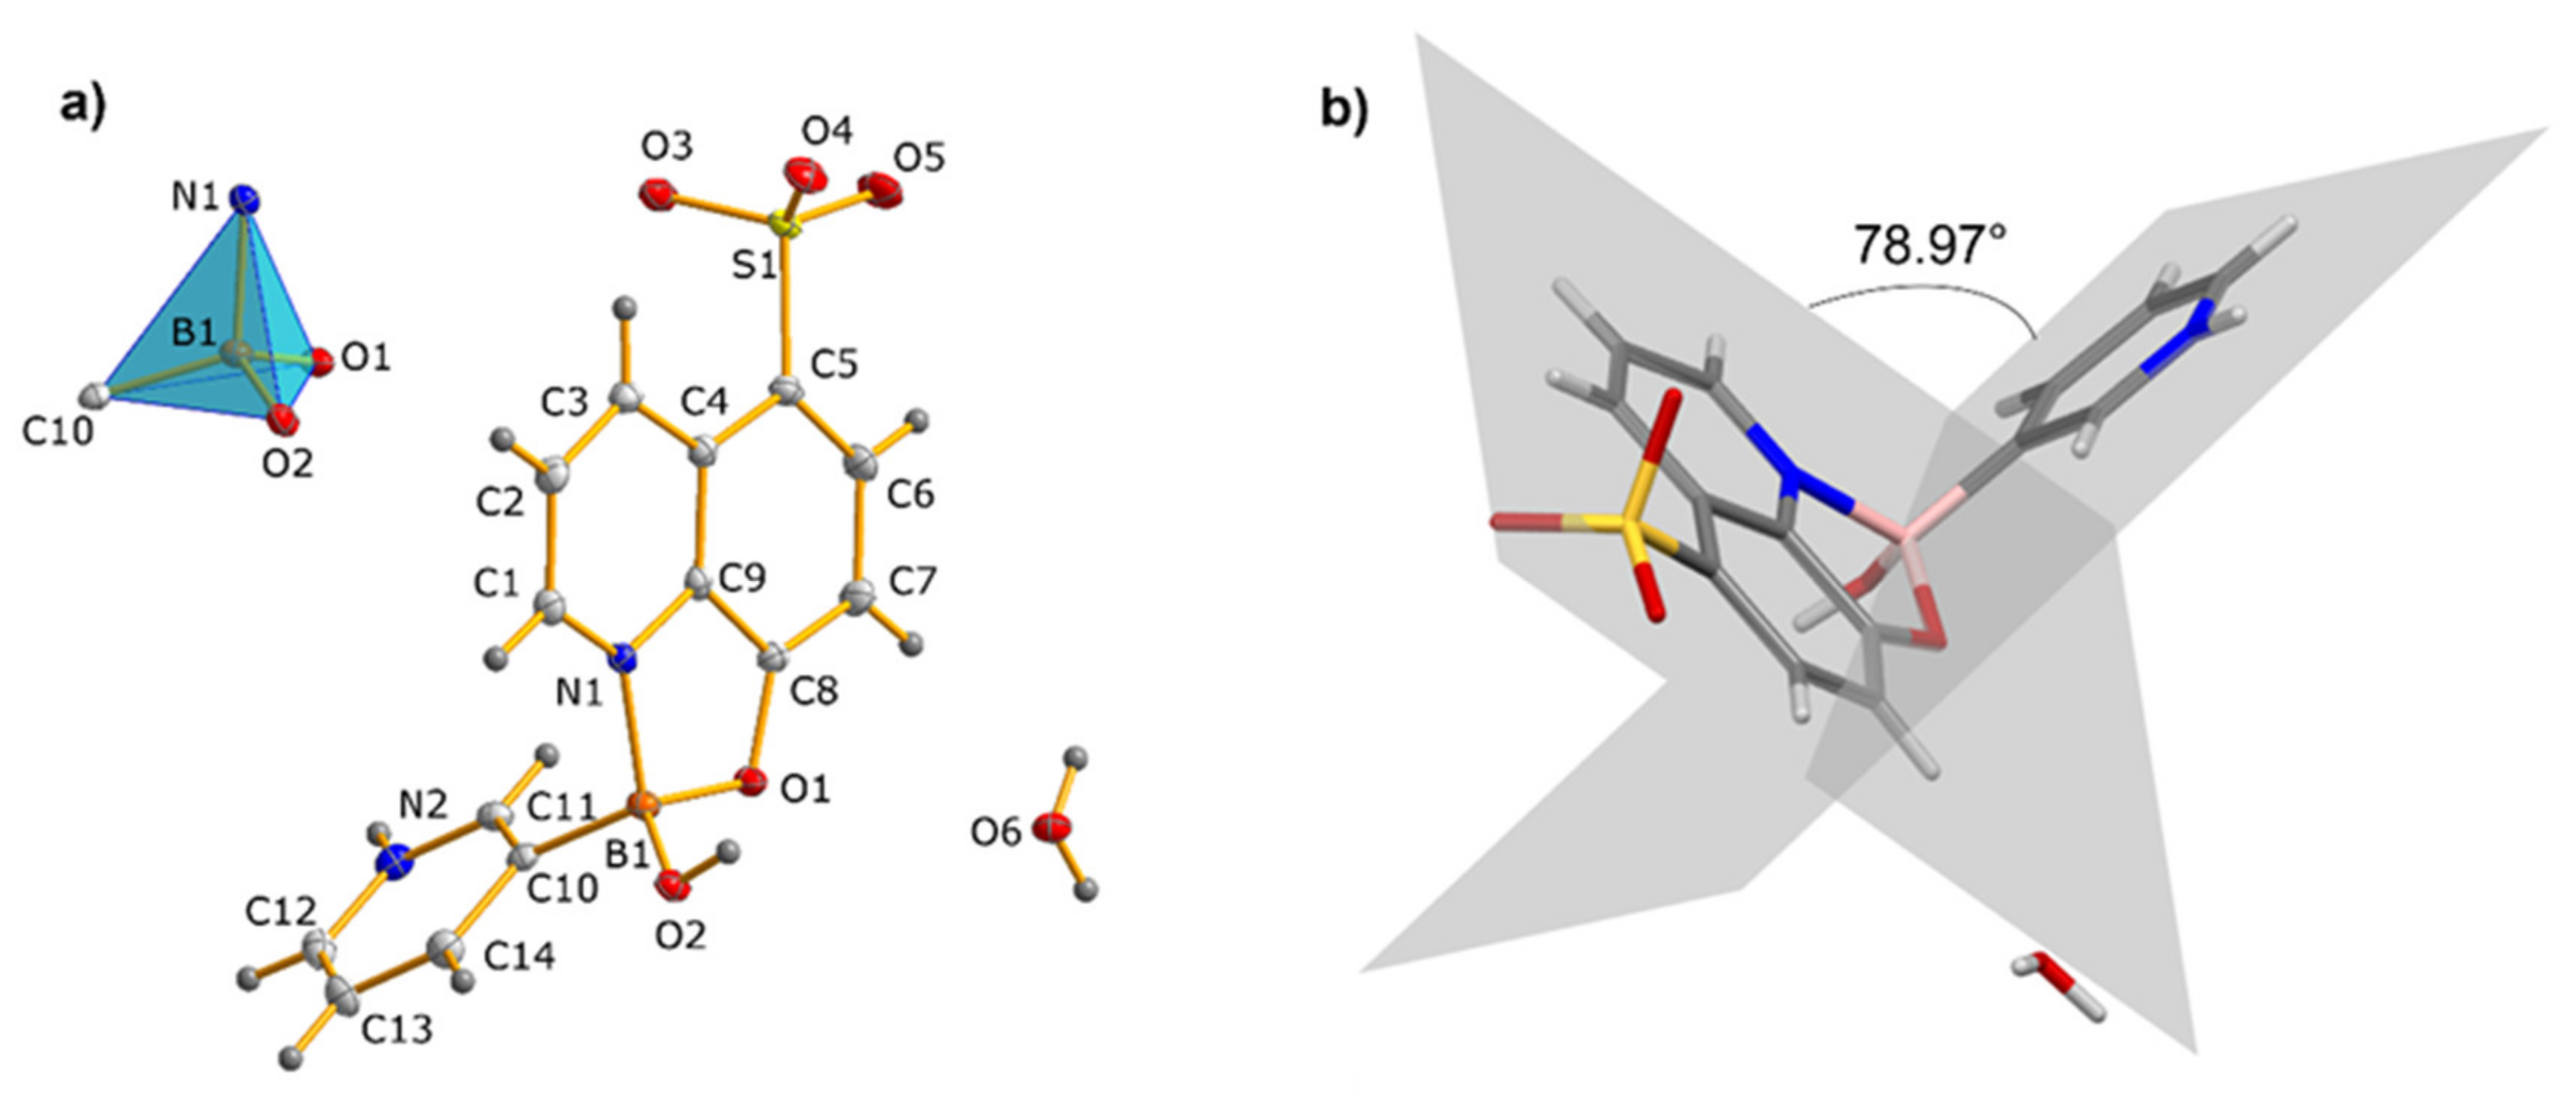
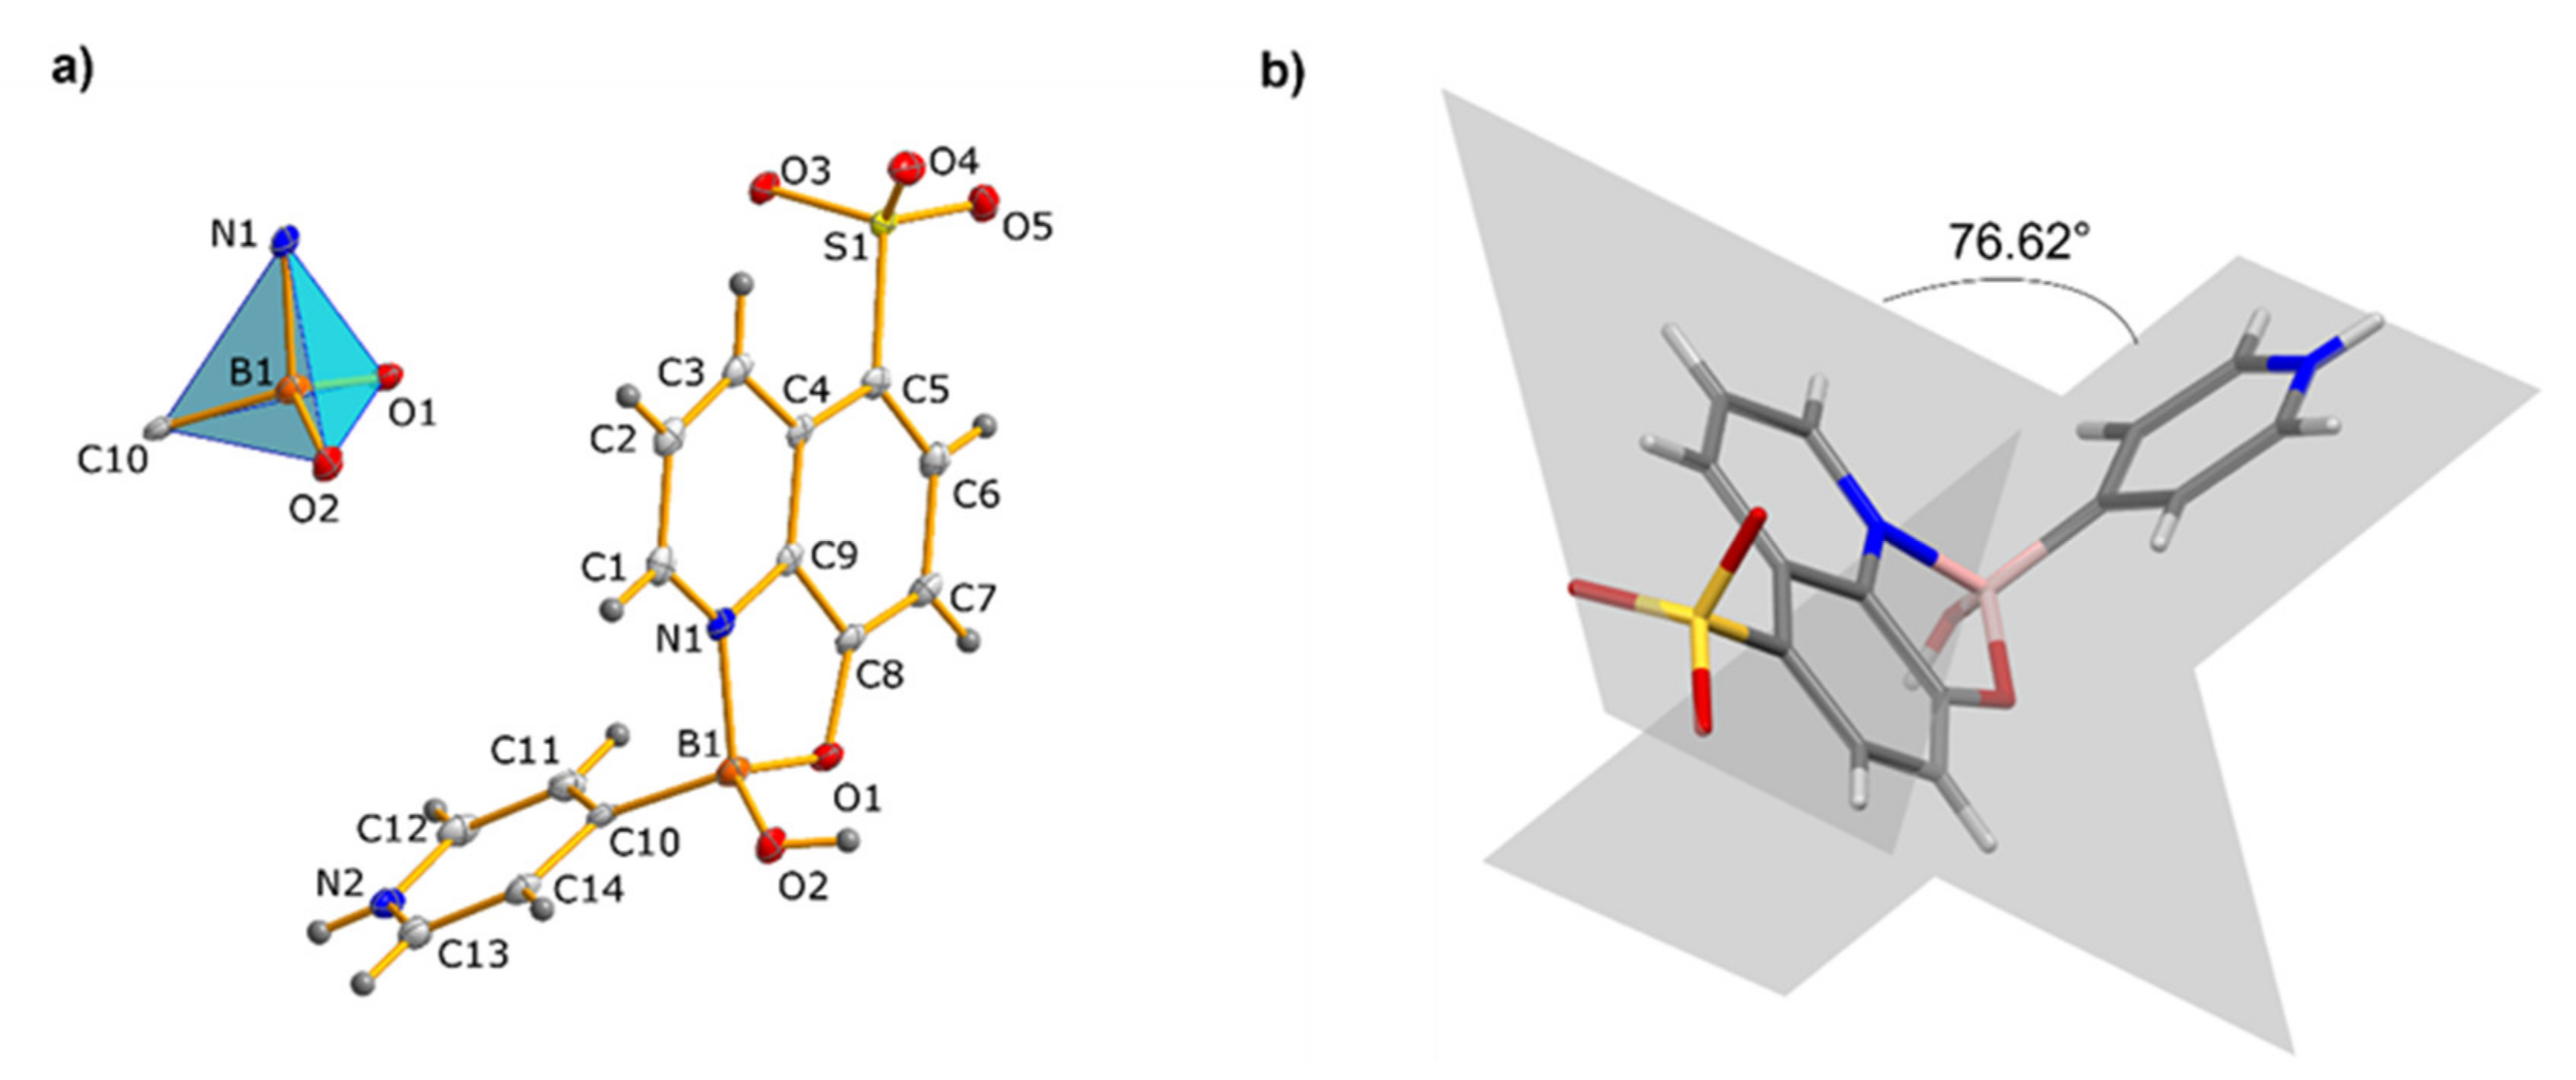
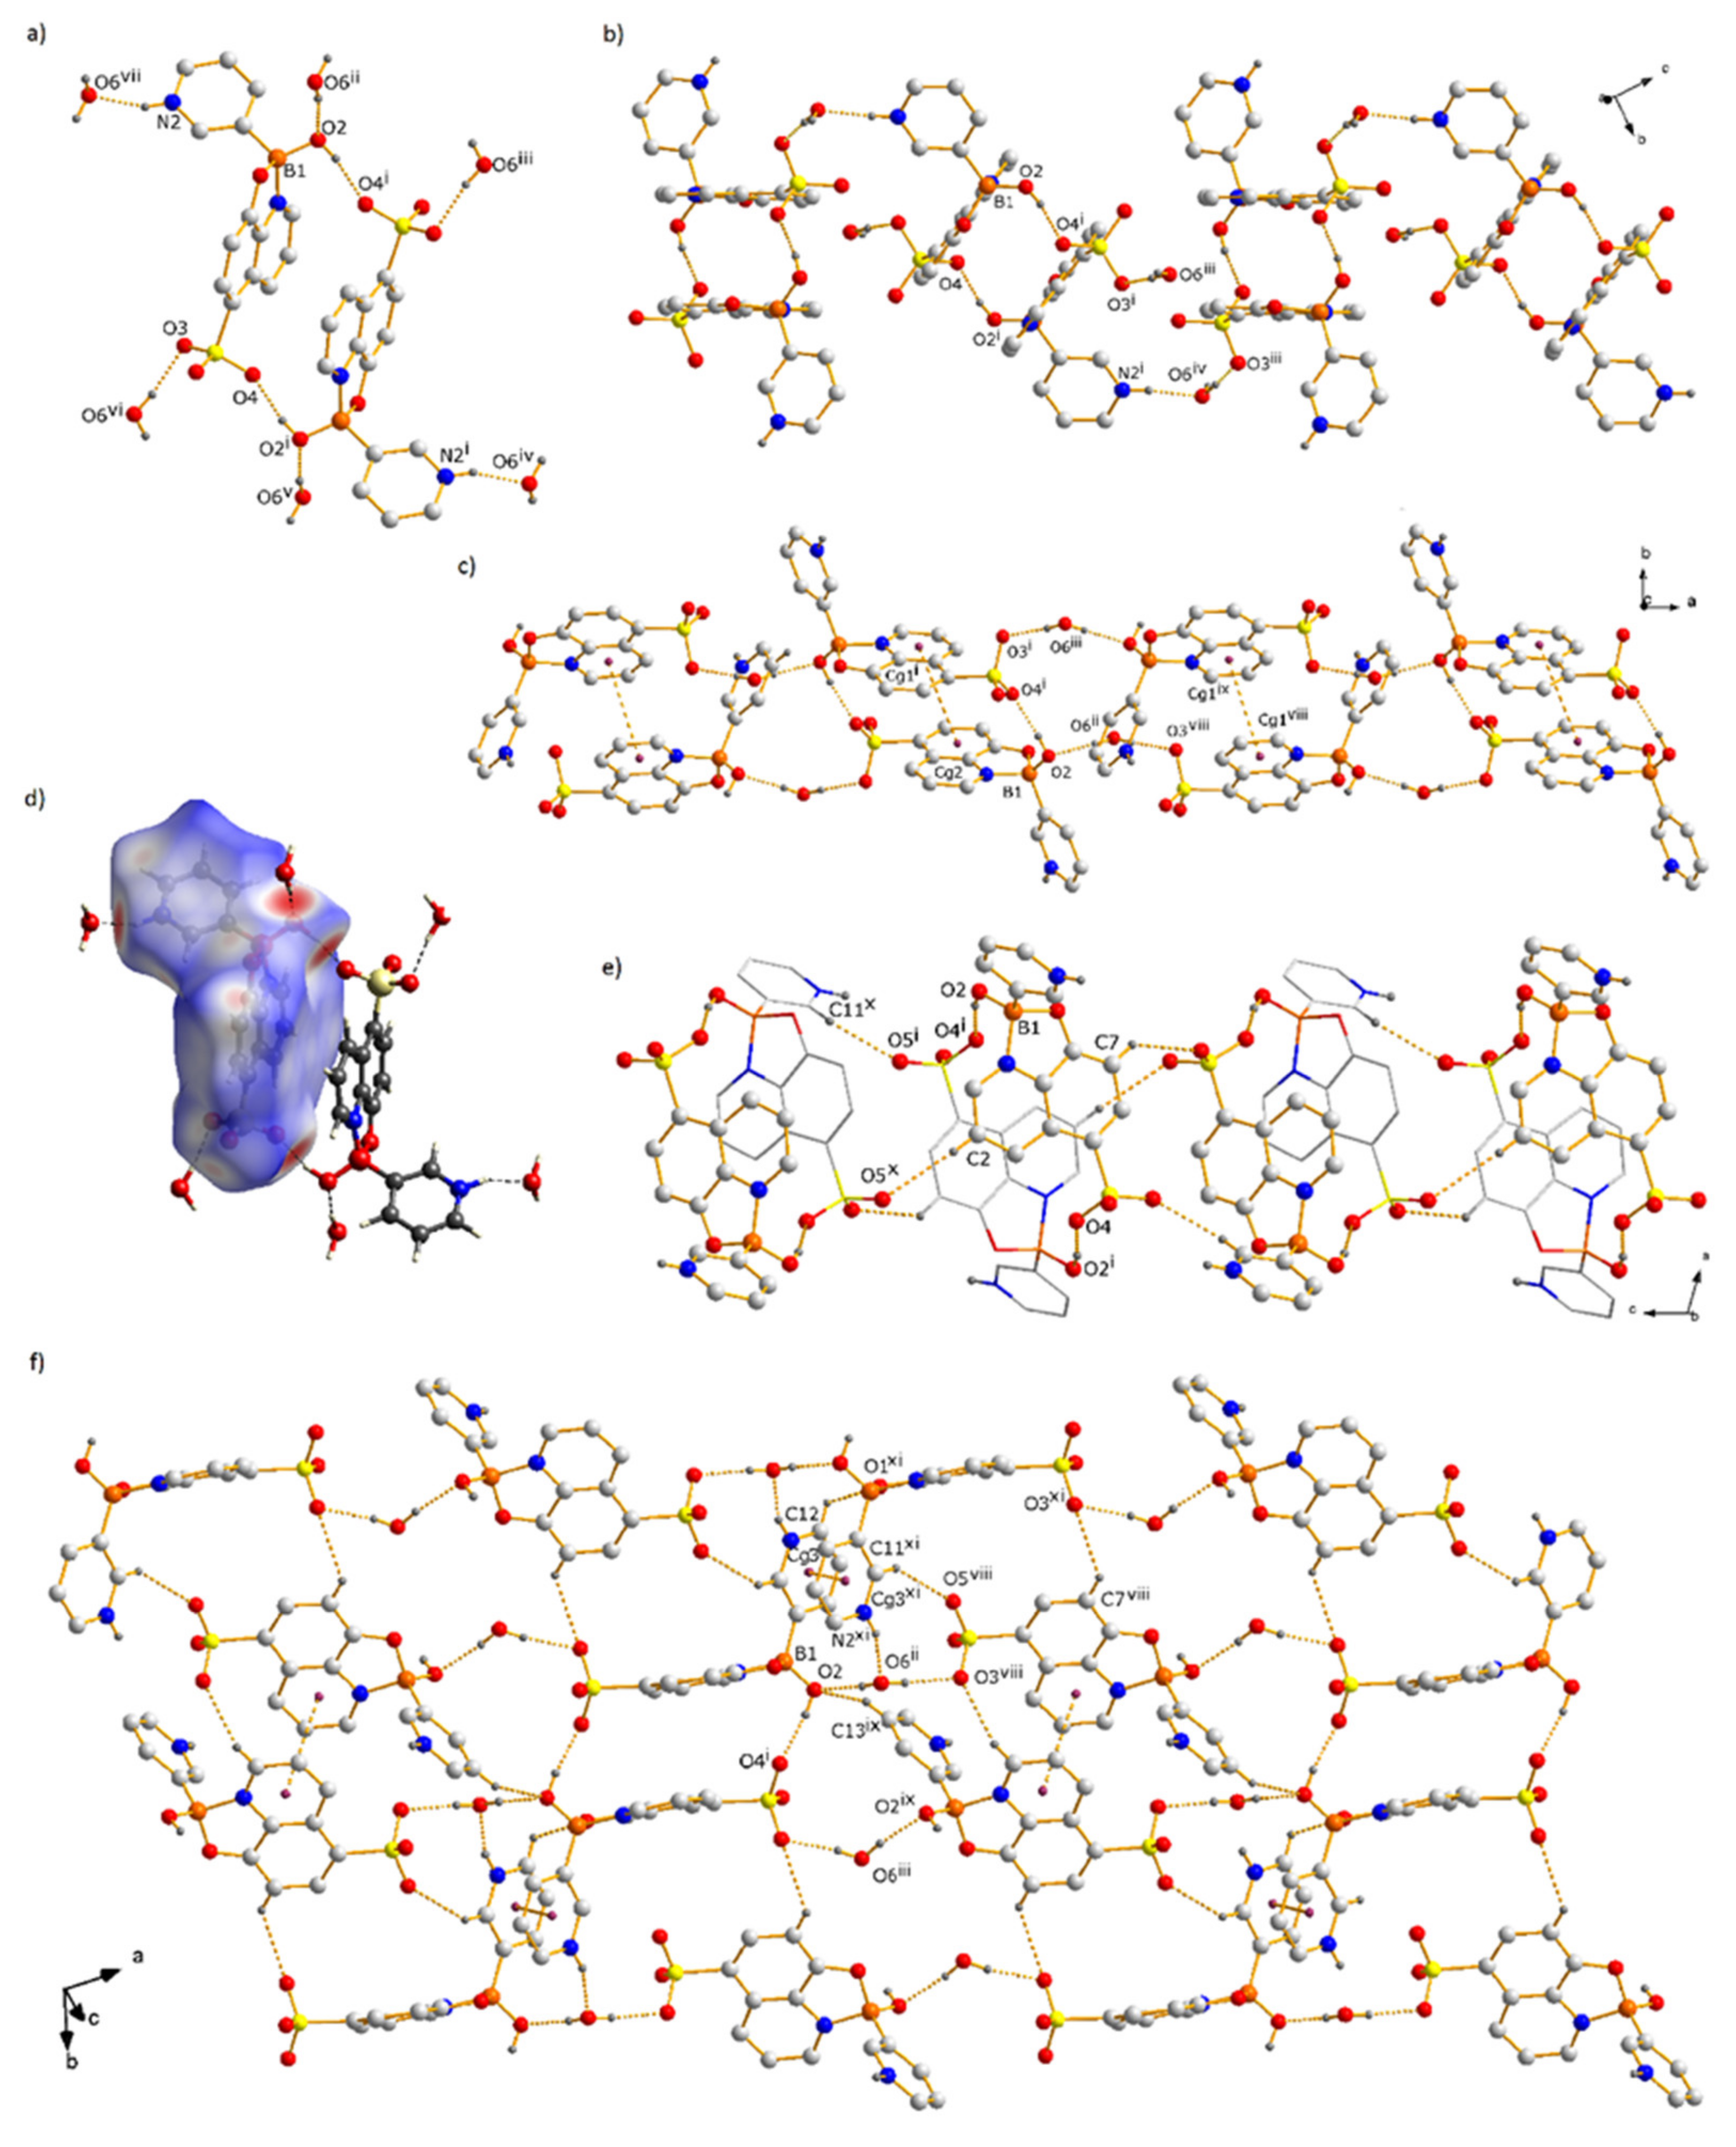
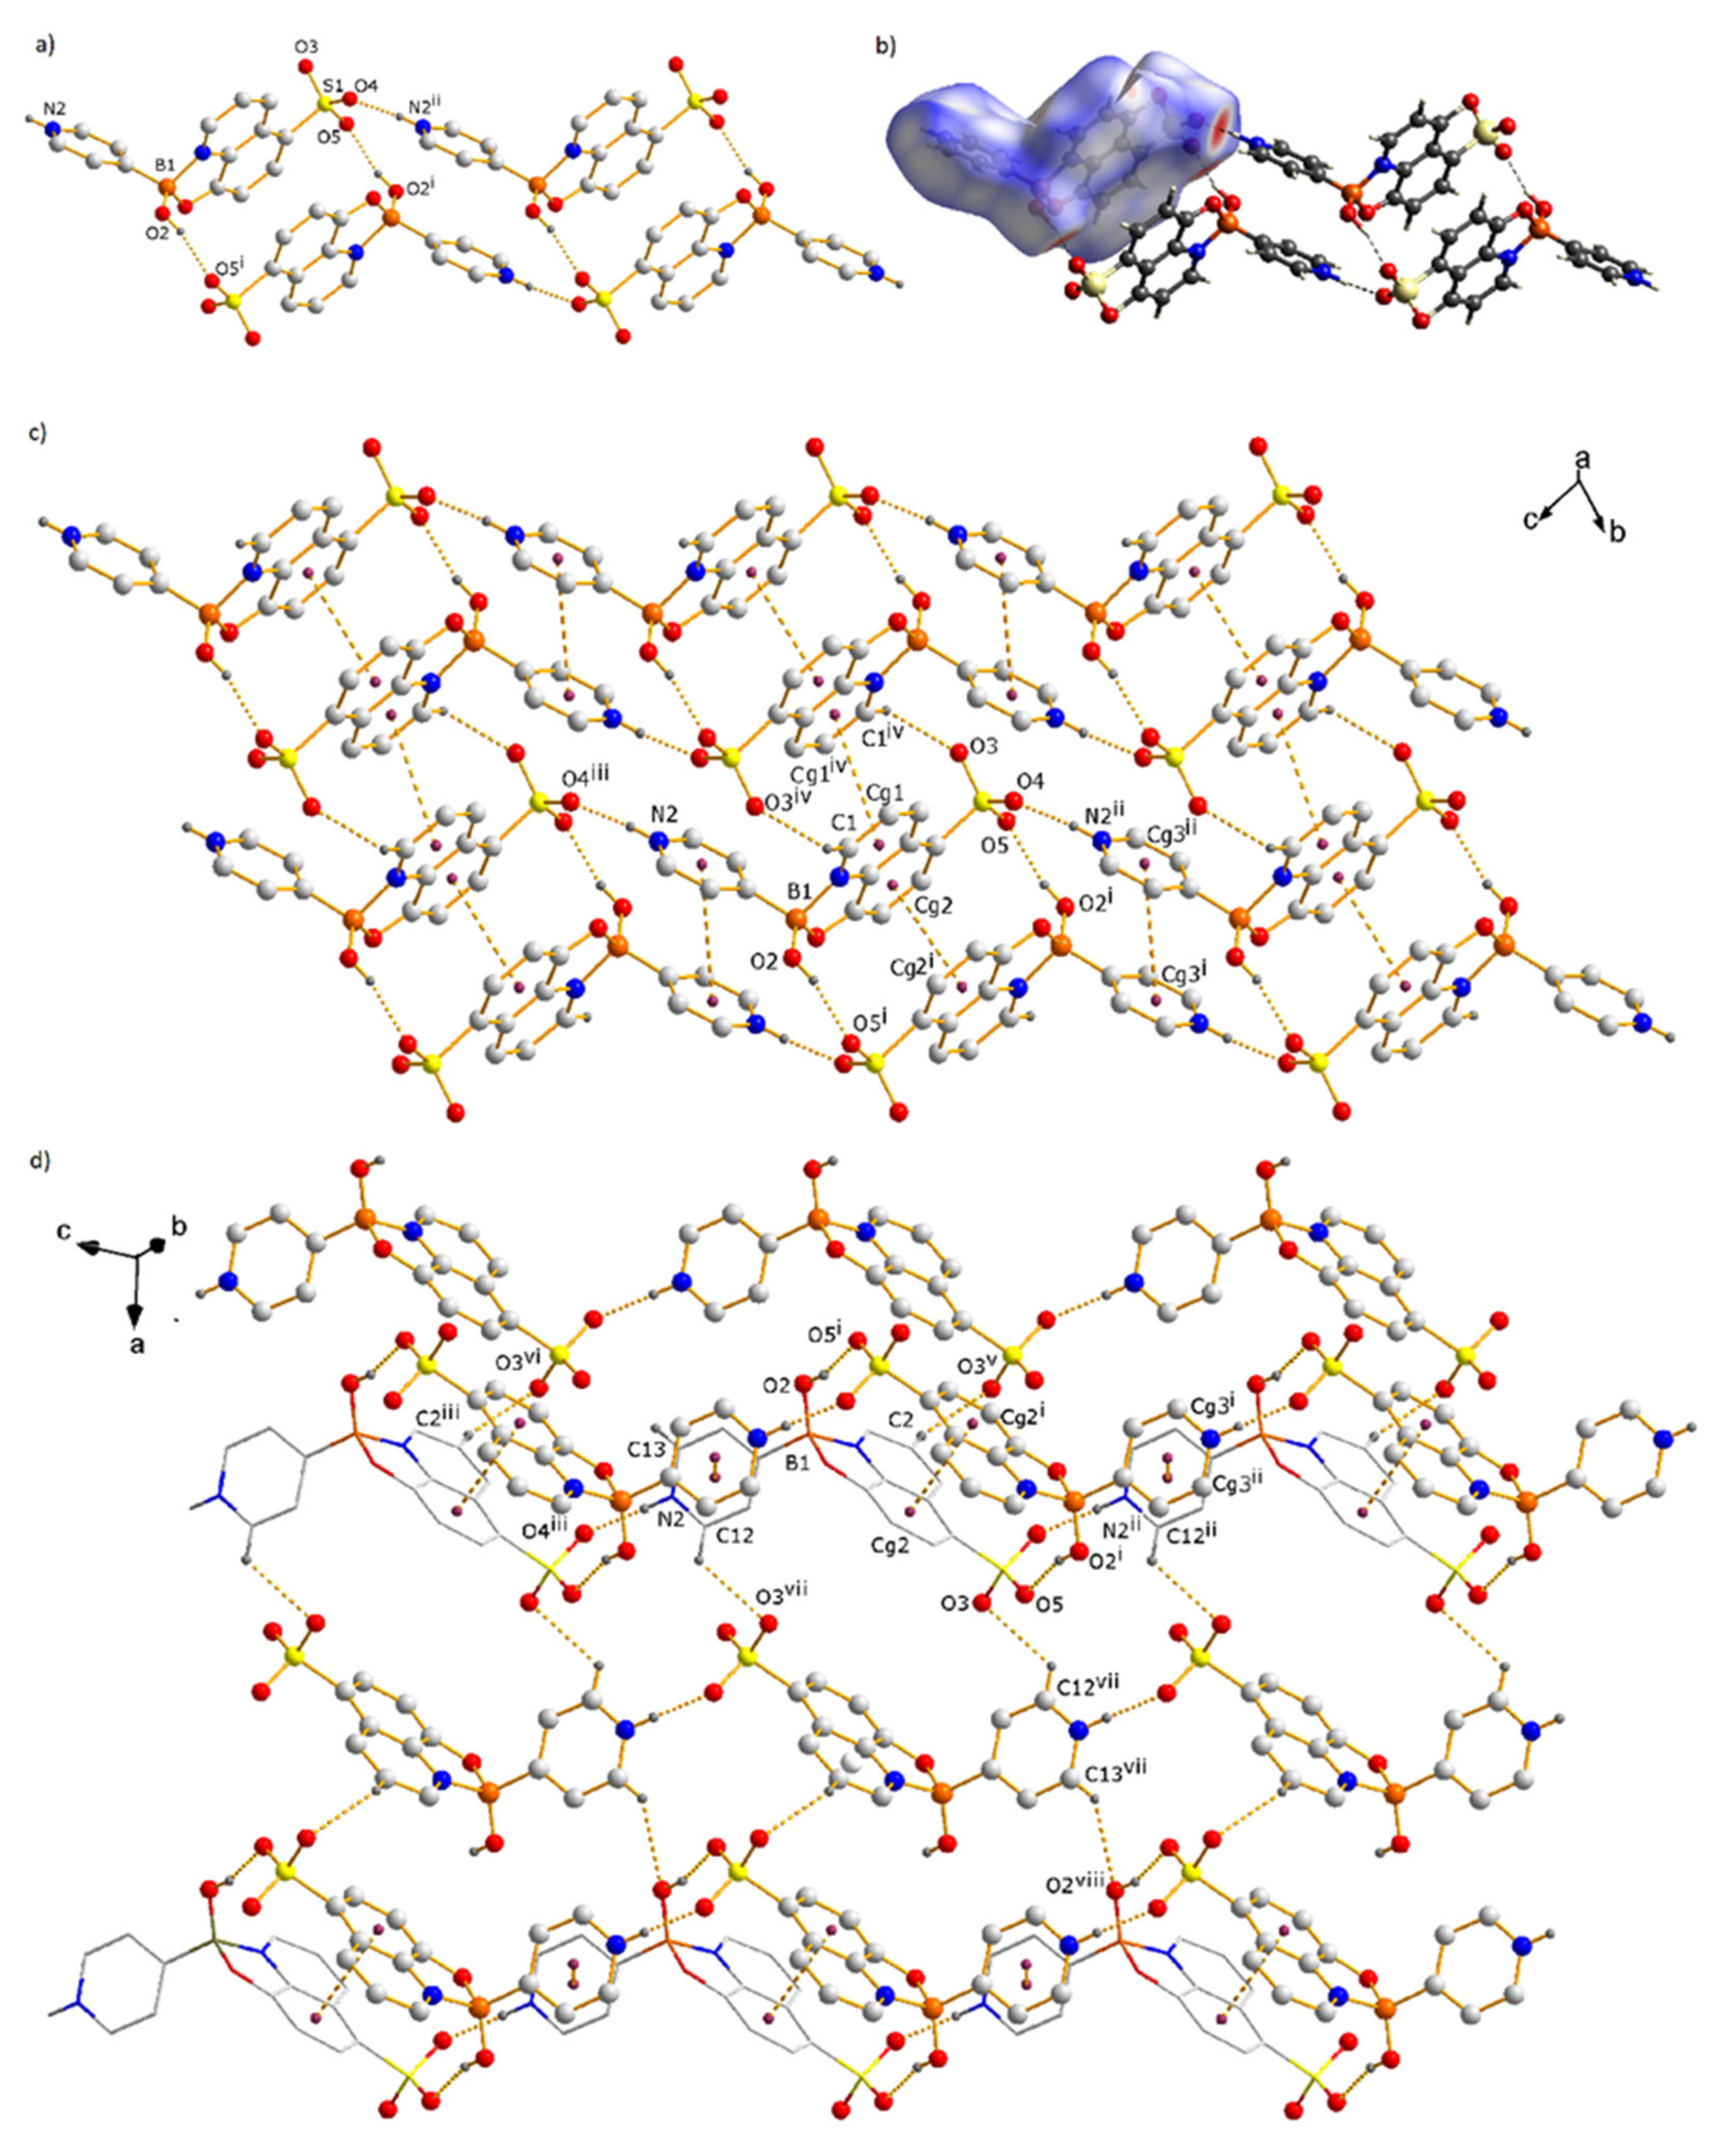
3.1. Molecular and Supramolecular Structures of 1 and 2

Crystals of 1 suitable for single-crystal X-ray diffraction analysis were grown upon cooling a EtOH/H2O/DMF (15:4:1, v/v/v) solution to room temperature. Compound 2 was crystallized by slow solvent evaporation of a solution in EtOH/H2O/DMF (15:4:1, v/v/v). The compounds crystallized as monoboron complexes in the monoclinic and triclinic space groups P21/c and P-1, respectively. The asymmetric unit of 1 contains the boron complex and a water molecule; meanwhile, the asymmetric unit of 2 is occupied only by the boron complex, without solvent. Figure 1 and Figure 2 show the molecular structures of 1 and 2 with atom labeling. Tables S1–S4 contain selected interatomic distances and bond angles. Geometries for intermolecular hydrogen-bonding interactions and other contacts are given in Table S5 (in Supplementary Materials).
The solid-state structures of the title compounds resemble each other in several aspects but exhibit also significant differences. In both boronic ester compounds, a B←N coordination bond is present giving place to the formation of four-coordinate complexes, in which a five-membered C2BNO ring is joined to the quinoline skeleton. The B←N distances are similar [1.6422(19)] and 1.665(3) Å for 1 and 2, respectively] and in good agreement with the B←N distances (1.568–1.681 Å) reported previously for related boron complexes [33,53]. The covalent B-O bond lengths of the B-O(H) bonds [1.4121(18) Å in 1; 1.400(2) Å in 2] are significantly shorter than the B-Oquin bonds [1.5176(18) Å in 1; 1.516(2) Å in 2], which is attributed to ring strain in the five-membered chelate ring. The B-C bond lengths are 1.614(2) Å in 1 and 1.621(3) Å in 2, respectively, similar to compounds based on ortho-phenylenediboronic acid and 8-hydroxyquinoline [18,54]. The bond angles around the boron atoms correspond to distorted tetrahedral coordination geometries having values ranging from 97.69(13) to 114.78(16)°. The variation of the bond angles around the boron atoms induces significant distortion from ideal tetrahedral geometry (τ4 = 0.95 for 1 y τ4 = 0.94 for 2) [55], which is seen also from the tetrahedral character values (THC) [56] of 75.8% and 71.7 % for compounds 1 and 2, respectively (see, Tables S6 and S7, in Supplementary Materials).
The dihedral angle between the aromatic quinoline and pyridinium ring planes is 78.97° for 1 and 76.62° for 2. Some representative torsion angles along the B←N and B−O bonds are C8-O1-B1-C10 [110.45(12)° in 1 and 107.51(16)° in 2], C9-N1-B1-C10 [−109.80(12)° in 1 and −109.70(16)° in 2] and C9-N1-B1-O2 [125.99(12)° in 1 and 125.75(17)° in 2]. The boron atoms in crystals of 1 and 2 deviate from the quinoline mean planes by 0.118 Å and 0.076 Å, respectively. Because of the tetrahedral geometry, in both compounds the pyridinium and hydroxyl groups are located above and below the boron-bridged π-ring plane of the quinolato moieties.
The proton transfer from the sulfonic-acid group in the starting ligand 8HQSA to the pyridyl substituent in complexes 1 and 2 was evidenced by difference Fourier map analysis during the refinement of the crystal structures, and is also confirmed by analysis of the S−O bond lengths in the sulfonate groups ranging from 1.4469(11) to 1.4630(11) Å, exhibiting a difference of less than 0.02 Å (see, Tables S1 and S3, in Supplementary Materials) [57,58]. The sulfur atoms have distorted tetrahedral geometries with mean O−S−O and C−S−O bond angles of 112.9° and 105.8°, respectively. Previously, it was established that C−N−C bond angles in pyridine fragments in the range 117–118° indicate the presence of neutral pyridyl groups, whereas pyridinium ions exhibit a slightly obtuse angle within 120–122° [59,60]. In compounds 1 and 2, the C11-N2-C12 and C12-N2-C13 bond angles are 122.64(12)° and 122.36(17)°, respectively, indicating (Py)N+-H groups (see, Tables S2 and S4, in Supplementary Materials).
Fragments of the extended solid-state structures of 1 and 2 are shown in Figure 3 and Figure 4. In both compounds, the hydroxyl group of the boronic ester complexes forms double-bridged homodimeric units through (B)O−H⋯O(S) hydrogen bonds among the boron hydroxyl group and an oxygen atom of the sulfonate group (motif A, Scheme 2, Figure 3a). According to the graph-set annotation established by Etter, [61] the cyclic motif is described as R22(20). The O⋯O distances of 2.646(1) and 2.785(2) Å in 1 and 2, respectively, are typical of strong O−H⋯O hydrogen-bonding interactions (Table S5, in Supplementary Materials) [62,63]. Interestingly, motif A also exhibits π⋯π [64,65] interactions among the antiparallel-oriented quinoline residues, which in compound 1 accomplish the entire quinolone skeleton, while in compound 2 only half the quinolone moieties (atoms C4−C9) are involved. The centroid⋯centroid distances are 4.112 Å in 1 (Cg1⋯Cg2, see Table S5 and 3.529 Å in 2 (Cg2⋯Cg2, see Table S5). To the best of our knowledge, so far there are no reports on molecular organoboron crystals with this synthon.
In the molecular packing of 1, the homodimers (motif A, Scheme 2) are interconnected by N+−H⋯Ow and Ow−H⋯O(S) [66,67] hydrogen bonds with the crystal lattice water molecules (N2⋯O6 = 2.676(2) Å and O6⋯O3 = 2.719(1) Å, Table S5), forming infinite 1D hydrogen-bonded chains parallel to the bc plane (Figure 3b). Along a, adjacent 1D chains are linked further through Ow−H⋯O(H)B hydrogen bonds (O6⋯O2 = 2.722(1) Å, Table S5) to give an overall 3D hydrogen-bonded network. This network comprises 40-membered hydrogen-bonded macrocycles involving six molecules of the boron complex and four water molecules (Figure 3c), corresponding to the graph set R86(40) (motif B, Scheme 2).
The network is further stabilized by a series of C−H⋯O [68] hydrogen bonds and additional π⋯π interactions among adjacent antiparallel-oriented quinoline (Cg1⋯Cg1 = 3.735 Å) and pyridinium moieties (Cg3⋯Cg3 = 3.920 Å), as illustrated in Figure 3e,f and Table S5. The π⋯π contacts established among the quinoline units generate infinite π–stacking long b (vide infra). In the crystal structure of compound 2, the homodimers (motif A, O2⋯O5 = 2.785(2) Å, Scheme 2, Table S5) are interconnected directly, without the presence of water molecules, by strong single-bridged N+–H⋯O(S) [66,69] hydrogen bonds formed between the N+–H hydrogen of the pyridinium ring and oxygen atom O4 of the sulfonate group and [N2⋯O4 = 2.695(2) Å] to give 1D double chains (Figure 4a; motif C, Scheme 2). These strands are linked further through C−H⋯O [68] contacts and infinite π-stacking interactions among adjacent quinoline rings (Cg1⋯Cg1 = 3.650 Å; Cg2⋯Cg2 = 3.529 Å) to yield in first instance the 2D network running parallel to the bc plane shown in Figure 4c. Along a, these layers are connected by additional C–H⋯O hydrogen bonds and π-interactions among antiparallel-oriented pyridinium moieties (Cg3⋯Cg3 = 4.048 Å) to accomplish the 3D network (Figure 4d, Table S5).

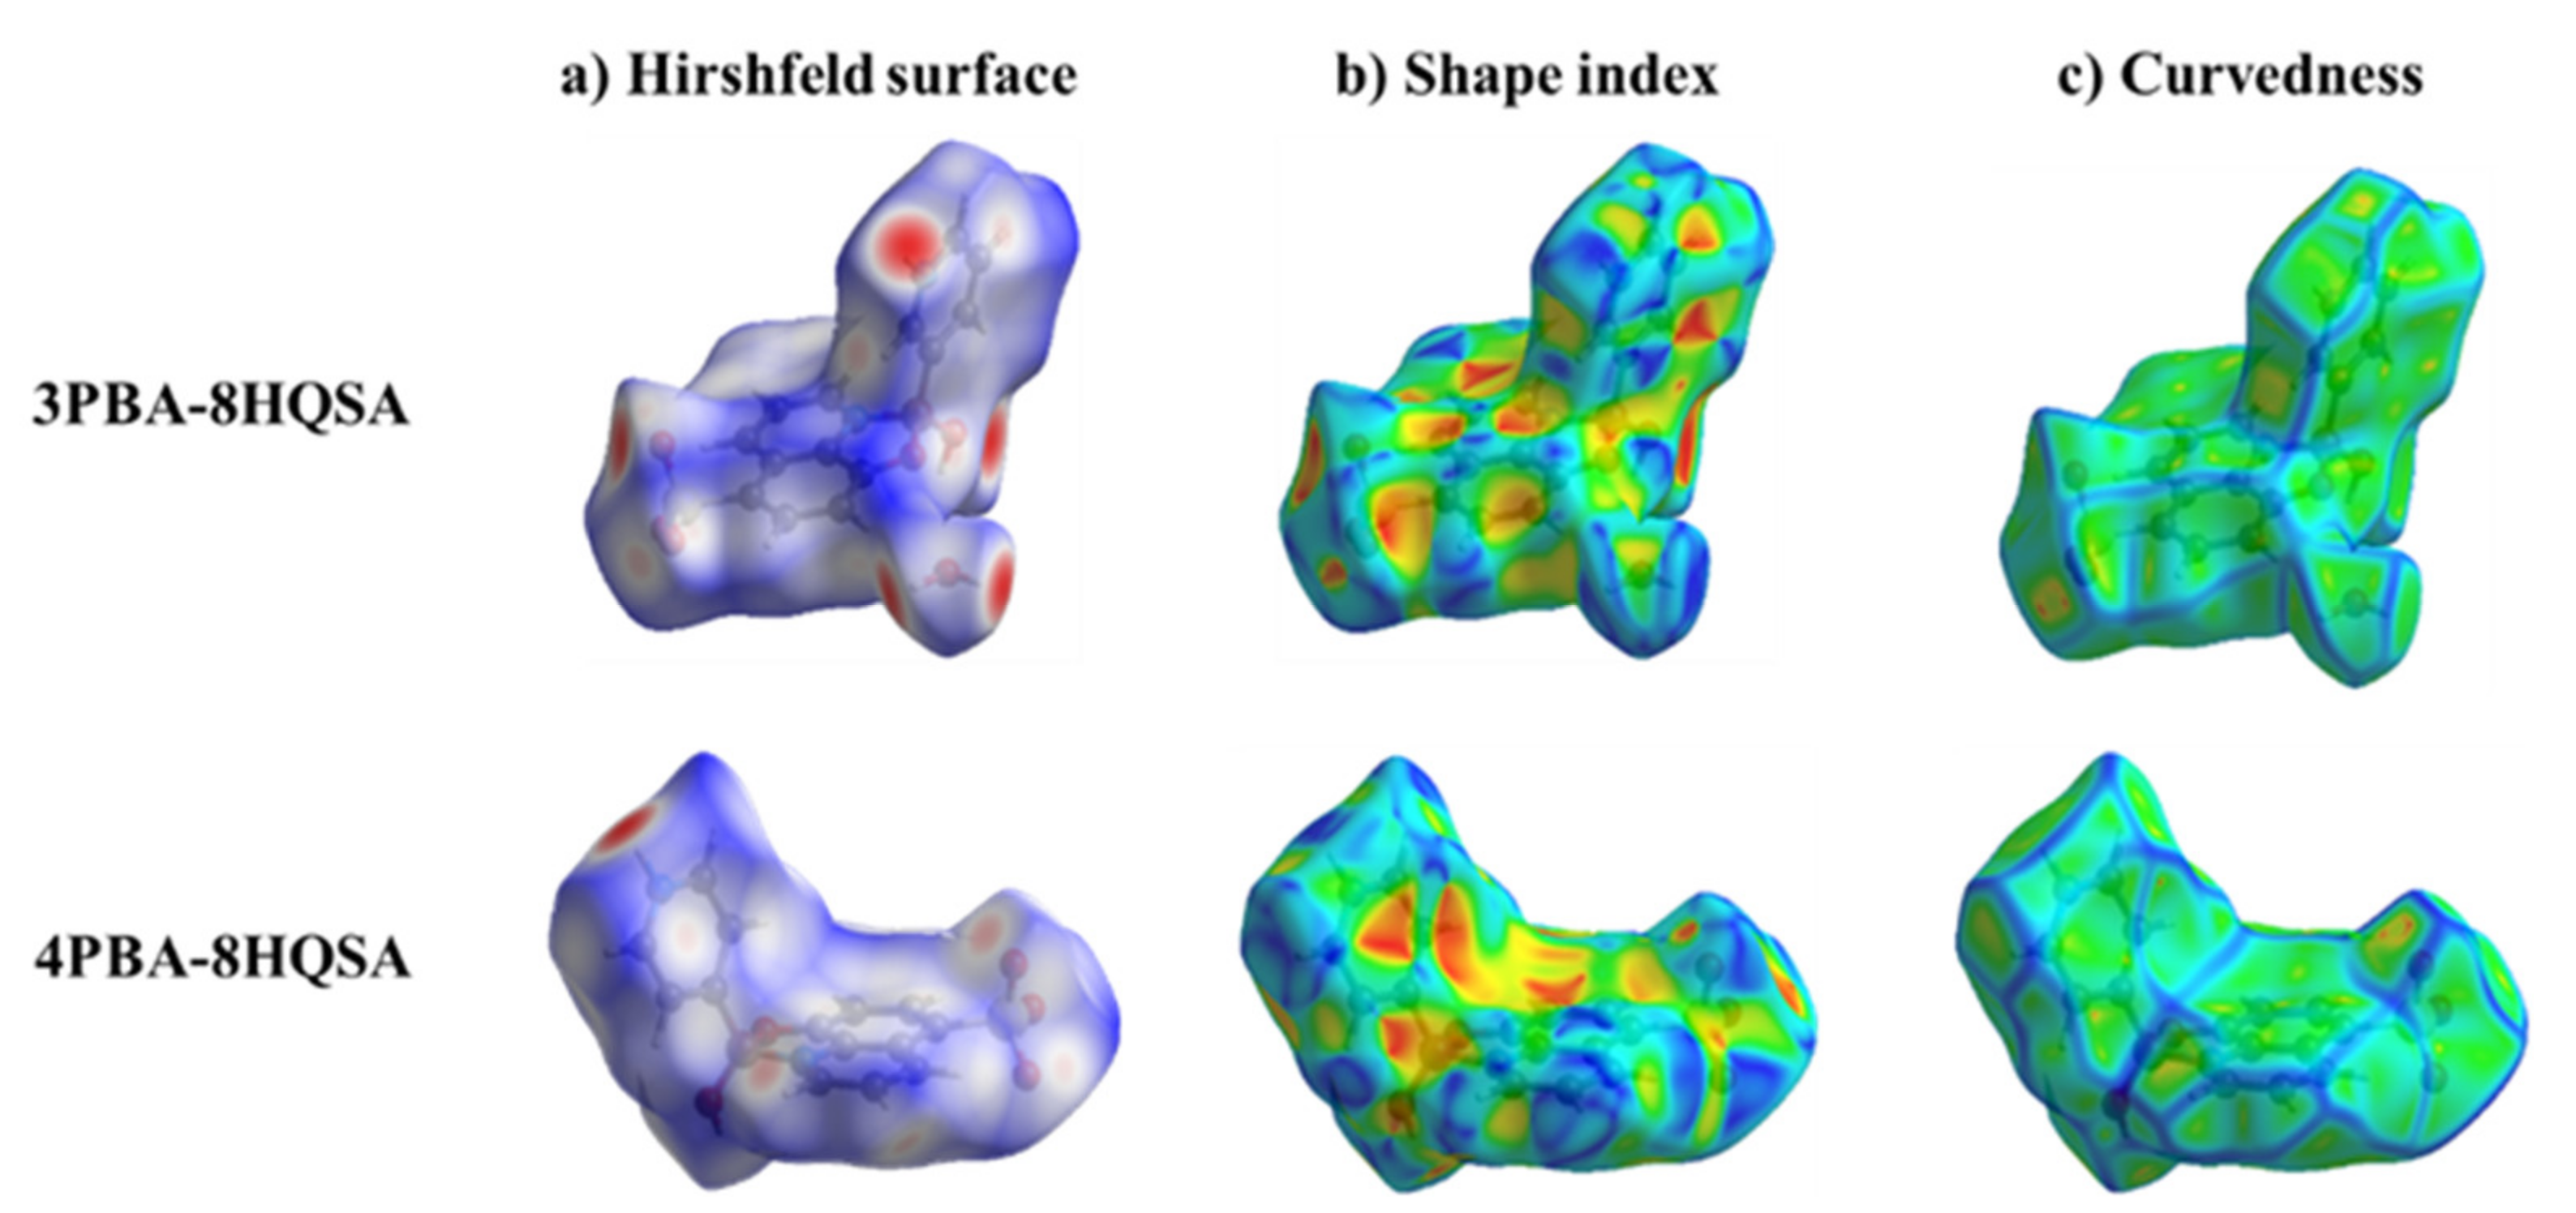
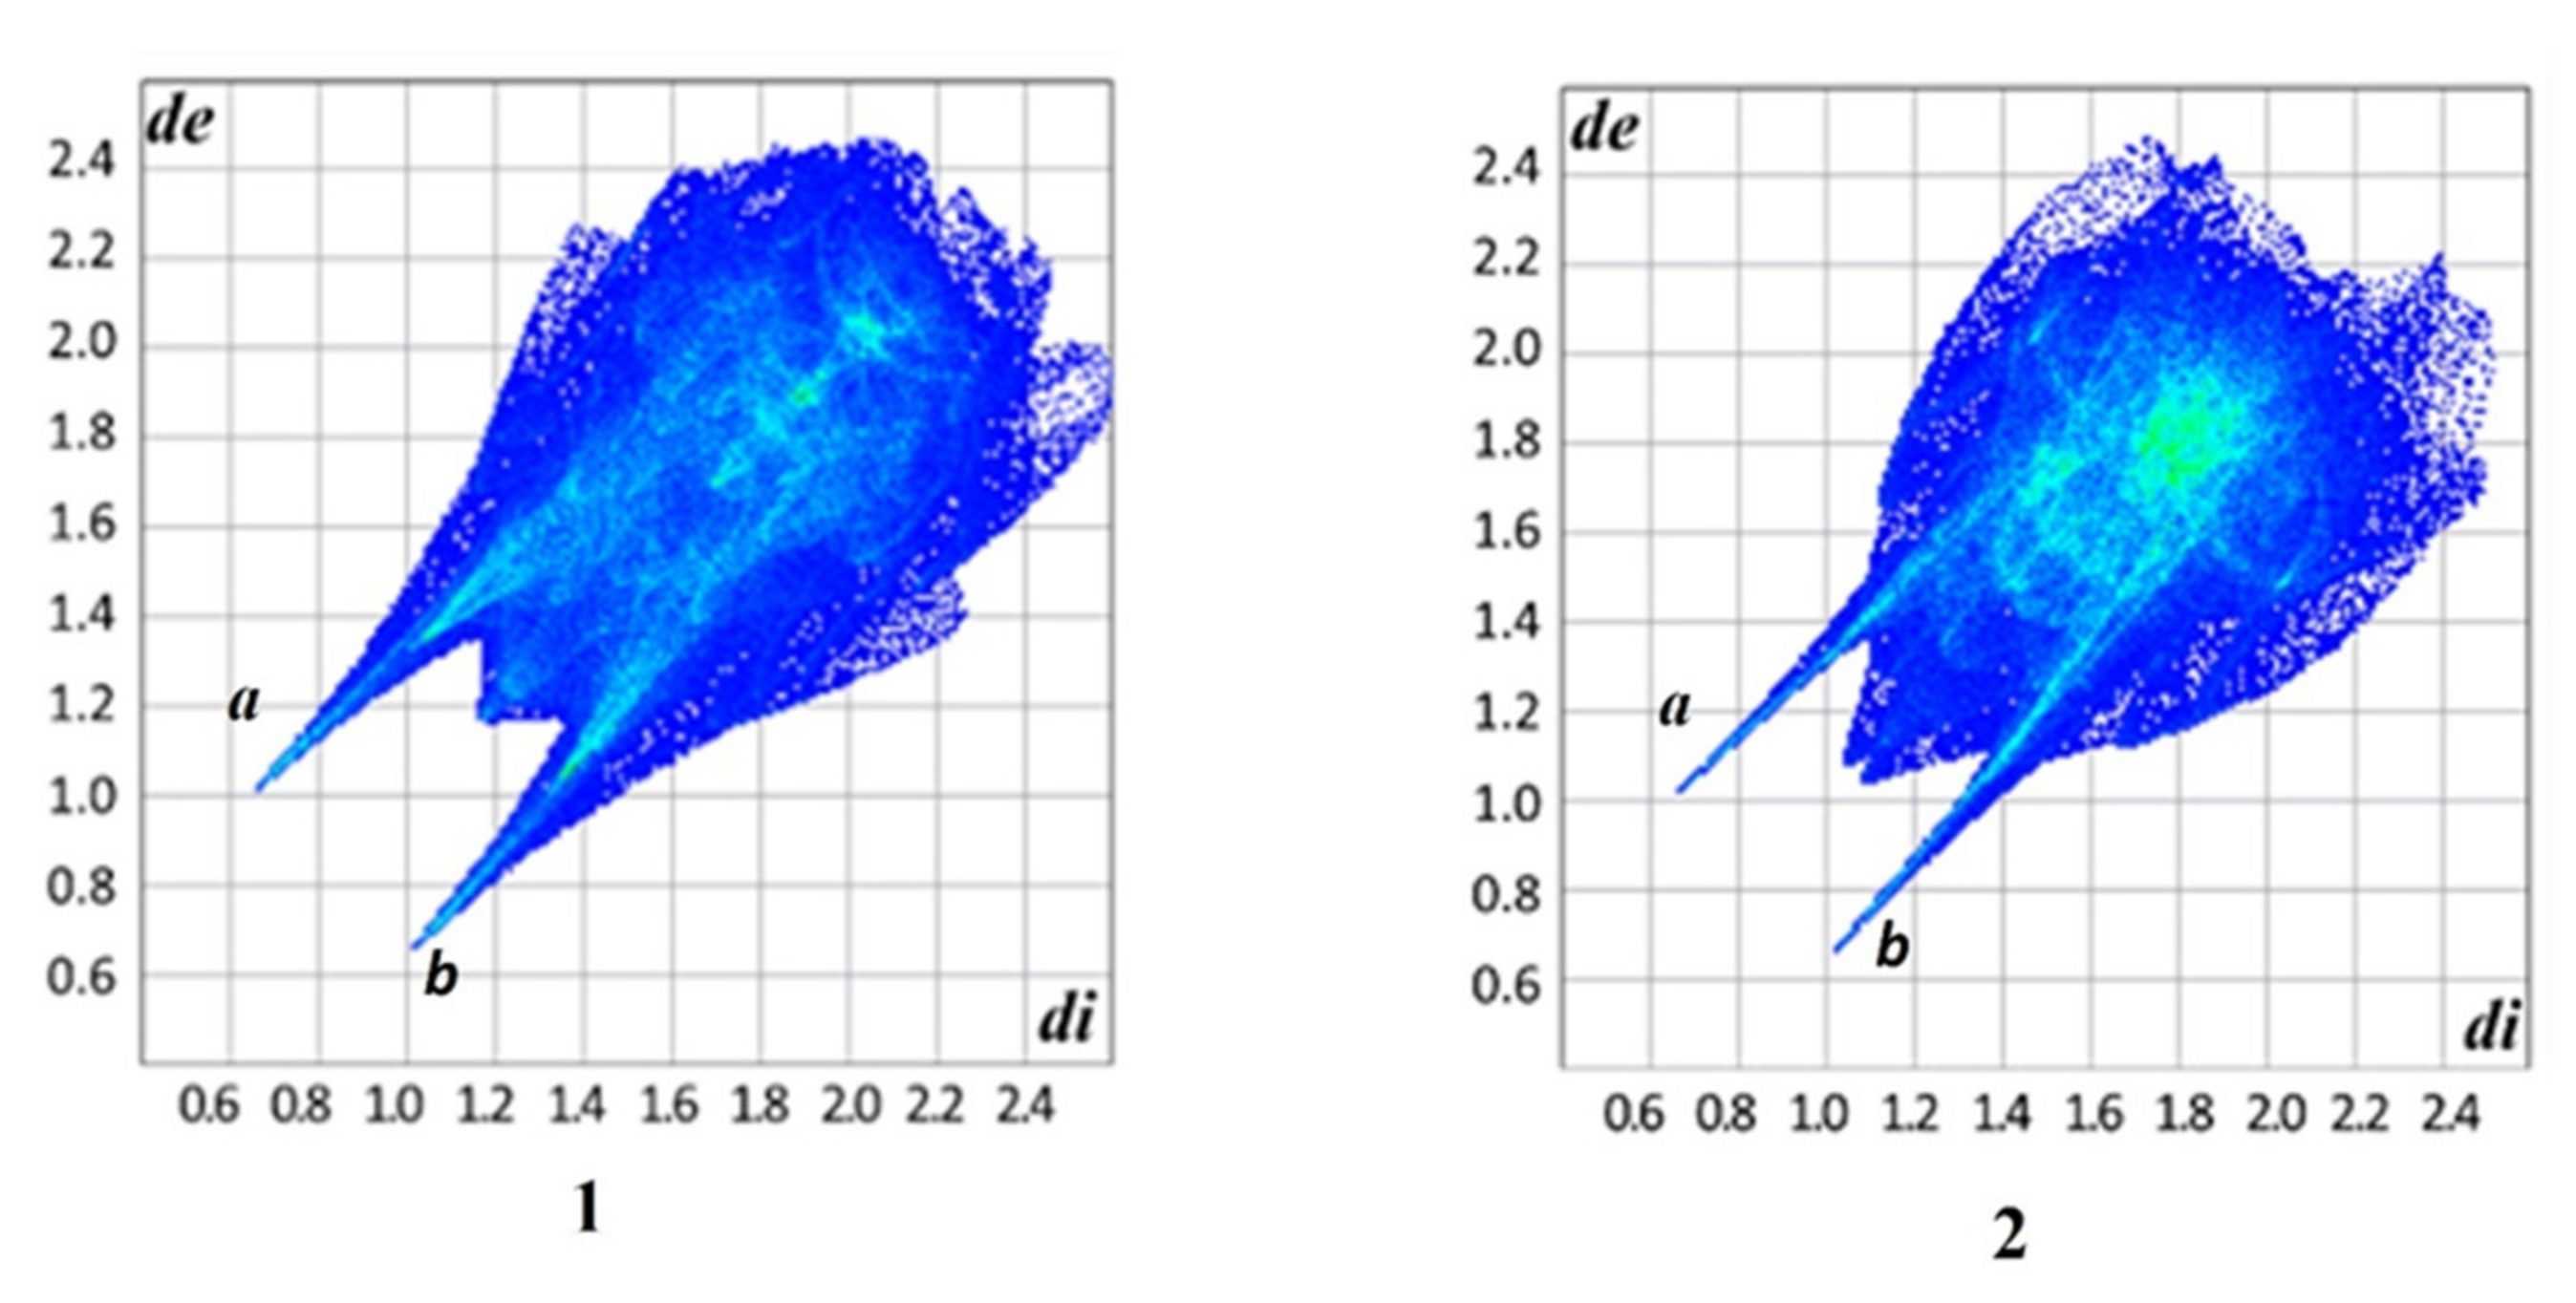
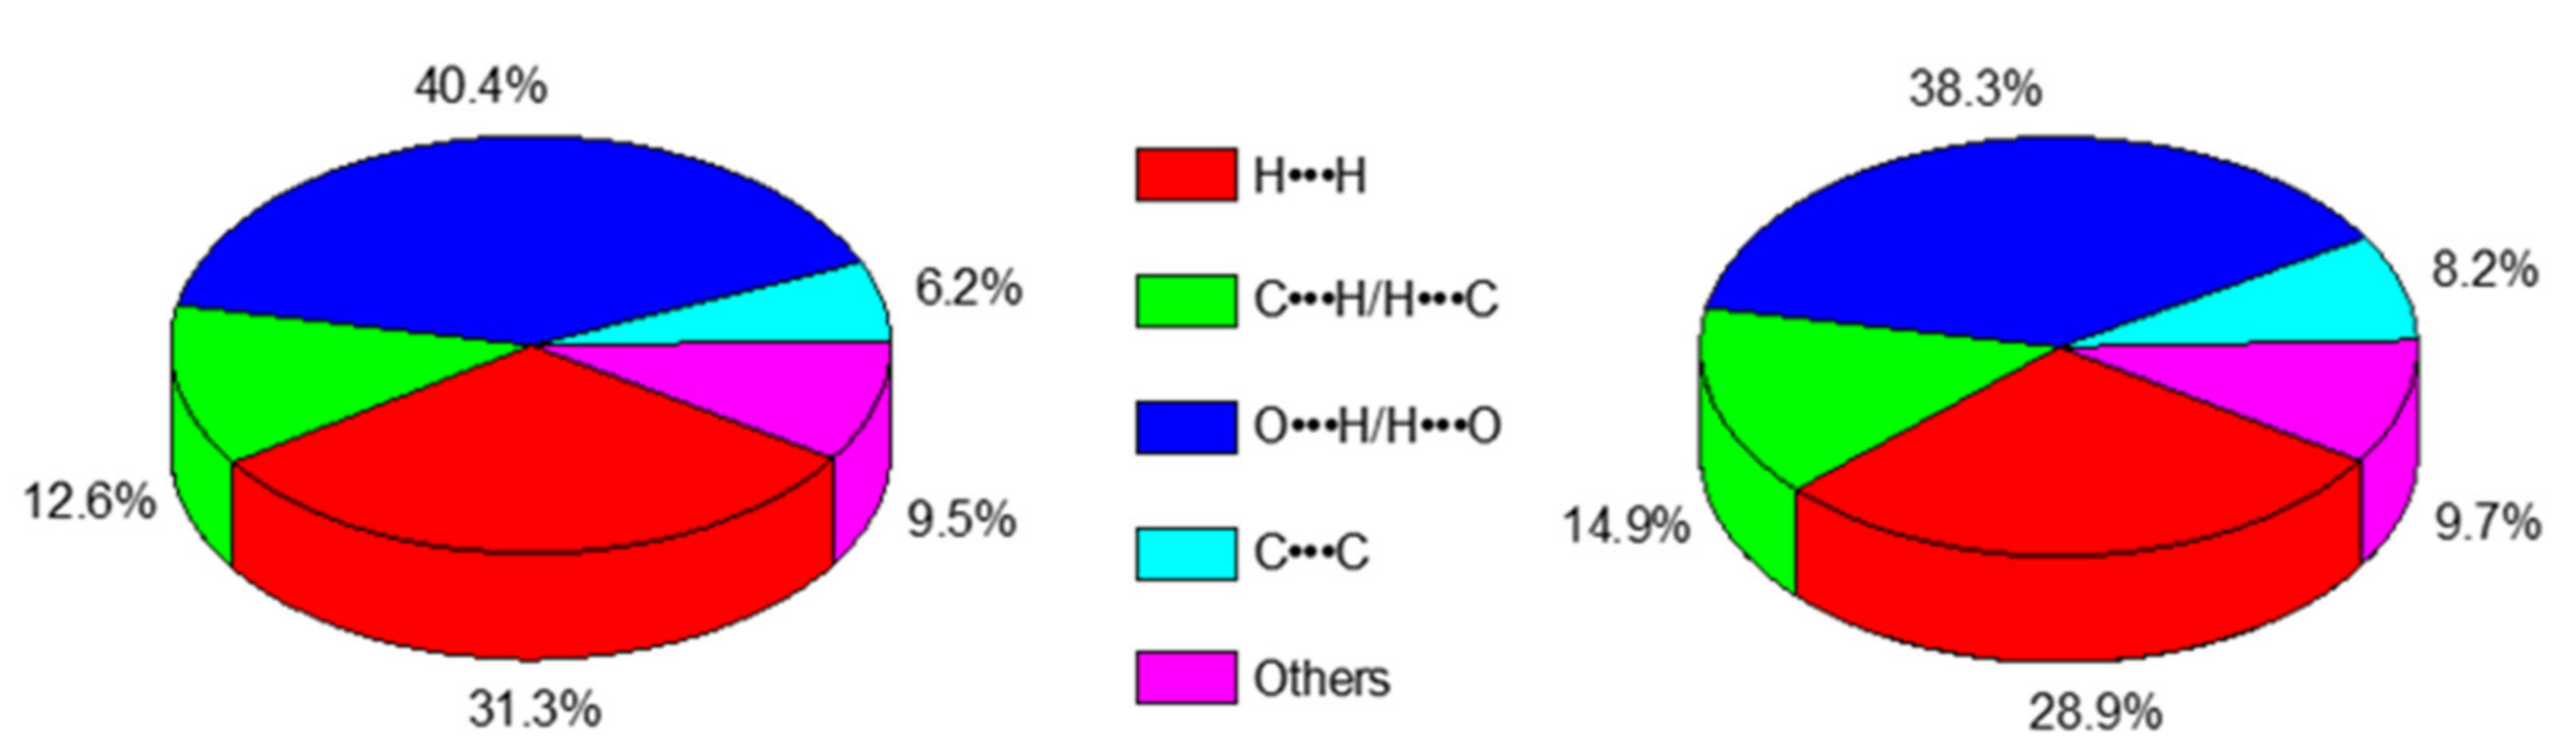
3.2. Analysis of the Hirshfeld Surface

To accomplish the description of the supramolecular connectivity in the crystal structures of 1 and 2, Hirshfeld surface analyses were realized. Maps of the Hirshfeld surface, shape index, and curvedness of the complexes are shown in Figure 5. In the Hirshfeld surface maps, areas marked in blue reveal the longest contacts, while the depressions in red color are indicative of the zones of strong donor–acceptor interactions [70]. For both compounds, the most intense stains are observed close to the nitrogen and oxygen atoms contributing to the formation of the N+−H∙∙∙O/O and O−H∙∙∙O/O type interactions in the motifs illustrated in Scheme 2 (motif A). The white areas depicted at either side of the molecular structures in the Hirshfeld surface are originated from the aromatic rings and are footmarks of π⋯π interactions [71,72].
The shape index is a more sensitive method to evidence subtle changes of the electron density surrounding the molecules. Pairs of red and blue triangles on planar sections in the shape index map are typical for π⋯π interaction sites (C∙∙∙C contacts) in the supramolecular structure and the percentage contributions can be extracted by fingerprint analysis (Table S8, in Supplementary Materials) [73,74]. For compound 2, the percentage contribution of the C∙∙∙C contacts (8.2%) is higher compared to 1 (6.2%). The presence of various red and blue triangles in the shape index of 1 and 2 indicates diverse π-π aggregations in the crystal structures (Figure 5), as corroborated in the fragments shown in Figure 3 and Figure 4. In the curvedness diagrams given in Figure 5c, the green patches with blue outlines represent interactions with adjacent molecules. Curvedness maps are used to identify packaging and the provisions are flat where π-stacking occurs [70,71,72,73,74]. Boronic esters 1 and 2 both exhibit blue coloration in the regions of the aromatic quinoline and pyridine rings, indicating that the three-dimensional networks are developed mainly by π⋯π interactions aside from C−H∙∙∙O contacts (vide infra).
The hydrogen bonds in complexes 1 and 2 are represented in the 2D fingerprint plots shown in Figure 6. The fingerprints around 1.8 (di, de) vary from a blue tone to a slightly green color and are associated with the C∙∙∙C contacts from the π⋯π interactions [42,75,76,77]. The greenish coloration in the central part of the fingerprints corresponds to the stronger π⋯π contributions in the solid-state structures, illustrating that π⋯π interactions are more dominant in 2, as corroborated by the overall shorter centroid–centroid distances of the π⋯π contacts (Table S5, in Supplementary Materials). The contributions of the O−H∙∙∙O/O and N+−H∙∙∙O/O hydrogen bonds appear as well-defined elongated pegs in the fingerprint plots and are marked with labels a and b. The more dispersed zones in blue color correspond mainly to the C−H⋯O contacts. Figure 7 and Table S8 provide an overview of the percentage contributions of the above-mentioned intermolecular interactions and short contacts. The largest contributions correspond to the diverse O⋯H/H⋯O (38.3–40.4%) hydrogen bonds, but also to van der Waals contacts (H⋯H, 28.9–31.3%). π-interactions are less abundant, with contributions of 12.6–14.9% for C⋯H/H⋯C and 6.2–8.2% for C⋯C contacts.

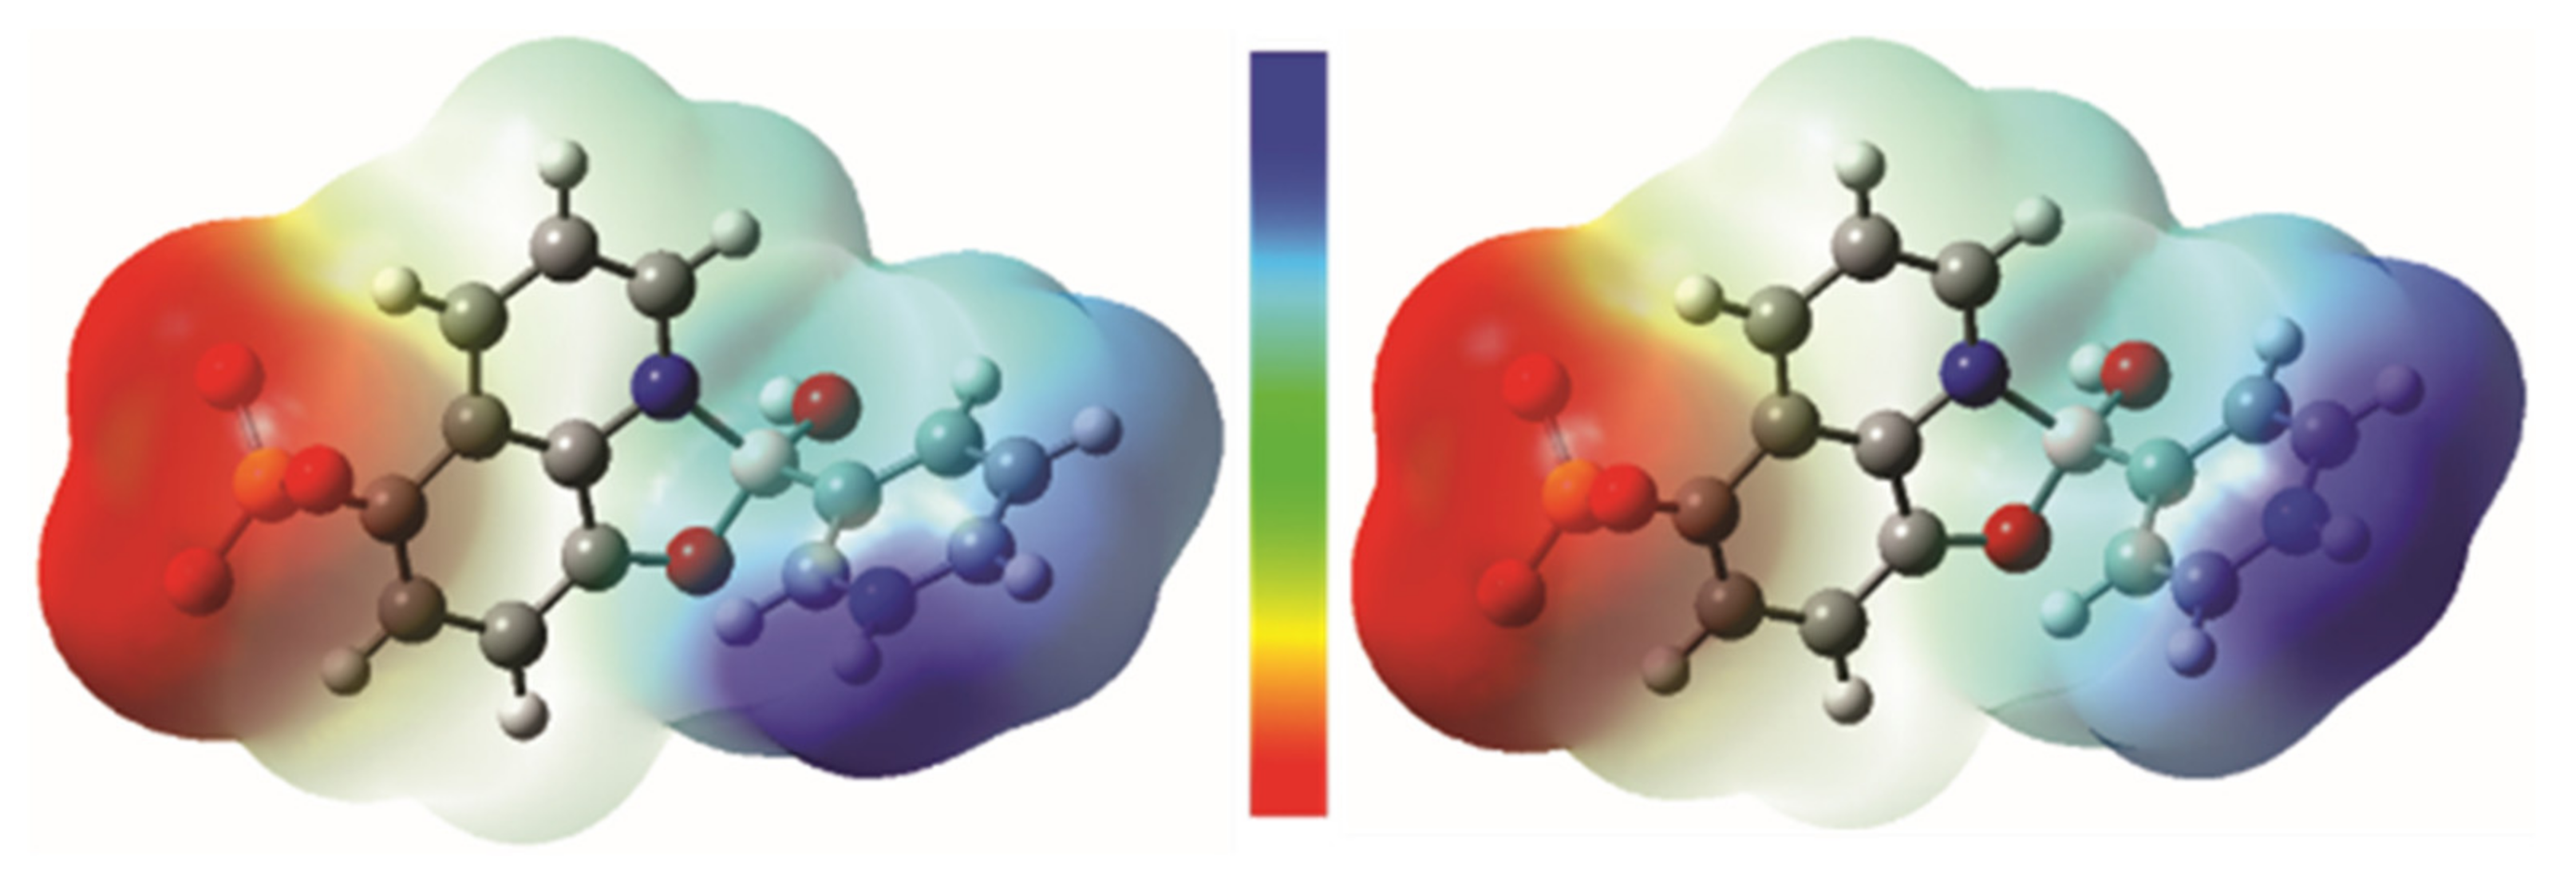
3.3. Analysis of the Molecular Electrostatic Potential Maps

Molecular electrostatic potential (MEP) mapping enables to visualize the distribution of the electron density in molecular structures and provides a very useful tool for the location of electrophilic and nucleophilic reaction sites, as well as the identification of donors and acceptors for hydrogen-bonding interactions [78] MEP scans can be generated by superimposing the van der Waals radii of all atoms in the molecule [79].
The electrostatic potential maps on the isodensity surface of the organoboron complexes 1 and 2 were evaluated based on the optimized geometries obtained by DFT calculations at the level M06/6-31G(d) shown in Figure 8, where the red and yellow colors indicate the negative regions related to electrophilic reactivity sites, while the blue colors indicate the positive regions suitable for nucleophilic reactivity. Both compounds exhibit sites susceptible to electrophilic attack, in the region of the sulfonate group (see red shades). Aside from the oxygen atoms of the SO3 groups, the oxygen atoms attached to the boron atoms are the most electronegative sites. The most electropositive hydrogen atoms are the pyridinium (N+−H) and the O−H hydrogen atoms (see blue shades). The MEP diagrams of 1 and 2 are in good agreement with the intermolecular N+−H⋯O/O, O−H⋯O/O and C−H⋯O hydrogen bonds determined for 1 and 2 based on the single-crystal X-ray diffraction and Hirshfeld surface analyses.

3.4. IR and NMR Spectroscopic Analysis

Compounds 1 and 2 were also characterized by IR spectroscopy in the range 4000–500 cm−1 using the KBr pellet technique. The IR spectra are shown in comparison to the starting materials (3PBA, 4PBA and 8HQSA) in Figures S1 and S2 and a summary of the most relevant IR bands is given in Table S9 (in Supplementary Materials). The boron complexes gave characteristic bands at high wavenumbers at approximately 3400 and 3250 cm−1, which are attributed mostly to vibrations resulting from O–H and N–H stretching involving the B(OH) and pyN+−H groups as well as the water molecules in 1. Further, there is a large number of less intense bands in the range 3100–2500 cm−1. For comparison, the pyridineboronic-acid starting materials exhibit only a characteristic and a relatively intense single band at 3300–3400 cm−1 (3PBA, 3430 cm−1; 4PBA, 3318 cm−1). The IR spectra of 1 and 2 show C = N stretching bands at 1622 and 1620 cm−1, respectively, which are shifted to higher wavenumbers with respect to uncoordinated 8HQSA = 1605 cm−1) owing to the formation of the N→B dative bond (see Figures S1 and S2). The bands around 1500 cm−1 are typical for C=N vibrations of pyridinium groups and C=C stretching vibrations of aromatic rings. Boronic ester formation is confirmed by typical bands at ~1350, ~1090, and 1220–1240 cm−1, for B−O, B−C, and C−O stretching modes, respectively [80,81,82]. The absorption bands in the region 1190−1030 cm−1 correspond to the S−O stretching vibrations of the sulfonate group [83,84]. The differences in the displacement reflect a different bond order of the three S−O bonds, as issued from the different intermolecular connectivity patterns. The changes can be attributed to variations of the supramolecular organization upon complex formation with the N,O-ligand generating zwitterions suitable for the formation of strong change-assisted hydrogen bonds. Absorptions in this region are resulting from vibrations of hydrogen atoms involved in O−H⋯O/O and N+–H⋯O/O hydrogen bonds (see synthons in Scheme 2) [63,85,86].
The characterization of complexes 1 and 2 was complemented by NMR spectroscopic analysis (Figures S3 and S4, in Supplementary Materials). The 1H NMR spectra of compound 1 shows nine well-defined signals for the aromatic hydrogens in the region 9.5–7.2 ppm. On the contrary, for compound 2 only six broad 1H NMR signals were observed at δ = 9.7–7.1 ppm.

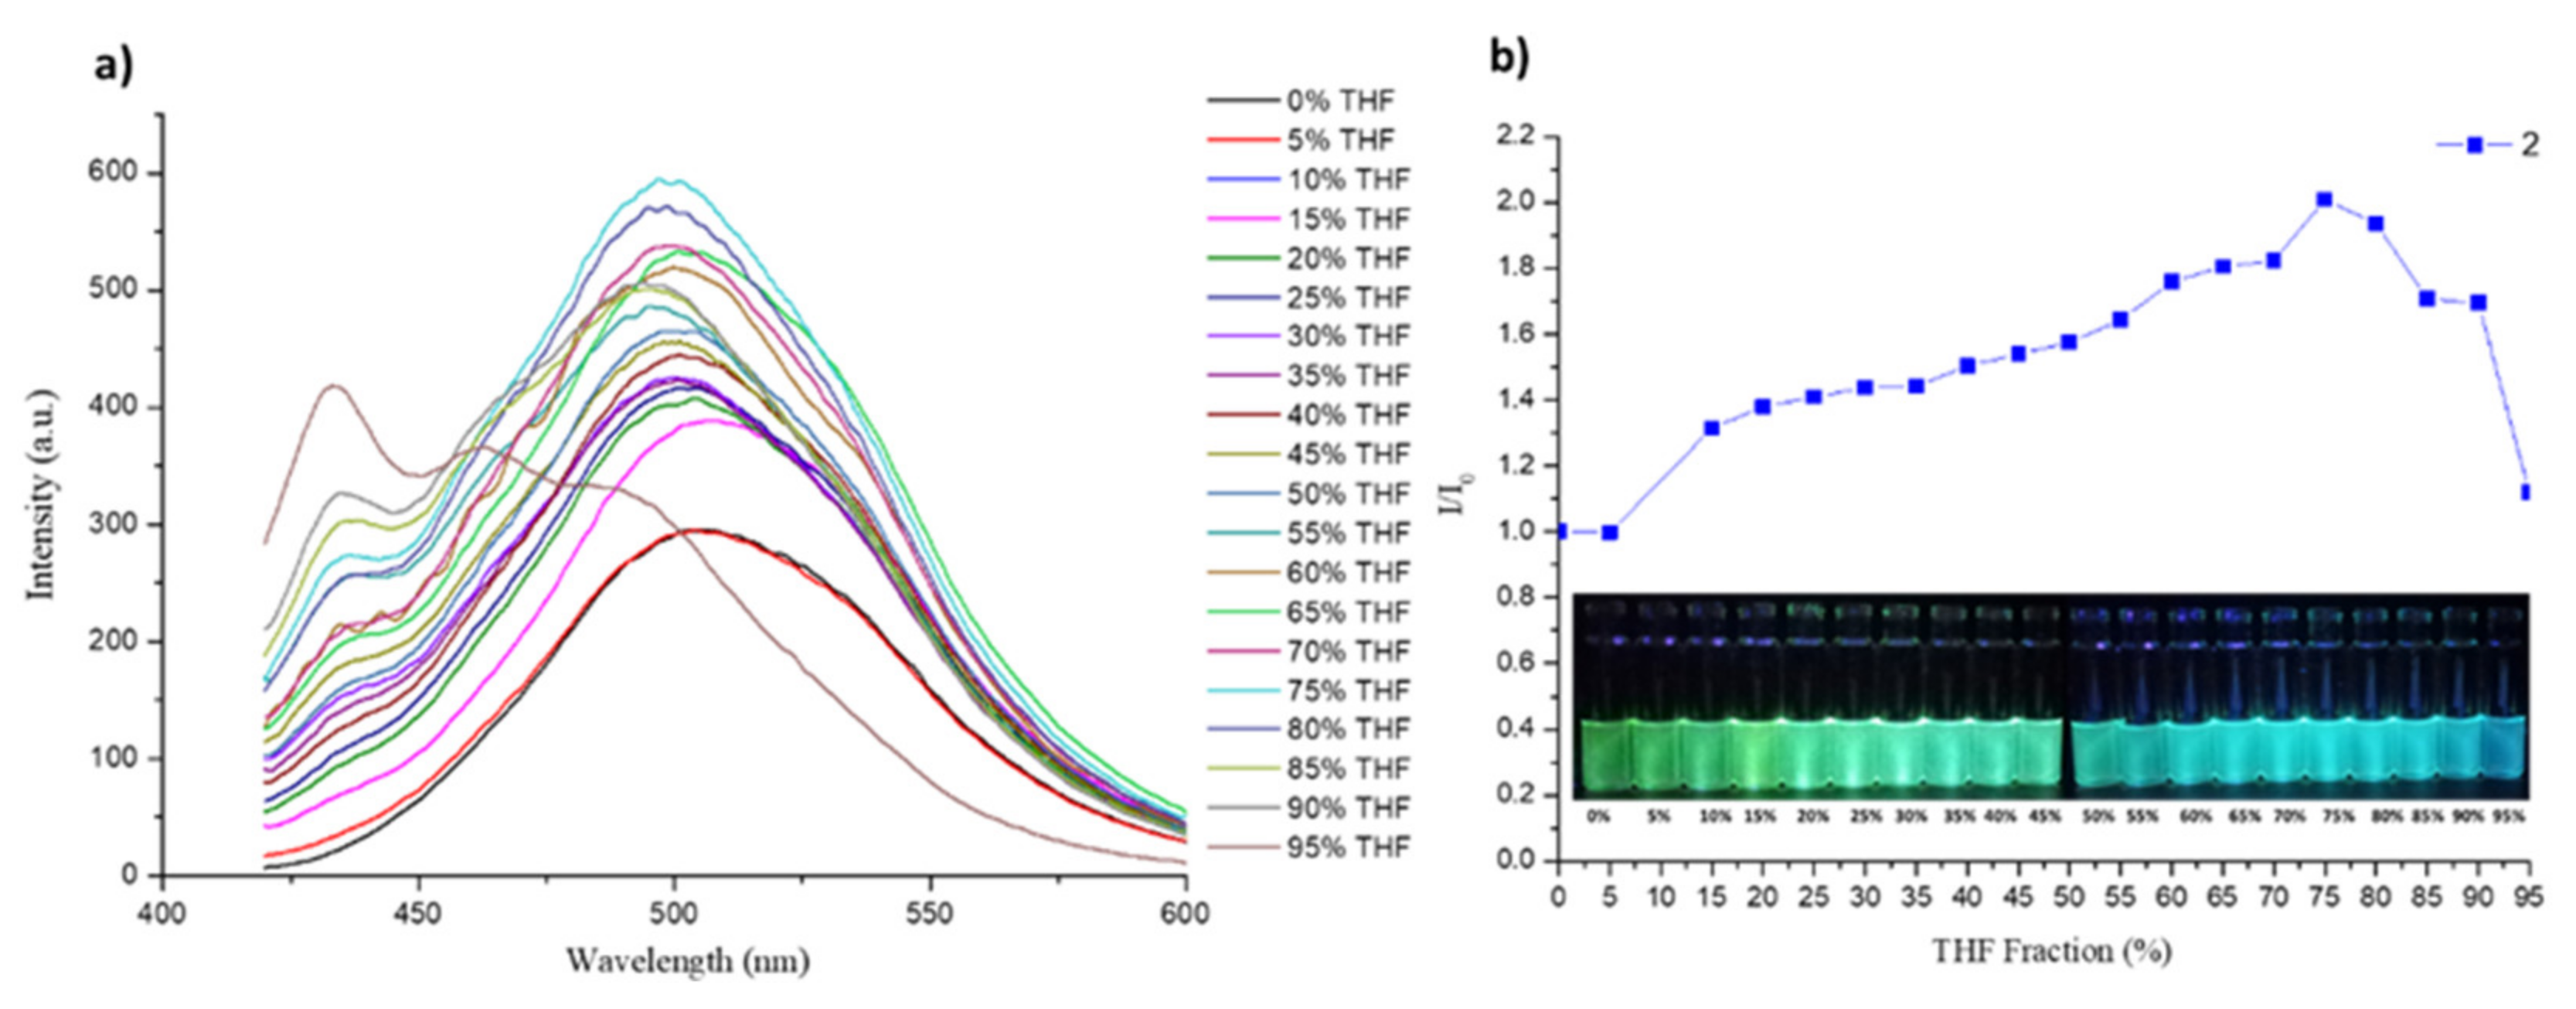
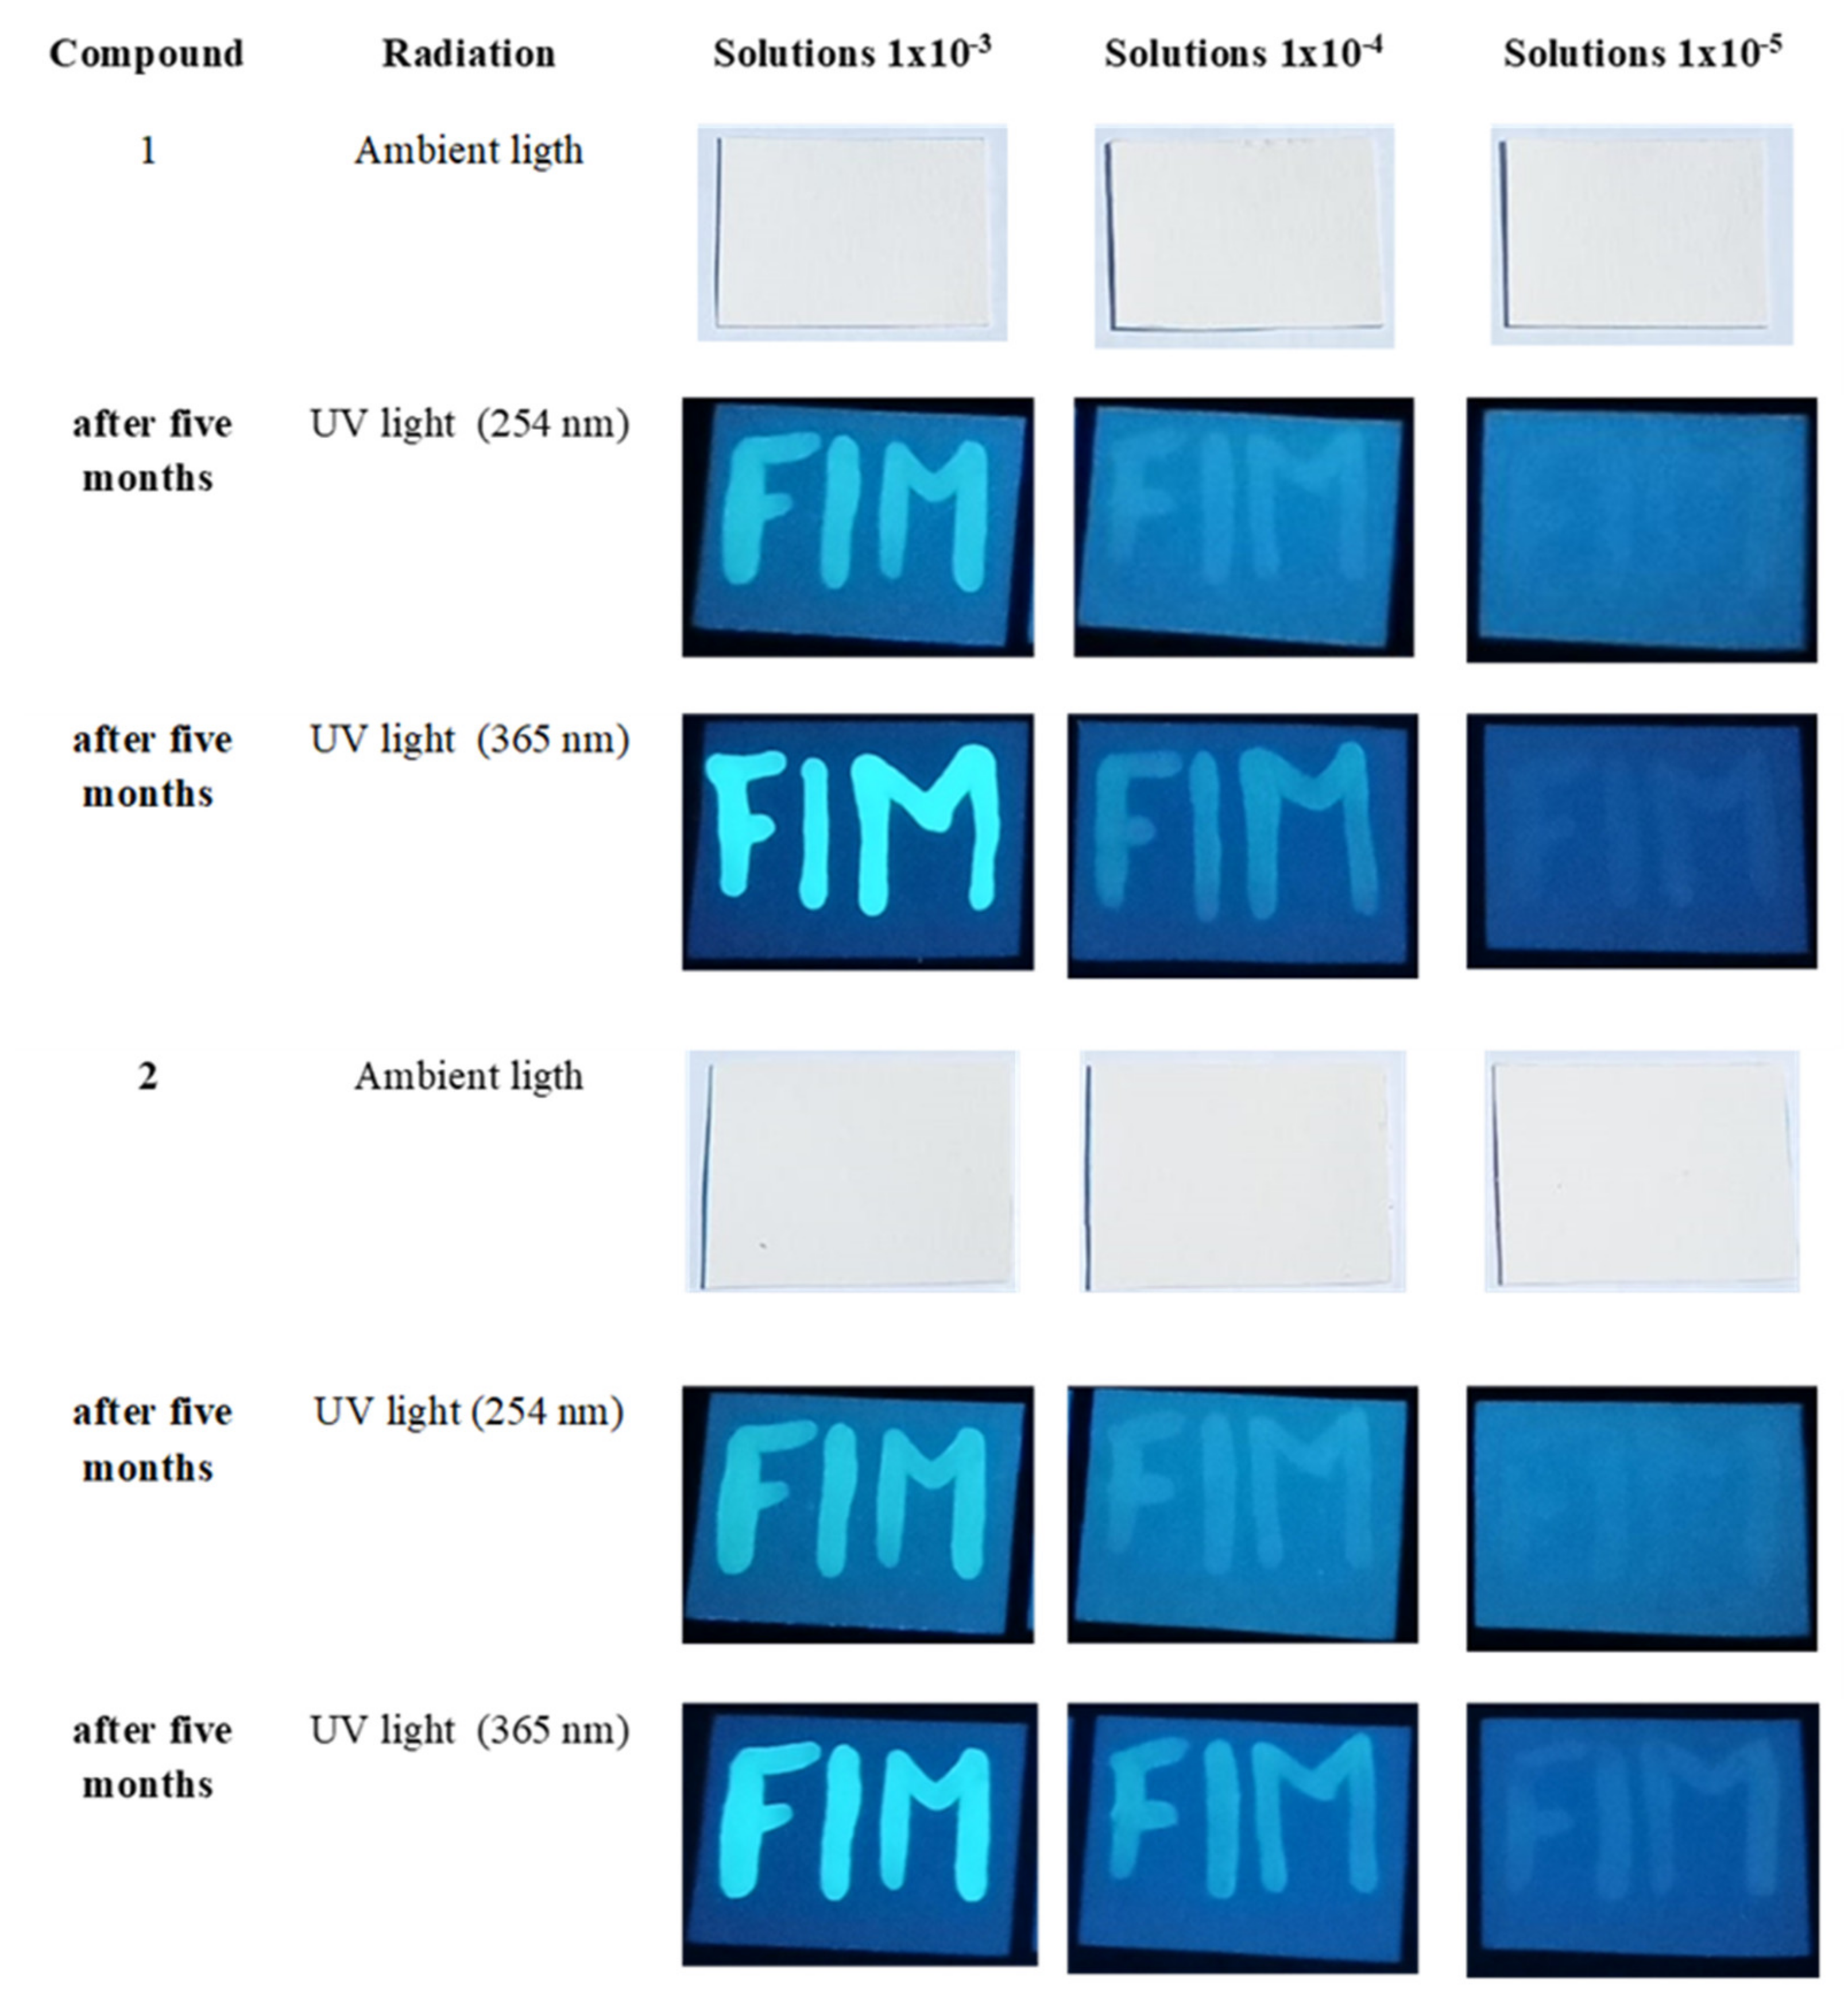
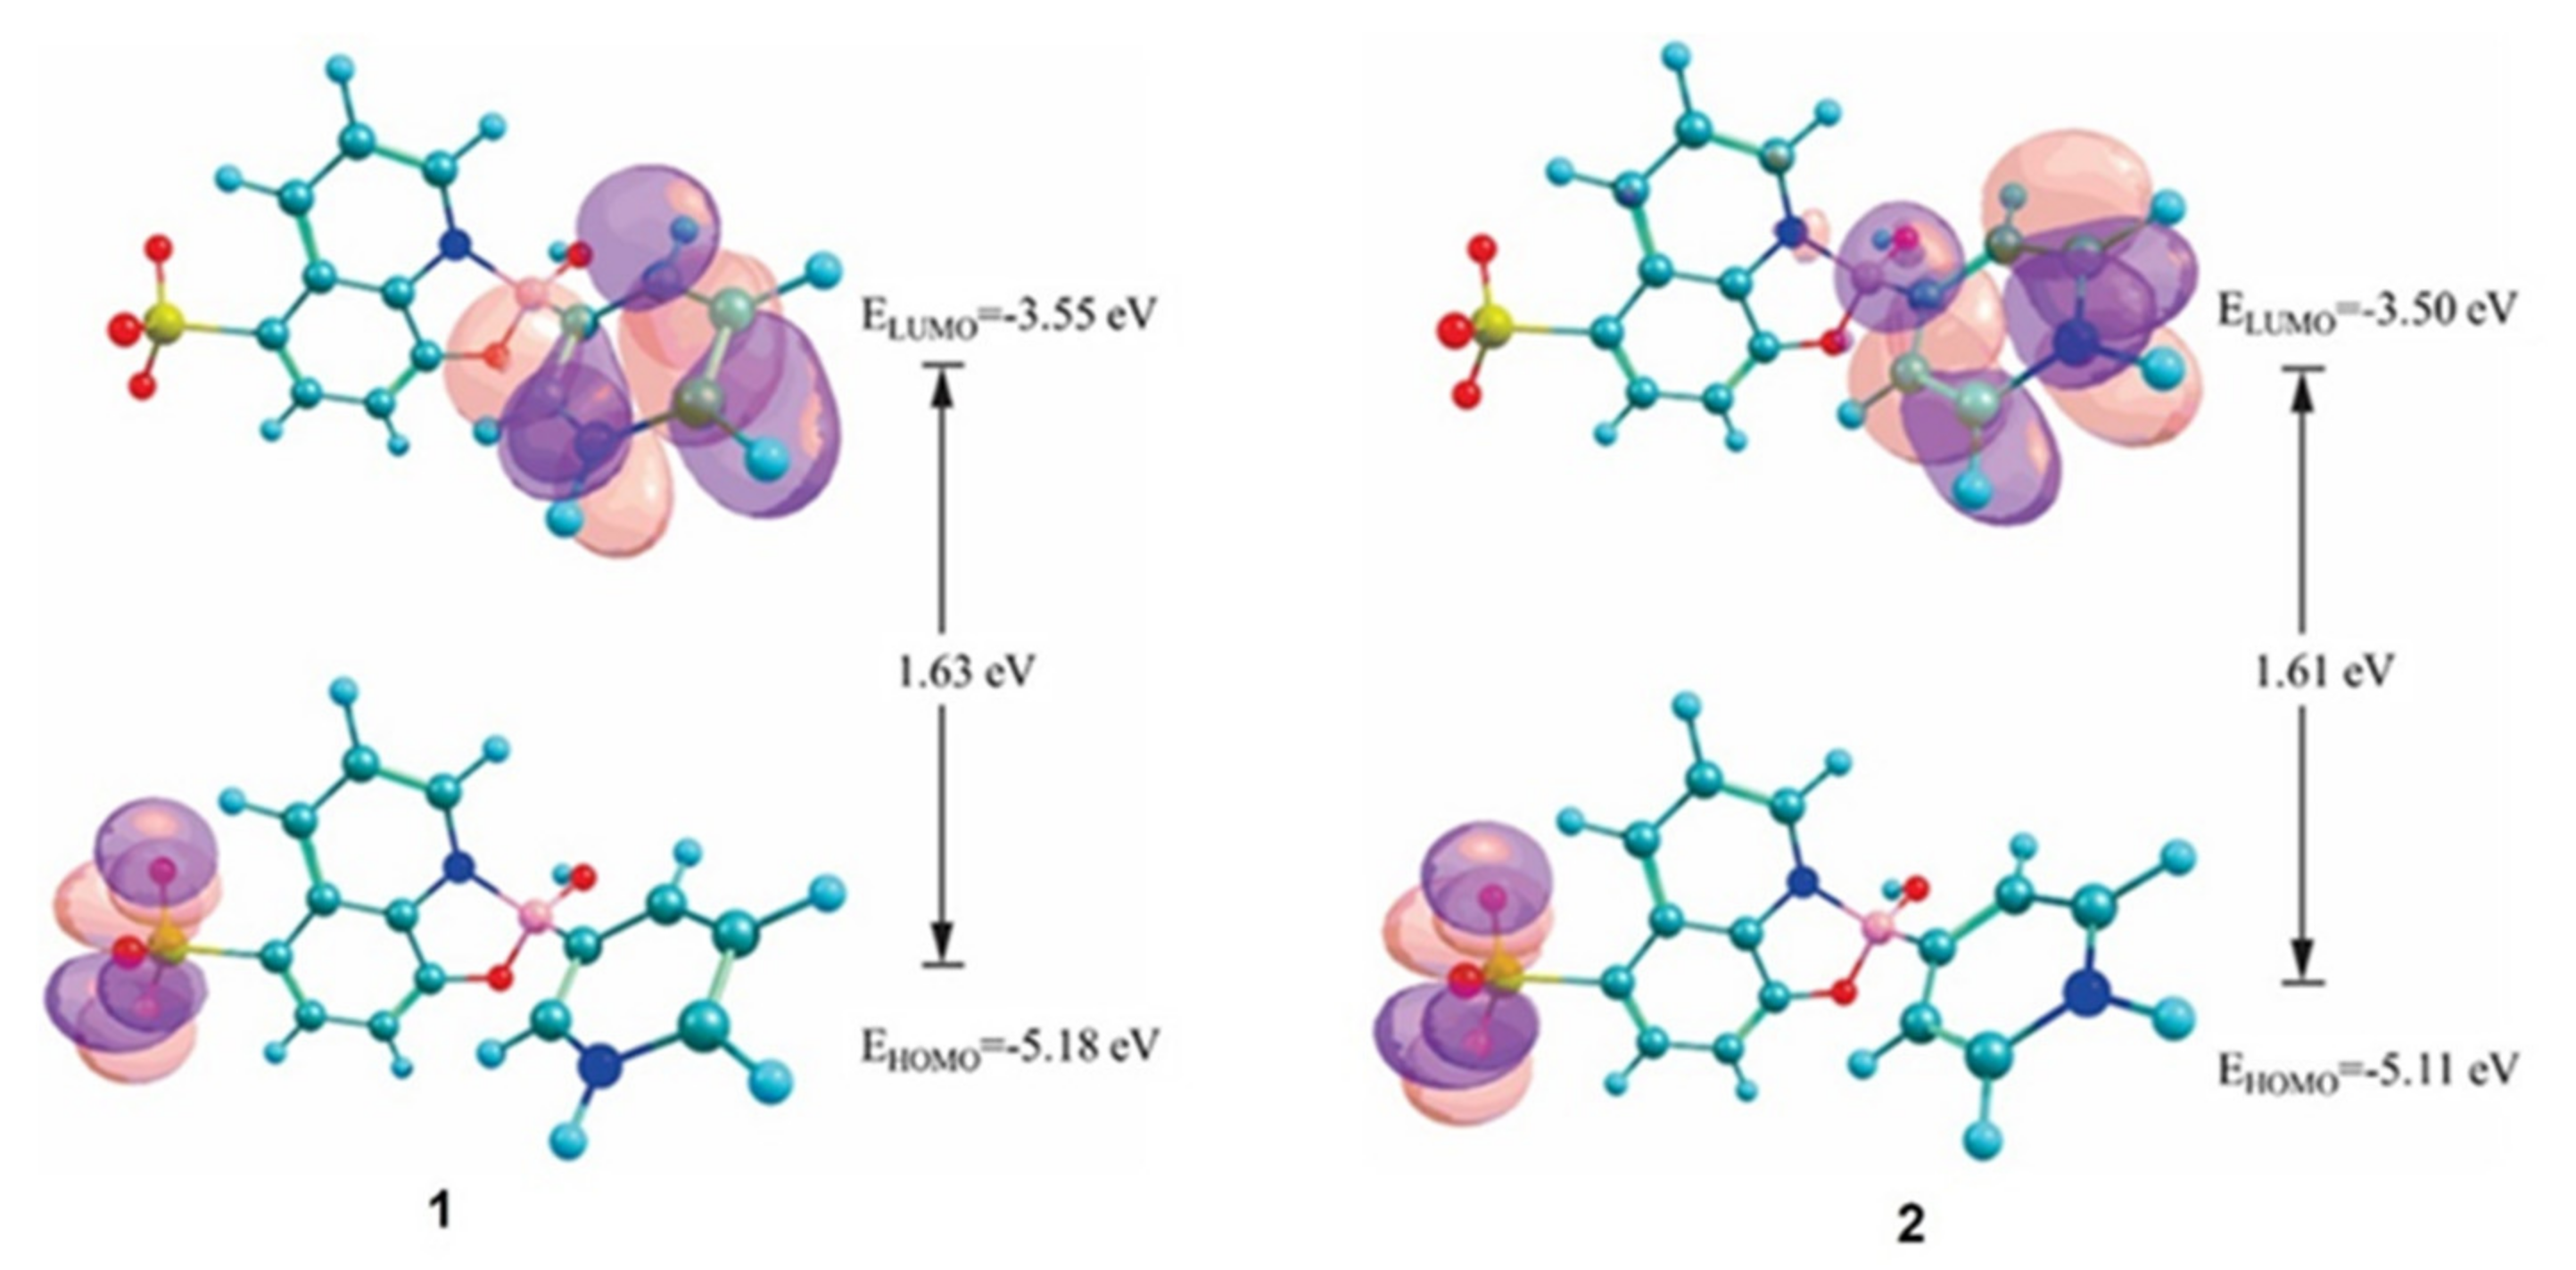
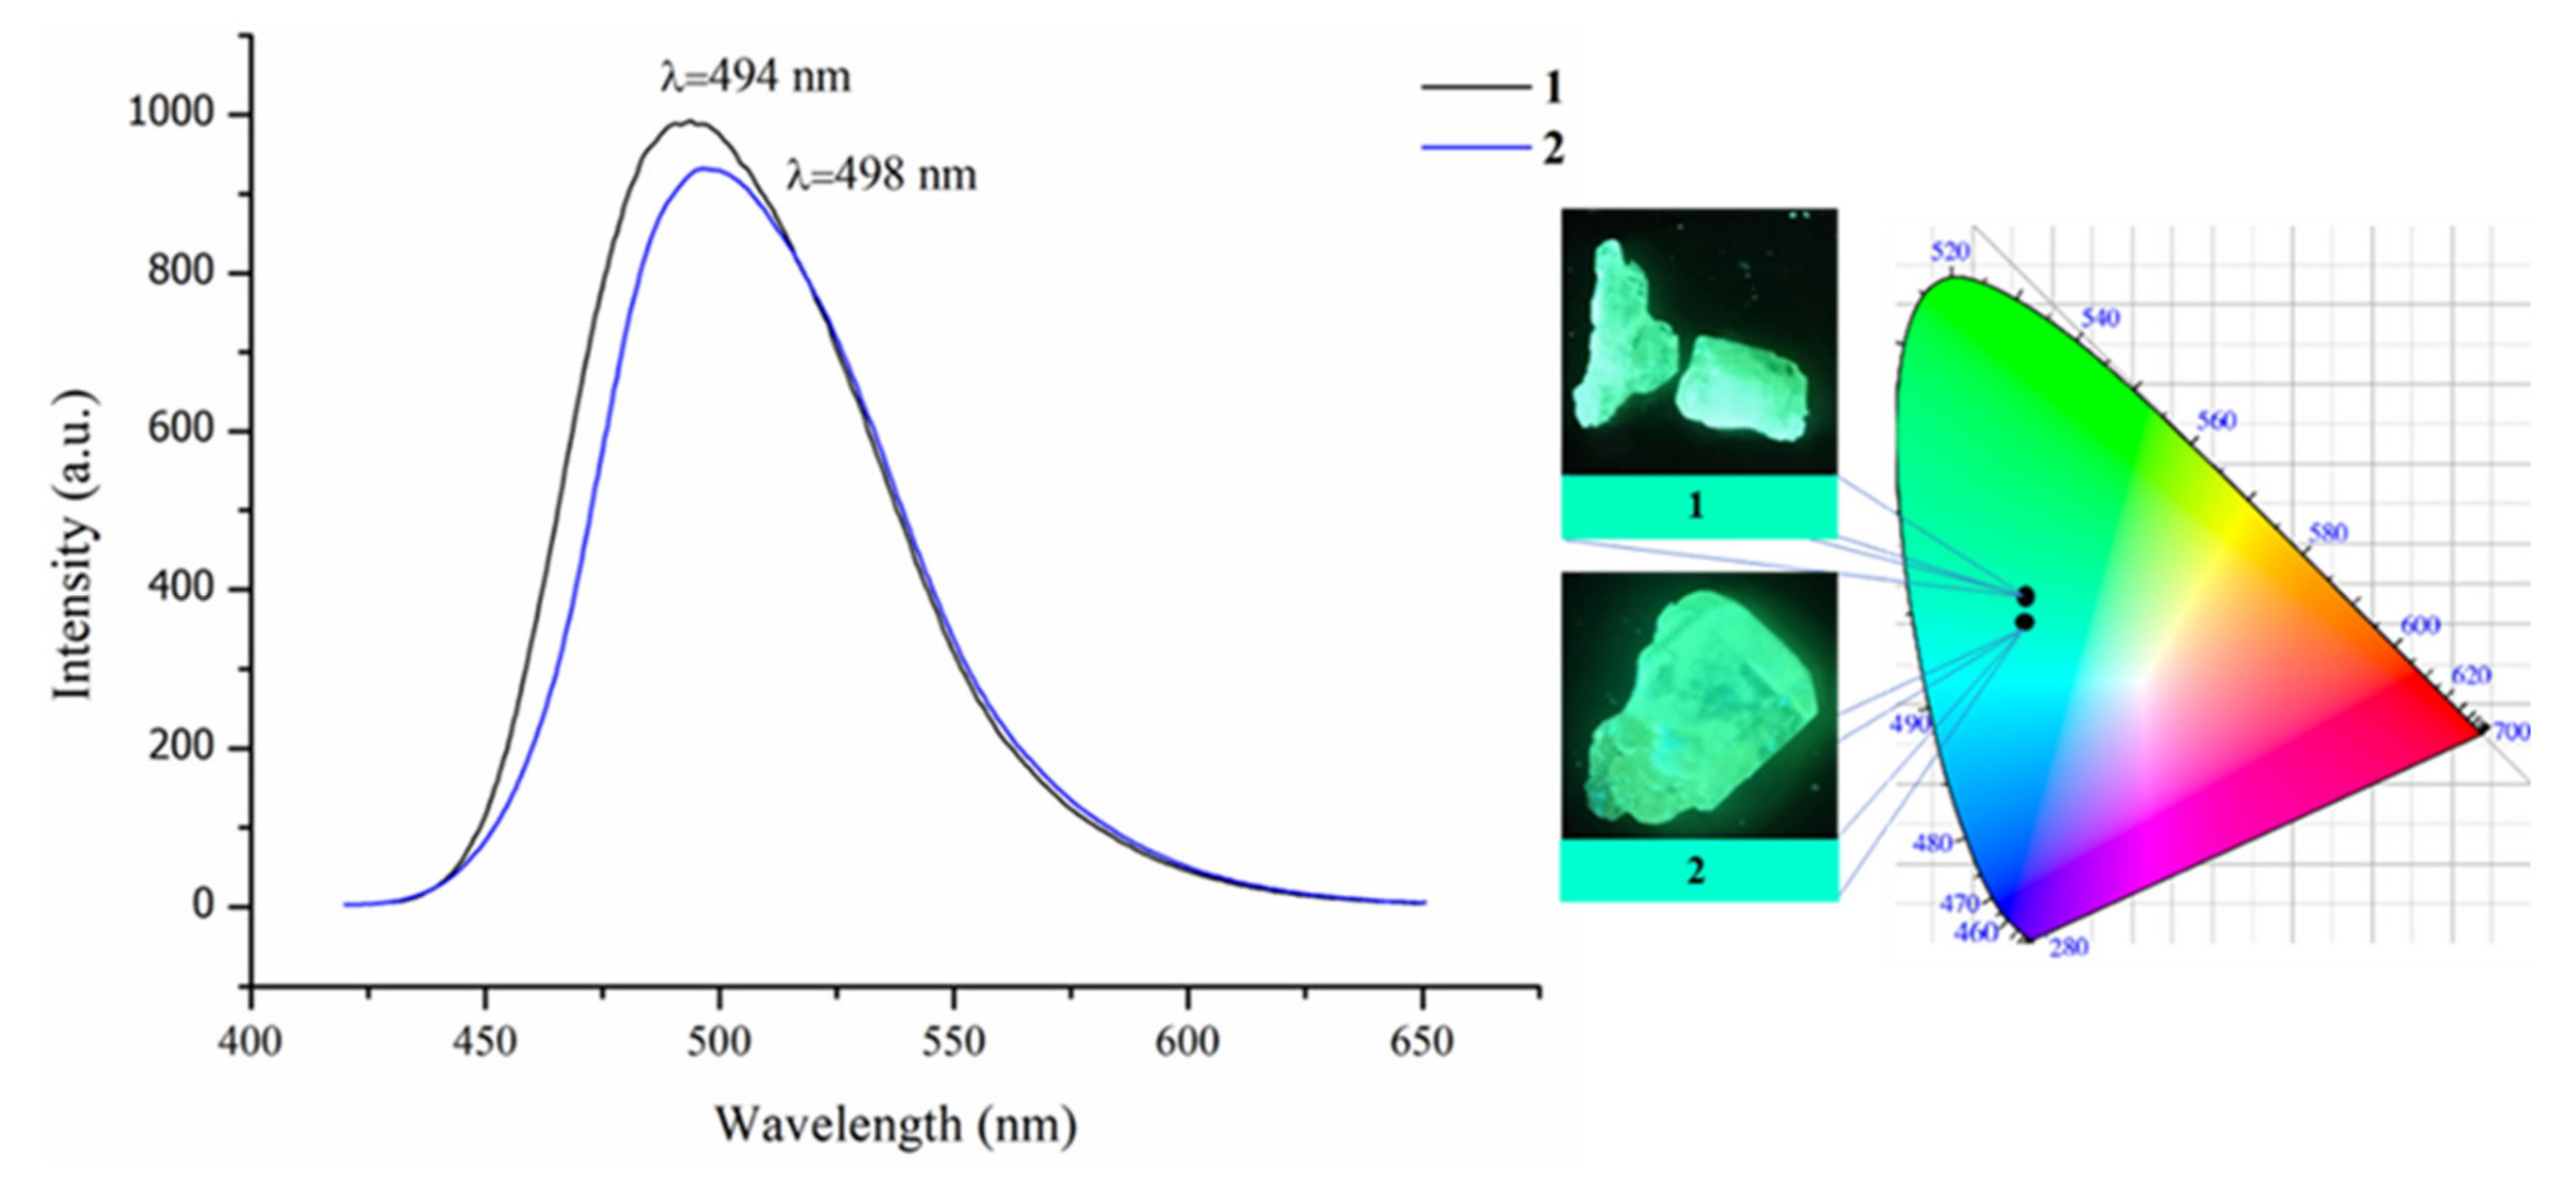
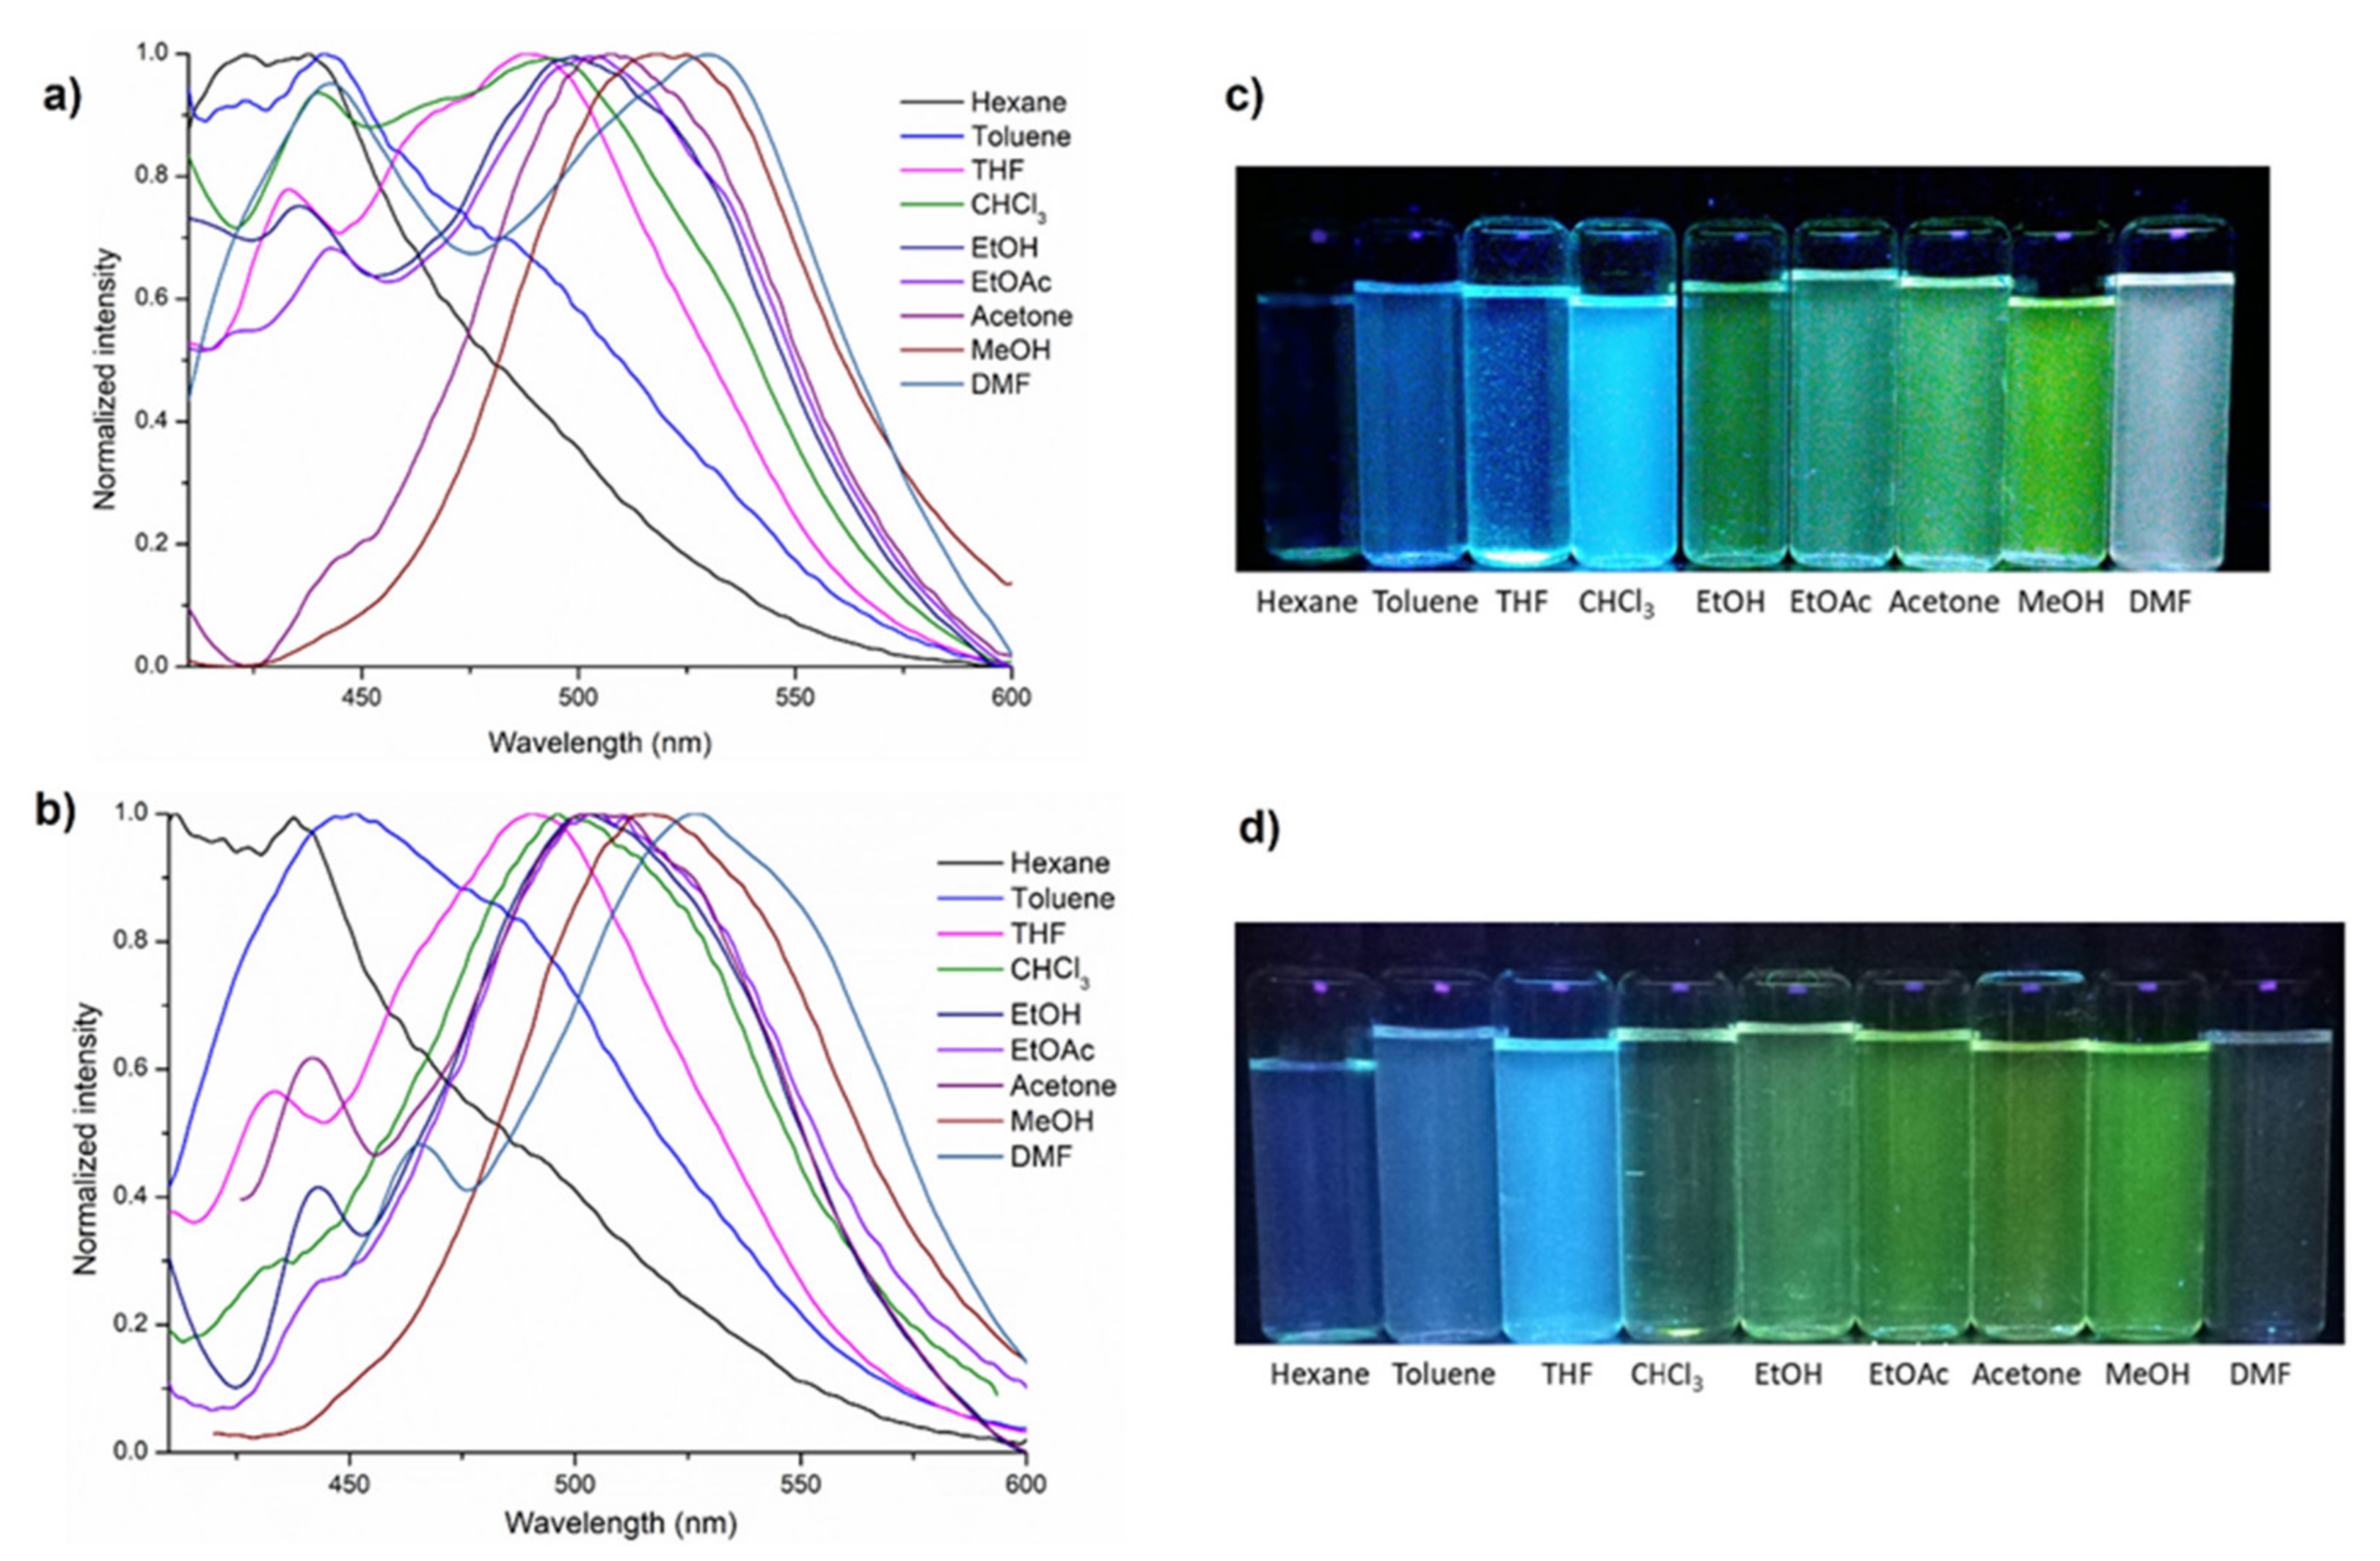
3.5. DFT Calculations and Evaluation of the Photophysical Properties

Molecular orbital theory has been successful in explaining and predicting the chemical behavior of molecular systems. HOMO orbitals usually act as electron donors and LUMO orbitals as electron acceptors. The energy gap between the highest occupied molecular orbital (HOMO) and the lowest unoccupied molecular orbital (LUMO) is an important parameter for determining the electrical and optical properties of organic materials [87]. In photoactive materials, the HOMO and LUMO orbitals are frequently located in different sections within the same molecule, thus enabling intramolecular HOMO-LUMO charge transfer. To examine the nature of the electronic transitions in complexes 1 and 2, DFT calculations were performed at the M06-2X/6-31G(d) level [88]. The initial geometric parameters for 1 and 2 used in the calculations were extracted from the crystal data and used for subsequent geometry optimizations.
Since the electronic excitations crucial for understanding photophysical processes occur from the highest occupied molecular orbitals (HOMO) to the lowest unoccupied molecular orbitals (LUMO), it is essential to form efficient charge-separated states with the HOMO localized on the donor unit and the LUMO on the acceptor unit. The isodensity plots of the frontier molecular orbitals (FMO) in 1 and 2 reveal that intramolecular charge transfer of the donor orbital HOMO to the LUMO acceptor can occur (see Figure 9 and Figure S5). The HOMO and LUMO energies are −5.18 and −3.55 eV for 1; −5.11 and −3.50 eV for 2, respectively (Figure 9). The energy gap of 1.63 and 1.61 eV in 1 and 2, respectively, indicates low chemical hardness and high reactivity, since it is energetically favorable to promote electrons from the HOMO to the LUMO orbital. As illustrated in Figure 9 and Figure S5, in both compounds the HOMO orbital is mainly concentrated at the sulfonate group, while the LUMO orbital is located at the pyridinium group (pyNH+) and the boron atom. Additionally, Figure S5 shows that the HOMO-1, LUMO+2, and LUMO+3 orbitals are spread over the entire quinoline group. Figure 10 shows the experimental and calculated UV–Vis absorption spectra of 1 and 2, of which the experimental spectra were obtained from a 1.0 × 10⁻⁴ M solution in EtOH at room temperature and the theoretical spectra calculated at the TD-DFT/M06-2X/6-31G(d) level of theory. The oscillator strength (f) is a parameter quantifying the probability of electron transitions. The results of the TD-DFT calculation for 1 reveal three major signals in the UV region, i.e., two low-intensity bands at 278 and 336 nm due to the HOMO→LUMO+1 and HOMO→LUMO (n–π * transitions), respectively, and one additional intense band (f = 0.1886) at 226 nm for the π–π * transition excitations, which was assigned to the HOMO→LUMO+3 and HOMO-2→LUMO transitions (Figure S5 and Table S10, in Supplementary Materials). The calculated bands are consistent with the three bands found experimentally in the UV region (<350 nm), centered at 242 (ε = 24,634 M−1·cm−1), 259 (ε = 3230 M−1·cm−1) and 319 nm (ε = 2945 M−1·cm1). The wavelength of the HOMO→LUMO transition (336 nm) implies that intramolecular charge transfer takes place [15,89].
The calculated UV-Vis spectrum of 2 displays similar bands to 1, of which the most intense band at 227 nm (f = 0.2139) is due to the HOMO→LUMO+3 and HOMO-2→LUMO transitions. This π-π * transition band is consistent with the broad band centered at 242 nm (ε = 17,696 M−1·cm−1) in the experimental spectrum. The calculated spectrum displays two additional bands at 287 and 339 nm, which are assigned to HOMO→LUMO+1 and HOMO→LUMO transitions. These bands have their equivalents at 259 (ε = 1981 M−1·cm−1) and 322 nm (ε = 1986 M−1·cm−1) in the experimental spectrum and correspond to n-π * transitions. Detailed assignments of the spectra obtained by the TD-DFT calculations in terms of FMO are included in the Supplementary Materials (Figure S5 and Table S8).
Considering the excellent luminescent properties of organoboron compounds [10,90] and with the aim to explore the potential application of monoboron complexes 1 and 2 as luminescent materials, the solid-state fluorescent properties of the title compounds were studied in comparison to the starting reagents (Figures S6 and S7 in Supplementary Materials). Upon excitation (λex = 393 nm), solids 1 and 2 display bluish-green luminescence bands centered at 494 and 498 nm, respectively (Figure 11), which can be attributed to S1→S0 transitions from the lowest vibrational level of the first excited singlet electronic state (S1) to the vibrational levels of the singlet ground state (S0) [91]. The Stokes shifts for 1 and 2 with values of 101 nm (12.28 eV) and 105 nm (11.81 eV), respectively, are indicative of charge transfer, which is an important feature for fluorophores suitable for use in materials science [92,93,94]. The Commission Internacionale d’Eclairage (CIE) coordinates [95] for these emissions are (0.1625, 0.4388) and (0.1638, 0.4072), respectively.
The profiles and positions of the emission spectra of 1 and 2 are very similar (Figure 11), indicating that essentially only the sulfonate (distribution of the HOMO) and the PBA groups (distribution of the LUMO) are involved in the excitation and emission processes. In comparison with the PBA starting materials (Figures S6 and S7 in Supplementary Materials), the emission maximum of 1 and 2 is red-shifted by 24 nm and 28 nm, respectively, indicating that the luminescent behavior of the monoboron complexes is influenced by the coordination of the ligand 8HQSA to the pyridineboronic acid. The bonding of the lone-pair electrons at the nitrogen atom in the ligand to the boron atom reduces the energy gap between the HOMO-LUMO orbitals of the ligand. A similar increase in the emission wavelength was observed also in previous studies of other four-coordinate monoboron complexes with N,O-chelating ligands [96,97,98].
The emission spectra of crystalline solids are significantly different from phases where the molecular components are dissociated (e.g., in solution or in amorphous phases), evidencing that the supramolecular organization in the solid state plays a significant role for the optoelectronic properties [99,100,101]. In order to examine if there are changes in the emission properties upon grinding, pristine solids of 1 and 2 were thoroughly ground in an agate mortar for 10 min. This resulted in a reduction in the emission efficiency by 1.1-fold for 1 and 1.5-fold for 2 (from J0/J = 1.1 in 1 and J0/J = 1.5 in 2, where J and J0 are the emission efficiencies determined by integration of the area under the curve—Figures S8 and S9, respectively). However, the samples had not turned amorphous since the powder XRD patterns of the ground samples recorded at room temperature indicated crystallinity. In addition, the crystal structure is conserved, because the PXRD patterns still match well with the simulated XRD patterns based on the respective crystal structure in terms of the peak positions (see, Figures S8 and S9 in Supplementary Materials), indicating that the molecular components are strongly linked via noncovalent bonds, which could not be disrupted even by mechanical grinding. The observed decrease in the emission bands can be attributed to the effect of a less beneficial packing in the powders obtained after grinding [102,103]. The high crystallinity is useful for a practical application of complexes 1 and 2, because no additional procedures or treatments would be necessary to show luminescent activity at room temperature [103].
Having explored the fluorescence characteristics of solid samples of 1 and 2, the photophysical properties in solution using solvents of different polarity were also investigated. The spectra recorded for 1.0 × 10⁻⁵ M solutions are shown in Figure 12a,b, Figures S10 and S11. The corresponding photophysical data are collected in Table S11 (Supplementary Materials). The photophysical properties reveal a clear solvatochromic effect as different fluorescence colors emerge under the UV lamp (Figure 12c,d). Figure 12a shows the solvent-dependent photoluminescence (PL) spectra of 1. In nonpolar solvents, such as hexane and toluene, the fluorescence spectra of 1 exhibit vibrational structures, indicating two excited states of similar energy, so it is deemed that the excited-state contribution to the emission in hexane and toluene originates from a localized excitation [104]. With increasing polarity of the solvents, the fluorescent emission bands become significantly red-shifted. For example, in hexane, the fluorescent emission bands of 1 are located at 422 nm and 438 nm; meanwhile, for THF and CHCl3 solutions, the emission bands are bathochromically shifted to 489 nm and 493 nm, respectively. In very polar solvents, such as MeOH and DMF, the bands at 524 nm and 529 nm, respectively, are in addition broadened and have larger Stokes shifts (Figure S10, Table S11 in Supplementary Materials). The large bathochromic shifts in the emission spectra in these solvents suggest an increase of the molecular dipole moment in the excited state compared to the ground state [105]. The Stokes shifts (e.g., 6737 cm−1 and 0.83 eV in DMF), the band broadening, and the red-shift of the emission bands indicate that in polar solvents, intramolecular charge transfer (ICT) takes place in the excited state [104,105]. The emission maxima, shift differences among absorption and emission spectra, and Stokes shifts for solutions of complex 2 follow similar tendencies (see, Figure 12b and Figure S11, Table S11, in Supplementary Materials). In conclusion, these data are indicative of positive solvatofluorochromism for organoboron complexes 1 and 2.
For a more profound comparison of the solid-state and solution fluorescence properties, the emission spectra of boron complexes 1 and 2 in MeOH (1.0 × 10⁻⁴ M, T = 298 K) were compared to the solid-state spectra. In both the solution (1, 507 nm; 2, 505 nm) and the solid state (1, 494 nm; 2, 498 nm) the samples show intense bluish-green fluorescence (Figures S12 and S13, in Supplementary Materials). However, in solution, a drastic three-fold decrease in the luminescence intensity is observed compared to the solid-state emission spectra, suggesting Aggregation Induced Emission Enhancement (AIEE) characteristics [105,106,107,108]. In addition, the solid-state emission maxima of complexes 1 and 2 are blue-shifted by about 10 nm compared to the solution spectra, which is different to what was observed by Cui and Wang for a related N,O-chelated monoboron compound based on 8-hydroxyquinoline [109]. The observed blue shift and increased intensity for the emissions from the solid-state samples might be the result of energetically more favorable intermolecular interactions in the bulk samples. As shown in Figures S14 and S15 (in Supplementary Materials), the solid-state packing of compounds 1 and 2 involves multiple π⋯π interactions with centroid–centroid distances in the range 3.529–4.112 Å. Previous studies have shown that π–stacking reduces the rotational freedom of the aromatic rings involved, thus reducing ISC [106,107,108].
In order to examine if the monoboron complexes 1 and 2 in solution show AIEE characteristics, fluorescence spectra were recorded in the binary solvent system MeOH-THF varying the fractional composition (Figure 13) [110,111]. Considering the zwitterionic character of the boron complexes, the luminogens should aggregate and might even precipitate in solvent mixtures with high THF fractions (fTHF). During the experiment, the concentration of 1 and 2 in the solution was kept constant at 1.0 × 10⁻⁴ M. With increasing THF content (fTHF) from 0% to 15%, the fluorescence intensity (λex = 324 nm) becomes weaker for 1, possibly due to the formation of intermolecular solvent–solute interactions between THF and the dye. However, for fTHF in the range of 15–70%, the fluorescence intensity is gradually increased, reaching a maximum at 70%, where the relative emission intensity is approximately two-fold higher than in pure MeOH, which might be due to the restriction of molecule rotation as a result of π⋯π interactions and other hydrophobic molecule-molecule contacts, alleviating the radiationless relaxation channel [110,111]. With further increasing THF amount, the fluorescence is weakened again, and a significant blue shift is observed. Complex 1 emits at 507 nm in dilute MeOH solution (1.0 × 10⁻⁴ M) and the fluorescence emission shifts to 492 nm at fTHF = 70%. Precipitation was not observed under these conditions.
Similarly, for a dilute solution of 2 in pure MeOH (1.0 × 10⁻⁴ M), only weak emission is observed. Upon addition of THF, in this case the fluorescence intensity increases significantly as soon as the THF fraction exceeds 5%. The plot of luminescence intensity versus THF fraction in the MeOH/THF solvent mixture is shown in Figure 14. Similar to 1, the maximum emission was achieved for the 1:3 (v/v) ratio of the solvent mixture (fTHF = 75%), where the relative emission intensity is approximately 2.1-fold higher than in pure MeOH. At the same time, a slight blue shift of the fluorescence occurs, and a new absorption band appears around 430 nm, manifesting the eventual formation of π⋯π interactions among aromatic rings in solution. Nevertheless, at the final stage of the experiment, fluorescence quenching was observed (at fTHF = 95%), in contrast to 1. Furthermore, precipitation was not observed under these conditions.
Since for the solid-state structures of the boron complexes the luminescence intensity is increased significantly and accompanied by a blue shift of the emission maximum compared to a dilute solution in MeOH, AIEE might be indicated [109,112,113,114]. For the case of intermolecular π–interactions, it has been proposed that a restriction-of-intramolecular-vibrations mechanism is responsible for the AIEE effect [112,113]. In accordance with the SCXRD analysis (vide supra) it is suggested that THF activates intermolecular aggregation through π⋯π interactions between the aromatic components (quinoline and/or pyridinium rings) in solution. The overlap between π-orbitals of adjacent molecules in close-packed head-to-head arrangements can/could facilitate the delocalization of excitons and increase the charge-carrier mobility [115].
Figure S12c,d illustrate that boron complexes 1 and 2 exhibit a high-contrast photochromic effect. Because of this, the compounds might be adopted for applications as luminescent materials, in particular for anticounterfeiting applications (security inks) [114,116,117]. To verify this hypothesis, ethanol solutions with 1 and 2 ink were prepared at different concentrations (1.0 × 10⁻³, 1.0 × 10⁻⁴ and 1.0 × 10⁵ M) and employed for writing on a watercolor paper, and then allowed to dry at room temperature. For all samples, under sunlight no coloration was observed; meanwhile, under UV light of 254 nm and 365 nm, the samples generated strong bluish-green fluorescence with increasing intensity as the concentration was incremented (Figure 15). These results suggest that compounds 1 and 2 could indeed be used as fluorescent security inks.

4. Conclusions

In the present study, two new molecular organoboron complexes were synthesized in good yields from 8-hydroxyquinolin-5-sulfonic acid and 3- or 4-pyridineboronic acid. X-ray structure analysis confirmed that in both complexes, the boron atoms are embedded in a five-membered chelate ring formed with the N,O-ligand donor atoms, adopting a distorted tetrahedral geometry. In addition, proton transfer from the sulfonic-acid group to the pyridine substituent occurred, giving overall zwitterionic molecular structures. The crystal structure analysis further revealed the presence of charge-assisted hydrogen bonds of the N+−H⋅⋅⋅O/O and O−H⋅⋅⋅O/O type, with the difference being that in compound 1, water molecules were included in the crystal lattice. In both complexes, these hydrogen bonds were accomplished by π⋯π interactions and C−H⋅⋅⋅O contacts to yield three-dimensional networks. The locations and percentage contributions of the different intermolecular interactions were also analyzed by means of Hirshfeld surface analysis and fingerprint plots. DFT calculations established HOMO-LUMO gaps of 1.61 eV for 1 and 1.63 eV for 2. In addition, the nature of the electronic intramolecular transitions was calculated by means of TD-DFT calculations at the M06-2X/6-31G(d) level using ethanol as solvent. Comparison of the experimental and calculated UV spectra showed good agreement, observing only small variations. Fluorescence emission of solid crystalline samples of complexes 1-2 occurs in the bluish-green region upon excitation at λ = 393 nm. The compounds were also fluorescent in solution and showed moderate solvatochromism when the solvent was changed from hexane to DMF. The fluorescence emission of 1 and 2 was also analyzed in dilute methanol/THF solvent mixtures. Dilute solutions in methanol gave only weak emissions, but the fluorescence increased significantly in the presence of THF, giving maximum emission for a solvent mixture of 70% (v/v) and 75% (v/v) for 1 and 2, respectively. The increase in the fluorescence intensity might be originated by molecular aggregation of the fluorophores under the category of AIEE. Based on the results, the photophysical properties of 1 and 2 are attributed to intra and/or intermolecular π⋯π interactions enabling π-π * and n-π * HOMO→LUMO transitions. The intense photoluminescence, high-contrast photochromic effect, and good stability of inks (at least for five months) prepared from complexes 1 and 2 indicate potential for use as fluorescent dopants in security inks.

Supplementary Materials

The following supporting information can be downloaded at: https://www.mdpi.com/article/10.3390/cryst12060783/s1: Tables S1 and S3, bond distances of 1 and 2; Tables S2 and S4, bond angles of 1 and 2; Table S5, hydrogen-bonding geometries of complexes 1 and 2, calculation of τ4 for complexes 1 and 2, calculation of THC for complexes 1 and 2; Table S6, Calculation of τ4 for complexes 1 and 2; Table S7, Calculation of THC for complexes 1 and 2; Table S8, fingerprint plots of compound 1 and 2; Figures S1 and S2, IR spectra of 1 and 2, Table S9 IR spectroscopic data of 1 and 2; Figures S3 and S4, 1H-NMR spectra of 1 and 2; Figure S5, HOMO and LUMO frontier orbital plots of compounds 1 and 2; Table S10, electronic excited states calculated through TD-DFT; Figures S6-S9, solid-state emission spectra and PXRD data of 1 and 2; Figures S10 and S11, normalized absorption and emission spectra of 1 and 2; Table S11, photophysical properties of the solutions of complexes 1 and 2 in different solvents; Figures S12 and S13, emission spectra of 1 and 2 in the solid state and in methanol solution; Figures S14 and S15: packing diagrams of the crystal structures of 1 and 2.

Author Contributions

G.Y.R.-Á.: investigation, methodology, material analysis, and writing—original draft; A.J.C.-V.: investigation and methodology; L.L.G.-M.: investigation, methodology, and material analysis; A.C.-E.: conceptualization, formal analysis, material analysis, project administration, and writing—original draft; J.J.C.-G.: conceptualization, visualization, writing—original draft, and writing—review and editing; J.B.-L.: conceptualization and software; E.C.V.-O.: investigation and software; H.H.: visualization, writing—original draft, and writing—review and editing; V.M.-S.: investigation, methodology; B.A.G.G.: methodology and material analysis. D.G.-M.: software and validation. All authors have read and agreed to the published version of the manuscript.

Funding

This work received financial support from Universidad Autónoma de Sinaloa, México (DGIP-PROFAPI-2014/057) and from Consejo Nacional de Ciencia y Tecnología (CONACyT) in form of scholarships granted to G.Y.R.A. (581863), A.J.C.V. (484961), L.L.G.M. (413713) and E.C.V.-O.

Institutional Review Board Statement

Not applicable.

Informed Consent Statement

Not applicable.

Data Availability Statement

Not applicable.

Acknowledgments

The authors gratefully acknowledge access to the X-ray facilities in the Chemical Research Center at Universidad Autónoma del Estado de Morelos (CIQ-UAEM).

Conflicts of Interest

The authors declare no conflict of interest.

References

  1. Liu, Z.; He, W.; Guo, Z. Metal coordination in photoluminescent sensing. Chem. Soc. Rev. 2013, 42, 1568–1600. [Google Scholar] [CrossRef] [PubMed]
  2. Elgemeie, G.H.; Mohamed, R.A. Microwave synthesis of fluorescent and luminescent dyes (1990–2017). J. Mol. Struct. 2018, 1173, 707–742. [Google Scholar] [CrossRef]
  3. Wong, W.-Y.; Ho, C.-L. Functional metallophosphors for effective charge carrier injection/transport: New robust OLED materials with emerging applications. J. Mater. Chem. 2009, 19, 4457–4482. [Google Scholar] [CrossRef]
  4. Jiang, Y.; Liu, Y.Y.; Liu, X.; Lin, H.; Gao, K.; Lai, W.Y.; Huang, W. Organic solid-state lasers: A materials view and future development. Chem. Soc. Rev. 2020, 49, 5885–5944. [Google Scholar] [CrossRef]
  5. Yang, Y.; Zhao, Q.; Feng, W.; Li, F. Luminescent Chemodosimeters for Bioimaging. Chem. Rev. 2013, 113, 192–270. [Google Scholar] [CrossRef]
  6. Benesperi, I.; Michaels, H.; Freitag, M. The researcher’s guide to solid-state dye-sensitized solar cells. J. Mater. Chem. C 2018, 6, 11903–11942. [Google Scholar] [CrossRef] [Green Version]
  7. Li, Z.; Askim, J.R.; Suslick, K.S. The Optoelectronic Nose: Colorimetric and Fluorometric Sensor Arrays. Chem. Rev. 2019, 119, 231–292. [Google Scholar] [CrossRef]
  8. Zhao, X.; Liu, J.; Fan, J.; Chao, H.; Peng, X. Recent progress in photosensitizers for overcoming the challenges of photodynamic therapy: From molecular design to application. Chem. Soc. Rev. 2021, 50, 4185–4219. [Google Scholar] [CrossRef]
  9. Entwistle, C.D.; Marder, T.B. Applications of Three-Coordinate Organoboron Compounds and Polymers in Optoelectronics. Chem. Mater. 2004, 16, 4574–4585. [Google Scholar] [CrossRef]
  10. Li, D.; Zhang, H.; Wang, Y. Four-coordinate organoboron compounds for organic light-emitting diodes (OLEDs). Chem. Soc. Rev. 2013, 42, 8416–8433. [Google Scholar] [CrossRef]
  11. Rodrigues, A.I.; Krishnamoorthy, P.; Gomes, C.S.B.; Carmona, N.; Di Paolo, R.E.; Pander, P.; Pina, J.; de Melo, J.S.S.; Días, F.B.; Calhorda, M.J.; et al. Luminescent halogen-substituted 2-(N-arylimino)pyrrolyl boron complexes: The internal heavy-atom effect. Dalton Trans. 2020, 49, 10185–10202. [Google Scholar] [CrossRef]
  12. Qi, Y.; Cao, X.; Zou, Y.; Yang, C. Color-tunable tetracoordinated organoboron complexes exhibiting aggregation-induced emission for the efficient turn-on detection of fluoride ions. Mater. Chem. Front. 2021, 5, 2353–2360. [Google Scholar] [CrossRef]
  13. Dolati, H.; Haufe, L.C.; Denker, L.; Lorbach, A.; Grotjahn, G.H.; Frank, R. Two π-Electrons Make the Difference: From BODIPY to BODIIM Switchable Fluorescent Dyes. Chem. Eur. J. 2020, 26, 1422–1428. [Google Scholar] [CrossRef]
  14. Boens, N.; Verbelen, B.; Ortiz, M.J.; Jiao, L.; Dehaen, W. Synthesis of BODIPY dyes through postfunctionalization of the boron dipyrromethene core. Coord. Chem. Rev. 2019, 399, 213024. [Google Scholar] [CrossRef]
  15. Kappaun, S.; Rentenberger, S.; Pogantsch, A.; Zojer, E.; Mereiter, K.; Trimmel, G.; Saf, R.; Möller, K.C.; Stelzer, F.; Slugovc, C. Organoboron Quinolinolates with Extended Conjugated Chromophores:  Synthesis, Structure, and Electronic and Electroluminescent Properties. Chem. Mater. 2006, 18, 3539–3547. [Google Scholar] [CrossRef]
  16. Jarzembska, K.N.; Kamiński, R.; Durka, K.; Woźniak, K. Ground-State Charge-Density Distribution in a Crystal of the Luminescent ortho-Phenylenediboronic Acid Complex with 8-Hydroxyquinoline. J. Phys. Chem. A 2018, 122, 4508–4520. [Google Scholar] [CrossRef]
  17. Jarzembsk, K.N.; Kamiński, R.; Durka, K.; Kubsik, M. Engineering of Solvatomorphs of the Luminescent Complex of ortho-Phenylenediboronic Acid and 8-Hydroxyquinoline. Cryst. Growth Des. 2017, 17, 6836–6851. [Google Scholar] [CrossRef]
  18. Wesela-Bauman, G.; Ciećwierz, P.; Durka, K.; Luliński, S.; Serwatowski, J.; Woźniak, K. Heteroleptic (2-Fluoro-3-pyridyl)arylborinic 8-Oxyquinolinates for the Potential Application in Organic Light-Emitting Devices. Inorg. Chem. 2013, 52, 10846–10859. [Google Scholar] [CrossRef]
  19. Xu, S.; Evans, R.E.; Liu, T.; Zhang, G.; Demas, J.N.; Trindle, C.O.; Fraser, C.L. Aromatic Difluoroboron β-Diketonate Complexes: Effects of π-Conjugation and Media on Optical Properties. Inorg. Chem. 2013, 52, 3597–3610. [Google Scholar] [CrossRef] [Green Version]
  20. Li, M.; Han, Y.; Zhang, Z.; He, X.; Chen, Y. The effect of substituent number on mechanochromic luminescence of β-diketones and the corresponding boron complexes. Dye. Pigment. 2019, 166, 159–167. [Google Scholar] [CrossRef]
  21. Morse, G.E.; Bender, T.P. Boron Subphthalocyanines as Organic Electronic Materials. ACS Appl. Mater. Interfaces 2012, 4, 5055–5068. [Google Scholar] [CrossRef]
  22. Morse, G.E.; Helander, M.G.; Maka, J.F.; Lu, Z.H.; Bender, T.P. Fluorinated Phenoxy Boron Subphthalocyanines in Organic Light-Emitting Diodes. ACS Appl. Mater. Interfaces 2010, 2, 1934–1944. [Google Scholar] [CrossRef]
  23. Tamgho, I.S.; Hasheminasab, A.; Engle, J.T.; Nemykin, V.N.; Ziegler, C.J. A New Highly Fluorescent and Symmetric Pyrrole–BF2 Chromophore: BOPHY. J. Am. Chem. Soc. 2014, 136, 5623–5626. [Google Scholar] [CrossRef]
  24. Schrage, B.R.; Nemykin, V.N.; Ziegler, C.J. BOSHPY Fluorophores: BODIPY Analogues with Single Atom Controlled Aggregation. Org. Lett. 2021, 23, 5246–5250. [Google Scholar] [CrossRef]
  25. Rao, Y.L.; Wang, S. Four-Coordinate Organoboron Compounds with a π-Conjugated Chelate Ligand for Optoelectronic Applications. Inorg. Chem. 2011, 50, 12263–12274. [Google Scholar] [CrossRef]
  26. Rodríguez, A.I.; Figueira, C.A.; Gomes, C.S.B.; Suresh, D.; Ferreira, B.; Di Paolo, R.E.; de Sa Pereira, D.; Días, F.B.; Calhorda, M.J.; Morgado, J.; et al. Boron complexes of aromatic 5-substituted iminopyrrolyl ligands: Synthesis, structure, and luminescence properties. Dalton Trans. 2019, 48, 13337–13352. [Google Scholar] [CrossRef]
  27. Li, P.; Chan, H.; Lai, S.L.; Ng, M.; Chan, M.Y.; Yam, V.W.W. Four-Coordinate Boron Emitters with Tridentate Chelating Ligand for Efficient and Stable Thermally Activated Delayed Fluorescence Organic Light-Emitting Devices. Angew. Chem. Int. Ed. 2019, 58, 9088–9094. [Google Scholar] [CrossRef]
  28. Murali, A.C.; Nayak, P.; Venkatasubbaiah, K. Recent advances in the synthesis of luminescent tetra-coordinated boron compounds. Dalton Trans. 2022, 51, 5751. [Google Scholar] [CrossRef]
  29. Kothavale, S.S.; Lee, J.Y. Three- and Four-Coordinate, Boron-Based, Thermally Activated Delayed Fluorescent Emitters. Adv. Opt. Mater. 2020, 8, 2000922. [Google Scholar] [CrossRef]
  30. Zhang, Z.; Zhang, H.; Jiao, C.; Ye, K.; Zhang, H.; Zhang, J.; Wang, Y. 2-(2-Hydroxyphenyl)benzimidazole-Based Four-Coordinate Boron-Containing Materials with Highly Efficient Deep-Blue Photoluminescence and Electroluminescence. Inorg. Chem. 2015, 54, 2652–2659. [Google Scholar] [CrossRef]
  31. Suresh, D.; Ferreira, B.; Lopes, P.S.; Gomes, C.S.B.; Krishnamoorthy, P.; Charas, A.; Vila-Viçosa, D.; Morgado, J.; Calhorda, M.J.; Maçanita, A.L.; et al. Boron complexes of aromatic ring fused iminopyrrolyl ligands: Synthesis, structure, and luminescence properties. Dalton Trans. 2016, 45, 15603–15620. [Google Scholar] [CrossRef] [PubMed]
  32. Bismillah, A.N.; Aprahamian, I. Fundamental studies to emerging applications of pyrrole-BF2 (BOPHY) fluorophores. Chem. Soc. Rev. 2021, 50, 5631–5649. [Google Scholar] [CrossRef] [PubMed]
  33. Cui, Y.; Liu, Q.D.; Bai, D.R.; Jia, W.L.; Tao, Y.; Wang, S. Organoboron Compounds with an 8-Hydroxyquinolato Chelate and Its Derivatives:  Substituent Effects on Structures and Luminescence. Inorg. Chem. 2005, 44, 601–609. [Google Scholar] [CrossRef] [PubMed]
  34. Ohtani, S.; Gon, M.; Tanaka, K.; Chujo, Y. The Design Strategy for an Aggregation- and Crystallization-Induced Emission-Active Molecule Based on the Introduction of Skeletal Distortion by Boron Complexation with a Tridentate Ligand. Crystals 2020, 10, 615. [Google Scholar] [CrossRef]
  35. Yarnton, O. Crystallizer; Version 1.171.37.35; Agilent Technologies: Oxford, UK, 2014. [Google Scholar]
  36. Dolomanov, O.V.; Bourhis, L.J.; Gildea, R.J.; Howard, J.A.K.; Puschmann, H. Olex2: A Complete Structure Solution, Refinement and Analysis Program. J. Appl. Cryst. 2009, 42, 339–341. [Google Scholar] [CrossRef]
  37. Sheldrick, G.M. ShelXT-Integrated space-group and crystal-structure determination. Acta Cryst. 2015, A71, 3–8. [Google Scholar] [CrossRef] [Green Version]
  38. Sheldrick, G.M. Crystal Structure Refinement with ShelXL. Acta Cryst. 2015, C27, 3–8. [Google Scholar]
  39. Macrae, C.F.; Bruno, I.J.; Chisholm, J.A.; Edgington, P.R.; McCabe, P.; Pidcock, E.; Rodriguez-Monge, L.; Taylor, R.; van de Streek, J.; Wood, P.A. Mercury CSD 2.0-New features for the visualization and investigation of crystal structures. J. Appl. Crystallogr. 2008, 41, 466–470. [Google Scholar] [CrossRef]
  40. Brandenburg, K. Diamond; Version 4.3.2; Crystal Impact GbR: Bonn, Germany, 2017. [Google Scholar]
  41. Hirshfeld, F.L. Bonded-atom fragments for describing molecular charge densities. Theor. Chim. Acta 1977, 44, 129–138. [Google Scholar] [CrossRef]
  42. Spackman, M.A.; McKinnon, J.J. Fingerprinting intermolecular interactions in molecular crystals. CrystEngComm 2002, 4, 378–392. [Google Scholar] [CrossRef]
  43. Wolff, S.K.; Grimwood, D.J.; McKinnon, J.J.; Jayatilaka, D.; Spackman, M.A. Crystal Explorer; Version 2.1; University of Western Australia: Perth, Australia, 2007. [Google Scholar]
  44. Hohenberg, P.; Kohn, W. Inhomogeneous Electron Gas. Phys. Rev. 1964, 136, B864–B871. [Google Scholar] [CrossRef] [Green Version]
  45. Kohn, W.; Sham, L.J. Self-Consistent Equations Including Exchange and Correlation Effects. Phys. Rev. 1965, 140, A1133–A1138. [Google Scholar] [CrossRef] [Green Version]
  46. Frisch, M.J.; Trucks, G.W.; Schlegel, H.B.; Scuseria, G.E.; Robb, M.A.; Cheeseman, J.R.; Scalmani, G.; Mennucci, V.B.; Petersson, G.A.; Nakatsuji, H.; et al. Gaussian 09; Revision A. 02; Gaussian Inc.: Wallingford, CT, USA, 2009. [Google Scholar]
  47. Dennington, R.; Keith, T.; Millam, J.; Eppinnett, K.; Hovell, W.L.; Gilliland, R. GaussView, version 5.0.9; Semichem, Inc.: Shawnee Mission, KS, USA, 2009. [Google Scholar]
  48. Stratmann, R.E.; Scuseria, G.E.; Frisch, M.J. An efficient implementation of time-dependent density-functional theory for the calculation of excitation energies of large molecules. J. Chem. Phys. 1998, 109, 8218–8224. [Google Scholar] [CrossRef]
  49. Burke, K.; Werschnik, J.; Gross, E.K.U. Time-dependent density functional theory: Past, present, and future. J. Chem. Phys. 2005, 123, 062206. [Google Scholar] [CrossRef] [Green Version]
  50. Zhao, Y.; Truhlar, D.G. The M06 suite of density functionals for main group thermochemistry, thermochemical kinetics, noncovalent interactions, excited states, and transition elements: Two new functionals and systematic testing of four M06-class functionals and 12 other functionals. Theor. Chem. Acc. 2008, 120, 215–241. [Google Scholar]
  51. Francl, M.M.; Pietro, W.J.; Hehre, W.J.; Binkley, J.S.; DeFrees, D.J.; People, J.A.; Gordon, M.S. Self-consistent molecular orbital methods. XXIII. A polarization-type basis set for second-row elements. J. Chem. Phys. 1982, 77, 3654–3665. [Google Scholar] [CrossRef] [Green Version]
  52. Scrocco, E.; Tomasi, J. Electronic Molecular Structure, Reactivity and Intermolecular Forces: An Euristic Interpretation by Means of Electrostatic Molecular Potentials. Adv. Quantum Chem. 1978, 11, 115–193. [Google Scholar]
  53. Wu, Q.; Esteghamatian, M.; Hu, N.X.; Popovic, Z.; Enright, G.; Tao, Y.; D’Iorio, M.; Wang, S. Synthesis, Structure, and Electroluminescence of BR2q (R = Et, Ph, 2-Naphthyl and q = 8-Hydroxyquinolato). Chem. Mater. 2000, 12, 79–83. [Google Scholar] [CrossRef]
  54. Jarzembska, K.N.; Kamiński, R.; Durka, K.; Kubsik, M.; Nawara, K.; Witkowska, E.; Wiloch, M.; Luliński, S.; Waluk, J.; Głowacki, I.; et al. New class of easily-synthesisable and modifiable organic materials for applications in luminescent devices. Dye. Pigment. 2017, 138, 267–277. [Google Scholar] [CrossRef]
  55. Yang, L.; Powell, D.R.; Houser, R.P. Structural variation in copper(i) complexes with pyridylmethylamide ligands: Structural analysis with a new four-coordinate geometry index, τ4. Dalton Trans. 2007, 9, 955–964. [Google Scholar] [CrossRef]
  56. Höpfl, H.J. The tetrahedral character of the boron atom newly defined—A useful tool to evaluate the N→B bond. J. Organomet. Chem. 1999, 581, 129–149. [Google Scholar] [CrossRef]
  57. Dar, A.A.; Ganie, A.A. Irreversible Thermochromism in Organic Salts of Sulfonated Anils. Cryst. Growth Des. 2020, 20, 3888–3897. [Google Scholar] [CrossRef]
  58. Duan, W.; Liu, B.; Gong, N.; Famulari, A.; Guo, F. Polymorphs and Transformations of the Solid Forms of Organic Salts of 5-Sulfosalicylic Acid and Isonicotinamide. Cryst. Growth Des. 2020, 20, 7606–7614. [Google Scholar] [CrossRef]
  59. Schmidtmann, M.; Wilson, C.C. Hydrogen transfer in pentachlorophenol–Dimethylpyridine complexes. CrystEngComm 2008, 10, 177–183. [Google Scholar] [CrossRef]
  60. Campos-Gaxiola, J.J.; García-Grajeda, B.A.; Hernández-Ahuactzi, I.F.; Guerrero-Álvarez, J.A.; Höpfl, H.; Cruz-Enríquez, A. Supramolecular networks in molecular complexes of pyridine boronic acids and polycarboxylic acids: Synthesis, structural characterization and fluorescence properties. CrystEngComm 2017, 19, 3760. [Google Scholar] [CrossRef]
  61. Etter, M.C. Encoding and decoding hydrogen-bond patterns of organic compounds. Acc. Chem. Res. 1990, 23, 120–126. [Google Scholar] [CrossRef]
  62. Garcia-Grajeda, B.A.; Höpfl, H.; Guerrero-Alvarez, J.A.; Campos-Gaxiola, J.J.; Cruz-Enríquez, A. 2,6-Dihy dr oxy-4-oxo-2-(pyridin-1-ium-3-yl)-4H-1,3,2-benzodioxaborinin-2-ide 0.67-hydrate. Acta Cryst. 2014, E70, o388–o389. [Google Scholar]
  63. Ruelas-Álvarez, G.Y.; Cárdenas-Valenzuela, A.J.; Cruz-Enríquez, A.; Höpfl, H.; Campos-Gaxiola, J.J.; Rodríguez-Rivera, M.A.; Rodríguez-Molina, B. Exploration of the Luminescence Properties of Organic Phosphate Salts of 3-Quinoline- and 5-Isoquinolineboronic Acid. Eur. J. Inorg. Chem. 2019, 2019, 2707–2724. [Google Scholar] [CrossRef]
  64. Główka, M.L.; Martynowski, D.; Kozłowska, K. Stacking of six-membered aromatic rings in crystals. J. Mol. Struct. 1999, 474, 81–89. [Google Scholar] [CrossRef]
  65. Thakuria, R.; Nath, N.K.; Saha, B.K. The Nature and Applications of π–π Interactions: A Perspective. Cryst. Growth Des. 2019, 19, 523–528. [Google Scholar] [CrossRef]
  66. Ganie, A.A.; Ahangar, A.A.; Dar, A.A. Sulfonate…Pyridinium Supramolecular Synthon: A Robust Interaction Utilized to Design Molecular Assemblies. Cryst. Growth Des. 2019, 19, 4650–4660. [Google Scholar] [CrossRef]
  67. Ahmad, I.; Ganie, A.A.; Dar, A.A. Achievement of enhanced solubility and improved optics in molecular complexes based on a sulfonate–Pyridinium supramolecular synthon. CrystEngComm 2020, 22, 3933–3942. [Google Scholar] [CrossRef]
  68. Desiraju, G.R. The C−H⋯O Hydrogen Bond:  Structural Implications and Supramolecular Design. Acc. Chem. Res. 1996, 29, 441–449. [Google Scholar] [CrossRef] [PubMed]
  69. Ganie, A.A.; Ismail, T.M.; Sajith, P.K.; Dar, A.A. Validation of the supramolecular synthon preference through DFT and physicochemical property investigations of pyridyl salts of organo-sulfonates. New J. Chem. 2021, 45, 4780–4790. [Google Scholar] [CrossRef]
  70. Spackman, M.A.; Jayatilaka, D. Hirshfeld surface analysis. CrystEngComm 2009, 11, 19–32. [Google Scholar] [CrossRef]
  71. Spackman, M.A.; Byrom, P.G. A novel definition of a molecule in a crystal. Chem. Phys. Lett. 1997, 267, 215–220. [Google Scholar] [CrossRef]
  72. Loots, L.; Barbour, L.J. A simple and robust method for the identification of π–π packing motifs of aromatic compounds. CrystEngComm 2012, 14, 300–304. [Google Scholar] [CrossRef]
  73. McKinnon, J.J.; Jayatilaka, D.; Spackman, M.A. Towards quantitative analysis of intermolecular interactions with Hirshfeld surfaces. Chem. Commun. 2007, 0, 3814–3816. [Google Scholar] [CrossRef]
  74. Wood, P.A.; McKinnon, J.J.; Parsons, S.; Pidcock, E.; Spackman, M.A. Analysis of the compression of molecular crystal structures using Hirshfeld surfaces. CrystEngComm 2008, 10, 368–376. [Google Scholar] [CrossRef]
  75. McKinnon, J.J.; Spackman, M.A.; Mitchell, A.S. Novel tools for visualizing and exploring intermolecular interactions in molecular crystals. Acta Cryst. 2004, B60, 627–668. [Google Scholar] [CrossRef]
  76. Capelli, S.C.; Bürgi, H.B.; Dittrich, B.; Grabowsky, S.; Jayatilaka, D. Hirshfeld atom refinement. IUCrJ 2014, 1, 361–379. [Google Scholar] [CrossRef] [Green Version]
  77. Woinska, M.; Jayatilaka, D.; Spackman, M.A.; Edwards, A.J.; Dominiak, P.M.; Wozniak, K.; Nishibori, E.; Sugimoto, K.; Grabowsky, S. Hirshfeld atom refinement for modelling strong hydrogen bonds. Acta Cryst. 2014, A70, 483–498. [Google Scholar] [CrossRef]
  78. Politzer, P.; Truhlar, D.G. Introduction: The role of the electrostatic potential in chemistry. In Chemical Applications of Atomic and Molecular Electrostatic Potentials; Politzer, P., Truhlar, D.G., Eds.; Springer: Boston, MA, USA, 1981. [Google Scholar] [CrossRef]
  79. Murray, J.S.; Sen, K. Molecular Electrostatic Potentials, Concepts and Applications, 1st ed.; Elsevier: Amsterdam, The Netherlands, 1996. [Google Scholar]
  80. Barba, V.; Vázquez, J.; López, F.; Santillan, R.; Farfán, N. Mono- and diboronates derived from tridentate ONO ligands and arylboronic acids. J. Organomet. Chem. 2005, 690, 2351–2357. [Google Scholar] [CrossRef]
  81. Gonzalez-Hernández, A.; León-Negrete, A.; Galván-Hidalgo, J.M.; Gómez, E.; Barba, V. Hexacyclic monomeric boronates derived from tridentate shiff-base ligands fused by dative N → B bond. J. Mol. Struct. 2020, 1207, 127779. [Google Scholar] [CrossRef]
  82. Smith, M.K.; Northrop, B.H. Vibrational Properties of Boroxine Anhydride and Boronate Ester Materials: Model Systems for the Diagnostic Characterization of Covalent Organic Frameworks. Chem. Mater. 2014, 26, 3781–3795. [Google Scholar] [CrossRef]
  83. Videnova-Adrabinska, V.; Nowak, A.M.; Wilk, M.; Janczak, J.; Baran, J. Crystal polymorphism of sodium benzene-1,3-dicarboxy-5-sulfonate monohydrate. J. Mol. Struct. 2011, 996, 53–63. [Google Scholar] [CrossRef]
  84. Furer, V.L.; Vandyukov, A.E.; Popova, E.V.; Solovieva, S.E.; Antipin, I.S.; Kovalenko, V.I. Vibrational spectra study of p-sulfonatocalix[4]arene containing azobenzene groups. J. Mol. Struct. 2020, 1200, 127058. [Google Scholar] [CrossRef]
  85. Sandhu, B.; Fonari, M.S.; Sawyer, K.; Timofeeva, T.V. A series of crystalline solids composed of aminopyridines and succinic, fumaric, and sebacic acids. J. Mol. Struct. 2013, 1052, 125–134. [Google Scholar] [CrossRef]
  86. Faizan, M.; Alam, M.J.; Afroz, Z.; Nunes Rodrigues, V.H.; Ahmad, S. Growth, structure, Hirshfeld surface and spectroscopic properties of 2-amino-4-hydroxy-6-methylpyrimidinium-2,3-pyrazinedicorboxylate single cristal. J. Mol. Struct. 2018, 1155, 695–710. [Google Scholar] [CrossRef]
  87. Zhou, Z.; Parr, R. G Activation hardness: New index for describing the orientation of electrophilic aromatic substitution. J. Am. Chem. Soc. 1990, 112, 5720–5724. [Google Scholar] [CrossRef]
  88. Jacquemin, D.; Perpète, E.A.; Ciofini, L.; Adamo, C.; Valero, R.; Zhao, Y.; Truhlar, D.G. On the Performances of the M06 Family of Density Functionals for Electronic Excitation Energies. J. Chem. Theory Comput. 2010, 6, 2071–2085. [Google Scholar] [CrossRef]
  89. Insuasty, D.; Cabrera, L.; Ortiz, A.; Insuasty, B.; Quiroga, J.; Abonia, R. Synthesis, photophysical properties and theoretical studies of new bis-quinolin curcuminoid BF2-complexes and their decomplexed derivatives. Spectrochim. Acta Part A Mol. Biomol. Spectrosc. 2020, 230, 118065. [Google Scholar] [CrossRef]
  90. Frath, D.; Massue, J.; Ulrich, G.; Ziessel, R. Luminescent Materials: Locking π-Conjugated and Heterocyclic Ligands with Boron(III). Angew. Chem. Int. Ed. 2014, 53, 2290–2310. [Google Scholar] [CrossRef]
  91. Urban, M.; Durka, K.; Górka, P.; Wiosna-Sałyga, G.; Nawara, K.; Jankowski, P.; Luliński, S. The effect of locking π-conjugation in organoboron moieties in the structures of luminescent tetracoordinate boron complexes. Dalton Trans. 2019, 48, 8642–8663. [Google Scholar] [CrossRef]
  92. Más-Montoya, M.; Montenegro, M.F.; Espinosa Ferao, A.; Tárraga, A.; Rodríguez-López, J.N.; Curiel, D. Rigid π-Extended Boron Difluoride Complex with Mega-Stokes Shift for Bioimaging. Org. Lett. 2020, 22, 3356–3360. [Google Scholar] [CrossRef]
  93. Sharma, S.; Wei, Z.; Grozema, F.C.; Sengupta, S. Structure–Property relationships in multi-stimuli responsive BODIPY-biphenyl-benzodithiophene TICT rigidochromic rotors exhibiting (pseudo-)Stokes shifts up to 221 nm. Phys. Chem. Chem. Phys. 2020, 22, 25514–25521. [Google Scholar] [CrossRef]
  94. Massue, J.; Jacquemin, D.; Ulrich, G. Boranils: Versatile Multifunctional Organic Fluorophores for Innovative Applications. Organics 2021, 2, 20. [Google Scholar] [CrossRef]
  95. Zhang, L.; Li, X.L.; Luo, D.; Xiao, P.; Xiao, W.; Song, Y.; Ang, Q.; Liu, B. Strategies to Achieve High-Performance White Organic Light-Emitting Diodes. Materials 2017, 10, 1378. [Google Scholar] [CrossRef] [Green Version]
  96. Qin, Y.; Kiburu, I.; Shah, S.; Jäkle, F. Luminescence tuning of organoboron quinolates through substituent variation at the 5-position of the quinolato moiety. Org. Lett. 2006, 8, 5227–5230. [Google Scholar] [CrossRef]
  97. Zhang, Z.; Bi, H.; Zhang, Y.; Yao, D.; Gao, H.; Fan, Y.; Zhang, H.; Wang, Y.; Wang, Y.; Chen, Z.; et al. Luminescent Boron-Contained Ladder-Type π-Conjugated Compounds. Inorg. Chem. 2009, 48, 7230–7236. [Google Scholar] [CrossRef]
  98. Guieu, S.; Esteves, C.I.; Rocha, J.; Silva, A.M. Multicomponent Synthesis of Luminescent Iminoboronates. Molecules 2020, 25, 6039. [Google Scholar] [CrossRef] [PubMed]
  99. Gao, H.Y.; Shen, Q.J.; Zhao, X.R.; Yan, X.Q.; Pang, X.; Jin, W.J. Phosphorescent co-crystal assembled by 1,4-diiodotetrafluorobenzene with carbazole based on C–I⋯π halogen bonding. J. Mater. Chem. 2012, 22, 5336–5343. [Google Scholar] [CrossRef]
  100. Bolton, O.; Lee, K.; Kim, H.J.; Lin, K.Y.; Kim, J. Activating efficient phosphorescence from purely organic materials by crystal design. Nat. Chem. 2011, 3, 415. [Google Scholar] [CrossRef]
  101. Li, Q.; Tang, Y.; Hu, W.; Li, Z. Fluorescence of Nonaromatic Organic Systems and Room Temperature Phosphorescence of Organic Luminogens: The Intrinsic Principle and Recent Progress. Small 2018, 14, 1801560. [Google Scholar] [CrossRef] [PubMed]
  102. Galer, V.; Korosec, R.C.; Vidmar, M.; Šket, B. Crystal Structures and Emission Properties of the BF2 Complex 1-Phenyl-3-(3,5-dimethoxyphenyl)-propane-1,3-dione: Multiple Chromisms, Aggregation- or Crystallization-Induced Emission, and the Self-Assembly Effect. J. Am. Chem. Soc. 2014, 136, 7383–7739. [Google Scholar] [CrossRef] [PubMed]
  103. Chai, Z.; Wang, C.; Wang, J.; Liu, F.; Xie, Y.; Zhang, Y.Z.; Li, J.R.; Li, Q.; Li, Z. Abnormal room temperature phosphorescence of purely organic boron-containing compounds: The relationship between the emissive behaviorand the molecular packing, and the potential related applications. Chem. Sci. 2017, 8, 8336–8344. [Google Scholar] [CrossRef] [Green Version]
  104. Gao, H.; Xu, D.; Wang, Y.; Zhang, C.; Yang, Y.; Liu, X.; Han, A.; Wang, Y. Aggregation-induced emission and mechanofluorochromism of tetraphenylbutadiene modified β-ketoiminate boron complexes. Dye. Pigment. 2018, 150, 165–173. [Google Scholar] [CrossRef]
  105. Potopnyk, M.A.; Volyniuk, D.; Luboradzki, R.; Lazauskas, A.; Grazulevicius, J.V. Aggregation-Induced Emission-Active Carbazolyl-Modified Benzo[4,5]thiazolo[3,2-c]oxadiazaborinines as Mechanochromic Fluorescent Materials. Eur. J. Org. Chem. 2021, 2021, 2772–2781. [Google Scholar] [CrossRef]
  106. Hong, Y.; Lam, J.W.Y.; Tang, B.Z. Aggregation-induced emission. Chem. Soc. Rev. 2011, 40, 5361–5388. [Google Scholar] [CrossRef] [Green Version]
  107. Chen, Y.; Lam, J.W.Y.; Kwok, R.T.K.; Liu, B.; Tang, B.Z. Aggregation-induced emission: Fundamental understanding and future developments. Mater. Horiz. 2019, 6, 428–433. [Google Scholar] [CrossRef]
  108. Yin, P.A.; Wan, Q.; Niu, Y.; Peng, Q.; Wang, Z.; Li, Y.; Qin, A.; Shuai, Z.; Tang, B.Z. Theoretical and Experimental Investigations on the Aggregation-Enhanced Emission from Dark State: Vibronic Coupling Effect. Adv. Electron. Mater. 2020, 6, 2000255. [Google Scholar] [CrossRef]
  109. Cui, Y.; Wang, S. Diboron and Triboron Compounds Based on Linear and Star-Shaped Conjugated Ligands with 8-Hydroxyquinolate Functionality: Impact of Intermolecular Interaction and Boron Coordination on Luminescence. J. Org. Chem. 2006, 71, 6485–6496. [Google Scholar] [CrossRef]
  110. Chen, S.; Qiu, R.; Yu, Q.; Zhang, X.; Wei, M.; Dai, Z. Boranil dyes bearing tetraphenylethene: Synthesis, AIE/AIEE effect properties, pH sensitive properties and application in live cell imaging. Tetrahedron Lett. 2018, 59, 2671–2678. [Google Scholar] [CrossRef]
  111. Vaz, P.A.A.M.; Rocha, J.; Silva, A.M.S.; Guieu, S. Aggregation-induced emission enhancement of chiral boranils. New J. Chem. 2018, 42, 18166–18171. [Google Scholar] [CrossRef]
  112. Varghese, S.; Das, S. Role of Molecular Packing in Determining Solid-State Optical Properties of π-Conjugated Materials. J. Phys. Chem. Lett. 2011, 2, 863–873. [Google Scholar] [CrossRef]
  113. Li, Q.; Li, Z. The Strong Light-Emission Materials in the Aggregated State: What Happens from a Single Molecule to the Collective Group. Adv. Sci. 2017, 4, 1600484. [Google Scholar] [CrossRef]
  114. Yan, X.; Zhu, P.; Zhou, Z.; Yang, H.; Lana, H.; Xiao, S. Aggregation-induced emission enhancement (AIEE)-active boron-difluoride dyes with reversible mechanochromic fluorescence. RSC Adv. 2019, 9, 35872–35877. [Google Scholar] [CrossRef] [Green Version]
  115. Chattapadhyay, D.; Mondal, S.; Kumar, S.; Haldar, D. Topology-Controlled AIEE of Iminocoumarin Luminophores. Chem. Asian J. 2021, 16, 2723–2728. [Google Scholar] [CrossRef]
  116. Gu, L.; Liu, R.; Shi, H.; Wang, Q.; Song, G.; Zhu, X.; Yuan, S.; Zhu, H. Synthesis, Luminescent Properties of aza-Boron-Diquinomethene Difluoride Complexes and Their Application for Fluorescent Security Inks. J. Fluoresc. 2016, 26, 407–412. [Google Scholar] [CrossRef]
  117. Yu, X.; Zhang, H.; Yu, J. Luminescence anti-counterfeiting: From elementary to advanced. Aggregate 2021, 2, 20–34. [Google Scholar] [CrossRef]
Scheme 1. Synthetic routes and molecular structures of compounds 1 and 2.
Crystals 12 00783 sch001
Figure 1. (a) Perspective view of the asymmetric unit of compound 1 with atom labeling and ellipsoids drawn at the 50% probability level. Selected bond parameters: B1-N1 = 1.6422(19), B1-O1 = 1.5176(18). B1-O2 = 1.4121(18), B1-C10 = 1.614(2) Å, O1-B1-N1 = 98.25(10), O1-B1-C10 = 109.84(11), O2-B1-O1 = 114.71(12), O2-B1-N1 = 111.63(11), O2-B1-C10 = 110.87(12), C10-B1-N1 = 110.94(11)°. (b) Angle between the quinoline and pyridinium rings in 1.
Crystals 12 00783 g001
Figure 2. (a) Perspective view of the asymmetric unit of compound 2 with atom labeling and ellipsoids drawn at the 50% probability level. Selected bond parameters: B1-N1 = 1.665(3), B1-O1 = 1.516(2), B1-O2 = 1.400(2), B1-C10 = 1.621(3) Å, O1-B1-N1 = 97.69(13), O1-B1-C10 = 110.26(15), O2-B1-O1 = 114.78(16), O2-B1-N1 = 113.14(16), O2-B1-C10 = 112.00(16), C10-B1-N1 = 107.99(14)°. (b) Angle between the quinoline and pyridinium rings in 2.
Crystals 12 00783 g002
Figure 3. Fragments of the crystal structure and Hirshfeld surface map of compound 1, showing hydrogen-bonding motifs and π–π interactions (af). Symmetry operators: (i) 1-x,1-y,1-z; (ii) 2-x,1-y,1-z; (iii) x,1.5-y,0.5+z; (iv) 1-x,2-y,1-z; (v) −1+x,y,z; (vi) 1-x,−0.5+y,0.5-z; (vii) x,−1+y,z; (viii) 1+x,0.5-y,0.5+z; (ix) 2-x,0.5+y,1.5-z; (x) x,0.5-y,0.5+z; (xi) 2-x,-y,1-z.
Crystals 12 00783 g003
Figure 4. Fragments of the crystal structure and Hirshfeld surface map of compound 2, showing hydrogen-bonding motifs and π–π interactions (ad). Symmetry operators: (i) 1-x,2-y,1-z; (ii) x,1+y,−1+z; (iii) x,−1+y,1+z; (iv) 1-x,1-y,1-z; (v) −1+x,y,z: (vi) −1+x,−1+y,1+z; (vii) 2-x,1-y,1-z; (viii) 2+x,y,−1+z.
Crystals 12 00783 g004
Scheme 2. Cyclic motifs formed through O−H⋅⋅⋅O/O and N+−H⋅⋅⋅O/O hydrogen bonds in the crystal structures of boronic esters 1 and 2.
Crystals 12 00783 sch002
Figure 5. (a) Hirshfeld surface (dnorm), (b) shape index, and (c) curvedness maps of boronic esters 3PBA-8HQSA (1) and 4PBA-8HQSA (2).
Crystals 12 00783 g005
Figure 6. Fingerprint plots of compound 1 and 2.
Crystals 12 00783 g006
Figure 7. Percentages of contribution to the molecular interactions present in the Hirshfeld surfaces of complexes 1 (left) and 2 (right).
Crystals 12 00783 g007
Figure 8. Electrostatic potential mapped on the isodensity surface of the molecular structure of 1 (left) and 2 (right). The color code thresholds are red −0.1 and blue +0.1 (calculated at the DFT level M06/6-31G (d)).
Crystals 12 00783 g008
Figure 9. Molecular orbital surfaces computed at the M06/6-31G(d) level for the HOMO and LUMO orbitals of compounds 1 and 2.
Crystals 12 00783 g009
Figure 10. (a) Experimental UV-Vis absorption spectra of (a) 1 and (b) 2 in ethanol solution (1.0 × 10⁻⁴ M, blue) and TD-DFT calculated transitions (black).
Crystals 12 00783 g010
Figure 11. Emission spectra of 1 and 2 in the solid state at room temperature upon excitation at λex = 393 nm. Inset: Images of crystalline 1 and 2 under 365 nm UV-light and CIE color codes for the emission in the solid state.
Crystals 12 00783 g011
Figure 12. Normalized photoluminiscence spectra (λex = 389 nm) of 1 (a) and 2 (b), respectively, in different solvents (1.0 × 10⁻⁵ M, slit: 10/6). Photographic images of 1 (c) and 2 (d) in various solvents under a UV lamp (1.0 × 10⁻⁵ M, λex = 365 nm).
Crystals 12 00783 g012
Figure 13. (a) Room-temperature emission spectra of 1 in MeOH/THF mixtures of different proportions upon excitation at 324 nm. (b) Plot showing the increase in the relative emission intensity of 1 in a MeOH-THF solvent mixture with increasing THF fraction. Inset: vials of the various samples under 365 nm UV-lamp illumination.
Crystals 12 00783 g013
Figure 14. (a) Room-temperature emission spectra of 2 in MeOH/THF solvent mixtures of different proportions upon excitation at 324 nm. (b) Plot showing the increase in the relative emission intensity of 2 in a MeOH-THF solvent mixture with increasing THF fraction. Inset: vials of the various samples under 365 nm UV-lamp irraditation.
Crystals 12 00783 g014
Figure 15. Results of security-ink tests using solutions of complexes 1 and 2 in ethanol with concentrations of 1.0 × 10⁻³, 1.0 × 10⁻⁴, and 1.0 × 10⁻⁵ M, under ambient light and UV light (365 and 254 nm).
Crystals 12 00783 g015
Publisher’s Note: MDPI stays neutral with regard to jurisdictional claims in published maps and institutional affiliations.

