1. Introduction
The plastic flow strength levels, σ
ε, of single crystal and polycrystalline materials increase more strongly than would otherwise be expected in split-Hopkinson pressure bar (SHPB) tests performed at applied strain rates, (dε/dt), of ~10
4 s
−1 or higher. Initial σ
ε measurements had been reported for polycrystalline copper by Follansbee, Regazzoni and Kocks [
1]. More recently, additional SHPB measurements were reported by Lea, Brown and Jardine [
2] and compared with the work by Follansbee et al. Another favorable compilation of copper measurements was presented recently by Jia, Rusinek, Pesci et al. [
3] as part of their study of the analogous high-strain-rate behavior exhibited in shear tests of 304 stainless steel material. The upturn in the strain-rate-dependent σ
ε was initially proposed to be due to the onset of a “phonon drag resistance” to the motion of individual dislocations. Such resistance was described theoretically to be paramount when the driving force for dislocation motion was higher than the thermal stress associated with dislocation blocking obstacles. For copper and related face-centered cubic (fcc) metals, the thermal obstacles at conventional strain rates are known to be dislocation intersections.
The determination of such strength properties at higher loading rates has practical and theoretical importance. For example, current energy-based, atomic fusion, research activities involve subjecting metals to their upper-limiting strength levels under extremely high-rate loading conditions. A current world-wide research activity is to obtain reliable constitutive equation predictions for metal performances under these conditions. Of particular interest is to quantitatively relate such material performances and the equations describing them to the atomic-scale dislocation mechanisms capable of providing a fundamental basis for understanding potentially applicable material strength properties and enhancing their utilization.
Armstrong, Arnold and Zerilli [
4] first experimentally associated the strong upturn in σ
ε for the Follansbee et al. measurements with other substantially higher flow stress levels reported for shock wave impact experiments performed by Swegle and Grady [
5]. The different experiments were shown on a dislocation mechanics model basis also to be connected on a flow stress versus strain rate basis by means of a limiting condition being obtained in a thermal activation–strain rate analysis (TASRA) description. Very importantly, the value of the TASRA-determined thermal activation volume, v*, that is to be described in detail in the present report was shown to be increasingly reduced for copper beginning at the upturn in the SHPB measurements and, to reach a limiting small value determined under shock loading, to be equal to the dislocation Burgers vector cubed, b
3. The reduction in v* was taken to be indicative of the flow stress upturn being caused by an enhanced rate of dislocation generation and consequent multiplication of dislocation intersections. The subject has been recently reviewed and updated [
6]. Other connections were made with a number of parameters derived from simulated dislocation model descriptions of shock behavior. The present report extends the work to include a model description for shock-induced dislocation generation at the propagating shock front and to establish a relationship with the results obtained in other recently reported investigations. Additional parametric evaluations are assessed over a wider range in strain rates; in particular, computations are presented for the v*-related engineering, strain rate sensitivity, parameter, m = [∆lnσ/∆ln(dε/dt)]
T.
2. The Dislocation Mechanics of Rate-Dependent Deformation
Figure 1 provides a compilation of SHPB and shock measurements based on the recent work of Lea et al. [
2] and including the previous Follansbee et al. and dislocation mechanics descriptions of high-rate deformations [
6]. The open-diamond and filled-circle measurements from Lea et al. also include open-circle measurements made afterwards at the indicated strain rates to demonstrate that the strain hardening had been largely retained, as normally occurs for “shock hardening”. The approximately linear-fitted lower strain rate Lea et al. and Follansbee et al. measurements, in the latter case made at a compressive strain, ε = 0.15, are matched in the figure in each case with the face-centered cubic (fcc) form of the Z–A relationship for the flow stress, σ
ε, that is expressed as [
7]
In Equation (1), the σG term is attributed to athermal dislocation density and solute influences on the flow stress, B0 is the thermal stress at absolute temperature T = 0, εr is a reference strain for dynamic recovery, α = α0–α1ln(dε/dt) for strain rate dependence, (dε/dt), and kεℓ−1/2 is a Hall–Petch term for polycrystal grain size influence.
The strain rate enters into Equation (1) as (dε/dt)
α1T, for which α
1 = k
B/W
0, k
B is Boltzmann’s constant, and W
0 ≈ 3.1 × 10
−20 J is a constant. On this basis, a dislocation mechanics-based strain rate exponent, m* = k
BT/W
0, is obtained in Equation (1) for the lower strain rate effect. As will be seen subsequently, it is important to distinguish between m* for the specific thermal activation-based strain rate sensitivity and the determination of an m parameter for the total logarithmic dependence of stress on the logarithm of strain rate. Also in
Figure 1, the dashed curve applies for the extension to lower stresses of the σ
ε = C(dε/dt) [1/4] relationship determined at higher shock pressures by Swegle and Grady [
5]. By comparison, the nearly vertical linear stress dependence applies for a dislocation mechanics prediction from the TASRA relation subject to assumption of a constant lower value of the activation volume parameter, v* = v
0, being reached as expressed in the modified TASRA relationship [
6]:
In Equation (2), U
0 is a reference Gibbs free energy at a highest strain rate, (dε/dt)
0, and k
B is Boltzmann’s constant, 1.38 × 10
−23 J. The limiting value of v
0 ≈ b
3 determined from the dependence of σ
ε on (dε/dt) had been determined for copper from the linear strain rate dependence shown in
Figure 1. The reduced v* value is attributed to a substantial increase in the dislocation density. Estimations of the {U
0, (dε/dt)
0} parameters in Equation (2) are to be obtained in the present report.
2.1. The Thermal Activation Volume, v* = A*b
The TASRA-based thermal activation volume that corresponds to an activated slip area, A*, multiplied by the dislocation Burgers vector is evaluated in experiments as
In Equation (3), (dγ/dt) is the shear strain rate, equal to m
T(dε/dt) through the Taylor orientation factor, m
T, and τ
Th is the thermal component of stress, equal to σ
Th/m
T, and is dependent on strain rate and temperature [
8]. The dislocation model description of v* is taken to be essentially dependent only on τ
Th.
Figure 2 shows a recent (added-to) compilation of v* versus τ
Th measurements including determinations for shock loading [
6]. An inverse dependence of v*on τ is indicated as
The constant W
0 = 3.1 × 10
−20 J shown in
Figure 2, as originally obtained from a plot of various conventional test measurements, is extended to include determinations for a number of shock measurements. The open-triangle points were determined from model dislocation simulations reported for shocked tantalum by Ravelo, Germann, Guerrero, An and Holian [
9]. Very importantly, the parameter W
0 is seen also to be contained in the strain rate exponent factor described on a dislocation mechanics model basis in the text below Equation (1).
2.2. Higher Strain Rates—Smaller Shock-Induced Dislocation Loop Dimensions
Meyers, Jarmakani, Bringa and Remington [
10] have described details of various dislocation structures associated with shock-induced deformations. In particular, a number of early models proposed for dislocation nucleations and their consequent arrangements were assessed. Meyers et al. pointed to experimental results obtained by Trueb [
11] of a highest dislocation density of ~10
16 m
−2 being observed via transmission electron microscopy for a compressive stress of ~50 GPa applied to nickel material. Here,
Figure 3a,b provide an additional model that was proposed to satisfy the ideal condition of one-dimensional strain being achieved at a propagating shock front [
12,
13]. The model was developed on the premise that a sufficiently high compressive strain imposed at all nano-dimensional points along the shock front could not be relaxed by the larger-scale micrometer displacement of a residual dislocation density [
4,
14]. Thus, the top-corner of
Figure 3a provides a localized shear mechanism for the formation of a prismatic dislocation loop.
Figure 3b shows a three-dimensional arrangement of such loops being intersected by an inclined slip plane. The shock hardening associated with “cutting through” such loops is suggested to relate to the post SHPB hardening depicted by Lea et al. [
2] in
Figure 1.
Germann, Tanguy, Holian, Lomdahl et al. have performed molecular dynamics (MD) calculations applied to the formation of periodic dislocation loop formations for <100> and <111> shock front propagations in a perfect copper crystal [
15]. Zeretsky [
16] has provided quantitative model calculations for an fcc crystal lattice of such a dislocation multiplication behind a shock front. Nano-scale partial dislocations separated in accordance with their stacking fault energies were assessed for aluminum, nickel and copper crystals. A resultant dislocation structure not unlike that shown in
Figure 3b was described. Most importantly, a characteristic time of 10
−9–10
−10 s was estimated for dislocation multiplication. The inverse time period provides an estimation of a highest strain rate, (dε/dt) = 10
10 s
−1. Meyers et al. [
10] have produced the same strain rate estimation. On this basis, Equation (2) for a limiting small value of v*, as applied to
Figure 2 and Equation (2), leads to a value of U
0 = 5.4 × 10
−20 J. The calculated value of U
0 is not very different from the value of W
0 = 3.1 × 10
−20 J, relating to Equation (4). Both values are taken to be representative of the Gibbs free energy for thermal activation at zero thermal stress.
3. Discussion
Agnihotri and Van der Giessen
[17] have applied the method of discrete dislocation plasticity (DDP) to investigate the rate-dependent plasticity of copper leading from SHPB measurements to shock impacting. A comparison was made with the flow stress dependence on strain rate measured by Follansbee et al. [
1]. The DDP simulation of the dislocation density produced at different applied strain rates in the range of 100 to 25,000 s
−1 was found to depend directly on the rate of dislocation generation. A generation rate, (dρ/dt) ≈ 4.4 × 10
20 m
−2 s
−1, is computed at the highest strain rate to compare with a far higher rate of (dρ/dt) ≈ 4 × 10
26 m
−2 s
−1 determined from the review by Meyers et al. [
10] via multiscale dislocation dynamic plasticity (MDDP) simulations of shock propagation during tens of picoseconds in copper. Agnihotri and Van der Giessen also investigated the influences on rate sensitivity of thermal-type dislocation (blocking) obstacles, density of dislocation sources and grain size. A “dislocation drag” resistance for individual dislocation movement was included.
As mentioned earlier, such lattice phonon resistance, for example, becomes paramount when a dislocation is driven at a stress level above the barrier provided by TASRA-type obstacle resistance. Then, a direct proportionality of shear stress on strain rate obtains as demonstrated in the interpretation of gas-gun driven shock measurements made on copper [
14,
18]. Those measurements were obtained over a higher range in flow stresses between 8 and 20 GPa as compared to an upper stress level of ~3 GPa to be described in the present report and compared also to a much higher stress level of ~232 GPa for the high pressure solid state phase transformation of copper, not to downplay the importance of investigations of such higher stress-induced phase transformation studies. For copper, Luscher, Mayeur, Mourad, Hunter and Kenamond [
19] have produced dislocation drag-based model calculations with higher phonon drag coefficients seemingly in agreement with the results presented in [
14].
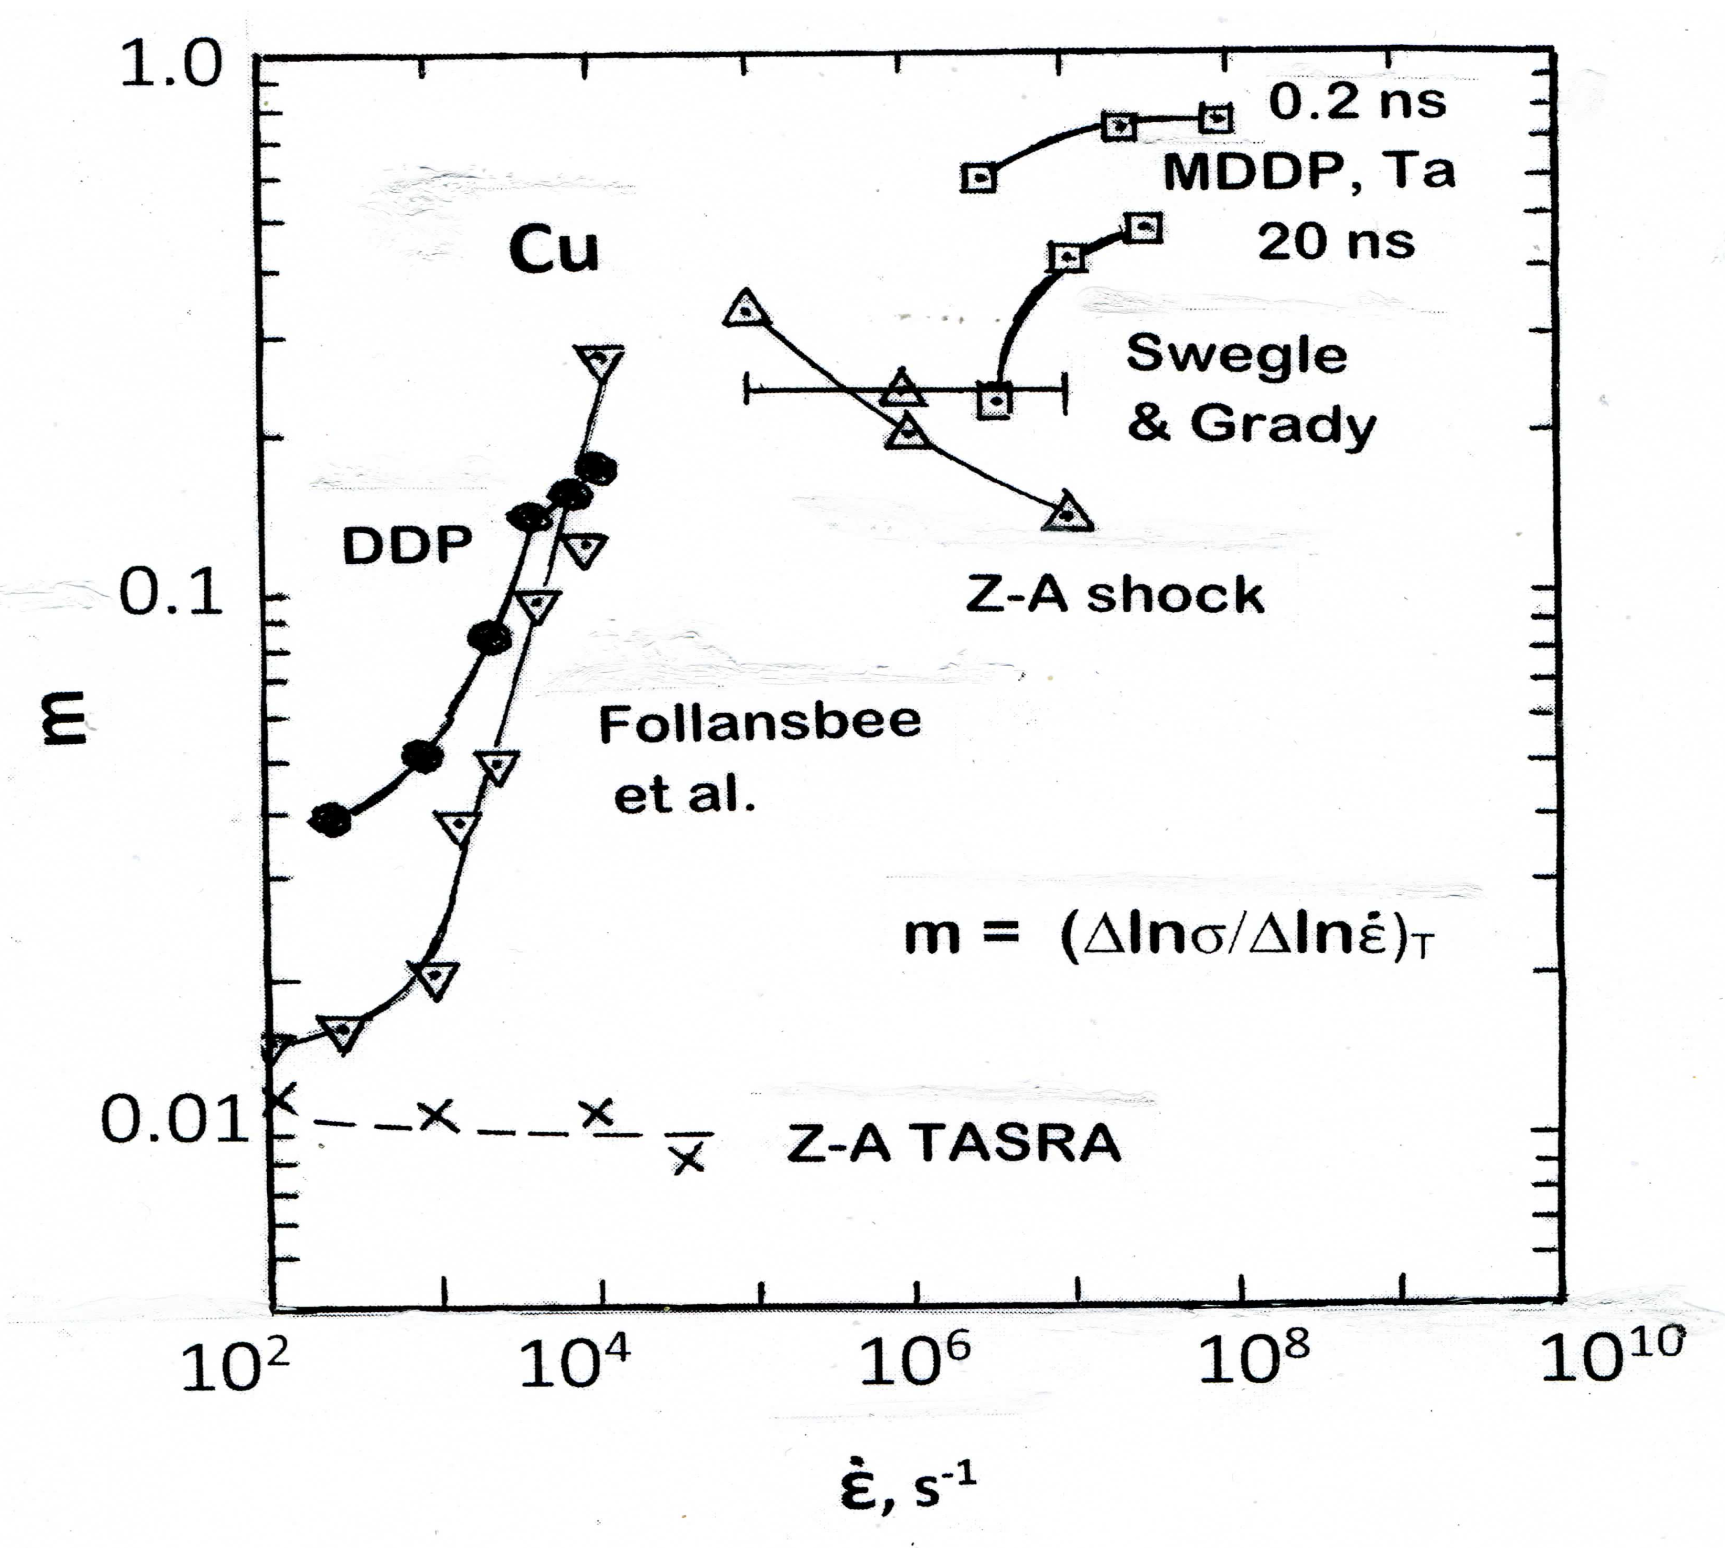
3.1. Extended Rate Dependence
Figure 4 shows an extended range of measurements and calculations based on evaluating the strain rate sensitivity dependence of plasticity in terms of the alternative engineering parameter, m, employed by Agnihotri and Van der Giessen [
17] as
In Equation (5), σ
ε is the total flow stress. It might be noted that the value of m = m
Tk
BT/v*σ, as related to Equation (3) and
Figure 2, is a relatively complicated parameter.
In
Figure 4, the open-triangle, Follansbee et al. [
1], and filled circle, DDP, calculations of Agnihroti and Van der Giessen [
17] are compared with crossed Z-A TASRA [
7] and open-triangle, Z-A shock [
14], as well as with Swegle and Grady [
5] copper measurements and added open-square, MDDP calculations made for tantalum crystals [
20]. The values of m were computed in accordance with the Equation (2) Z-A shock relationship as
Figure 4 shows, first, that a favorable comparison is obtained between the highest (calculated) DDP [
17] and Follansbee et al. [
1] SHPB results and the shock measurements [
5,
14]. The m values appear to be in agreement with strain-rate-dependent measurements reported for copper over a range in grain sizes by Mao, An, Liao and Wang [
21]. Very interestingly, Mao et al. divide m into TASRA and viscous drag components on a constitutive equation basis. Of particular interest in
Figure 4 are the MDDP calculations for tantalum crystals. The m values were computed directly from determination of the flow stress dependence on strain rate. Dislocation drag effects were included for the isentropic compression test simulations and for which the fastest rise time of 2 × 10
−10 s compares favorably with the characteristic time period determined by Zaretsky [
16] and by Meyers [
10] for generation of a nano-scale dislocation structure. Armstrong et al. [
13] had proposed a nano-scale twin structure to explain the value of v* determined for shocked tantalum material.
3.2. Temperature Effect
Kanel, Savinykh, Garkushin and Razorenov [
22] have reported flow stress measurements made on shock impact plate tests performed on annealed copper material at temperatures of 293, 983 and 1123 K.
Figure 5 shows a comparison of the measurements with those previously described in the present report [
1,
5,
14], compared also with
Figure 1. An increase in the shock stress occurs for the higher temperature measurements. The results might be taken to show an effect of greater dislocation drag predicted at higher temperatures except for the very reasonable agreement shown with the pioneering measurements reported by Swegle and Grady [
5] in which any drag consideration was excluded. A strain rate exponent, m ≈ 0.356, <1.0 for drag control, applies for the measurements. Additionally, the flow stresses are substantially lower than those interpreted as due to phonon drag in other gas-gun-induced shock measurements [
14,
18].
A possible influence on determination of the effective shock stress involving an increase in Poisson’s ratio with increase in temperature has been suggested for the seemingly anomalous temperature effect. Measurements have been reported for Poisson’s ratio increasing with an increase in pressure [
23]. Kanel et al. [
22] compared the temperature-dependent flow stress increase with the “normal” reverse temperature effect that was measured in their own SHPB tests. Very interestingly, they reported a reversal of the increased temperature effect in other measurements in which a small strain was initially present in the incident shock wave; so, the very interesting observation remains to be explained.
4. Summary
Split-Hopkinson pressure bar (SHPB) and shock impact measurements have been presented in relationship to other reported high-rate deformation test results and constitutive equation computations obtained on copper and tantalum materials. The total results are shown to compare reasonably quantitatively with a physical-based dislocation mechanics model description of dislocation generations at the shock front. On such a basis, a limiting form of the constitutive-equation-based thermal activation–strain rate analysis (TASRA) description is applied to shock behavioral predictions at an upper-limiting strain rate, (dε/dt) = 1010 s−1. Additionally, a relationship is established with the engineering “log/log” strain rate sensitivity parameter, m, over a wide range in strain rates extending to the limiting value. The evaluation of constitutive equation parameters is related as well to simulated dislocation dynamics model descriptions for copper involving the method of discrete dislocation plasticity (DDP) and, for copper and tantalum, via the multiscale dislocation dynamic plasticity (MDDP) model.


