Article

The Role of Microstructure in Alkali–Silica Reaction Tests

Department of Civil, Chemical, Environmental and Material Engineering, University of Bologna, Via Terracini 28, 40131 Bologna, Italy
*
Author to whom correspondence should be addressed.
Crystals 2022, 12(5), 646; https://doi.org/10.3390/cryst12050646
Submission received: 5 March 2022 / Revised: 16 April 2022 / Accepted: 24 April 2022 / Published: 1 May 2022

Abstract

:
Alkali–silica reactions were set off in cementitious mortars in different curing conditions, simulating short-term tests on reactivity. The investigated composites differed in some of their microstructural features. The total open porosity was modulated by changing the water/cement ratio and also by adding an air-entraining additive. By keeping the mortars’ porosity as the only variable, the effect on the measured expansion was evaluated. The dependence on porosity, specifically on the microstructure, of the macroscopic expansion that was used to assess the reactivity of the aggregates was studied. In particular, the connectivity of the porous network in the material, which is the dimension of the most frequent capillary porosity, exerts an influence on the expansion rate and extent. The results obtained under different conditions underline that the microstructure, that is the porosity of a composite and its size, always plays an important role in influencing the extent of expansion, a role that should be investigated and analyzed more deeply in accelerated procedures.

1. Introduction

Alkali–silica reaction (ASR) is a frequent problem that can affect cement composites. This reaction has been studied in the literature [1,2,3,4,5], but a complete understanding of its mechanism and the factors affecting it is still lacking. Moreover, it is rather difficult to prevent ASR. The tests available to determine the potential reactivity of aggregates are rather slow or, when performed in accelerated conditions, not completely reliable. The tests are performed on smaller fractions of the aggregates to be used, and the selected sample may not be representative of the entire aggregate. Unexpected field results can take place afterwards. The use of lithium salts in the mix design of composites [6,7,8,9] seems to be a promising method to prevent these reactions, even if the correct amount of additive must be used. The other available tool to suppress or limit ASR is the use of pozzolan additions or supplementary cementing materials (SCM) in the composite [10,11,12,13,14,15,16]. Fly ashes, silica fume, and slags have been deeply investigated as fractions that can suppress or at least mitigate the reactions. Different models have been proposed to explain their effect, but a definite explanation is still lacking. Less attention has been paid to some other solutions, such as the use of air-entraining additives [17,18], porous aggregates [19], and polymers [20,21]. To some extent, these additives seem to exploit microstructural changes in the composites to limit the damages of ASR. The artificial porosity induced by air-entraining agents is supposed to accommodate the reaction products, thus reducing the internal pressures generated by the formation of voluminous gel. Water-reducing additives’ effect is not well understood, since the role of permeability or diffusivity in cementitious composites affected by ASR has not been fully investigated. Almost all the existing standards test the reactivity of aggregates or the effect of supplementary cementing materials on aggregates’ reactivity, from the macroscopic evidence of expansion. The standards prescribe the use of a specific water/binder (w/c) ratio in the mix design of the tested specimens. ASTM C1260 and ASTM C1567 indicate a constant w/c ratio (0.47) in the mortars. A brief note states that “ruggedness tests indicated that mortar bars expansion was less variable at a fixed water/cement ratio than when gauged to a constant flow”. Another standard, C1293-20a, suggests one range of w/c ratio. In addition, AFNOR P18-588 suggests a constant w/c ratio, which is equal to 0.35, for mortars to be submitted to accelerated expansion. Reviews on the subject [22] do not fully investigate the water/cement ratio’s effects on the results of short-term tests or on the measured level of expansion. The role of the w/c ratio is presently understood to have direct influence on the relative humidity content, which can be present throughout the concrete specimen. Therefore, in this article, we propose a more focused investigation on the link to the expansion of mortars. Samples with different porosities (capillary and macro), which underwent accelerated tests to detect their potential reactivity, were selected to establish a correlation between their microstructure and the measured expansion of the composite as a result of ASR. Bearing in mind that even a limited dependence may have an impact on test results’ limits for distinguishing between non-reacting and reacting aggregates (as a 0.1% length expansion in ASTM C1260), the suggested values are rather strict to be selected. For comparison’s sake, the most frequently applied conditions in the literature were selected to determine the aggregates’ reactivity at 38 and 80 °C. Pyrex glass, as in other papers [23] or in a specific standard (ASTM C441), was used as an aggregate. Pyrex is an almost completely siliceous material with a negligible amount of sodium oxide and a controlled chemical composition that is non-porous and extremely reactive, thus creating favorable conditions for developing ASR reactions. Moreover, in this study, the alkalis were supplied in two different ways: by diffusion from the surrounding environment and by direct addition during the mixing stage. The relationship between the measured expansion and the porosity of the samples was investigated to assess the qualitative and quantitative influences that this parameter can have on the measured expansion. To the best of our knowledge, no systematic inquiry has been performed on the subject.

2. Materials and Methods

2.1. Materials

2.1.1. Binder

Cement 42.5 Type I with a Na2O wt% of 0.18 and a K2O wt% of 0.08 (Italcementi, Bergamo, Italy) was used as a binder. The overall alkalis’ content of the composite rose to 2.0 wt% of Na2O (on cement) by adding NaOH (Sigma Aldrich, Merck, Saint Louis, MO, USA) directly to the deionized mixing water to simulate a high alkali content.

2.1.2. Additives

A high-range water-reducing (HRWR) additive based on acrylic polymers (Mapei X, Mapei, Milano, Italy) was used to decrease the water-to-cement ratio. An air-entraining additive (Sika, Zurigh, Switzerland) was used to introduce controlled porosity in the composite, hereafter defined as AIR_E.

2.1.3. Aggregates

Siliceous sand conforming to UNI-EN 196 and reactive Pyrex glass conforming to ASTM C441 were used as aggregates. The Pyrex glass had the following chemical composition: 80.5 SiO2, 11.8 B2O3, 4.2 Na2O, and 2.4 Al2O3 wt%. The ratio of non-reactive/reactive aggregate was 5:1 on aggregate weight. The aggregate–binder ratio was 2.25.

2.2. Mortar Preparation

Mortars were prepared following the procedure described in ASTM C1260, with some changes. Table 1 shows the composition of all the investigated mortars. Cast samples with steel gauges at the extremes were cured for 24 h at 25 °C and R.H. 98 ± 1%. After being demolded, they were kept at 25 °C and R.H. 98 ± 1% before being submitted to accelerated expansion tests.
A set of mortars was also mixed without adding sodium hydroxide to the mixing water. These mortars were made to investigate the alkali–silica reactions induced only by ions diffusing from the environment toward the reactive aggregates.

2.3. Tests and Methods

Mortars were cured in different conditions:
i.
Procedure 1: At 80 °C to speed up the reaction between the alkalis and aggregates in a moisture-saturated environment (R.H. 100%) for mortars containing a high concentration of Na+ ions.
ii.
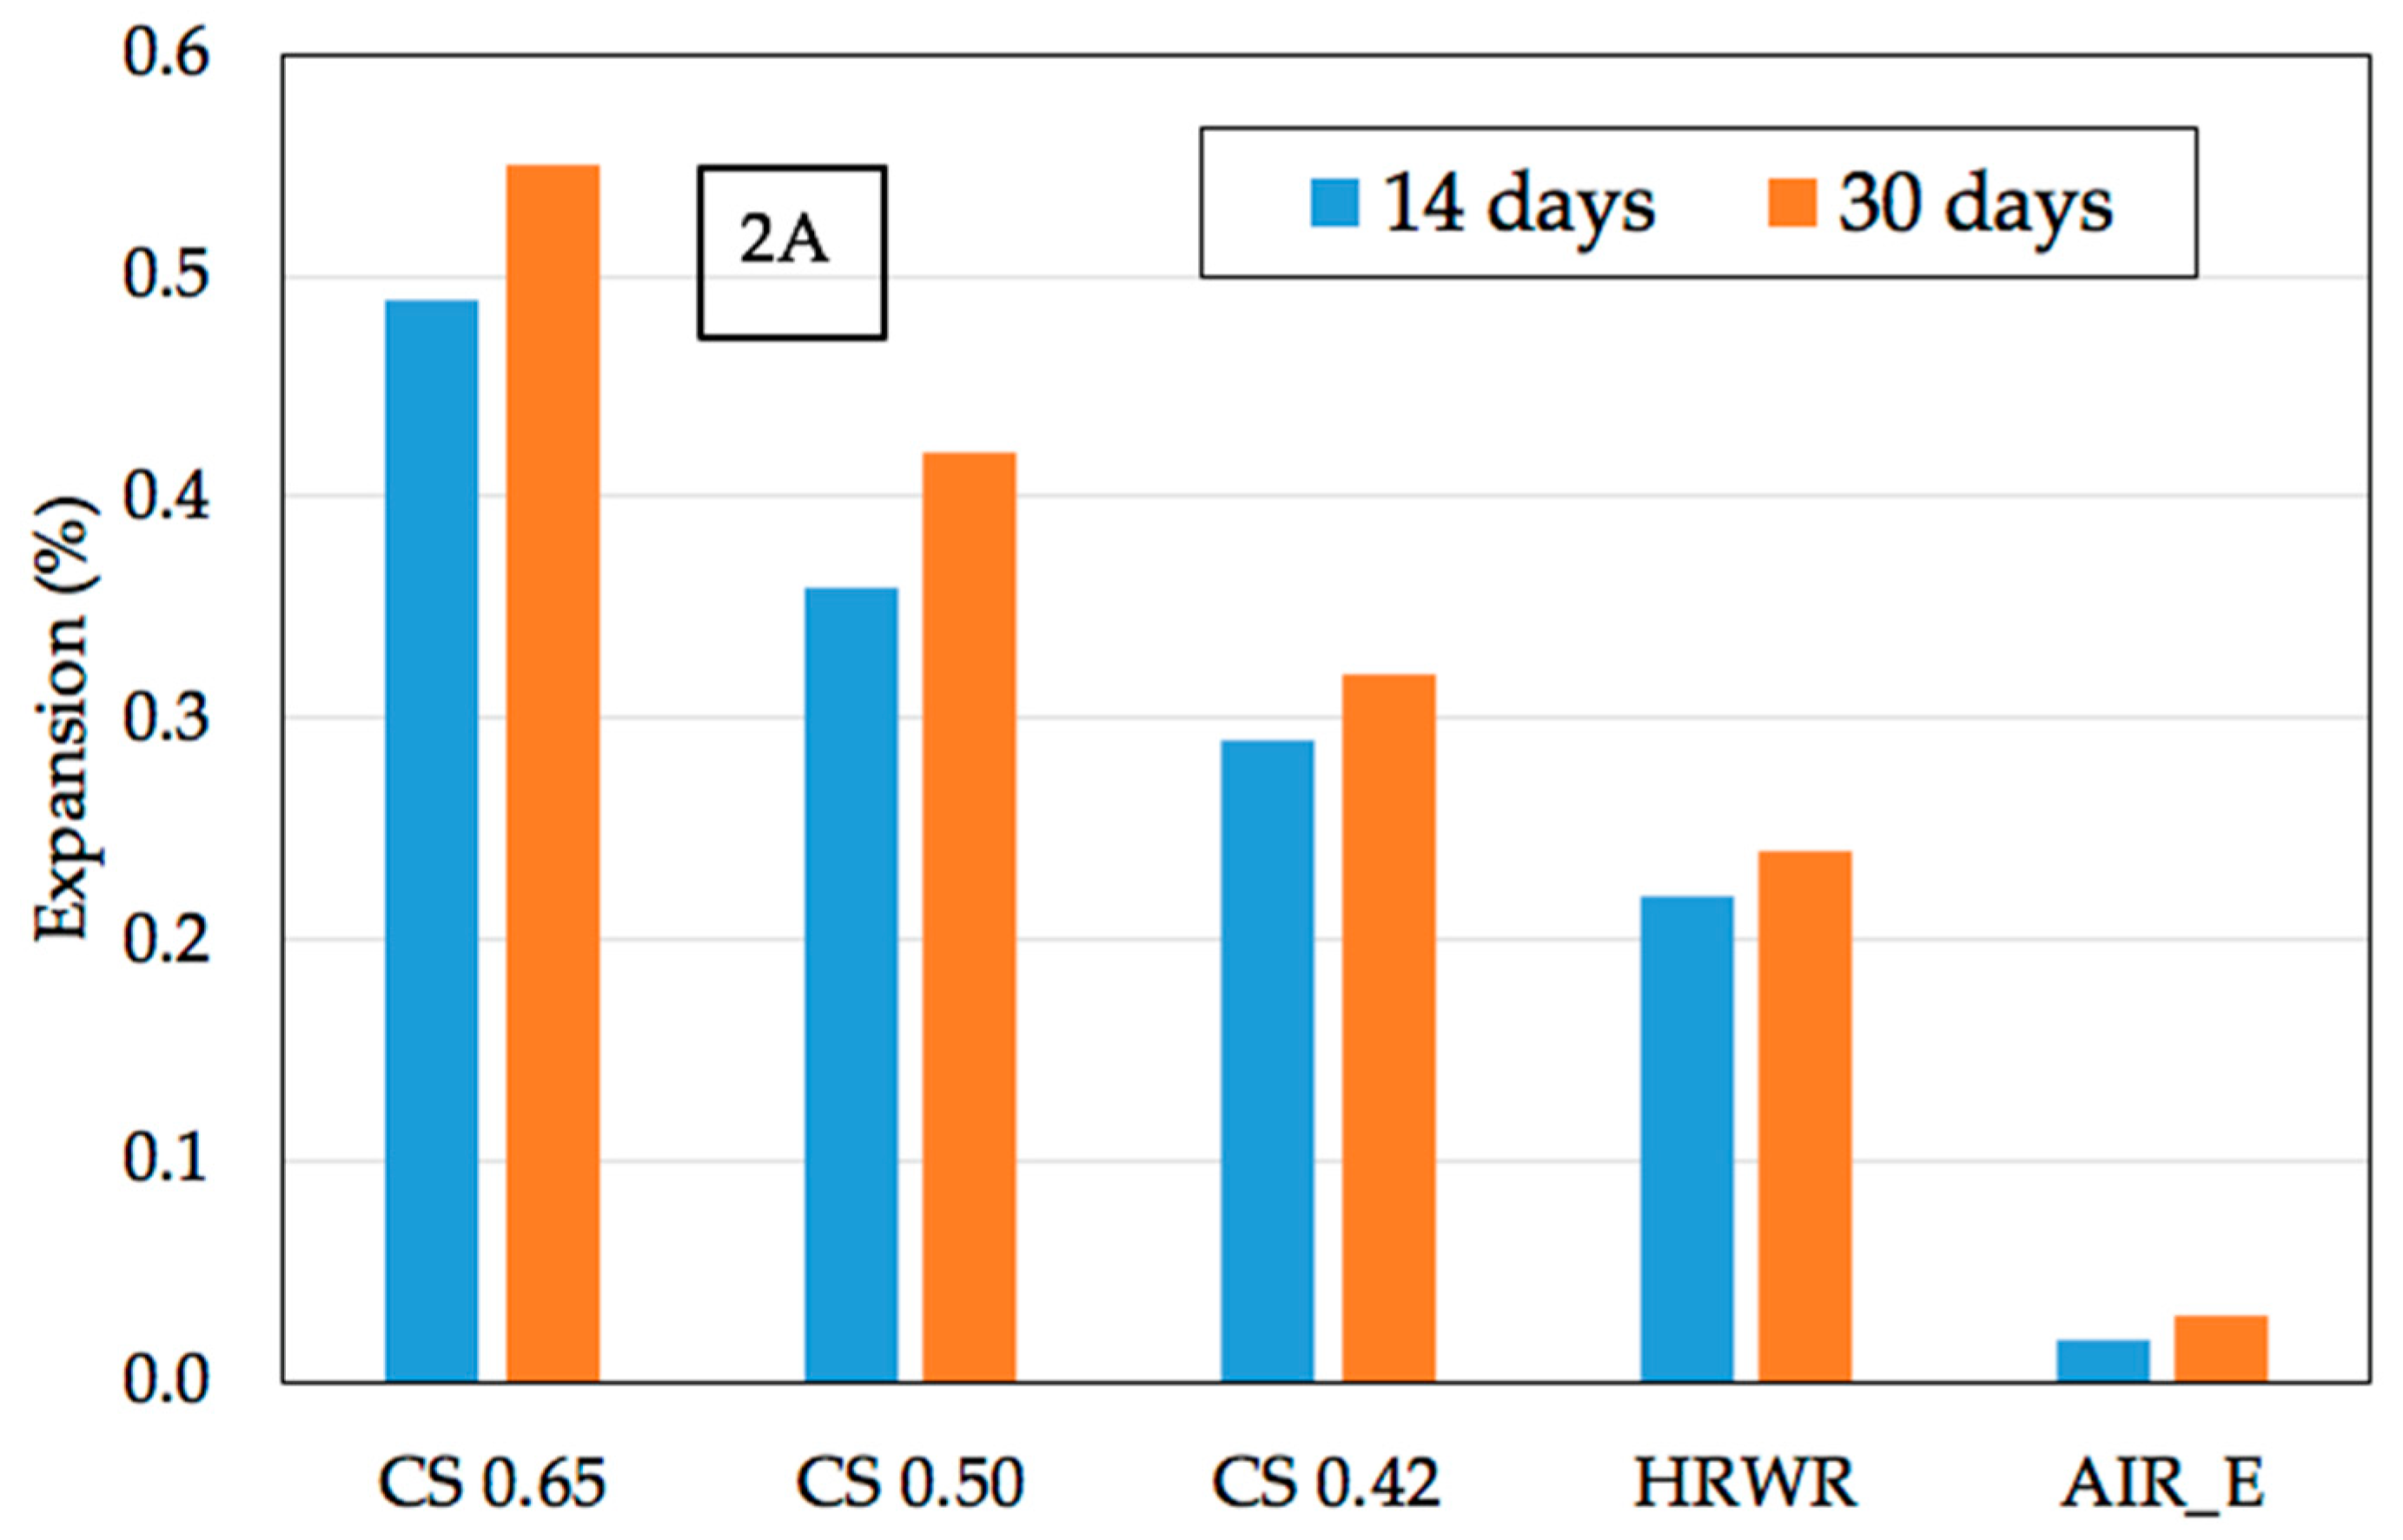
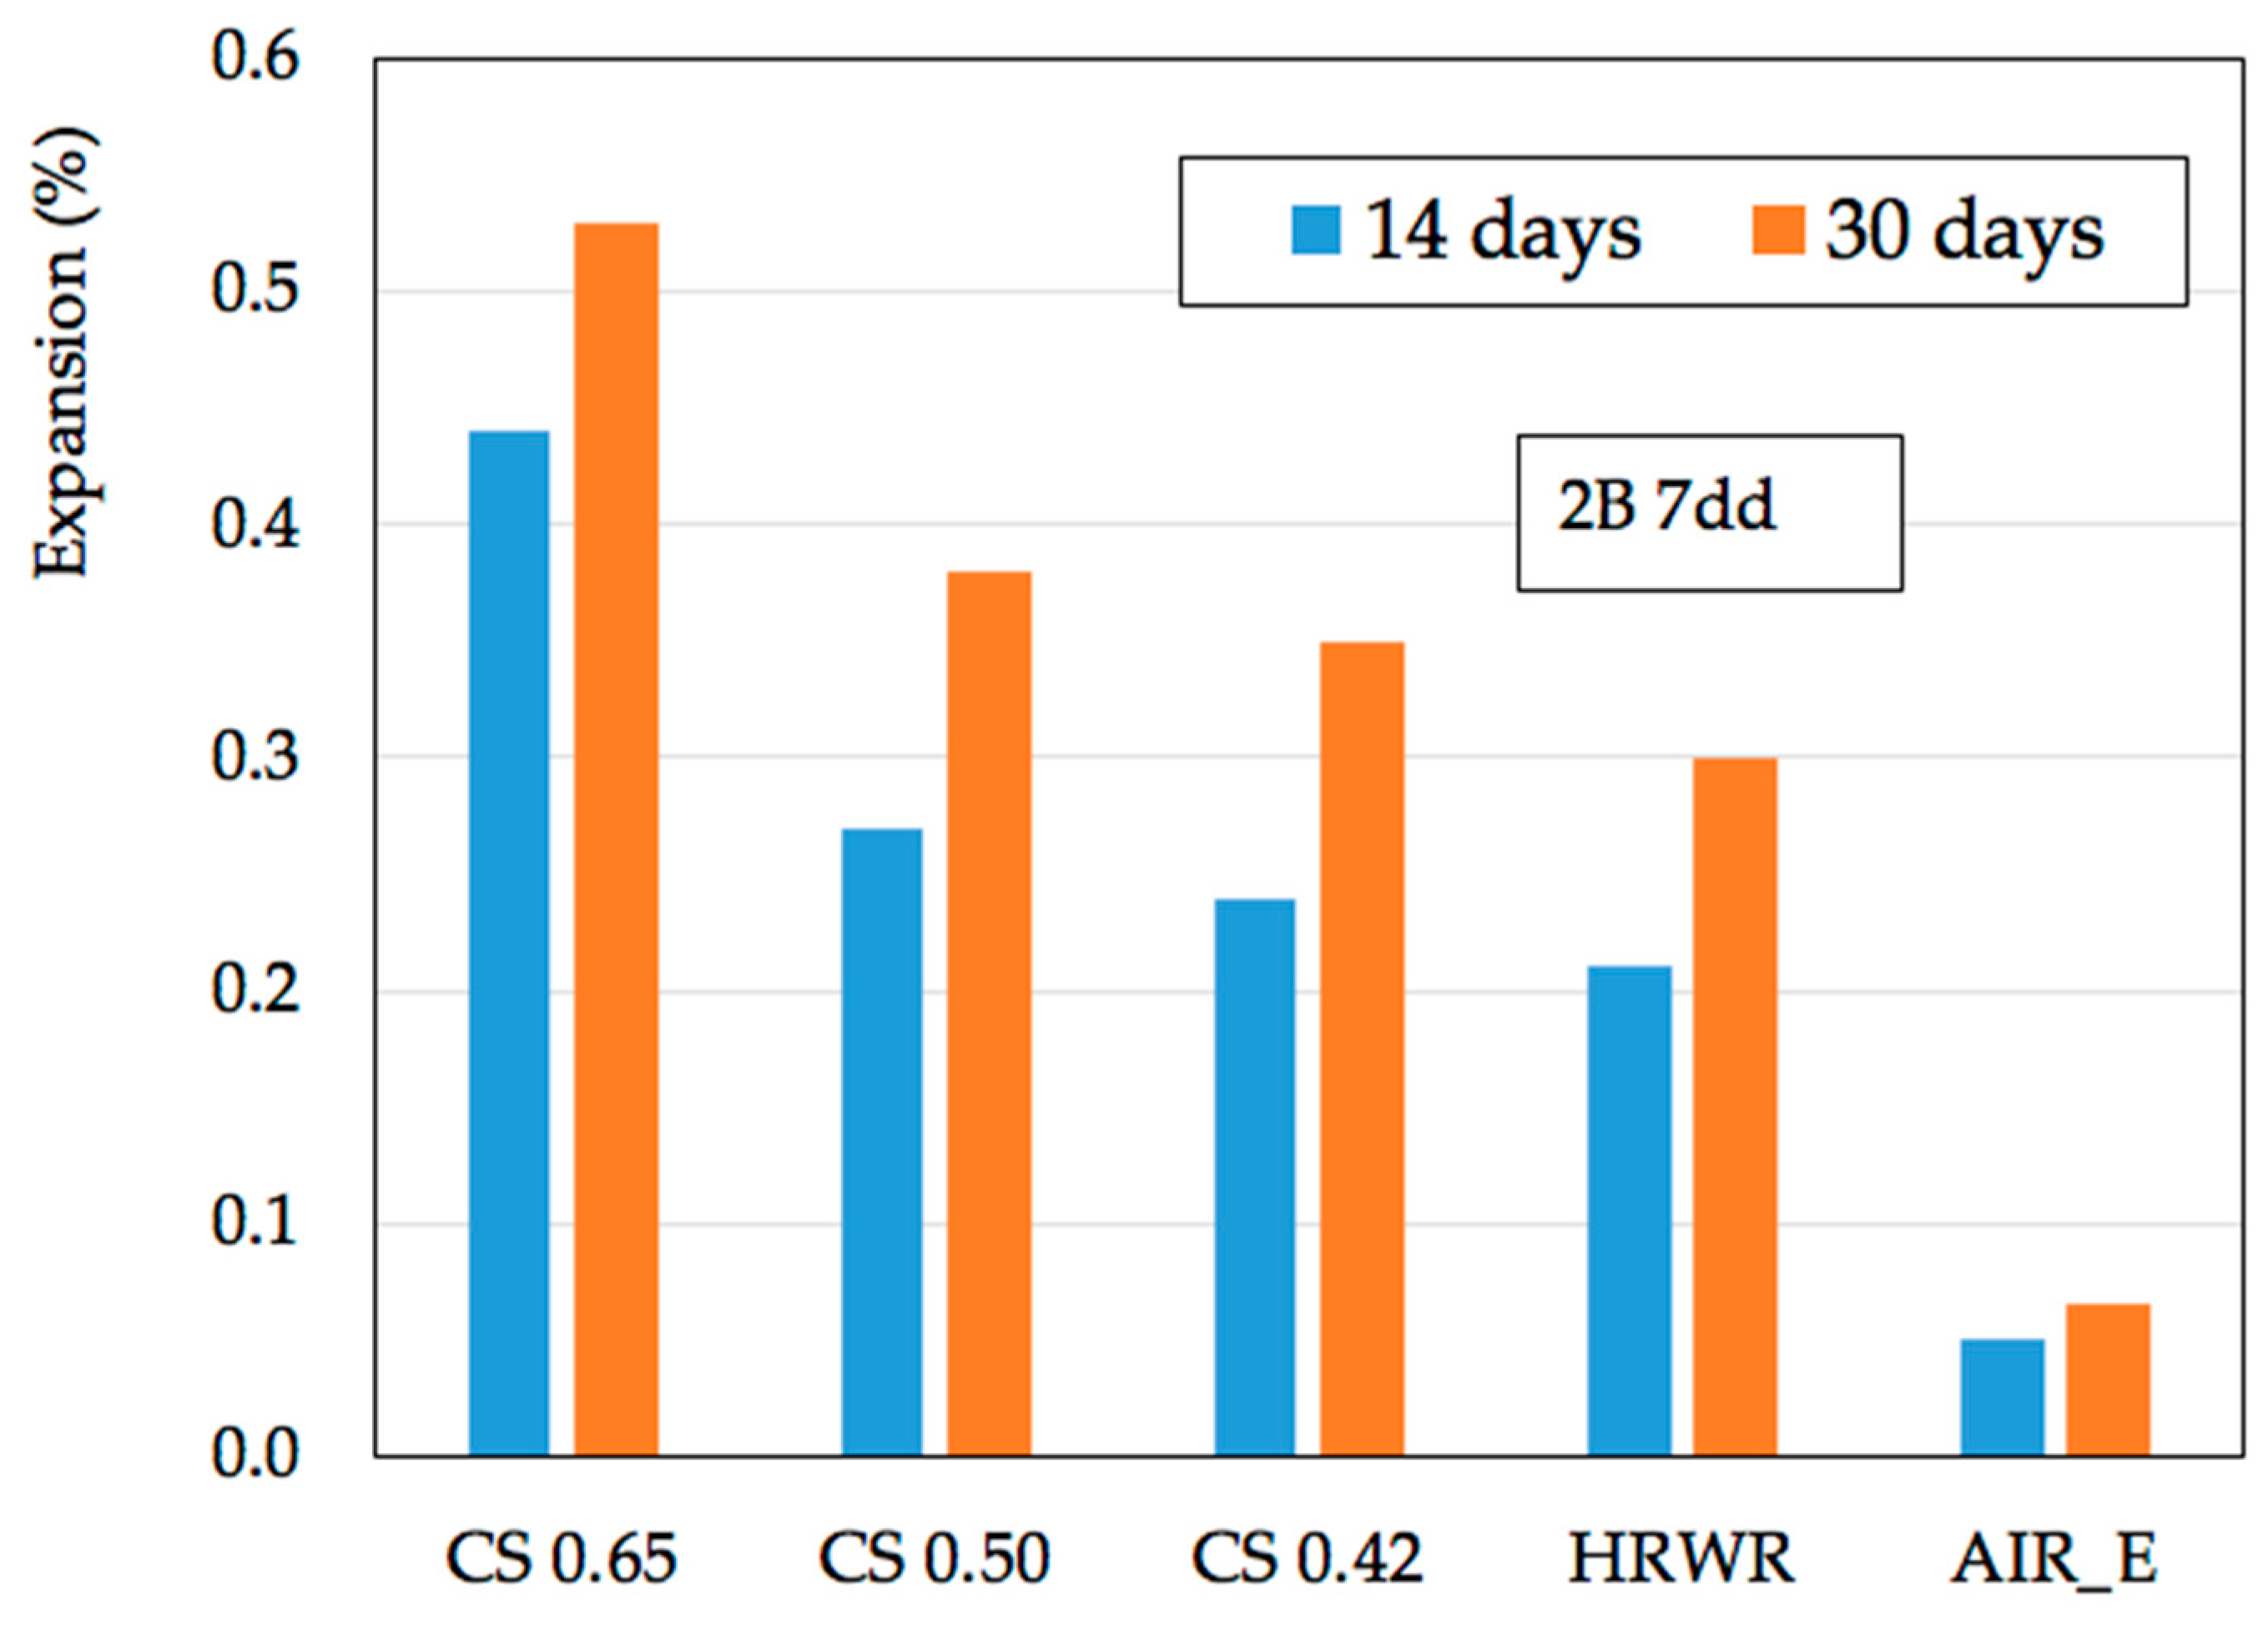
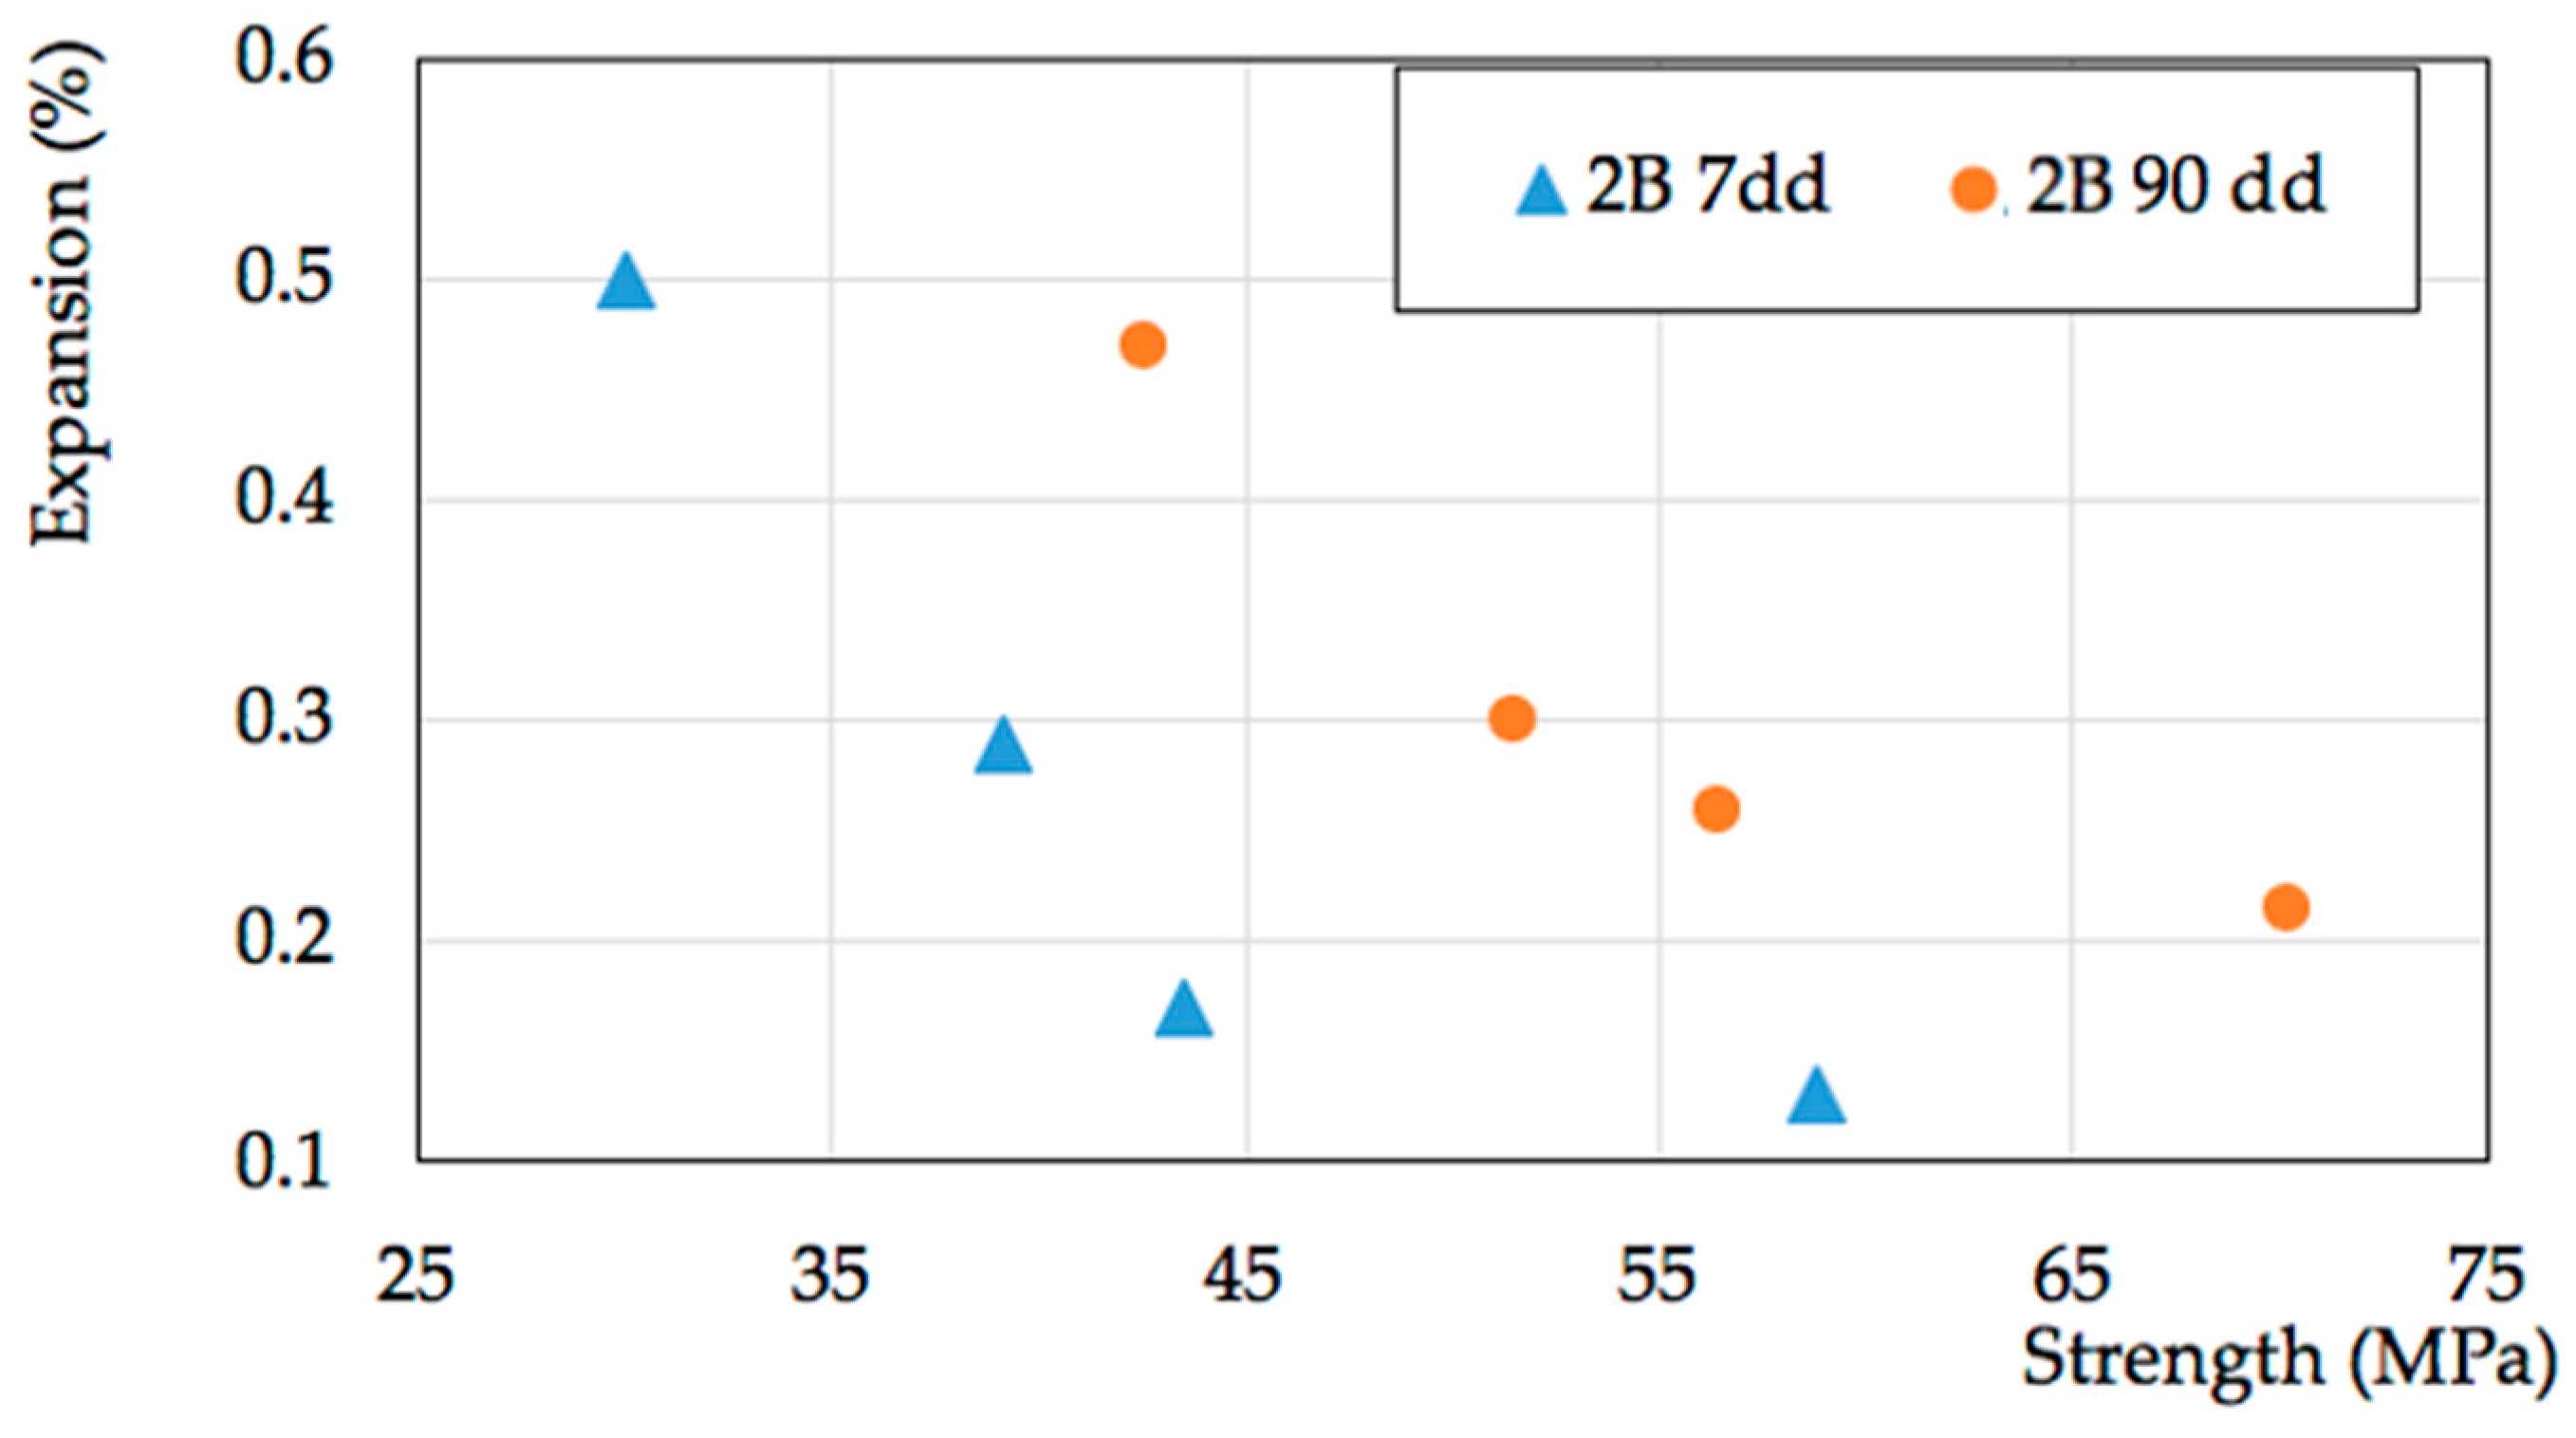
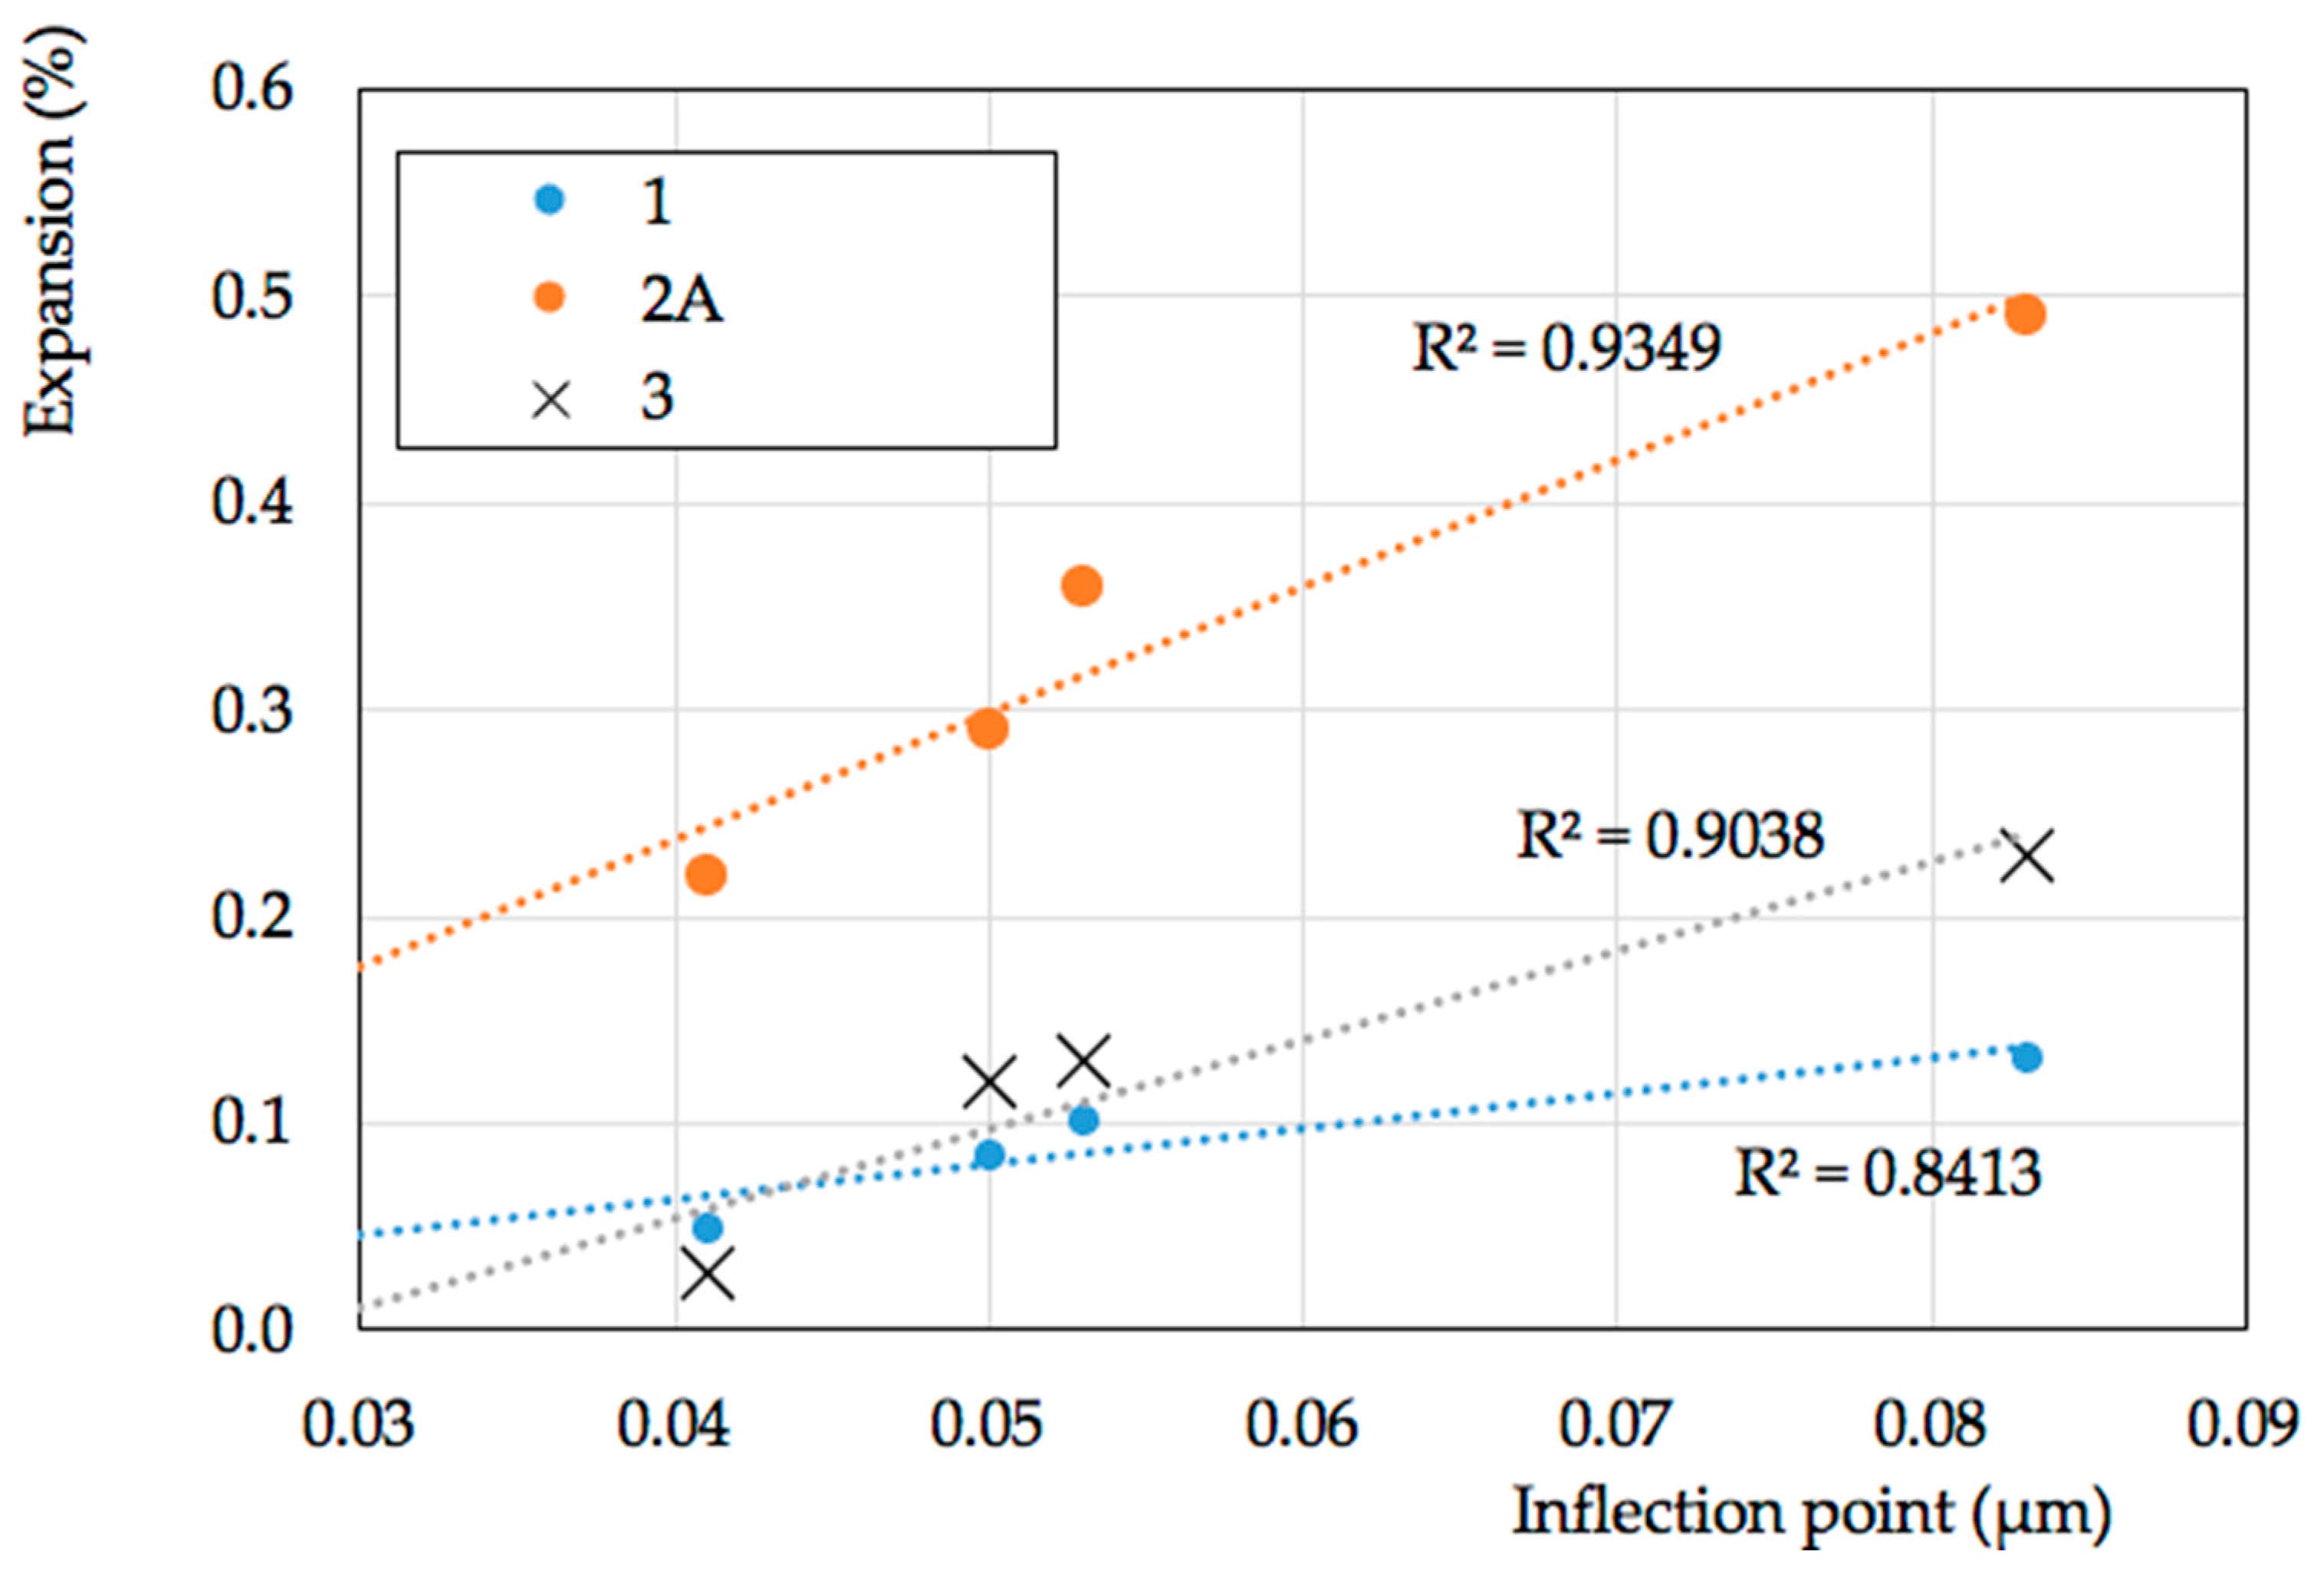
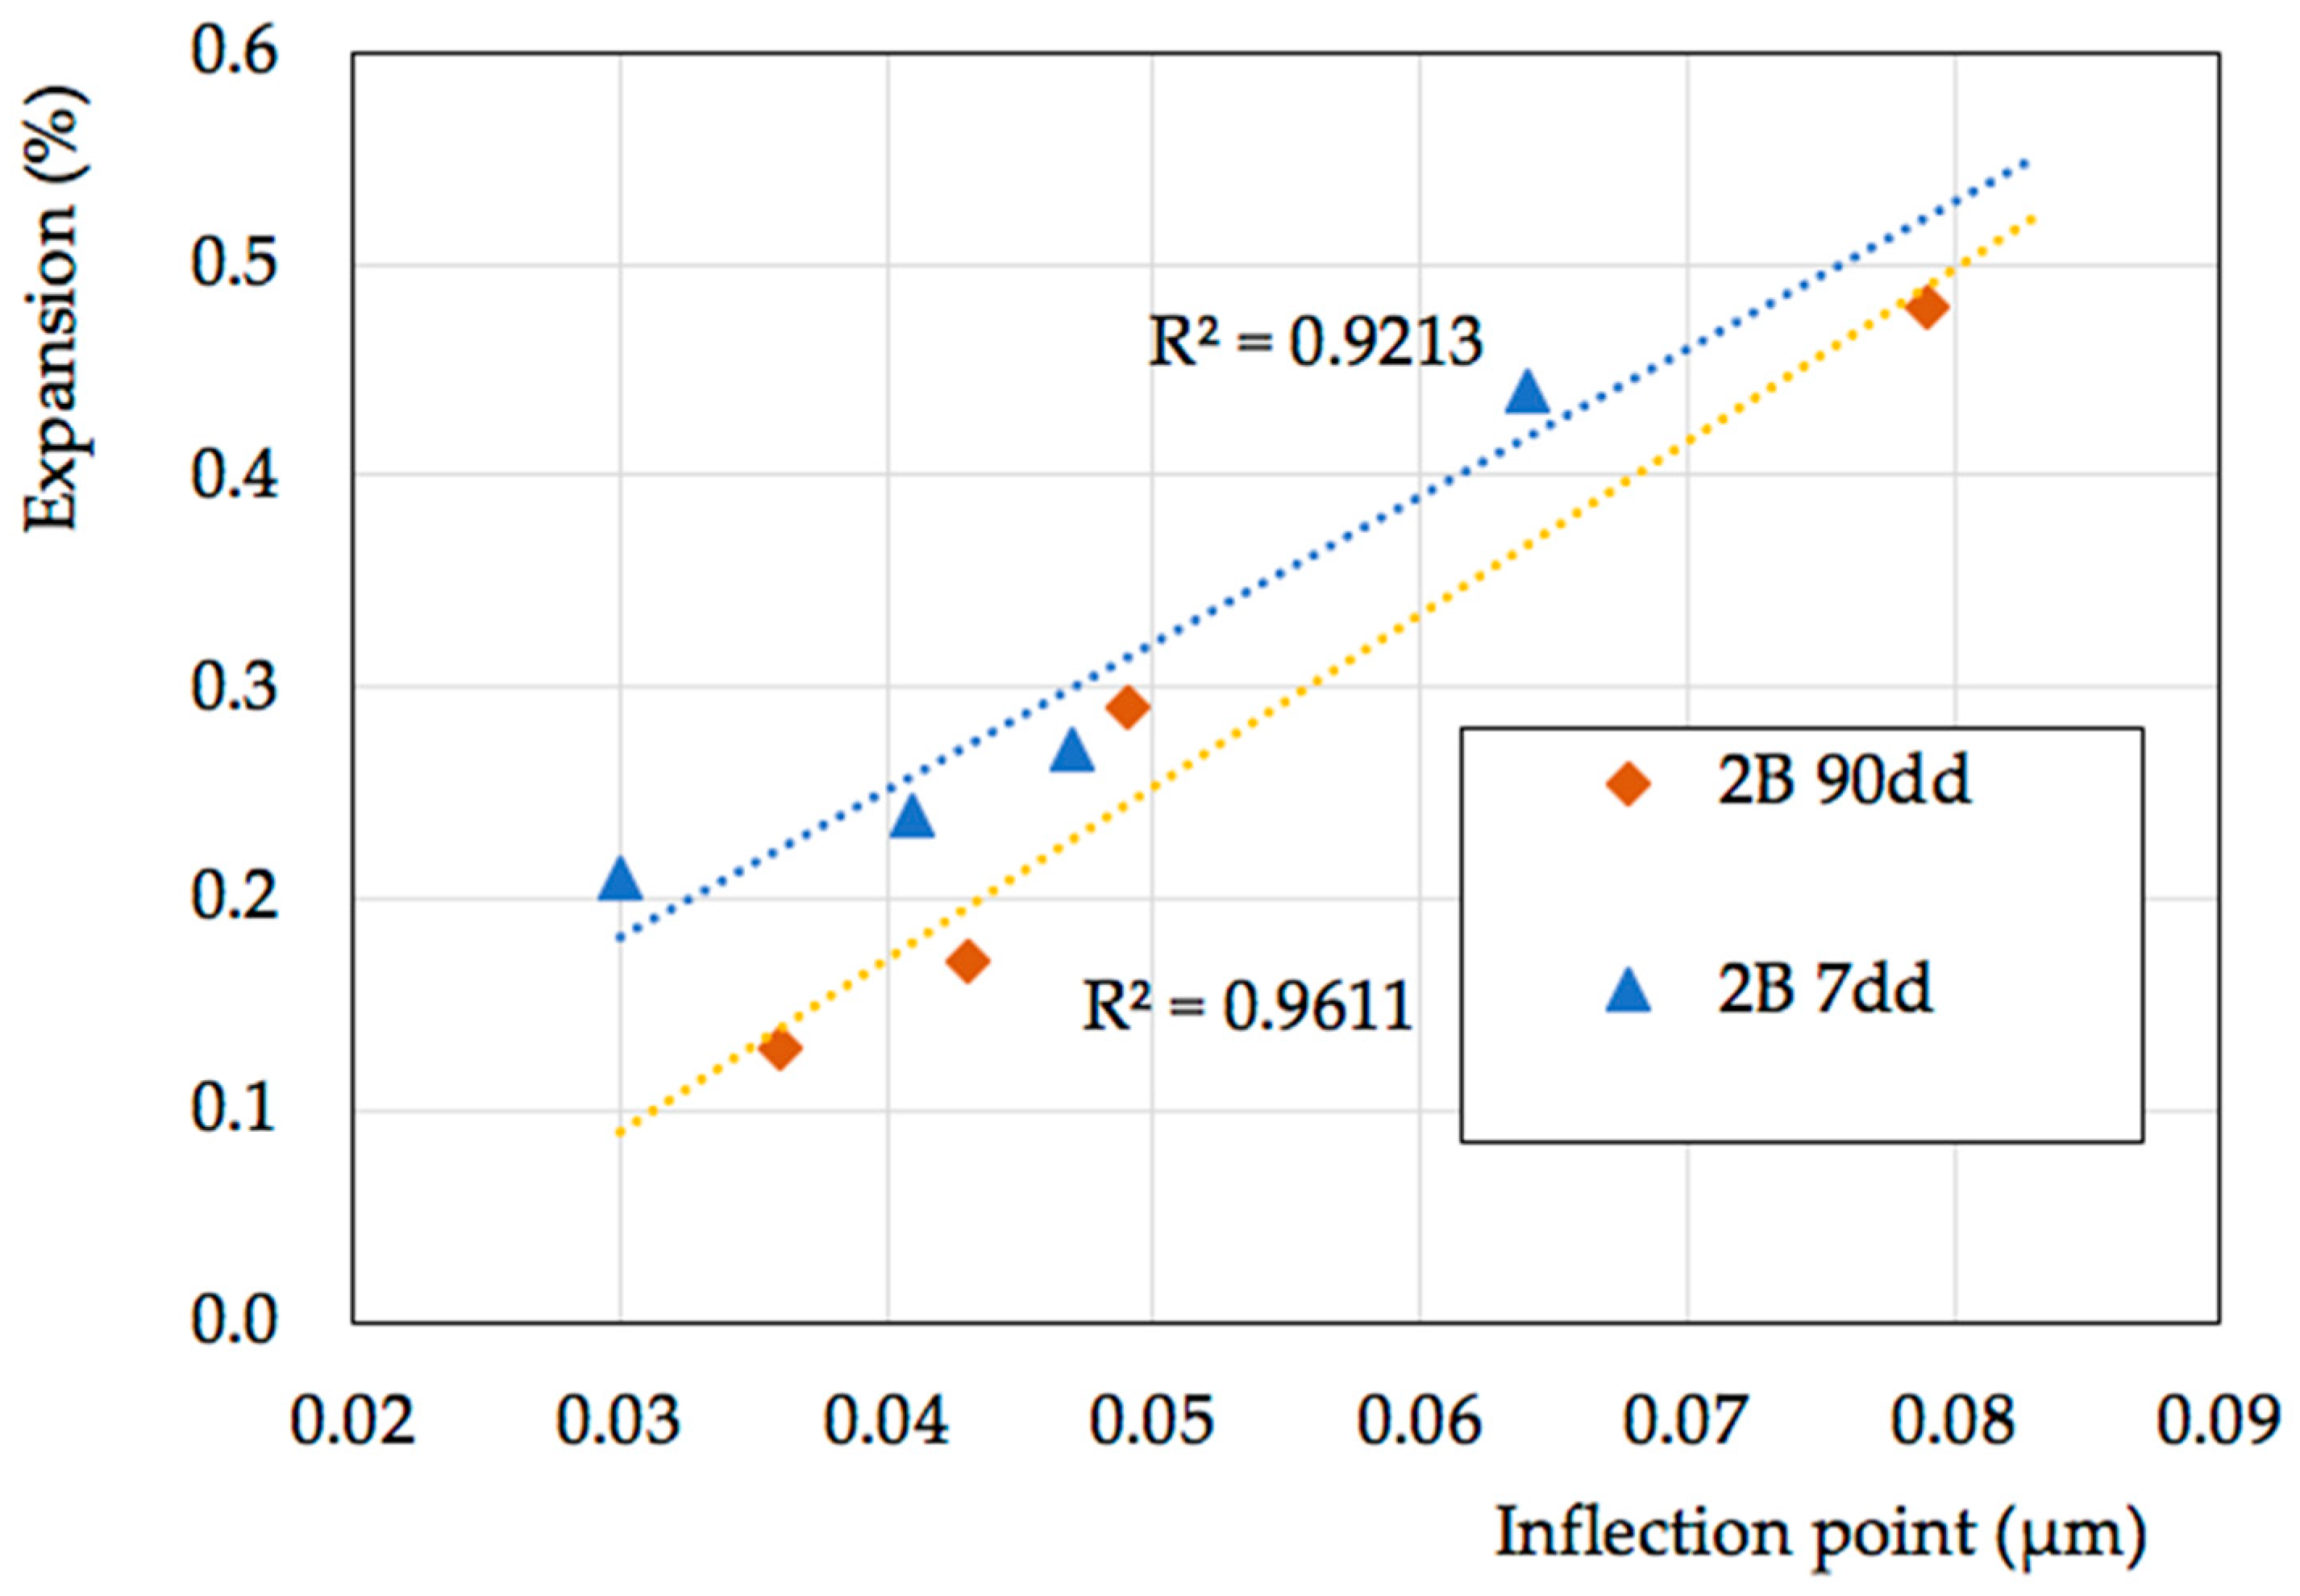
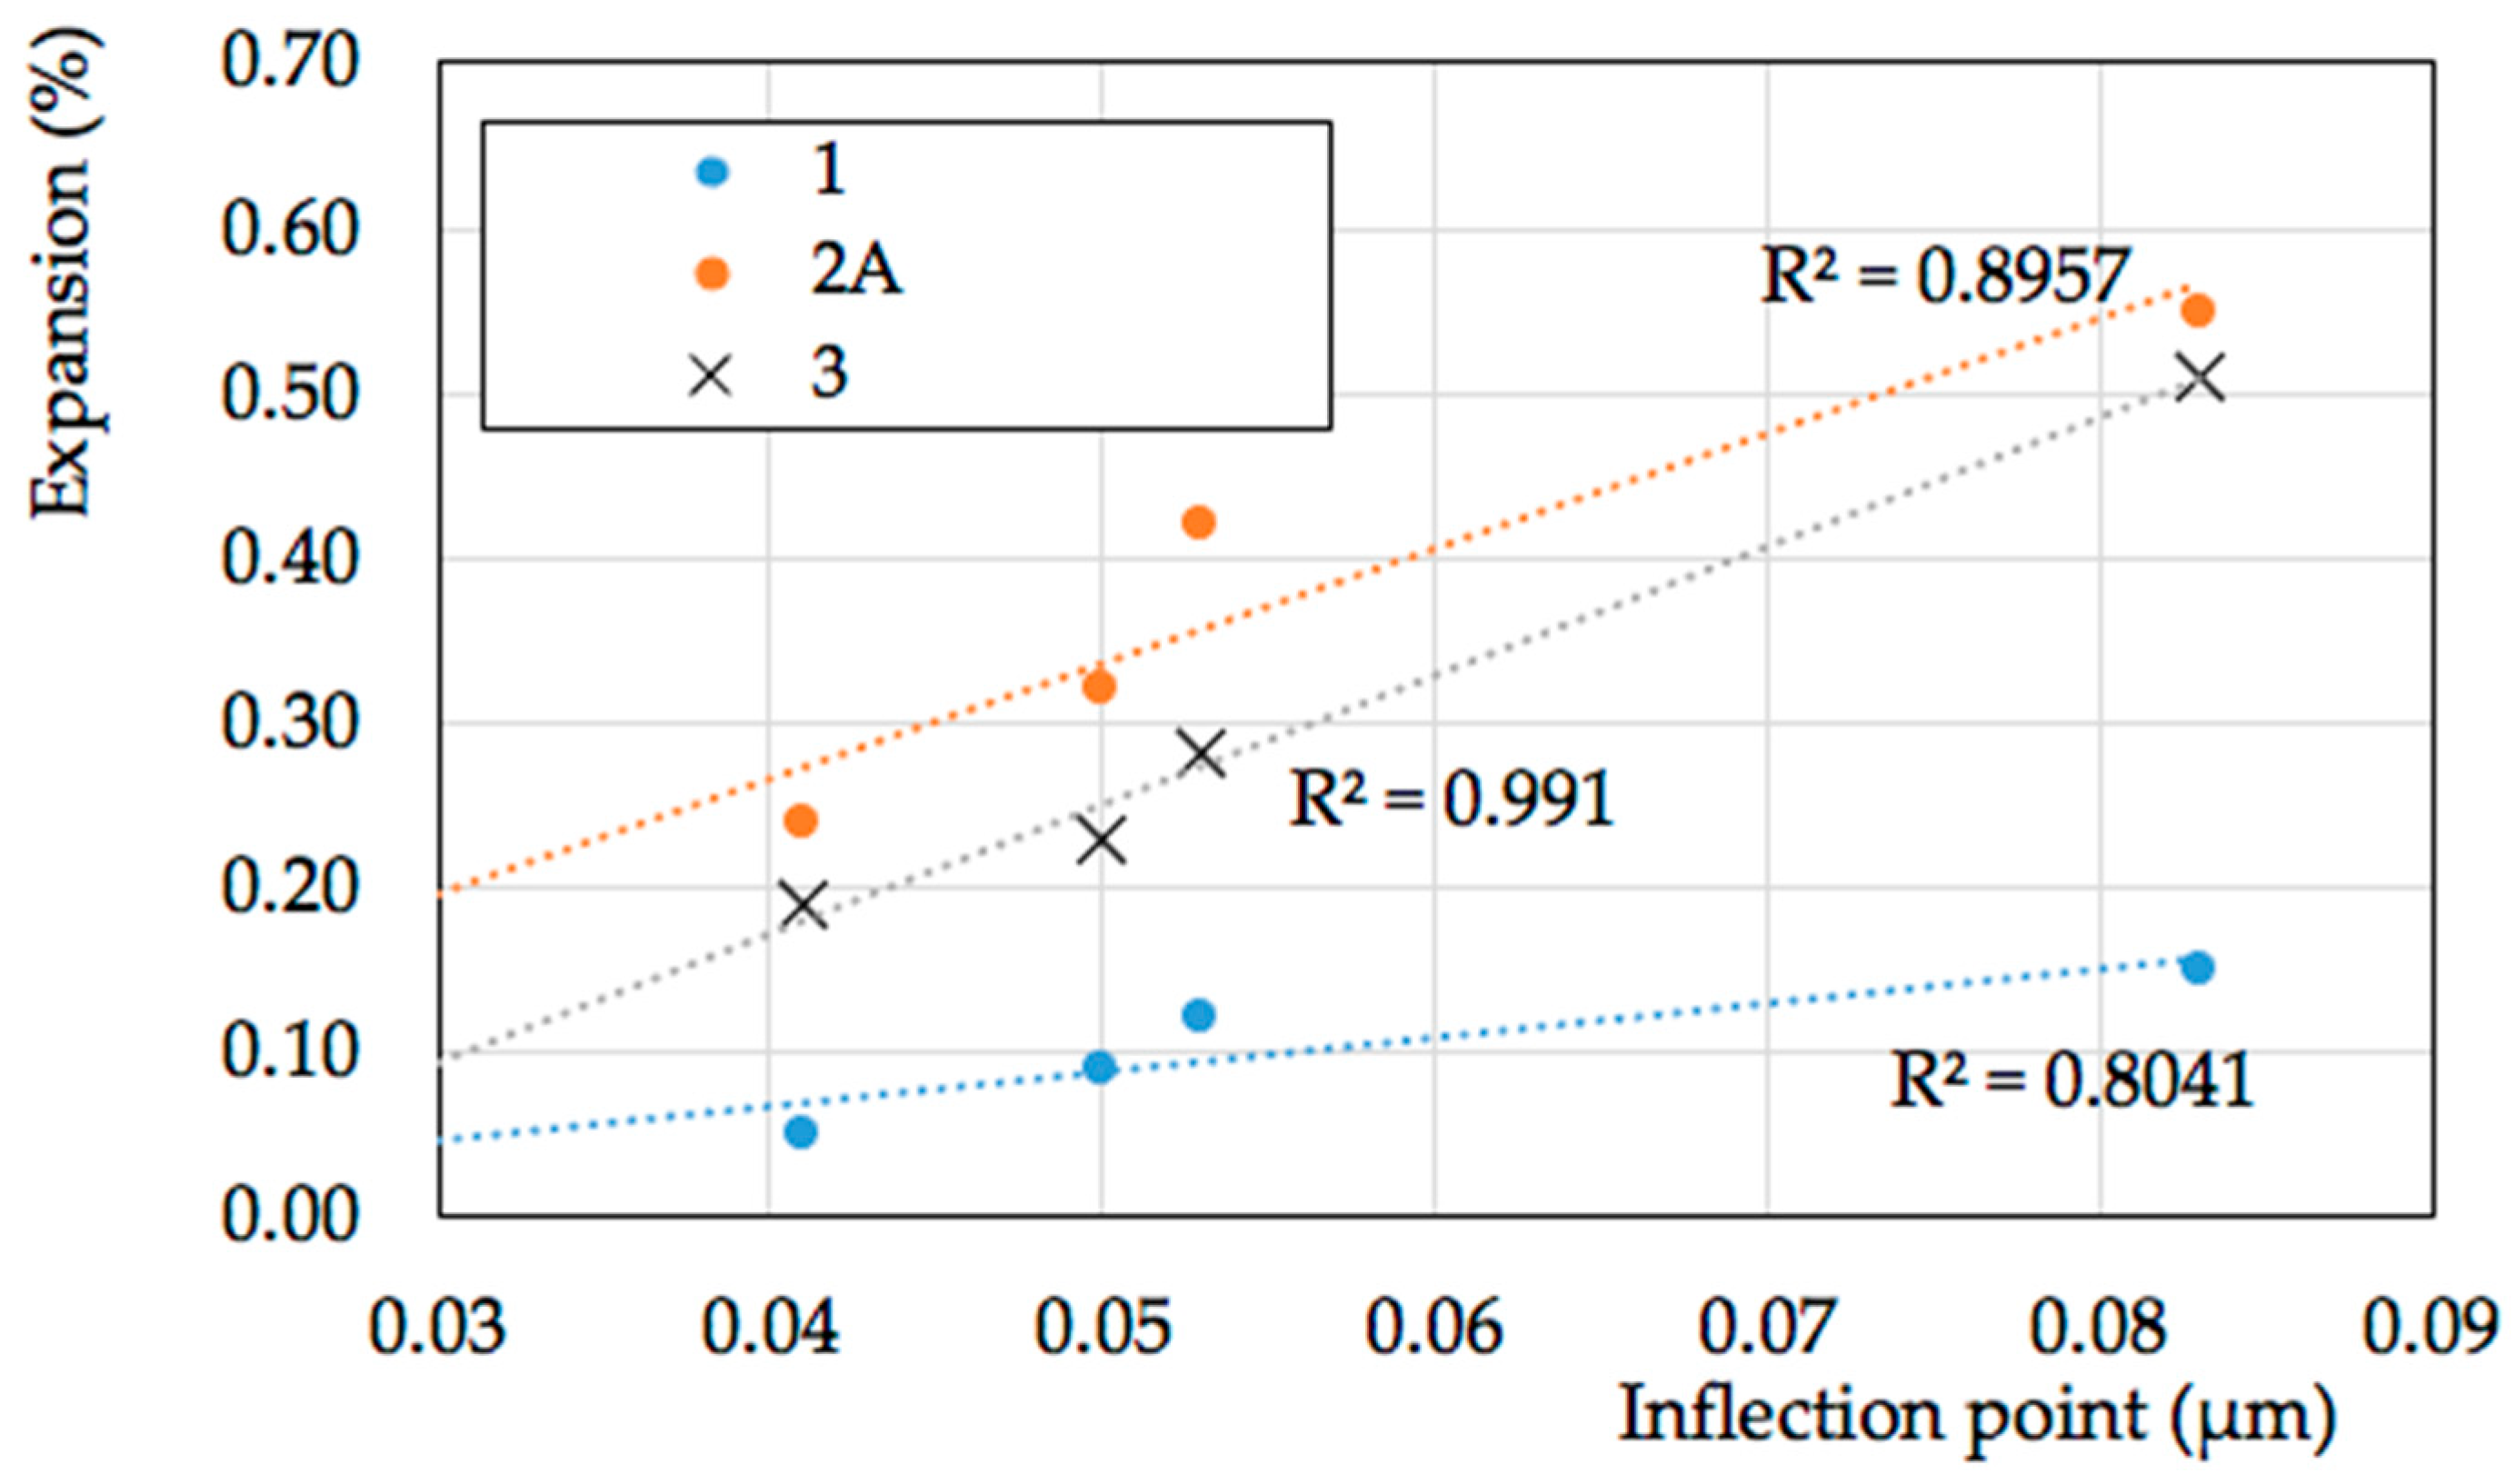
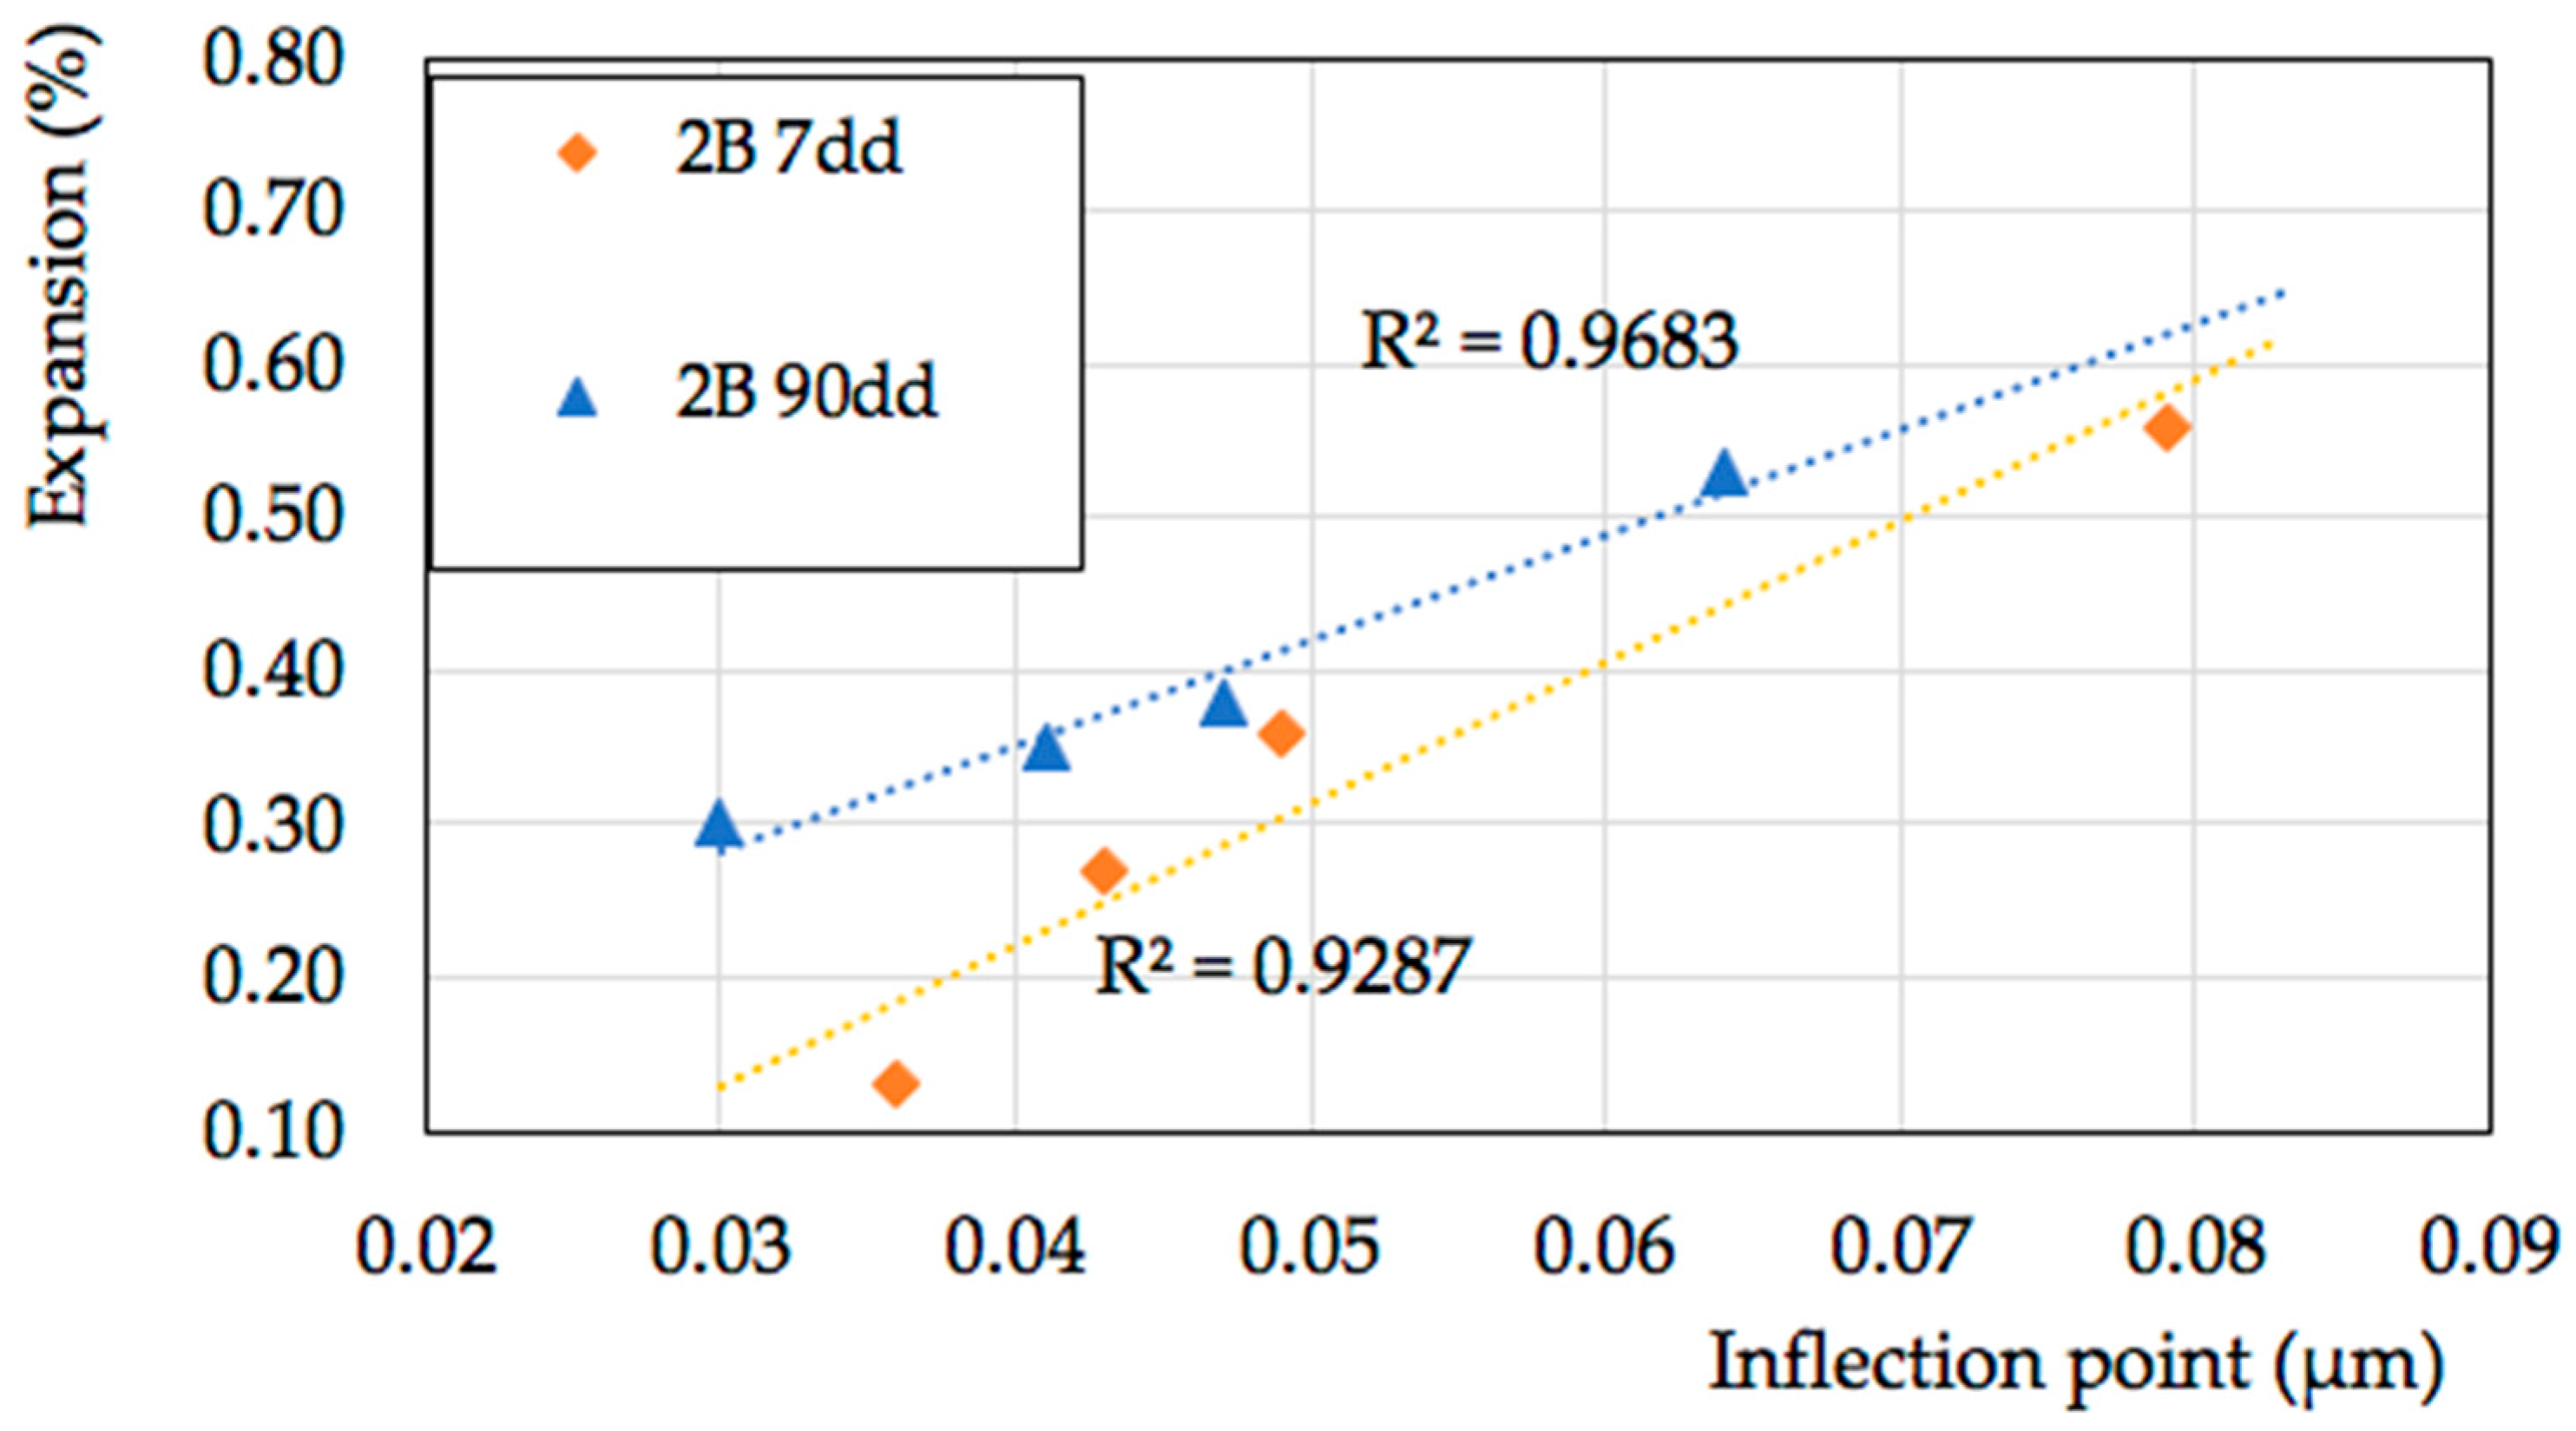
Procedure 2: Again at 80 °C in a 1 N NaOH solution. In this case, both mortars mixed with (2A case) or without (2B case) NaOH were studied. For mortars mixed without Na+ ions, two different curing periods of 7 and 90 days were carried out before testing at 80 °C, in order to provide the mortars with different microstructures (hereafter defined as 2B 7dd and 2B 90dd). In order to perform the test, mortars were conditioned in water at 80 °C, and the length of the specimens after this conditioning was used as the reference. Subsequently, the samples were immersed in a 1N solution of NaOH, taken out of the solution, and rapidly measured at scheduled curing times as described in ASTM C1260.
iii.
Procedure 3: Samples mixed with NaOH, after being cured at 25 °C and R.H. 100% for 7 days, were submitted to tests carried out at 38 °C and R.H. 100%, according to ASTM C227 (or 1293).
The microstructural features of the composites were studied using scanning electron microscopy (XL 20 SEM, FEI, Hillsboro, Oregon, USA) and mercury intrusion porosimetry (MIP) (Fisons 2000, Carlo Erba, Milano, Italy). The calcium hydroxide content was evaluated on ground pastes without NaOH, which were dried at 105 °C, using thermogravimetric analysis (Thermal Analysis Instruments, Mod. Q50, TA Instruments, New Castle, USA, heating rate of 15 °C/min). The amount was derived by the loss peak from 380 to 500 °C. The compressive strength (Rc) was determined by means of Amsler-Wolpert (100 kN) testing equipment, and the dynamical elastic modulus (E) was determined using an ultrasonic tester (Controls Mod E46, Matest, Bergamo, Italy).

3. Results and Discussion

Table 2 reports the physical and mechanical data of the mortars, both those that did not contain NaOH in the mixing water (2B type) and those formulated with a higher concentration of sodium ions (1, 2A, and 3 type). The progressive decrease in the mixing water amounts led to an increase in the mechanical properties of the composites. This increase was rather low when considering the elastic modulus but became notable when considering the compressive strength. The prolonged curing time of the 2B samples, promoting the development of the hydration products, increased the mechanical properties. Indeed, upon increasing the mechanical properties, the composite was supposed to develop a higher resistance to ASR and consequently show an increased dimensional stability, as evaluated by the standards.
The use of an AIR_E additive led to a strong reduction in the mechanical properties. In field application, this additive would not be acceptable as a possible means to contrast ASR reactions unless a contemporary freeze–thaw stress was present in the environment. In our context, this composite has a reference value and, according to its low mechanical properties, should undergo a large dimensional change. Eventually, the addition of sodium hydroxide in the mixing water exerted a slight retarding effect on the cement’s hydration or changed the chemical composition of the reaction products, thus slightly reducing the mechanical properties of the composites, as found elsewhere [24].
Figure 1 and Figure 2 report the intruded cumulative porosity of the investigated mortars mixed without the sodium hydroxide at 7 and 90 days of curing, respectively, as a function of pore size. The results refer to samples subsequently submitted to Procedure 2B. Within the intrinsic limits of MIP technique, which have been fully discussed by some authors [25,26], the data reveal a finer distribution of the capillary porosity as the w/c ratio decreases from 0.65 to 0.35, as expected. Moreover, a further refinement takes place in all samples as curing proceeded (from 7 to 90 days of curing). The high-range porosity (>1 μm) tended to decrease in all the samples with longer curing times, but the relative ratio among the different mortars remained almost unchanged. The AIR_E samples’ overall pore distribution shifted toward a smaller pore dimension at 90 days. It is to be underlined that this formulation is the most affected by the limits of the MIP technique because of the presence of macro-voids surrounded by a matrix containing pores of a much lower dimension (ink-bottle effect). However, the data confirm the presence of a homogeneously dispersed high-range porosity (0.1÷10 µm) responsible for the lower mechanical properties (Table 2).
Figure 3 includes the open porosity at 7 days of curing for mortars mixed with NaOH.
The data are very close to those of Figure 1. The main difference observed is related to the position of the inflection points, which shifted for all samples to slightly higher values. Table 3 reports the values of the most frequent pore (from the inflection point of the curves in Figure 1 and Figure 2 for 2B samples and Figure 3 for 1, 2A, and 3 samples) for all the investigated materials.
In order to rule out the possible depletion/shortage of portlandite in the investigated samples, the amount of calcium hydroxide was investigated. Table 4 reports the amount of Ca(OH)2, determined by TGA, at 7 and 90 days. While at short curing times (7 days) the values were almost the same, due to the higher amount of water present in the systems, CS 0.65 and CS 0.50 at 90 days had a slightly higher amount of portlandite than CS 0.42 and HRWR. The precise role of calcium ions and Ca(OH)2 in the formation of expansive gels, and thus on the extent of the overall expansion, still remains an unsolved and deeply discussed matter. Different studies underlined an increase or a decrease [27,28,29,30] in expansion at different amounts of portlandite/calcium ions available in the reaction site. However, the determined amount in all samples should provide a comparable amount of calcium ions, and the effect of this parameter, if present, should be marginal.
Figure 4 shows the expansion of mortars submitted to Procedure 1 as a function of curing time.
Figure 5, Figure 6 and Figure 7 show the expansion of mortars submitted to Procedure 2: the first graph refers to samples that already contained alkalis in the mixing water (2A), the second refers to samples that did not initially contain alkalis (2B) at 7 days of curing, and the last refers to the samples cured for 90 days.
Figure 8 shows the results obtained according to Procedure 3, for which longer curing periods were investigated.
The following observations can be drawn: (i) in all the investigated conditions, expansion significantly depended on the w/c ratio; (ii) the differences were not negligible when considering that the expansion limit (0.1% in ASTM C1296, as an example) that characterized potentially reactive aggregates was rather low; and (iii) there were no remarkable differences between the expansion of the 2A and 2B 7-day samples, despite the fact that alkalis were already present in the bulk of the 2A mortars. Thus, the rate of expansion in both Type 2 procedures seemed to be almost independent of the rate of diffusion of Na+ ions, as other researchers [31] using similar conditions have already underlined.
In all investigated conditions, the air-entraining additive acted as an extremely efficient means of preventing the expansion of the samples, thus completely masking the alkali–silica reactions that took place inside. Indeed, SEM observations disclosed the presence of ASR products mainly close to the reactive aggregates in CS 0.65, CS 0.50 (Figure 9a), CS 0.42, and HRWR samples, while reaction products were observed mostly in the voids formed during the mixing operations in AIR_E (Figure 9b). Moreover, SEM and EDS observations ruled out the presence of delayed ettringite in all the samples; thus, no side reactions superimposing to the ASR expansion were taken into account.
Figure 10 plots, as an example, the expansion of the 2B samples (7 days and 90 days) versus the mechanical properties of the composites. If we examine the different mechanical characteristics of the materials (Table 2), although we can observe a general decrease in the expansion upon increasing the compressive strength, there is no clear trend in the plot. For example, the HRWR and CS 0.42 samples have quite different compressive strength values but close levels of expansion. Moreover, the prolonged curing time, while affecting the compressive strength in CS 065 and CS 050, led to comparable expansions. Figure 11 shows the results for the other investigated samples, and again, clear behavior is not outlined. It can be observed that all the samples submitted to Procedure 1 have close levels of expansion despite possessing rather different mechanical properties. As noted in other plots, Procedure 3 samples with different compressive strengths undergo an equal expansion (CS 0.50 and CS 0.42).
Figure 12 and Figure 13 report the expansion (%) as a function of the dimension of the most frequent pore, as derived from MIP experiments. For the Procedures 1 and 2 experiments, the expansion values at 14 days were considered, while for Procedure 3, the data at 30 days were examined. A clear, increasing trend of both variables vs. the pore dimension can be envisaged for all the samples, possibly hinting at a linear dependence. The R2 values were always close to or higher than 0.9. This dependence seems to be more coherent than the one based on the mechanical strength.
In Figure 14 and Figure 15, the values of the expansions recorded at longer times are summarized. Figure 14 reports the expansions recorded at 30 days for samples 1 and 2A, while for sample 3, the reported expansions were obtained after 60 days of curing. Figure 15 shows the values at 30 days for samples 2B 7dd and 2B 9dd.
The trend at the longer curing times reflects the one observed at the shorter period, with correlation factors close to those previously observed. The only condition where the correlation decreased is Procedure 1, where, according to the conditions, a possible leaching of the sodium ions can take place.
From these plots, some hypotheses can be made. The dependence of expansion on pore size reflects the influence of microstructure on the diffusion of the chemical species that take part in the formation of the expanding gel. It is thus possible to propose an explanation for both observed effects (the role of the matrix connectivity and macroporosities). As the effect of the sodium ions’ diffusion does not seem to be a prevailing feature, the formation of gel should not be restricted only to the volume inside or around the reactive aggregate, but part of the dissolved silica (H2SiO42− or H3SiO42−) can diffuse in the matrix and react all around the composite. In normal conditions (CS 0.65, CS 0.50, CS 0.42, and HRWR), this leads to a higher amount of reacted aggregate when capillary porosity increases and thus to a higher amount of gel. In the air-entrained samples, dissolved silica reacts mainly inside the macroporosities forming the gels, causing limited or negligible expansion. The main consequence is that porosity, or, more correctly, porosity distribution, should be inserted among the critical variables that influence expansion, and thus its evaluation should be performed to gain a deeper insight into the results of accelerated tests.

4. Conclusions

From the data collected to date, the following observations can be drawn:
  • Under all the different conditions in which accelerated tests were performed in this study, porosity largely influenced the extent of the recorded expansion.
  • The influence of porosity on the macroscopic expansion was not negligible, considering the strict limit that marks the difference between inert and potentially dangerous aggregates. According to the conditions and the curing times, the differences in the recorded expansion can span from about 100 to 300%, going from the highest to the lowest w/c ratio.
  • Increasing w/c ratios in cementitious materials led to higher levels of expansions under the same conditions, which were to some extent correlated with the mechanical properties of the materials. However, a more reliable correlation seems to exist between microstructure tortuosity (or connectivity), evaluated by means of the inflection point in the MIP results, and expansion, a feature that deserves further investigation.
  • Since microstructural parameters (porosity and porosity’s size distribution) exert such a remarkable effect on the degree of expansion, porosity (or connectivity) of the cementitious matrix should be included in the factors (temperature, humidity, alkalis concentration, and time) that influence expansion induced by ASR.

Author Contributions

Conceptualization, A.S.; methodology, A.S. and S.M.; validation, S.M.; formal analysis, A.S.; investigation, A.S.; resources, A.S.; data curation, S.M.; writing—original draft preparation, A.S.; writing—review and editing, A.S. and S.M.; visualization, S.M.; supervision, S.M. All authors have read and agreed to the published version of the manuscript.

Funding

This research received no external funding.

Institutional Review Board Statement

Not applicable.

Informed Consent Statement

Not applicable.

Data Availability Statement

Not applicable.

Conflicts of Interest

The authors declare no conflict of interest.

References

  1. Chatterji, S. Chemistry of alkali–silica reaction and testing of aggregates. Cem. Concr. Comp. 2005, 27, 788–795. [Google Scholar] [CrossRef]
  2. Fanijo, E.O.; Kolawole, J.T.; Almakrab, A. Alkali silica reaction in concrete structures: Mechanisms, effects and evaluation test methods adopted in the United States. Case Stud. Constr. Mater. 2021, 15, e00563. [Google Scholar] [CrossRef]
  3. Mo, X.; Fournier, B. Investigation of structural properties associated with alkali–silica reaction by means of macro- and micro-structural analysis. Mater. Charact. 2007, 58, 179–189. [Google Scholar] [CrossRef]
  4. Multon, S.; Sellier, A.; Cyr, M. Chemo-mechanical modelling for prediction of alkali silica reaction expansion. Cem. Concr. Res. 2009, 39, 490–500. [Google Scholar] [CrossRef] [Green Version]
  5. Figueira, R.B.; Sousa, R.; Coelho, L.; Azhena, M.; de Almeida, J.M.; Jorge, P.A.S.; Silva, C.J.R. Alkali-silica reaction in concrete: Mechanisms, mitigation and test methods. Constr. Build. Mat. 2019, 222, 903–931. [Google Scholar] [CrossRef]
  6. Kawamura, M.; Fuva, H. Effects of lithium salts on ASR gel composition and expansion of mortars. Cem. Concr. Res. 2003, 33, 913–919. [Google Scholar] [CrossRef]
  7. Mitchell, L.D.; Beaudoin, J.J.; Grattan-Bellew, P. The effects of lithium hydroxide solution on alkali silica reaction gels created with opal. Cem. Concr. Res. 2004, 34, 641–649. [Google Scholar] [CrossRef] [Green Version]
  8. Feng, X.; Thomas, M.D.A.; Bremner, T.W.; Folliard, K.J. New observations on the mechanism of lithium nitrate against alkali silica reaction (ASR). Cem. Concr. Res. 2010, 40, 94–101. [Google Scholar] [CrossRef]
  9. Collins, C.L.; Ideker, J.H.; Willis, G.S.; Kurtis, K.E. Examination of the effects of LiOH, LiCl, and LiNO3 on alkali-silica reaction. Cem. Concr. Res. 2004, 34, 1403–1415. [Google Scholar] [CrossRef]
  10. Moser, R.D.; Jayapalan, A.R.; Garas, V.Y.; Kurtis, K.E. Assessment of binary and ternary blends of metakaolin and Class C fly ash for alkali-silica reaction mitigation in concrete. Cem. Concr. Res. 2010, 40, 1664–1672. [Google Scholar] [CrossRef]
  11. Cyr, M.; Rivard, P.; Labeque, F. Reduction of ASR-expansion using powders ground from various sources of reactive aggregates. Cem. Concr. Comp. 2009, 31, 438–446. [Google Scholar] [CrossRef]
  12. Aquino, W.; Lange, D.A.; Olek, J. The influence of metakaolin and silica fume on the chemistry of alkali-silica reaction products. Cem. Concr. Comp. 2001, 23, 485–943. [Google Scholar] [CrossRef]
  13. Thomas, M. The effect of supplementary cementing materials on alkali-silica reaction: A review. Cem. Concr. Res. 2011, 41, 1224–1231. [Google Scholar] [CrossRef]
  14. Saha, A.K.; Khan, M.N.N.; Sarker, P.K.; Shaikh, F.A.; Pramanik, A. The ASR mechanism of reactive aggregates in concrete and its mitigation by fly ash: A critical review. Constr Build. Mat. 2018, 171, 743–758. [Google Scholar] [CrossRef]
  15. Saccani, A.; Sandrolini, F.; Andreola, F.; Corradi, A.; Lancellotti, I. Influence of the pozzolanic fraction obtained from vitrified bottom-ashes from MSWI on the properties of cementitious composites. Mater. Struct. 2005, 38, 367–371. [Google Scholar] [CrossRef]
  16. Menéndez, E.; Sanjuán, M.Á.; García-Roves, R.; Argiz, C.; Recino, H. Sustainable and durable performance of pozzolanic additions to prevent alkali-silica reaction (ASR) promoted by aggregates with different reaction rates. Appl. Sci 2020, 10, 9042. [Google Scholar] [CrossRef]
  17. Jensen, A.D.; Chatterji, S.; Christensen, P.; Thaulow, N. Studies of alkali-silica reaction-part II effect of air-entrainment on expansion. Cem. Concr Res. 1984, 14, 311–314. [Google Scholar] [CrossRef]
  18. Gillot, J.E.; Wang, H. Improved control of alkali-silica reaction by combined use of admixtures. Cem. Concr. Res. 1993, 23, 973–980. [Google Scholar] [CrossRef]
  19. Collins, R.J.; Bareham, P.D. Alkali-silica reaction: Suppression of expansion using porous aggregate. Cem. Concr. Res. 1987, 17, 89–96. [Google Scholar] [CrossRef]
  20. Saccani, A.; Motori, A. The effect of polymer addition on alkali silica reactions in cementitious mortars. Mater. Struct. 2001, 34, 373–377. [Google Scholar] [CrossRef]
  21. Feiteira, J.; Ribeiro, M.S. Polymer action on alkali–silica reaction in cement mortar. Cem. Concr. Res. 2013, 44, 97–105. [Google Scholar] [CrossRef] [Green Version]
  22. Lingard, J.; Andic-Cakir, O.; Fernandez, I.; Ronning, T.F.; Thomas, M.D.A. Alkali-silica reactions (ASR): Literature review on parameters influencing laboratory performance testing. Cem. Concr. Res. 2012, 42, 223–243. [Google Scholar] [CrossRef] [Green Version]
  23. Yi, C.K.; Ostertag, C.P. Mechanical approach in mitigating alkali silica reaction. Cem. Concr. Res. 2005, 35, 67–75. [Google Scholar] [CrossRef]
  24. Smaoui, N.; Bérubé, M.A.; Fournier, B.; Bissonnette, B.; Durand, B. Effects of alkali addition on the mechanical properties and durability of concrete. Cem. Concr. Res. 2005, 35, 203–212. [Google Scholar] [CrossRef]
  25. Diamond, S. MIP: An inappropriate method for the measurements of pore size distribution in cement based materials. Cem. Concr. Res. 2000, 30, 1517–1525. [Google Scholar] [CrossRef]
  26. Vocka, R.; Gallè, C.; Dubois, M.; Lovera, P. Mercury intrusion porosimetry and hierarchical structure of cement pastes: Theory and experiment. Cem. Concr. Res. 2000, 30, 521–527. [Google Scholar] [CrossRef]
  27. Gholizadeh-Vayghan, A.; Rajabipour, F. Quantifying the swelling properties of alkali-silica reaction (ASR) gels as a function of their composition. J. Am. Ceram. Soc. 2017, 100, 3801–3818. [Google Scholar] [CrossRef]
  28. Duchesne, J.; Berube, M.A. The effectiveness of supplementary cementing materials in suppressing expansion due to ASR: Another look at the reaction mechanisms part 1: Concrete expansion and portlandite depletion. Cem. Concr. Res. 1994, 24, 221–230. [Google Scholar] [CrossRef]
  29. Monteiro, P.J.M.; Wang, K.; Sposito, G.; Dos Santos, M.C.; De Andrade, W.P. Influence of mineral admixtures on the alkali-aggregate reaction. Cem. Concr. Res. 1997, 27, 1899–1909. [Google Scholar] [CrossRef]
  30. Hou, X.; Struble, L.J.; Kirkpatrick, R.J. Formation of ASR gel and the roles of C-S-H and portlandite. Cem. Concr. Res. 2004, 34, 1683–1696. [Google Scholar] [CrossRef]
  31. Shomglin, K.; Turanli, L.; Wenk, H.R.; Monteiro, P.J.M.; Sposito, G. The effects of potassium and rubidium hydroxide on the alkali-silica reaction. Cem. Concr. Res. 2003, 33, 1825–1830. [Google Scholar] [CrossRef]
Figure 1. MIP porosity of 2B mortars cured at 7 days.
Crystals 12 00646 g001
Figure 2. MIP porosity of 2B mortars cured at 90 days.
Crystals 12 00646 g002
Figure 3. MIP porosity of mortars 1, 2A, and 3 cured at 7 days.
Crystals 12 00646 g003
Figure 4. Mortars’ expansion according to Procedure 1.
Crystals 12 00646 g004
Figure 5. Mortars’ expansion according to Procedure 2A.
Crystals 12 00646 g005
Figure 6. Expansion according to Procedure 2B, relative to mortars cured for 7 days.
Crystals 12 00646 g006
Figure 7. Expansion according to Procedure 2B, relative to mortars cured for 90 days.
Crystals 12 00646 g007
Figure 8. Expansion according to Procedure 3 (38 °C and R.H. 100%).
Crystals 12 00646 g008
Figure 9. Reacted aggregate in CS 0.50 sample (a), and air void partially filled by ASR products in an AIR_E sample (b), after 30 days of curing (Procedure 2A).
Crystals 12 00646 g009
Figure 10. Expansion vs. mechanical strength for 2B mortars.
Crystals 12 00646 g010
Figure 11. Expansion vs. strength for 1, 2A, and 3 samples.
Crystals 12 00646 g011
Figure 12. Expansion vs. dimension of the most frequent pore for 1, 2A, and 3 samples at the shorter curing times (R2 values for linear interpolation reported).
Crystals 12 00646 g012
Figure 13. Expansion vs. dimension of the most frequent pore for samples 2B at 7 and 90 days at the shorter curing times (R2 values for linear interpolation reported).
Crystals 12 00646 g013
Figure 14. Expansion vs. dimension of the most frequent pore for 1, 2A, and 3 samples at the longer investigation times, i.e., 28 days for 1 and 2A and 60 days for 3 (R2 values for linear interpolation reported).
Crystals 12 00646 g014
Figure 15. Expansion vs. dimension of the most frequent pore for samples 2B 7dd and 2B 90dd at the longer curing times, i.e., 30 days (R2 values for linear interpolation reported).
Crystals 12 00646 g015
Table 1. Mix design of the investigated mortars.
Samplew/cAir-entraining Additive
(wt%) 1
High-Range Water-Reducing Additive (wt%) 1
CS 0.650.65--
CS 0.500.50--
CS 0.420.42--
HRWR0.35-1.5
AIR_E0.500.5-
1 Weight% on cement amount.
Table 2. Mechanical properties of the investigated materials * (Procedures 2B and 1-2A-3).
Sample7 Days (2B)90 Days (2B)7 Days (1-2A-3)
E (GPa)Rc (MPa)E (GPa)Rc (MPa)E (GPa)Rc (MPa)
CS 0.6537.230.038.642.636.928.6
CS 0.5038.539.140.551.537.137.3
CS 0.4238.143.540.456.436.941.1
HRWR38.958.841.270.237.856.3
AIR_E19.321.620.623.918.818.9
* E: elastic modulus; Rc: compressive strength.
Table 3. Microstructural features of the investigated mortars derived from MIP.
Sample Inflection Point (μm)
1–2A–32B (7 Days)2B (90 Days)
CS 0.650.0830.0790.064
CS 0.500.0530.0490.047
CS 0.420.0500.0430.041
HRWR0.0410.0360.030
Table 4. Ca(OH)2 amounts (wt%) in the different mortars.
Sample7 Days90 Days
CS 0.6512.716.3
CS 0.5012.015.4
CS 0.4212.413.9
HRWR10.913.2
AIR_E11.815.4
Publisher’s Note: MDPI stays neutral with regard to jurisdictional claims in published maps and institutional affiliations.

