Article

Kirkendall Effect in Twin-Roll Cast AA 3003 Aluminum Alloy

1
Faculty of Mathematics and Physics, Charles University, Ke Karlovu 5, 121 16 Prague, Czech Republic
2
Research Group Computed Tomography, University of Applied Sciences Upper Austria, Stelzhamerstraße 23, 4600 Wels, Austria
*
Author to whom correspondence should be addressed.
Crystals 2022, 12(5), 607; https://doi.org/10.3390/cryst12050607
Submission received: 30 March 2022 / Revised: 21 April 2022 / Accepted: 23 April 2022 / Published: 25 April 2022
(This article belongs to the Section Crystalline Metals and Alloys)

Abstract

:
The formation of an inhomogeneous structure with central segregation occurs in commercial twin-roll cast AA 3003 aluminum alloy. The segregations form as manganese, iron, and silicon-rich channels spread in the rolling direction. Diffusion of silicon occurs during annealing at 450 °C, and the formation and growth of voids due to the Kirkendall effect occur. The evolution of pores studied by scanning electron microscopy and X-ray computed tomography shows that pores are formed near original pure silicon clusters. Their coalescence and the formation of large voids in the central zone of the strip occur at longer annealing times.

1. Introduction

Al-Mn alloys are often used in heat exchangers in the automobile industry or the food packing industry due to their appropriate strength, excellent corrosion resistance, and formability [1,2]. Twin-roll casting (TRC) of aluminum strips is characterized by high cooling rates (500 K/s). Therefore, the cast material exhibits features of a significantly supersaturated solid solution with refined grains and finely dispersed primary particles [3]. On the other hand, inhomogeneities such as macro and micro segregations can be found in the TRC strip [3,4,5,6]. Birol [4] focused on the solidification path of several aluminum alloys. He showed that AA3003 alloy has a long solidification range, which makes the alloy more prone to macro-segregation. Macro segregation forms due to fast and inhomogeneous solidification during the TRC process. Solidification fronts rapidly advance from cooled rolls while pushing the liquid melt in front of them.
The concentration of solutes in the liquid phase gradually increases until the solidification fronts meet near the central plane. The remaining liquid with a high concentration of alloying elements solidifies, forming inhomogeneous central macrosegregation. Central macrosegregation forms cylindrical, low melting point regions oriented in the casting direction [3,4,5]. Such channels located in the central plane have almost constant spacing, and they are at least an order of magnitude larger in size than dendritic grains in their vicinity [4,5,7]. Phases such as orthorhombic Al6(Mn,Fe) or cubic Al12−15(Mn,Fe)3Si1−2 are frequently observed in central segregations in Al-Mn-Fe-Si alloys. Silicon is partially present in the phases together with manganese and iron. However, it can also form clusters of pure silicon particles located in the interspace of Al-Fe-Mn-Si dendrites [5,8,9,10,11]. The formation of these defects usually reduces the strength of the material, worsens mechanical properties, and can influence fatigue behavior [7,12]. Therefore, aluminum alloys of this type are heat-treated during industrial processing. Al-Fe-Mn-Si type segregation cannot be entirely eliminated by a homogenization cycle [4,6]. Nevertheless, diffusion processes can modify this central macro segregation system. In the case of sufficient differences in the diffusivity for some elements, pores or voids may form in place of the fast diffusing element, causing material deterioration due to the Kirkendall effect [9,10]. The Kirkendall effect is a classical phenomenon in metallurgy. It refers to a nonreciprocal mutual diffusion process through an interface of two metals so that vacancy flux compensating the inequality of the material flow occurs [13]. It can also be observed on the “nano” scale. Experiments preparing nanotubes or empty spheres were done on several systems [14,15], Ni-Cr wires in aluminum [16,17], or on Ti-Al intermetallic compounds [18]. The Kirkendall effect on the Si-Al interface is known in the macroscopic scale [19]. It is often observed on the aluminum coating in semiconductors [20,21]. Comprehensive studies comparing calculated and experimental diffusivities of Al-Si were done by Cao et al. [22]. Aruga et al. [9] performed several experiments on Al-0.4Mg-0.4Si (wt.%) alloy at a lower temperature using an atom probe. They observed a smaller atomic density inside Si-rich clusters annealed at 170 °C, suggesting that clusters trap many vacancies introduced by quenching. However, a traditional approach describing the voids nucleation as classical nucleation from the metal core supersaturated with vacancies produced by the Kirkendall effect was shown to be unfeasible even in the bulk interdiffusion zone [23,24,25].
Standard methods of voids formation analysis (such as light optical microscopy (LOM) or scanning electron microscopy (SEM)) are carried out in 2D and cannot disclose the 3D feature of such objects. Acquiring 3D information would require analysis of multiple cuts through the sample, which is hardly feasible, time-consuming, and destructive for the specimen. An example of a non-destructive method of material characterization is X-ray computed tomography (XCT), which has become an essential technique for the 3D characterization of materials [26]. XCT uses an X-ray source, a turntable, and a digital detector. A specimen is placed on a rotary table between the X-ray source and detector. Projection images are generated at various angular positions. Hundreds of projection images are needed to reconstruct a 3D dataset with a mathematical algorithm. Typically, a filtered back-projection algorithm (e.g., Feldcamp et al. [27]) is used and implemented in the reconstruction software tools from the XCT device manufacturer. The generated volumetric dataset consists of volumetric pixels, so-called voxels, which feature a grey value corresponding to the X-ray absorption contrast, mainly influenced by the density and the atomic number of the elements within that voxel [28]. With conventional XCT methods, spatial resolutions up to (0.5 μm)3 voxel size are possible [26]. Additional phase contrast effects can increase by edge enhancement the visibility of small structures and of features that are only slightly different in attenuation [29]. Several experiments have been done on Al-Si or Al-Si-Mg alloys using the XCT method for micro-pore detection [30,31,32]. However, they are focused on cast alloys containing larger pores. The present study aims to characterize the evolution of significantly finer voids in the central segregation zone in a commercial twin-roll cast AA3003 aluminum strip during a model thermal treatment.

2. Materials and Methods

Commercial TRC Al 3003 alloy with the composition given in Table 1 was studied in the experiment.
Previous XCT experiments on this alloy [5,33] revealed a decrease in the material density in the zone of segregation channels. In order to investigate this phenomenon, new smaller samples, allowing higher resolution of XCT 3D mapping, were prepared. A rectangle sample with an approximately square 8 × 8 mm2 base several cm long along the rolling direction was cut from the TRC sheet. Central segregation channels had been located within the XCT scan. Subsequently, 44 mm long cylinders with a diameter of around 1 mm were machined from the sample, and several XCD 3D scans were performed on different cylinders in the as-cast state. A selected sample was then ex-situ heat-treated in an air furnace before each XCT 3D scan. Isothermal annealing was done at 450 °C, and a selected volume (1 mm in height) was examined by XCT after 0.25, 0.5, 1, 2, 4, 8, 16, and 32 h of total annealing time.
X-ray computed tomography measurements were carried out using an RX Easy Tom 160 with a 1920 × 1536 Varian flat panel detector and a 160 keV nano-focus tube with a tungsten transmission target, a LaB6 filament, and an external liquid cooling system to stabilize measurements. The scans were performed with 60 keV acceleration voltage using 118 μA, achieving a voxel size of (0.9 μm)3. By recording 1440 projection images, the average XCT scan time scan was 2 h. Reconstruction was done with the software X-Act from RX Solutions. For visualization and evaluation, the software VGStudio MAX 3.1 was used. Examined volume was chosen in the inner part of the cylindric sample to reduce the influence of artifacts. For noise reduction, a non-local means filter (value 1.2) was applied, the starting value for the advanced surface determination was chosen to be μ + 3.5 σ. μ is the expected value of the Gaussian distribution from the matrix material, and the standard deviation is σ.
Scanning electron microscopy (SEM) was performed on a specimen cut in the RD×ND plane. The specimen was mechanically ground on SiC papers before the first observation and rinsed in methanol. No further polishing with finer suspension was used to avoid the contamination of existing pores with polishing products. Observation and chemical analysis by energy dispersive spectroscopy (EDS) was performed on the scanning electron microscope FEI Quanta 200 FX FEG at 15 kV. This specimen was further ex-situ annealed in the same way as the one used for XCT observations.

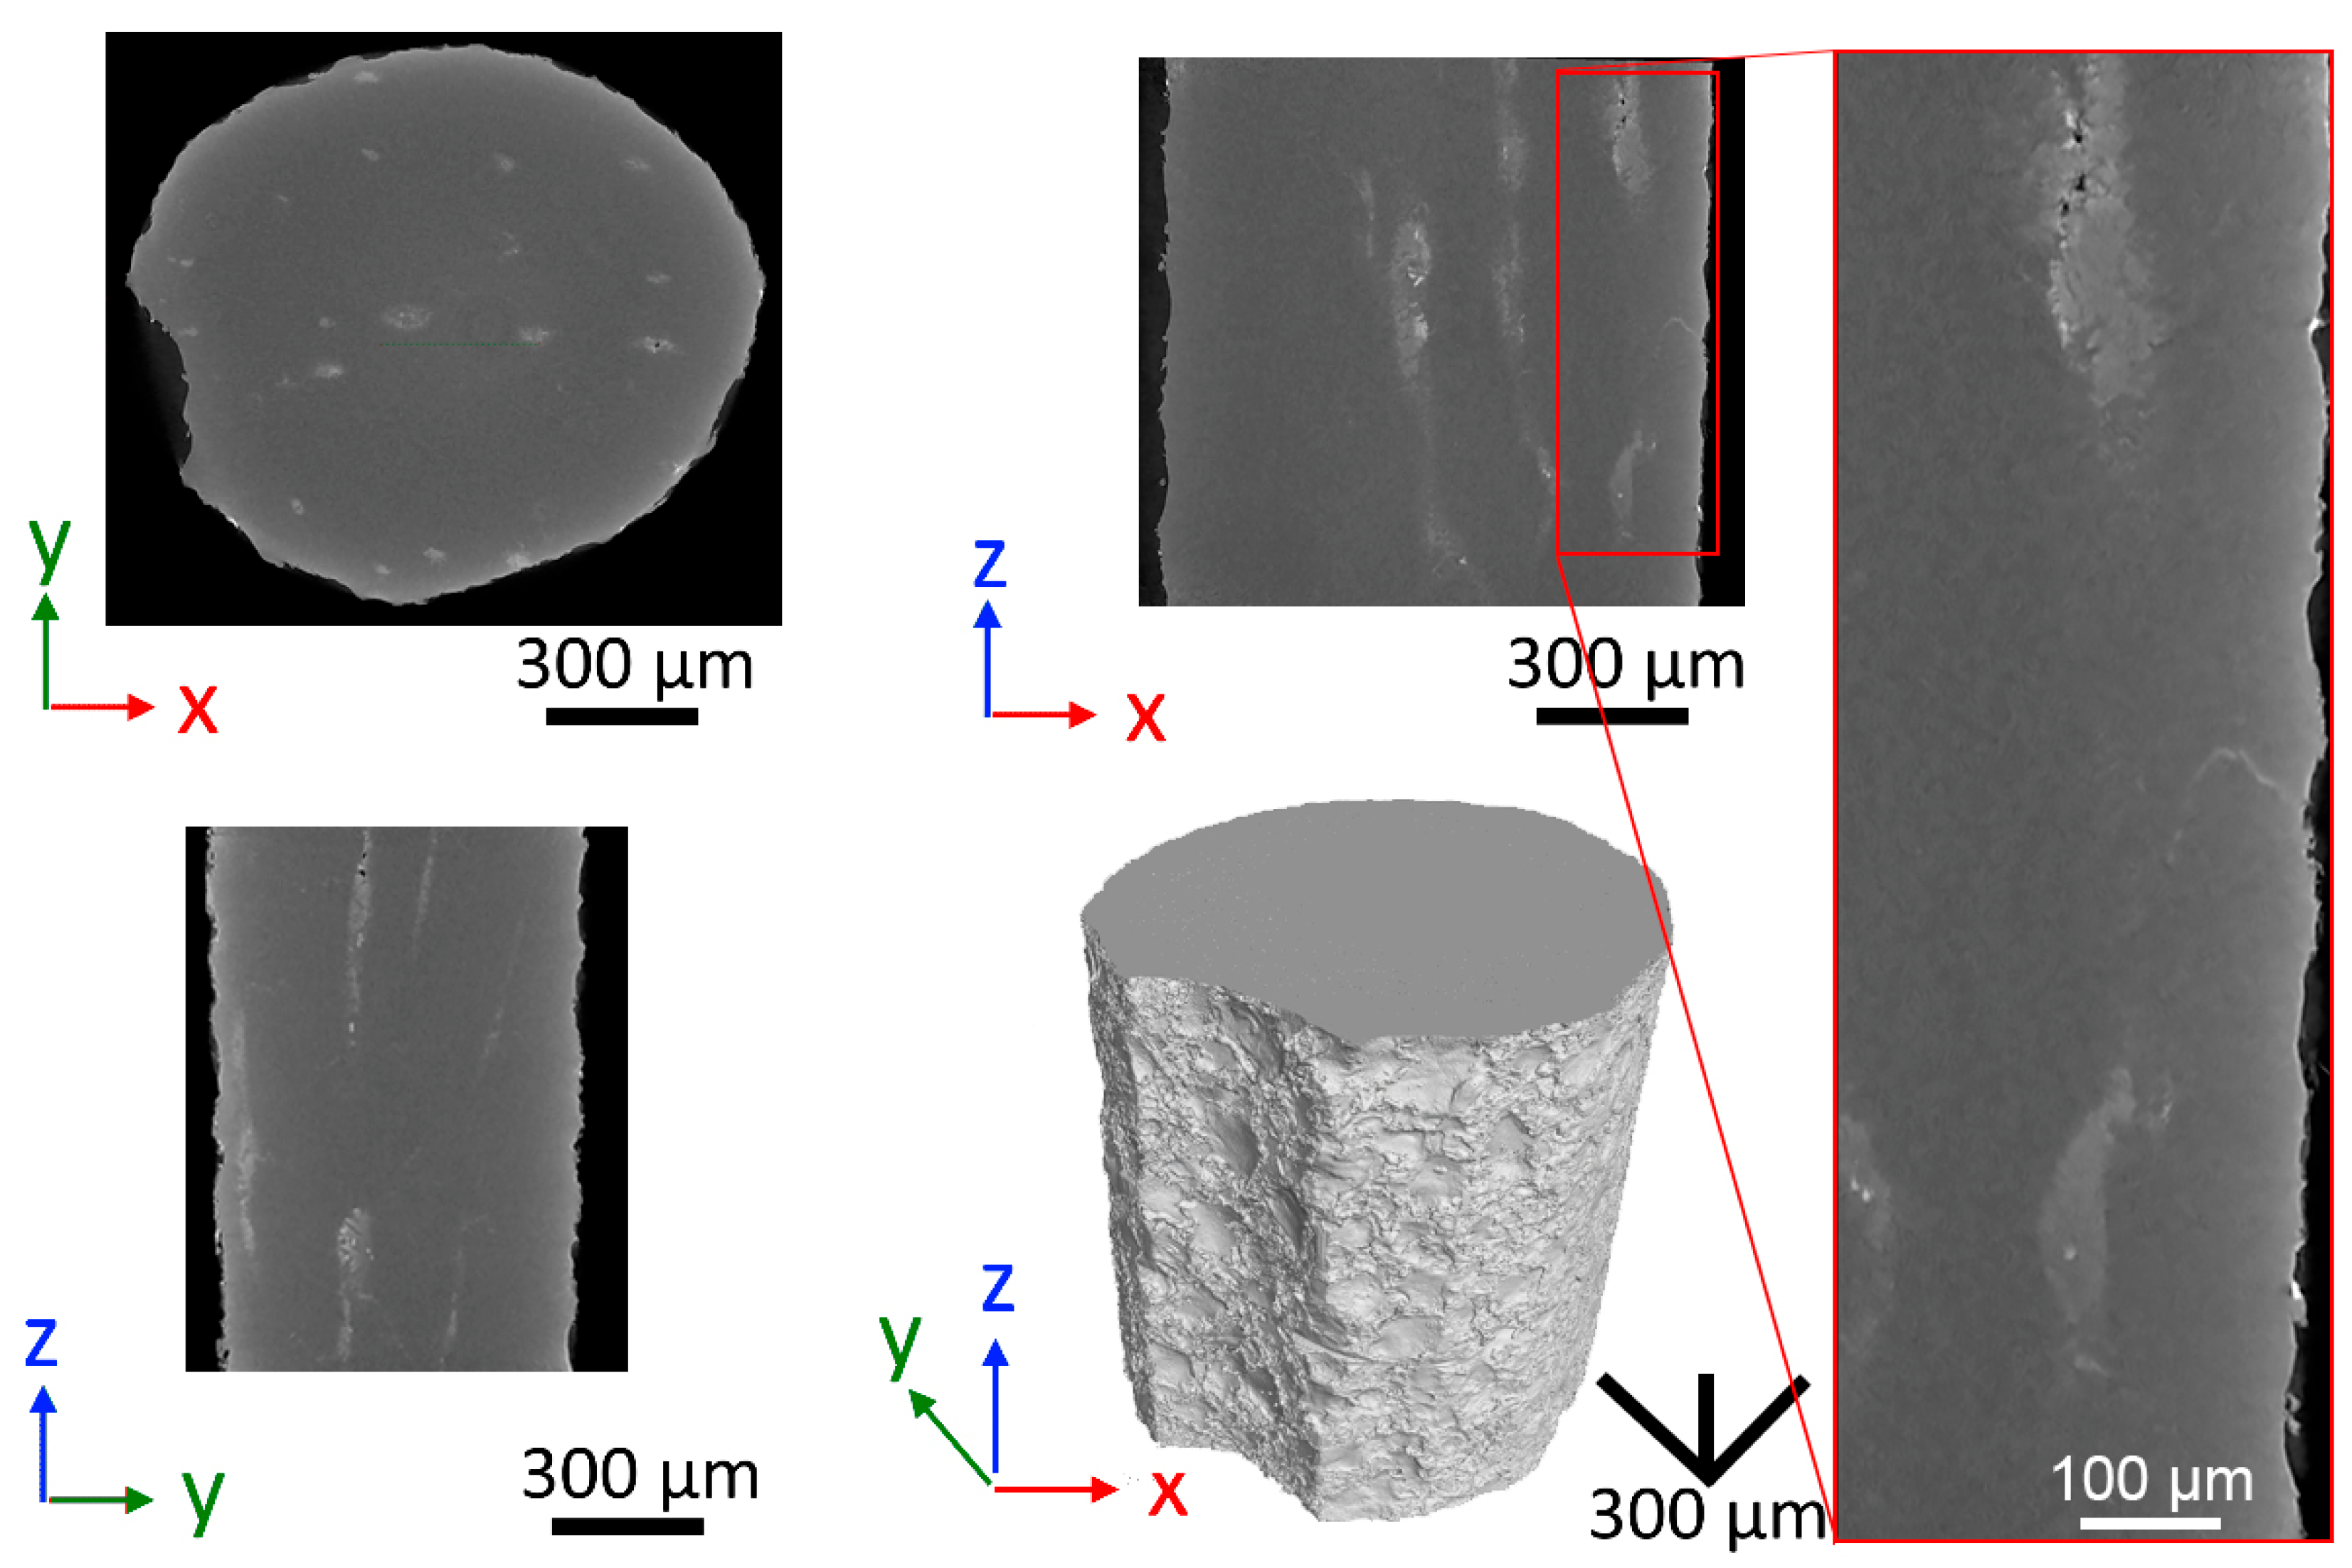
3. Results and Discussion

Figure 1 shows a selected area of the specimen in the as-cast condition and elemental EDS maps of primary solutes. The micrograph received with backscattered electrons (BSE) reflects a structure typical for TRC AA3003 aluminum alloys in the zone with central segregation [5]. Coarse particles of complex primary phases rich in Fe and Mn are well described in the literature, and they are generally identified as the orthorhombic Al6(Fe, Mn) phase (see, e.g., [7,34,35]). As follows from the EDS analysis, the central part of the observed zone contains particles of pure silicon grouped into clusters in the interspace of Al6(Fe, Mn) particles. Their average diameter is 2–3 μm. The BSE image confirms that specific porosity is already present in the as-cast state, apparently due to shrinkage during a fast solidification in the course of TRC. This effect is generally observed in Al-Si-based cast alloys with higher Si content [31,32] and could be expected in our alloy in a limited form.
Figure 2 and Figure 3 show representative microstructures in the same specimen area annealed at 450 °C for 8 and 32 h, respectively. A gradual dissolution of silicon particles in clusters occurs at this temperature. In contrast, the morphology of Fe- and Mn-rich primary particles is not affected by the annealing at this temperature. The observations mentioned above could be in a simplified manner easily interpreted when diffusion coefficients of Si, Fe, and Mn at this temperature are considered. The diffusion coefficient D of Si in Al [19,36] is already relatively high at this temperature (~2·10−14 m2 s−1), giving a maximum diffusion length of ~50 μm after 32 h at 450 °C. This length is comparable with the thickness of the central segregation zone [3,4,5,6,7]. Silicon thus could vacate the central segregation zone and interact with diluted Mn or finer and less stable Fe and Mn-rich particles from surrounding dendritic grains. Diffusion coefficients of Fe and Mn are three to four orders lower [36], giving the maximum diffusion length in several micrometers. However, this simplified estimation based on Fe and Mn interdiffusion in Al could not be applied to coarse Al6(Fe, Mn) primary particles in the central segregation zone. Most probably, coarse Al6(Fe, Mn)-phase particles are more stable due to the low diffusivity of Fe and Mn in coarse intermetallic phases (D ~10−21 m2 s−1 for Fe in FeAl [37]), and their transformation generally occurs at higher temperatures (above 560 °C [3]), obeying our SEM observations. Silicon particles entirely dissolve after 32 h at 450 °C, and SEM analysis clearly shows that successively growing voids are always adjacent to silicon particles. Therefore, they are present exclusively inside the original Si clusters. Their formation is in accordance with macroscopic and nanoscale diffusion calculations and experiments [21,22,23,24], referred to as the Kirkendall effect induced by a lower self-diffusion coefficient of Al in the matrix compared to the Si inter-diffusion coefficient [19]. This observation supports the results of numerical models stating that voids form preferentially at material interfaces, and the reduction of the interface free energy causes a reduction in the energy barrier [38].
In order to receive statistically more relevant data, XCT experiments were performed on cylindrical specimens with a volume of ~1 mm3 in the as-cast state. Figure 4 shows an example of a 3D image and three orthogonal slice images close to the center of the cylinder. The individual slice images confirm the presence of scattered and rare voids already in the initial state in channels containing central segregations. Voids are represented as low X-ray attenuation areas in the form of darker spots in the orthogonal slice images, while brighter, high attenuation areas relate to the presence of Fe, Mn, and Si-rich central segregations. The average number of voids is statistically very low, below ~100 in 1 mm3, and their volume fraction is almost negligible (<0.001%). Their average volume measured by XCT is relatively high (60–70 μm3) compared to the size of voids in the as-cast state or in the annealed specimens observed by SEM. This difference is most probably connected with the resolution limit of the method (tiny voids could not be detected). However, as mentioned above, they were formed by different mechanisms (shrinkage) typical for industrial TRC materials. Nevertheless, their low number and volume fraction could have only a negligible influence on the final statistics of voids formed at longer annealing times.
Dimensions of clusters of voids in the 3D projection, schematic representations of voids, and a color code illustrating the volume of individual voids in the specimen annealed at 450 °C between 0.25 h and 32 h are shown in Figure 5. Arrangements of voids into channels parallel to the rolling direction of the strip could be recognized. Figure 5 documents the gradual increase of the number of voids with increasing annealing time in the studied volume and the advance of their coalescence above 4 h of annealing.
2D slices in Figure 6 shows in detail the evolution of voids in a selected region of interest marked by an arrow in Figure 5.
A summary of the statistical evaluation of the received results can be found in Figure 7. Although the accuracy of results is partially limited by XCT resolution, data processing, and statistical distribution of the void size (estimated scatter of values in Figure 7 is about 10%), several important conclusions follow from the graphs. Saturation of the number of voids, and a slower rise of the total void volume above 4 h, indicate dissolution of a majority of smaller particles in silicon clusters and the beginning of voids coalescence. Following a simple assumption of the controlling role of the diffusion coefficient of Si in the Al matrix [19,36], the maximal diffusion length of Si in the Al matrix is around 17 μm after 4 h of annealing at 450 °C. This value could assure a sufficient driving force for an intensive dissolution of insulated primary Si particles during this annealing period because their size (2–5) μm is well below this characteristic distance. However, due to the clustering of original Si particles and the size of clusters (10–50 μm, see Figure 1), the dissolution of the first Si particles in the cluster rises the Si supersaturation in their vicinity. The higher Si concentration could successfully hinder the dissolution of Si particles in the center of the cluster. Therefore, the dissolution of particles at the rim of the cluster occurs first, associated with the formation of individual voids, in accordance with our SEM observations (compare Figure 1 and Figure 2). As a result, annealing times longer than 4 h are necessary to dissolve the whole cluster, despite the size of individual particles in the cluster. The final dissolution of the cluster is then connected with a further decrease of the Si concentration in the zone of the original cluster and further growth and coalescence of already formed voids. The intensity of the coalescence of voids is most pronounced in the specimen annealed for 32 h. Our estimations based on the Si diffusion coefficient [19,36] give the value of 50–70 μm of the diffusion length after 32 h of annealing. This value is comparable with the diameter of Si clusters. Their entire dissolution and a subsequent decrease of the Si concentration to equilibrium values increase the vacancy concentration in this zone due to the Kirkendall effect. The average number of voids drops by approximately 25%, and the average voids volume increases by almost 70%. Following numerical estimations and experimental observations performed on solder joints, the driving force for such coalescence is the release of stored surface energy at the interface void/matrix and diffusion processes enhanced by elevated vacancy concentration [39,40].

4. Conclusions

Microstructural processes in a commercial TRC AA 3003 aluminum alloy were studied in specimens annealed at 450 °C. SEM and XCT observations confirm the formation of microscopic voids in the zone of central segregation of the strip. Their formation is related to the Kirkendall effect evoked by the presence and dissolution of primary silicon particles. They form in zones of original silicon particles clusters, and their number and average volume increase with the increase of the annealing time. A coalescence of voids begins after 4 h of annealing, resulting in a decrease in their number in the material. Almost all silicon particles dissolve after 32 h of exposure to elevated temperature, which is directly connected with significant growth of the size of voids.
In general, these voids could be successfully healed during subsequent downstream processing, including cold rolling with a high reduction (~98% in strips cast at 6–9 mm). However, attempts to perform homogenization on thinner strips (directly cast or cold rolled before the homogenization step to thicknesses <5 mm) could not necessarily assure their sufficient healing during subsequent treatments, and unfavorable elevated porosity of the final sheet or foil could significantly deteriorate their properties.

Author Contributions

Concept of the experiment, methodology, and preparation of material: M.C., J.K., B.P.; XCT and SEM experiments: J.B., M.Š., S.Z.; analysis of results and interpretation: J.B., S.Z., L.B.; draft preparation: J.B., S.Z., L.B., M.Š.; review and editing: M.C., J.K., B.P. All authors have read and agreed to the published version of the manuscript.

Funding

GAUK 1572218, Mobility 7AMB17AT046, FFG COMET 871974, FFG BeyondInspection 874540.

Institutional Review Board Statement

Not applicable.

Informed Consent Statement

Not applicable.

Data Availability Statement

The data that support the findings of this study are available from the corresponding author upon reasonable request.

Acknowledgments

Financial support of projects GAUK 1572218 and Mobility 7AMB17AT046 are gratefully acknowledged. XCT investigations were performed under the scope of the COMET program within the research projects “Photonic Sensing for Smarter Processes (PSSP)” (contract number 871974) and “BeyondInspection” (contract number 874540), funded by the Austrian research funding association (FFG).

Conflicts of Interest

The authors declare no conflict of interest.

References

  1. Huang, K.; Li, Y.J.; Marthinsen, K. Effect of heterogeneously distributed pre-existing dispersoids on the recrystallization behavior of a cold-rolled Al–Mn–Fe–Si alloy. Mater. Charact. 2015, 102, 92–97. [Google Scholar] [CrossRef]
  2. Huang, L.; Huang, G.; Cao, L.; Wu, X. Influence of pre-recovery on the subsequent recrystallization and mechanical properties of a twin-roll cast Al-Mn alloy. Mater. Sci. Eng. A 2017, 682, 63–72. [Google Scholar] [CrossRef]
  3. Birol, Y. Homogenization of a twin-roll cast thin Al–Mn strip. J. Alloys Compd. 2009, 471, 122–127. [Google Scholar] [CrossRef]
  4. Birol, Y. Analysis of macro segregation in twin-roll cast aluminium strips via solidification curves. J. Alloys Compd. 2009, 486, 168–172. [Google Scholar] [CrossRef]
  5. Šlapáková, M.; Zimina, M.; Zaunschirm, S.; Kastner, J.; Bajer, J.; Cieslar, M. 3D analysis of macrosegregation in twin-roll cast AA3003 alloy. Mater. Charact. 2016, 118, 44–49. [Google Scholar] [CrossRef]
  6. Kamat, R.G. AA3104 can-body stock ingot: Characterization and homogenization. J. Mater. 1996, 48, 34–38. [Google Scholar] [CrossRef]
  7. Lv, Z.; Du, F.; An, Z.; Huang, H.; Xu, Z.; Sun, J. Centerline segregation mechanism of twin-roll cast A3003 strip. J. Alloys Compd. 2015, 643, 270–274. [Google Scholar] [CrossRef]
  8. Wang, T.; Chen, X.; Luo, X.; Jiang, H.; Chen, M.; Wang, Z. Formation of Si nanoparticle in Al matrix for Al-7wt.%Si alloy during complex shear flow casting. J. Alloys Compd. 2018, 739, 30–34. [Google Scholar] [CrossRef]
  9. Aruga, Y.; Kozuka, M.; Sato, T. Formulation of initial artificial age hardening response in an Al-Mg-Si alloy based on the cluster classification using a high-detection-efficiency atom probe. J. Alloys Compd. 2018, 739, 1115–1123. [Google Scholar] [CrossRef]
  10. Aruga, Y.; Kim, S.N.; Kozuka, M.; Kobayashi, E.; Sato, T. Effects of cluster characteristics on two-step aging behavior in Al-Mg-Si alloys with different Mg/Si ratios and natural aging periods. Mater. Sci. Eng. A 2018, 718, 371–376. [Google Scholar] [CrossRef]
  11. Dehmas, M.; Valdés, R.; Lanfont, M.-C.; Lacaze, J. Identification of intermetallic precipitates formed during resolidification of brazed aluminium alloys. Scr. Mater. 2006, 55, 191–194. [Google Scholar] [CrossRef] [Green Version]
  12. Xin, S.; Tan, L.; Guangming, X. Composition Homogenization Evolution of Twin-Roll Cast 7075 Aluminum Alloy Using Electromagnetic Field. Rare Metal Mat. Eng. 2015, 44, 581–586. [Google Scholar] [CrossRef]
  13. Kirkendall, E.O. Diffusion of zinc in alpha brass. Tran. Metall. AIME 1942, 147, 104–110. [Google Scholar]
  14. Fan, H.J.; Gösele, U.; Zacharias, M. Formation of Nanotubes and Hollow Nanoparticles Based on Kirkendall and Diffusion Processes: A Review. Small 2007, 3, 1660–1671. [Google Scholar] [CrossRef]
  15. Aldinger, F. Controlled porosity by an extreme Kirkendall effect. Acta Metall. 1974, 22, 923–928. [Google Scholar] [CrossRef]
  16. Paz y Puente, A.E.; Dunand, D.C. Effect of Cr content on interdiffusion and Kirkendall pore formation during homogenization of pack-aluminized Ni and Ni-Cr wires. Intermetallics 2018, 101, 108–115. [Google Scholar] [CrossRef]
  17. Fan, H.J.; Knez, M.; Scholz, R.; Hesse, D.; Nielsch, K.; Zacharias, M.; Gösele, U. Influence of Surface Diffusion on the Formation of Hollow Nanostructures Induced by the Kirkendall Effect: The Basic Concept. Nano Lett. 2007, 7, 993–997. [Google Scholar] [CrossRef]
  18. Chen, M.R.; Jiang, Y.; He, Y.H.; Lin, L.W.; Huang, B.Y.; Liu, C.T. Pore evolution regulation in synthesis of open pore structured Ti–Al intermetallic compounds by solid diffusion. J. Alloys Compd. 2012, 521, 12–15. [Google Scholar] [CrossRef]
  19. Fujikawa, S.; Hirano, K.; Fukushima, Y. Diffusion of silicon in aluminum. Metall. Trans. A 1978, 9, 1811–1815. [Google Scholar] [CrossRef]
  20. Urrejola, E.; Peter, K.; Plagwitz, H.; Schubert, G. Distribution of Silicon in the Aluminum Matrix for Rear Passivated Solar Cells. Energy Procedia 2011, 8, 331–336. [Google Scholar] [CrossRef] [Green Version]
  21. Kranz, C.; Baumann, U.; Wolpensinger, B.; Lottspeich, F.; Müller, M.; Palinginis, P.; Brendel, R.; Dullweber, T. Void formation in screen-printed local aluminum contacts modeled by surface energy minimization. Sol. Energy Mater. Sol. Cells 2016, 158, 11–18. [Google Scholar] [CrossRef]
  22. Cao, D.; Liu, Y.; Su, X.; Wang, J.; Tu, H.; Huang, J. Diffusion mobilities in the fcc A1 Cu–Si, Al–Si and Al–Cu–Si alloys. J. Alloys Compd. 2013, 551, 155–163. [Google Scholar] [CrossRef]
  23. Haag, S.T.; Richard, M.-I.; Welzel, U.; Favre—Nicolin, V.; Balmes, O.; Richter, G.; Mittemeijer, E.J.; Thomas, O. Concentration and Strain Fields inside a Ag/Au Core−Shell Nanowire Studied by Coherent X-ray Diffraction. Nano Lett. 2013, 13, 1883–1889. [Google Scholar] [CrossRef] [PubMed]
  24. Klinger, L.; Rabkin, E. On the nucleation of pores during the nanoscale Kirkendall effect. Mater. Lett. 2015, 161, 508–510. [Google Scholar] [CrossRef]
  25. Gusak, A.M.; Hodaj, F.; Zaporozhets, T.V. Thermodynamics of void nucleation in nanoparticles. Philos. Mag. Lett. 2011, 91, 741–750. [Google Scholar] [CrossRef]
  26. Kastner, J.; Harrer, B.; Degischer, H.P. High resolution cone beam X-ray computed tomography of 3D-microstructures of cast Al-alloys. Mater. Charact. 2011, 62, 99–107. [Google Scholar] [CrossRef]
  27. Feldkamp, L.A.; Davis, L.C.; Kress, J.W. Practical cone-beam algorithm. J. Opt. Soc. Am. A 1984, 1, 612–619. [Google Scholar] [CrossRef] [Green Version]
  28. Kastner, J.; Zaunschirm, J.S.; Baumgartner, S.; Requena, G.; Pinto, H.; Garcés, G. 3D-Microstructure Characterization of Thermomechanically Treated Mg-Alloy by High Resolution X-ray Computed Tomography. In Proceedings of the 11th European Conference on Nondestructive Testing (ECNDT 2014), Prague, Czech Republic, 6–10 October 2014. [Google Scholar]
  29. Kastner, J.; Plank, B.; Requena, G. Non-destructive characterisation of polymers and Al-alloys by polychromatic cone-beam phase contrast tomography. Mater. Charact. 2012, 64, 79–87. [Google Scholar] [CrossRef]
  30. Zhang, Q.; Wang, T.; Yao, Z.; Zhu, M. Modeling of hydrogen porosity formation during solidification of dendrites and irregular eutectics in Al–Si alloys. Materialia 2018, 4, 211–220. [Google Scholar] [CrossRef]
  31. Lashkari, O.; Yao, L.; Cockcroft, S.; Maijer, D. X-Ray Microtomographic Characterization of Porosity in Aluminum Alloy A356. Metall Mater. Trans. A 2009, 40, 991–999. [Google Scholar] [CrossRef]
  32. Nicoletto, G.; Anzelotti, G.; Konečná, R. X-ray computed tomography vs. metallography for pore sizing and fatigue of cast Al-alloys. Procedia Eng. 2010, 2, 547–554. [Google Scholar] [CrossRef] [Green Version]
  33. Bajer, J.; Zaunschirm, S.; Šlapáková Poková, M.; Zimina, M. 3D analysis of macrosegregation in twin-roll cast AA3003 alloy before and after heat treatment. In Proceedings of the METAL 2018—27th International Conference on Metallurgy and Materials, Brno, Czech Republic, 23–25 May 2018. [Google Scholar]
  34. Cieslar, M.; Slámová, M.; Hájek, M.; Veselý, J. Effect of Thermomechanical Pretreatment on Mechanical Properties of Modified Al-Mn-Fe-Si Based Alloys. Mater. Sci. Forum. 2008, 347, 130–135. [Google Scholar] [CrossRef]
  35. Li, Y.J.; Arnberg, L. Evolution of eutectic intermetallic particles in DC-cast AA3003 alloy during heating and homogenization. Mater. Sci. Eng. A 2003, 347, 130–135. [Google Scholar] [CrossRef]
  36. Du, Y.; Chang, Y.A.; Huang, B.; Gong, W.; Jin, Z.; Xu, H.; Yuan, Z.; Liu, Y.; He, Y.; Xie, F.-Y. Diffusion coefficients of some solutes in fcc and liquid Al: Critical evaluation and correlation. Mater. Sci. Eng. A 2003, 363, 140–151. [Google Scholar] [CrossRef]
  37. Eggersmann, M.; Mehrer, H. Diffusion in intermetallic phases of the Fe-Al system. Philos. Mag. A 2000, 80, 1219–1244. [Google Scholar] [CrossRef]
  38. Sivadasan, V.; Rhead, S.; Leadley, D.; Myronov, M. Kirkendall void formation in reverse step graded Si1−xGex/Ge/Si(001) virtual substrates. Semicond. Sci. Technol. 2018, 33, 024002. [Google Scholar] [CrossRef]
  39. Müller, W.H.; Weinberg, K.; Böhme, T. On the effect of Kirkendall voids on solder joint reliability. PAMM 2008, 7, 4030035–4030036. [Google Scholar] [CrossRef]
  40. Weinberg, K.; Boehme, T. Condensation and growth of Kirkendall voids in intermetallic compounds. IEEE Trans. Compon. Packag. Manuf. Technol. 2009, 32, 684–692. [Google Scholar] [CrossRef] [Green Version]
Figure 1. BSE image and elemental maps of main alloying elements in the as-cast strip. Arrows indicate selected small voids in the as-cast material in the BSE image.
Crystals 12 00607 g001
Figure 2. Microstructure of the TRC specimen after annealing at 450 °C for 8 h. Original and newly formed voids appear as darker areas in the BSE image.
Crystals 12 00607 g002
Figure 3. SEM image showing the dissolution of silicon particles and growth of voids (darker areas in the BSE image) in the specimen annealed at 450 °C for 32 h.
Crystals 12 00607 g003
Figure 4. 3D representation of the as-cast specimen and three orthogonal slice images through a pore-rich area close to the border of the specimen.
Crystals 12 00607 g004
Figure 5. Evolution of Kirkendall voids (clusters) during isothermal annealing at 450 °C between 0.25 h and 32 h.
Crystals 12 00607 g005
Figure 6. Evolution of a selected cluster of Kirkendall voids (marked by an arrow in Figure 5) during isothermal annealing at 450 °C between 0.25 h and 32 h.
Crystals 12 00607 g006
Figure 7. Summary of main features of Kirkendall voids formed during isothermal annealing at 450 °C between 0.25 h and 32 h.
Crystals 12 00607 g007
Table 1. Chemical composition of TRC AA 3003 alloy (wt.%).
AlMnFeSiCuZrCr
Balance1.00.20.50.20.2∼0.1
Publisher’s Note: MDPI stays neutral with regard to jurisdictional claims in published maps and institutional affiliations.

