
Investigation of Low-Calcium Circulating Fluidized Bed Fly Ash on the Mechanical Strength and Microstructure of Cement-Based Material

 ,
, 
Abstract
:1. Introduction
2. Materials and Methods
2.1. Experimental Proportion and Sample Preparation
2.2. Experimental Method
2.3. Methods of Analysis
- (1)
- Workability property
- (2)
- Compressive strength
- (3)
- Micro measurement and analysis methods.
3. Results and Discussion
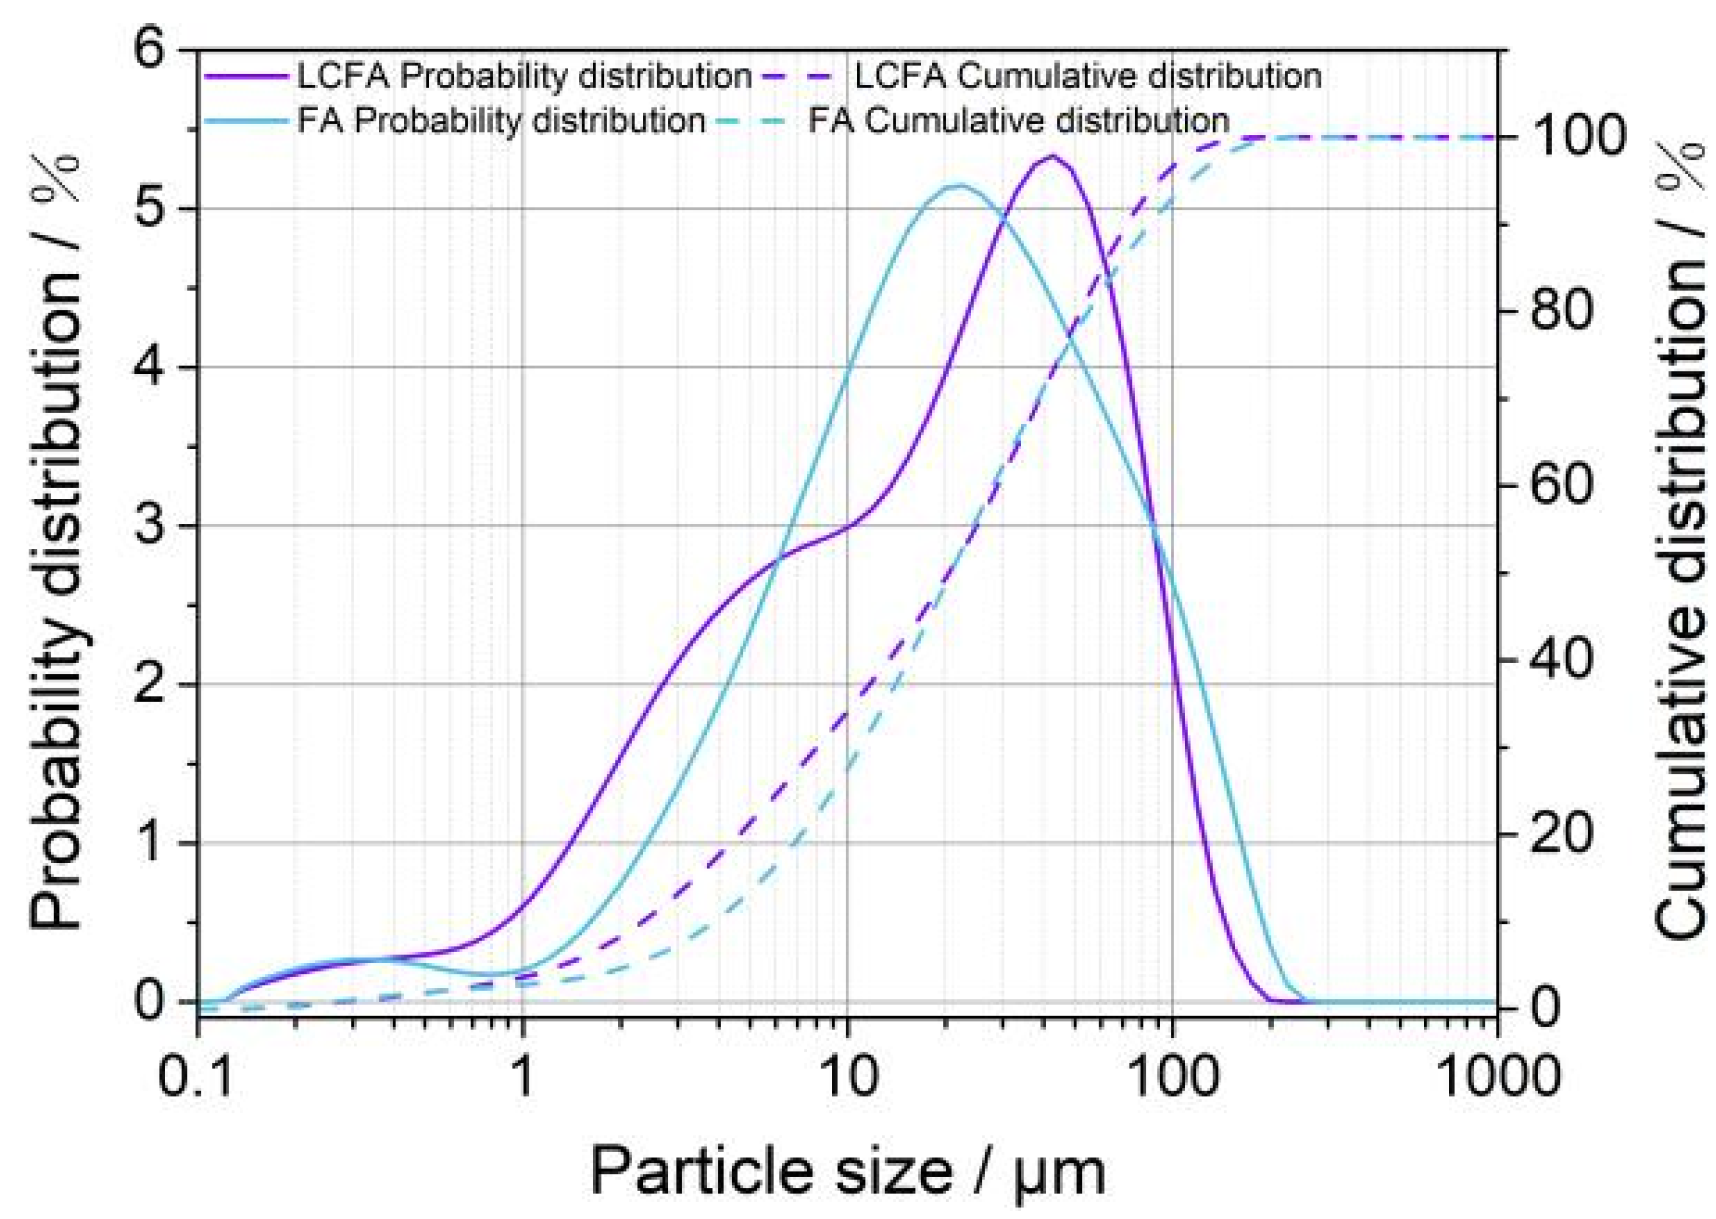
3.1. Basic Characteristics
3.2. Hydration Heat
3.3. Compressive Strength
3.3.1. Binary Compressive Strength
3.3.2. Compressive Strength
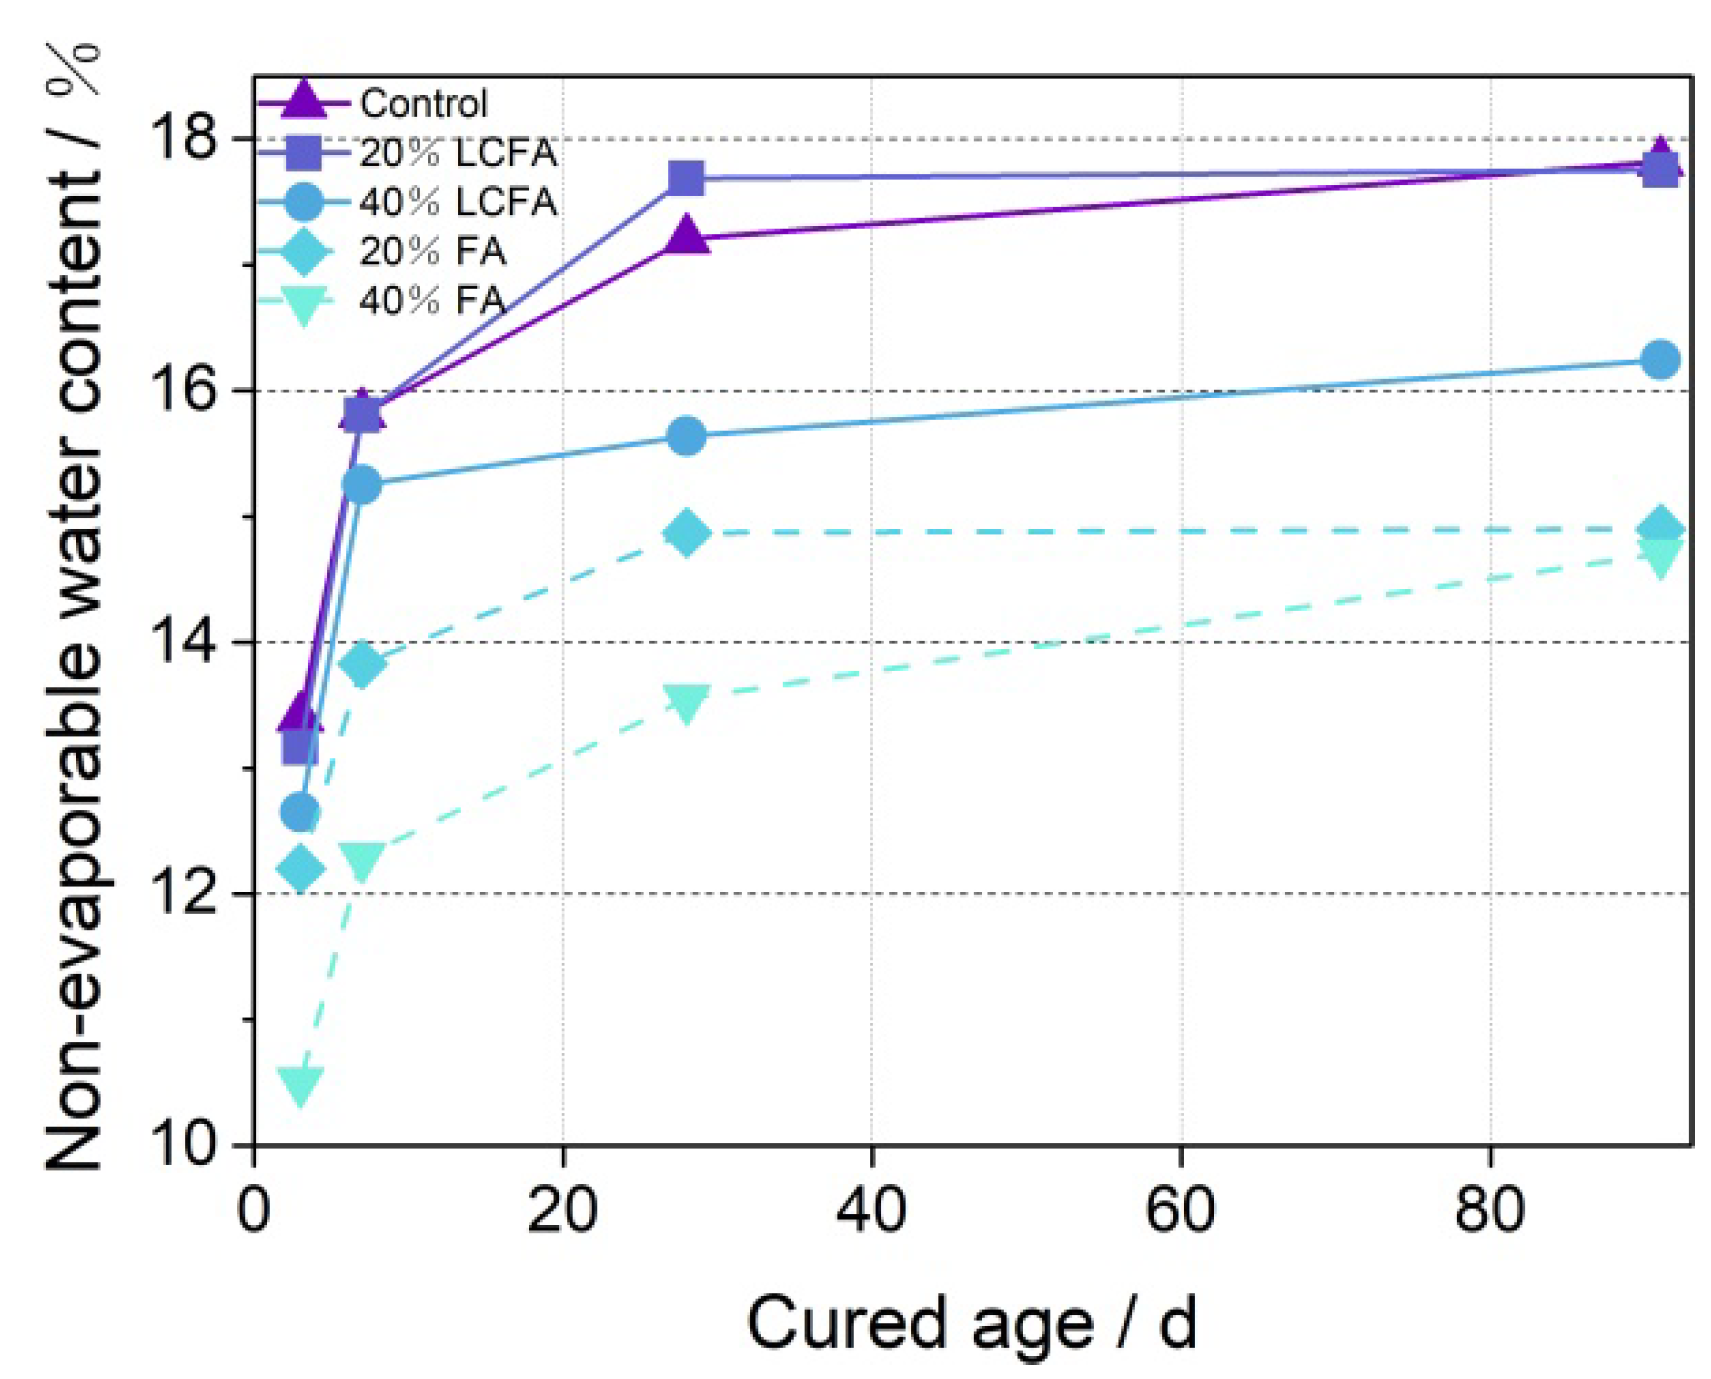
3.4. Non-Evaporated Water Content
3.5. Microscopic Analysis Results
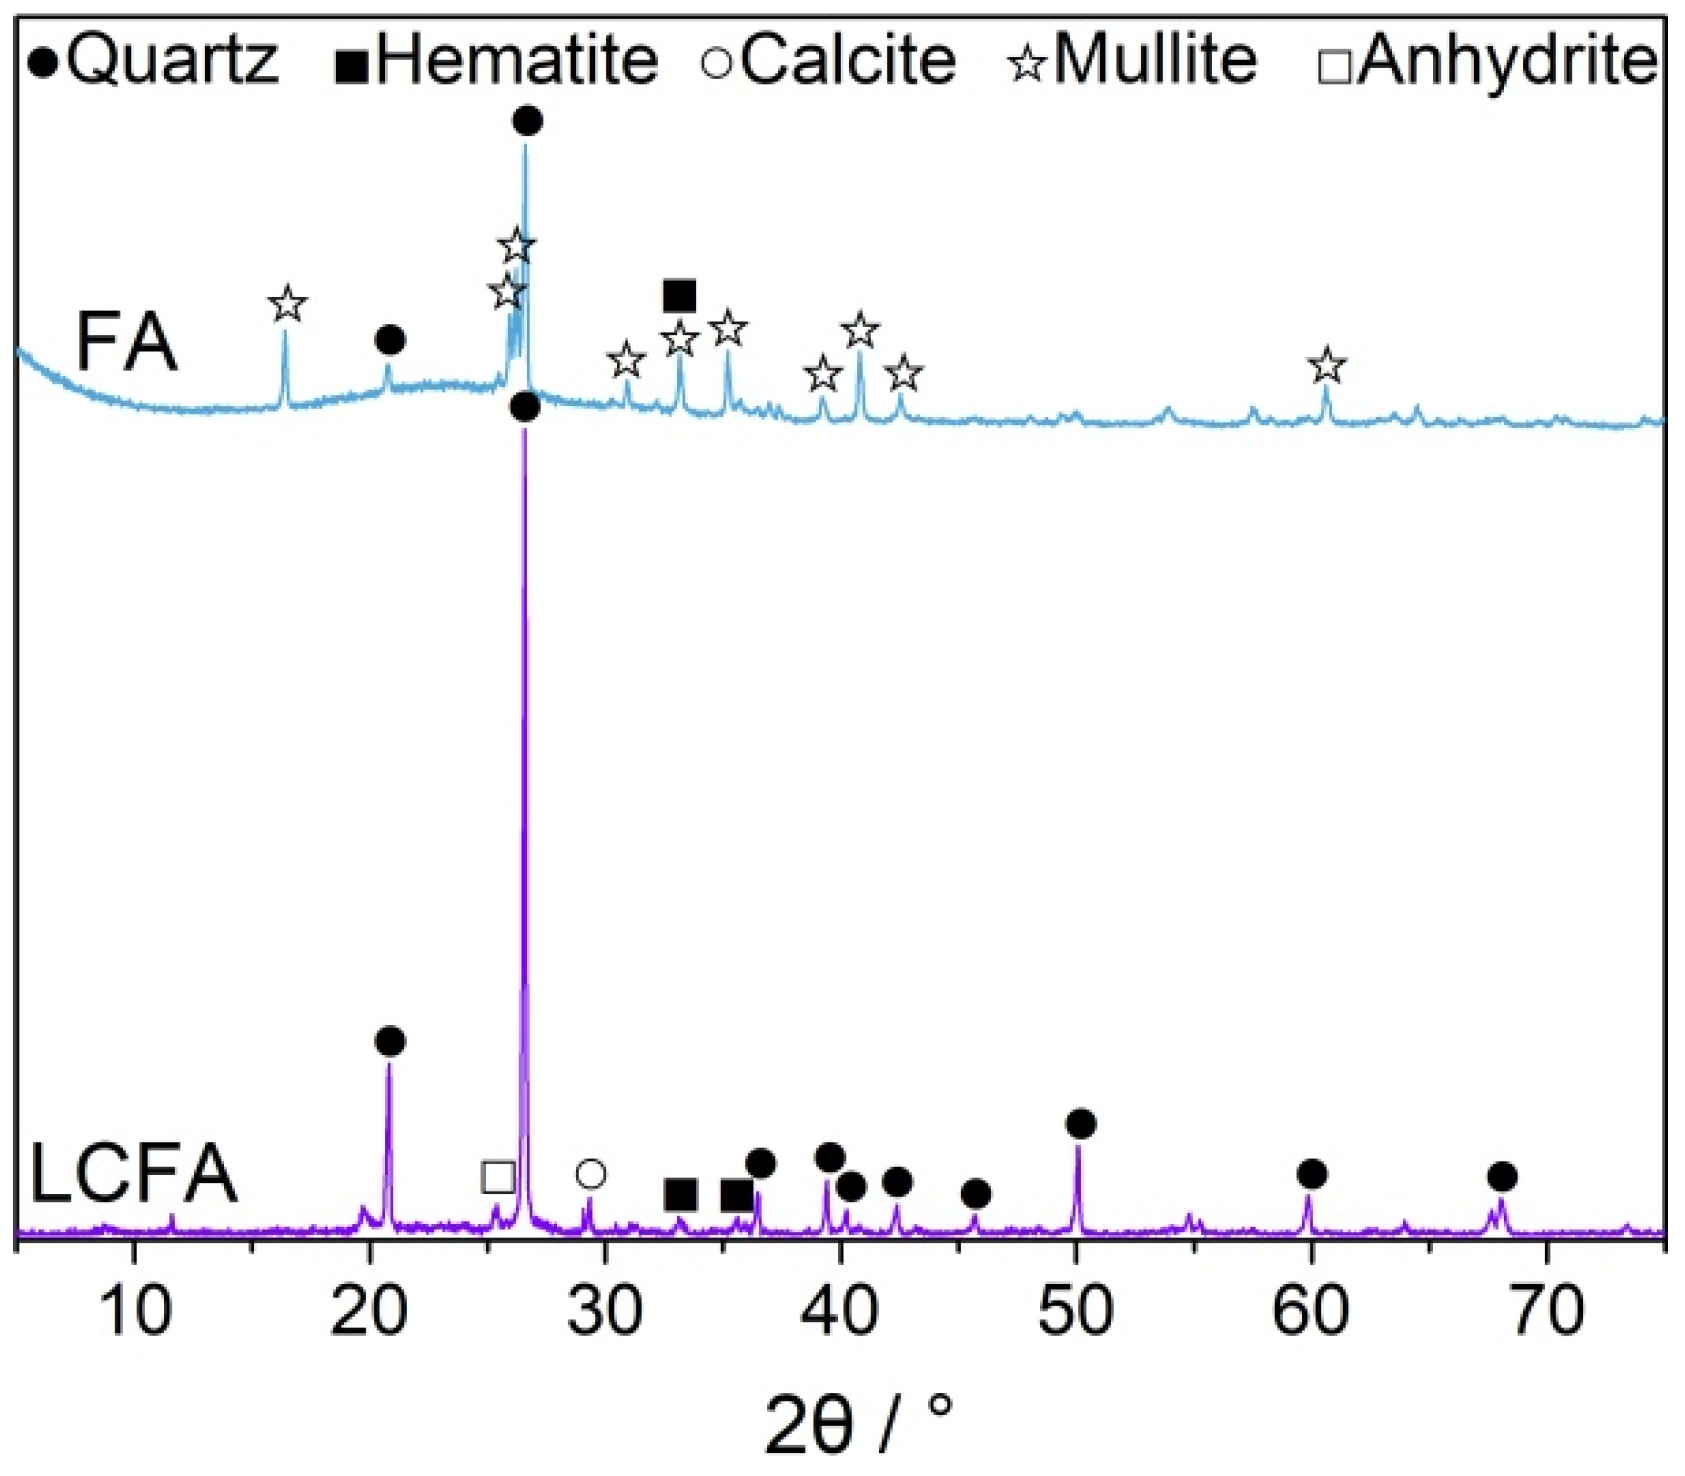
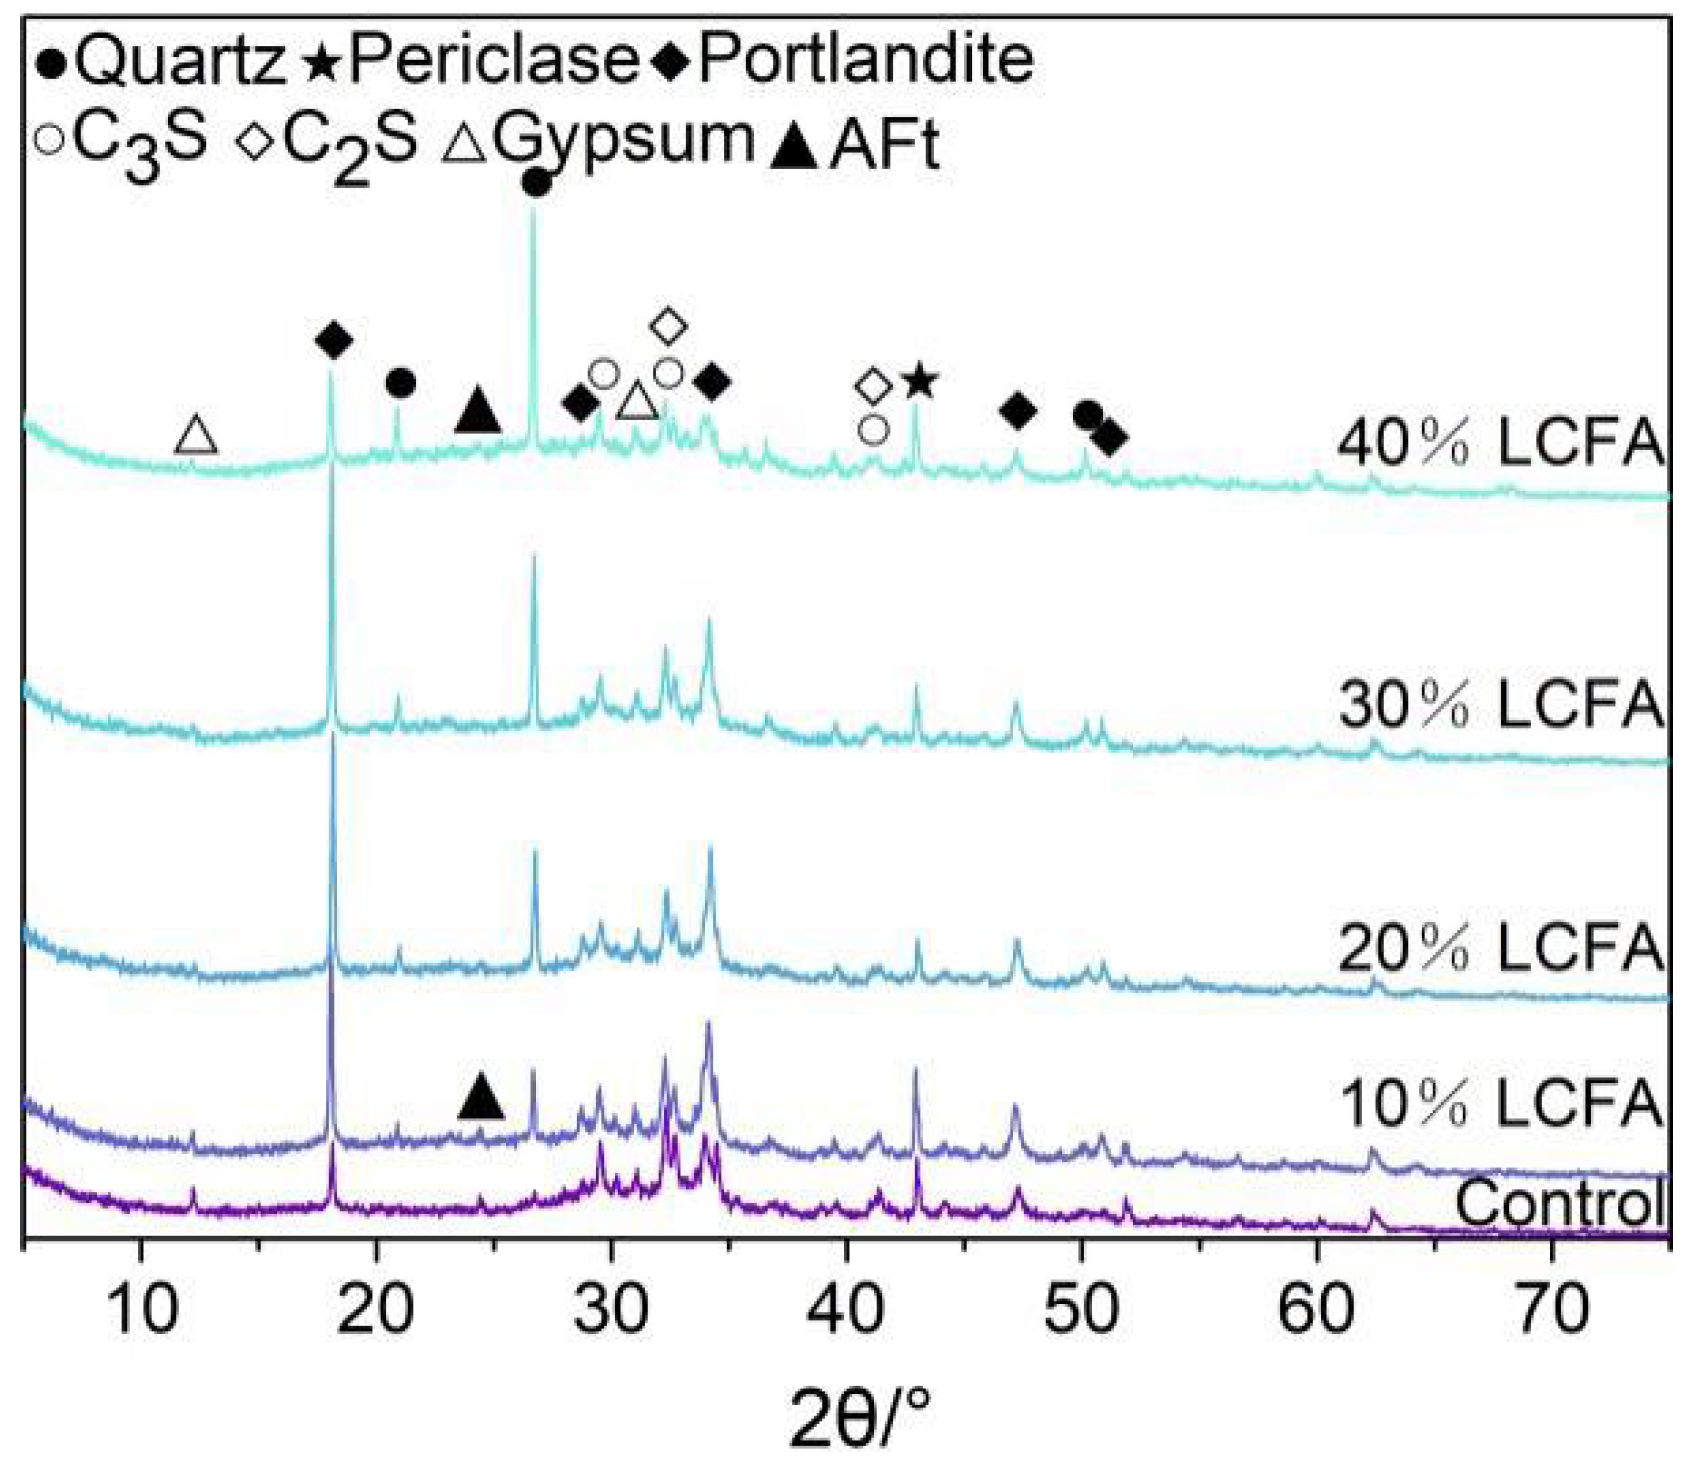
3.5.1. XRD Analysis
3.5.2. FT-IR Analysis
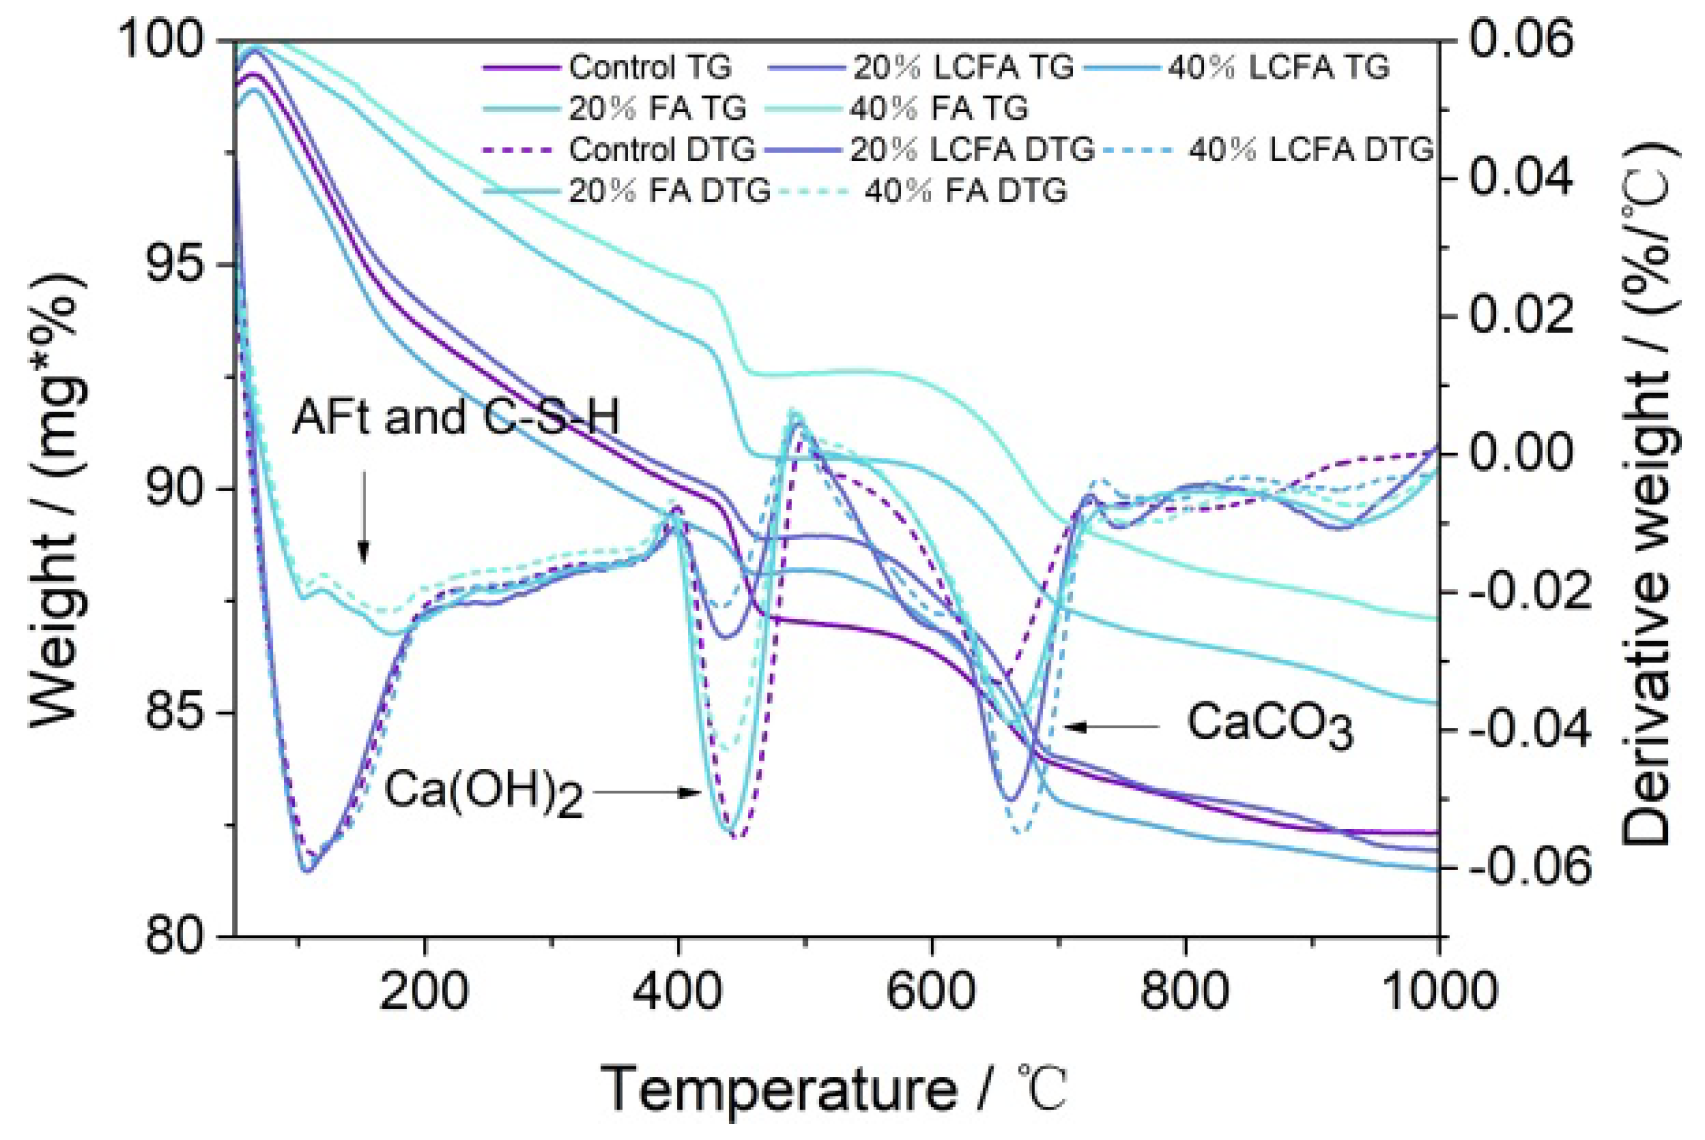
3.5.3. TG-DTG Analysis
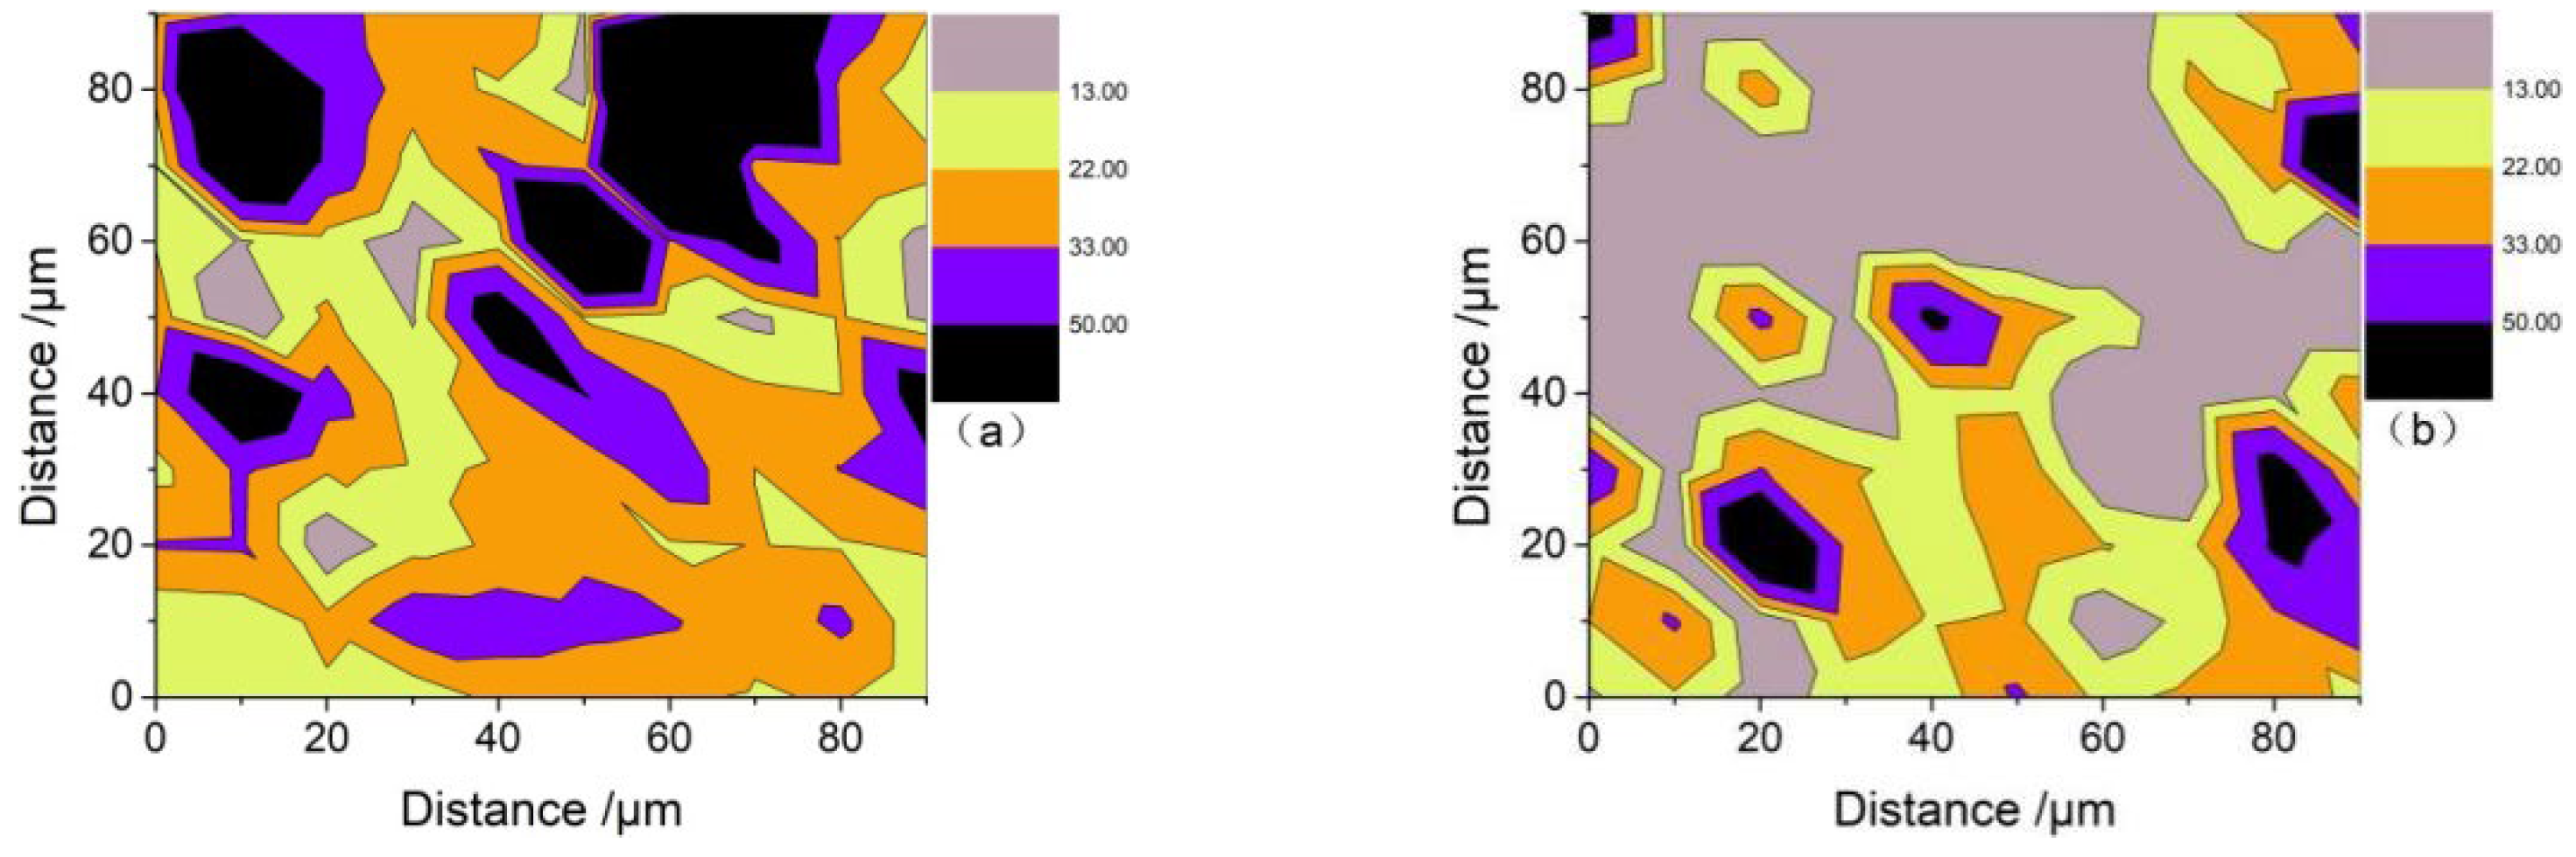
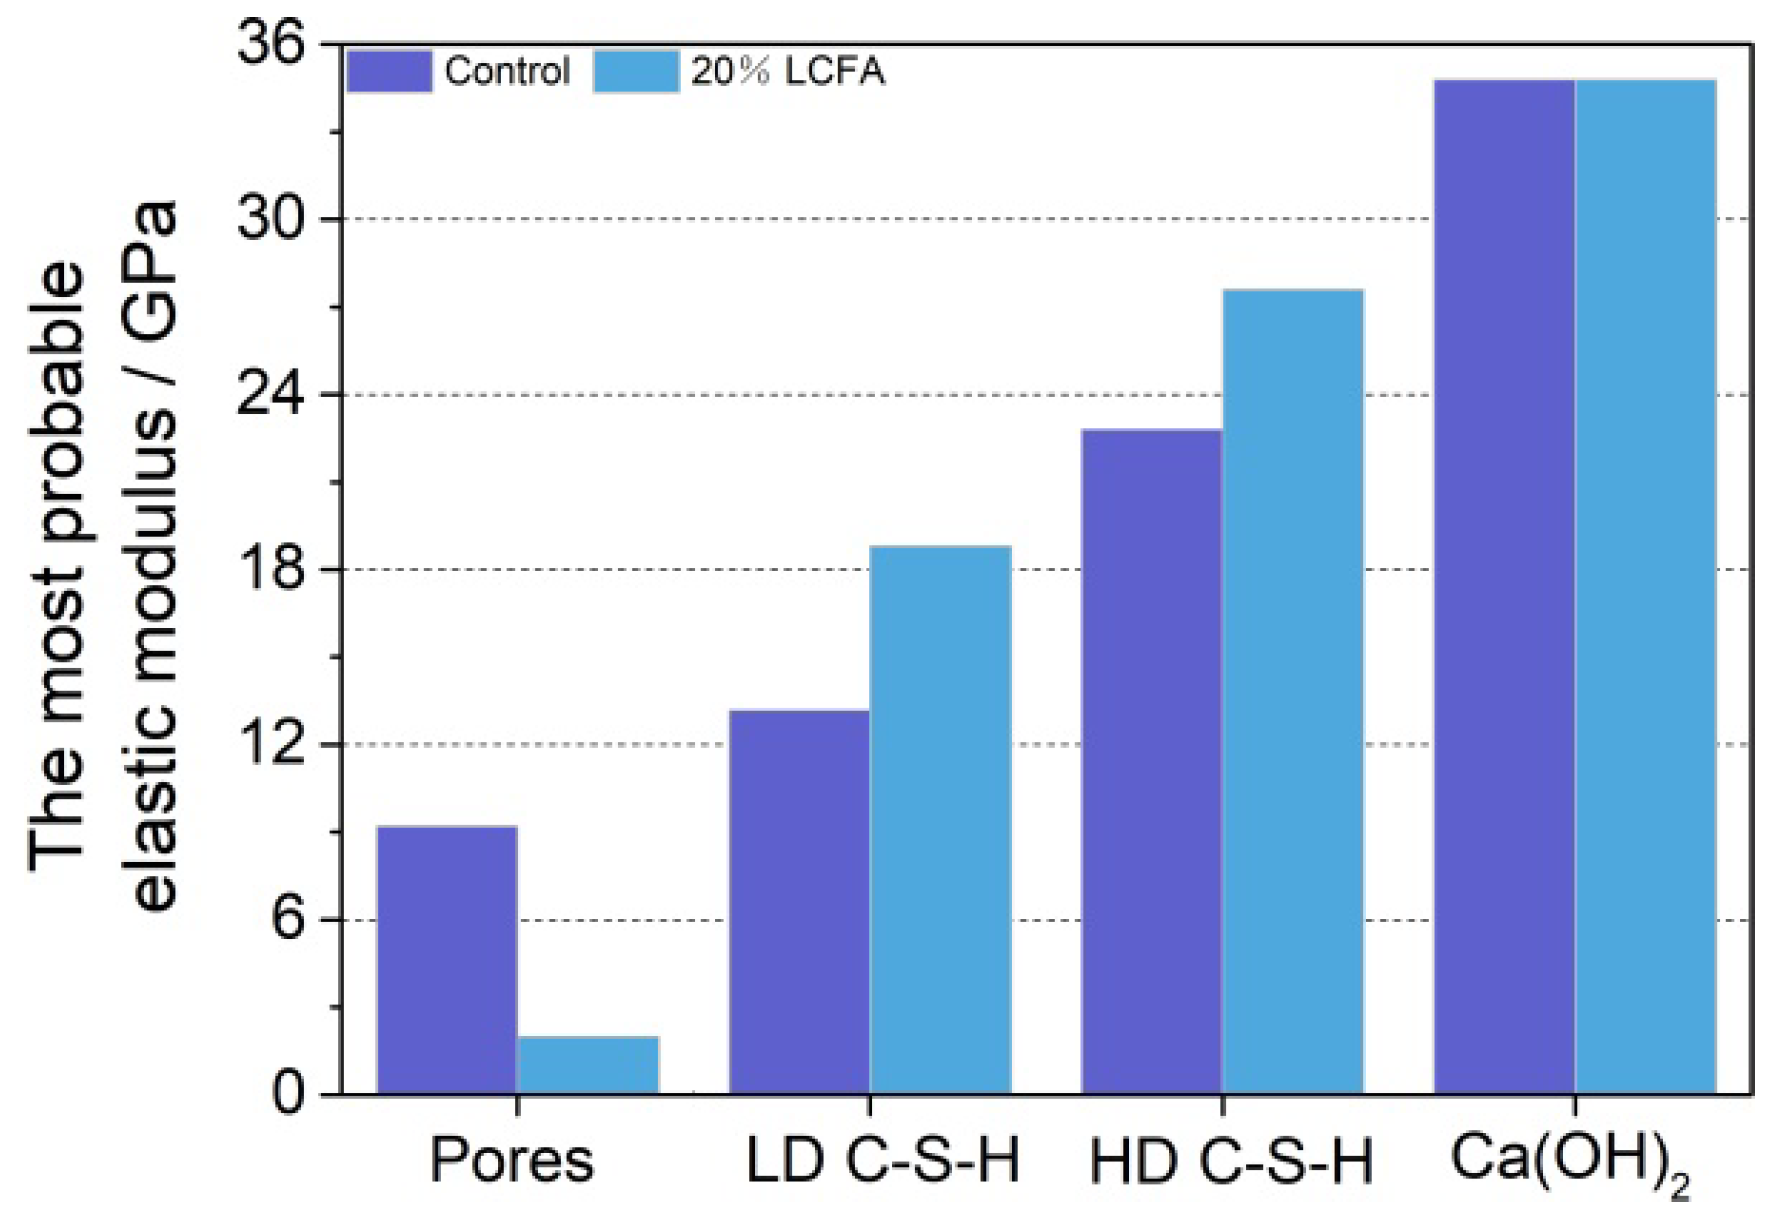
3.5.4. Nanoindentation Analysis
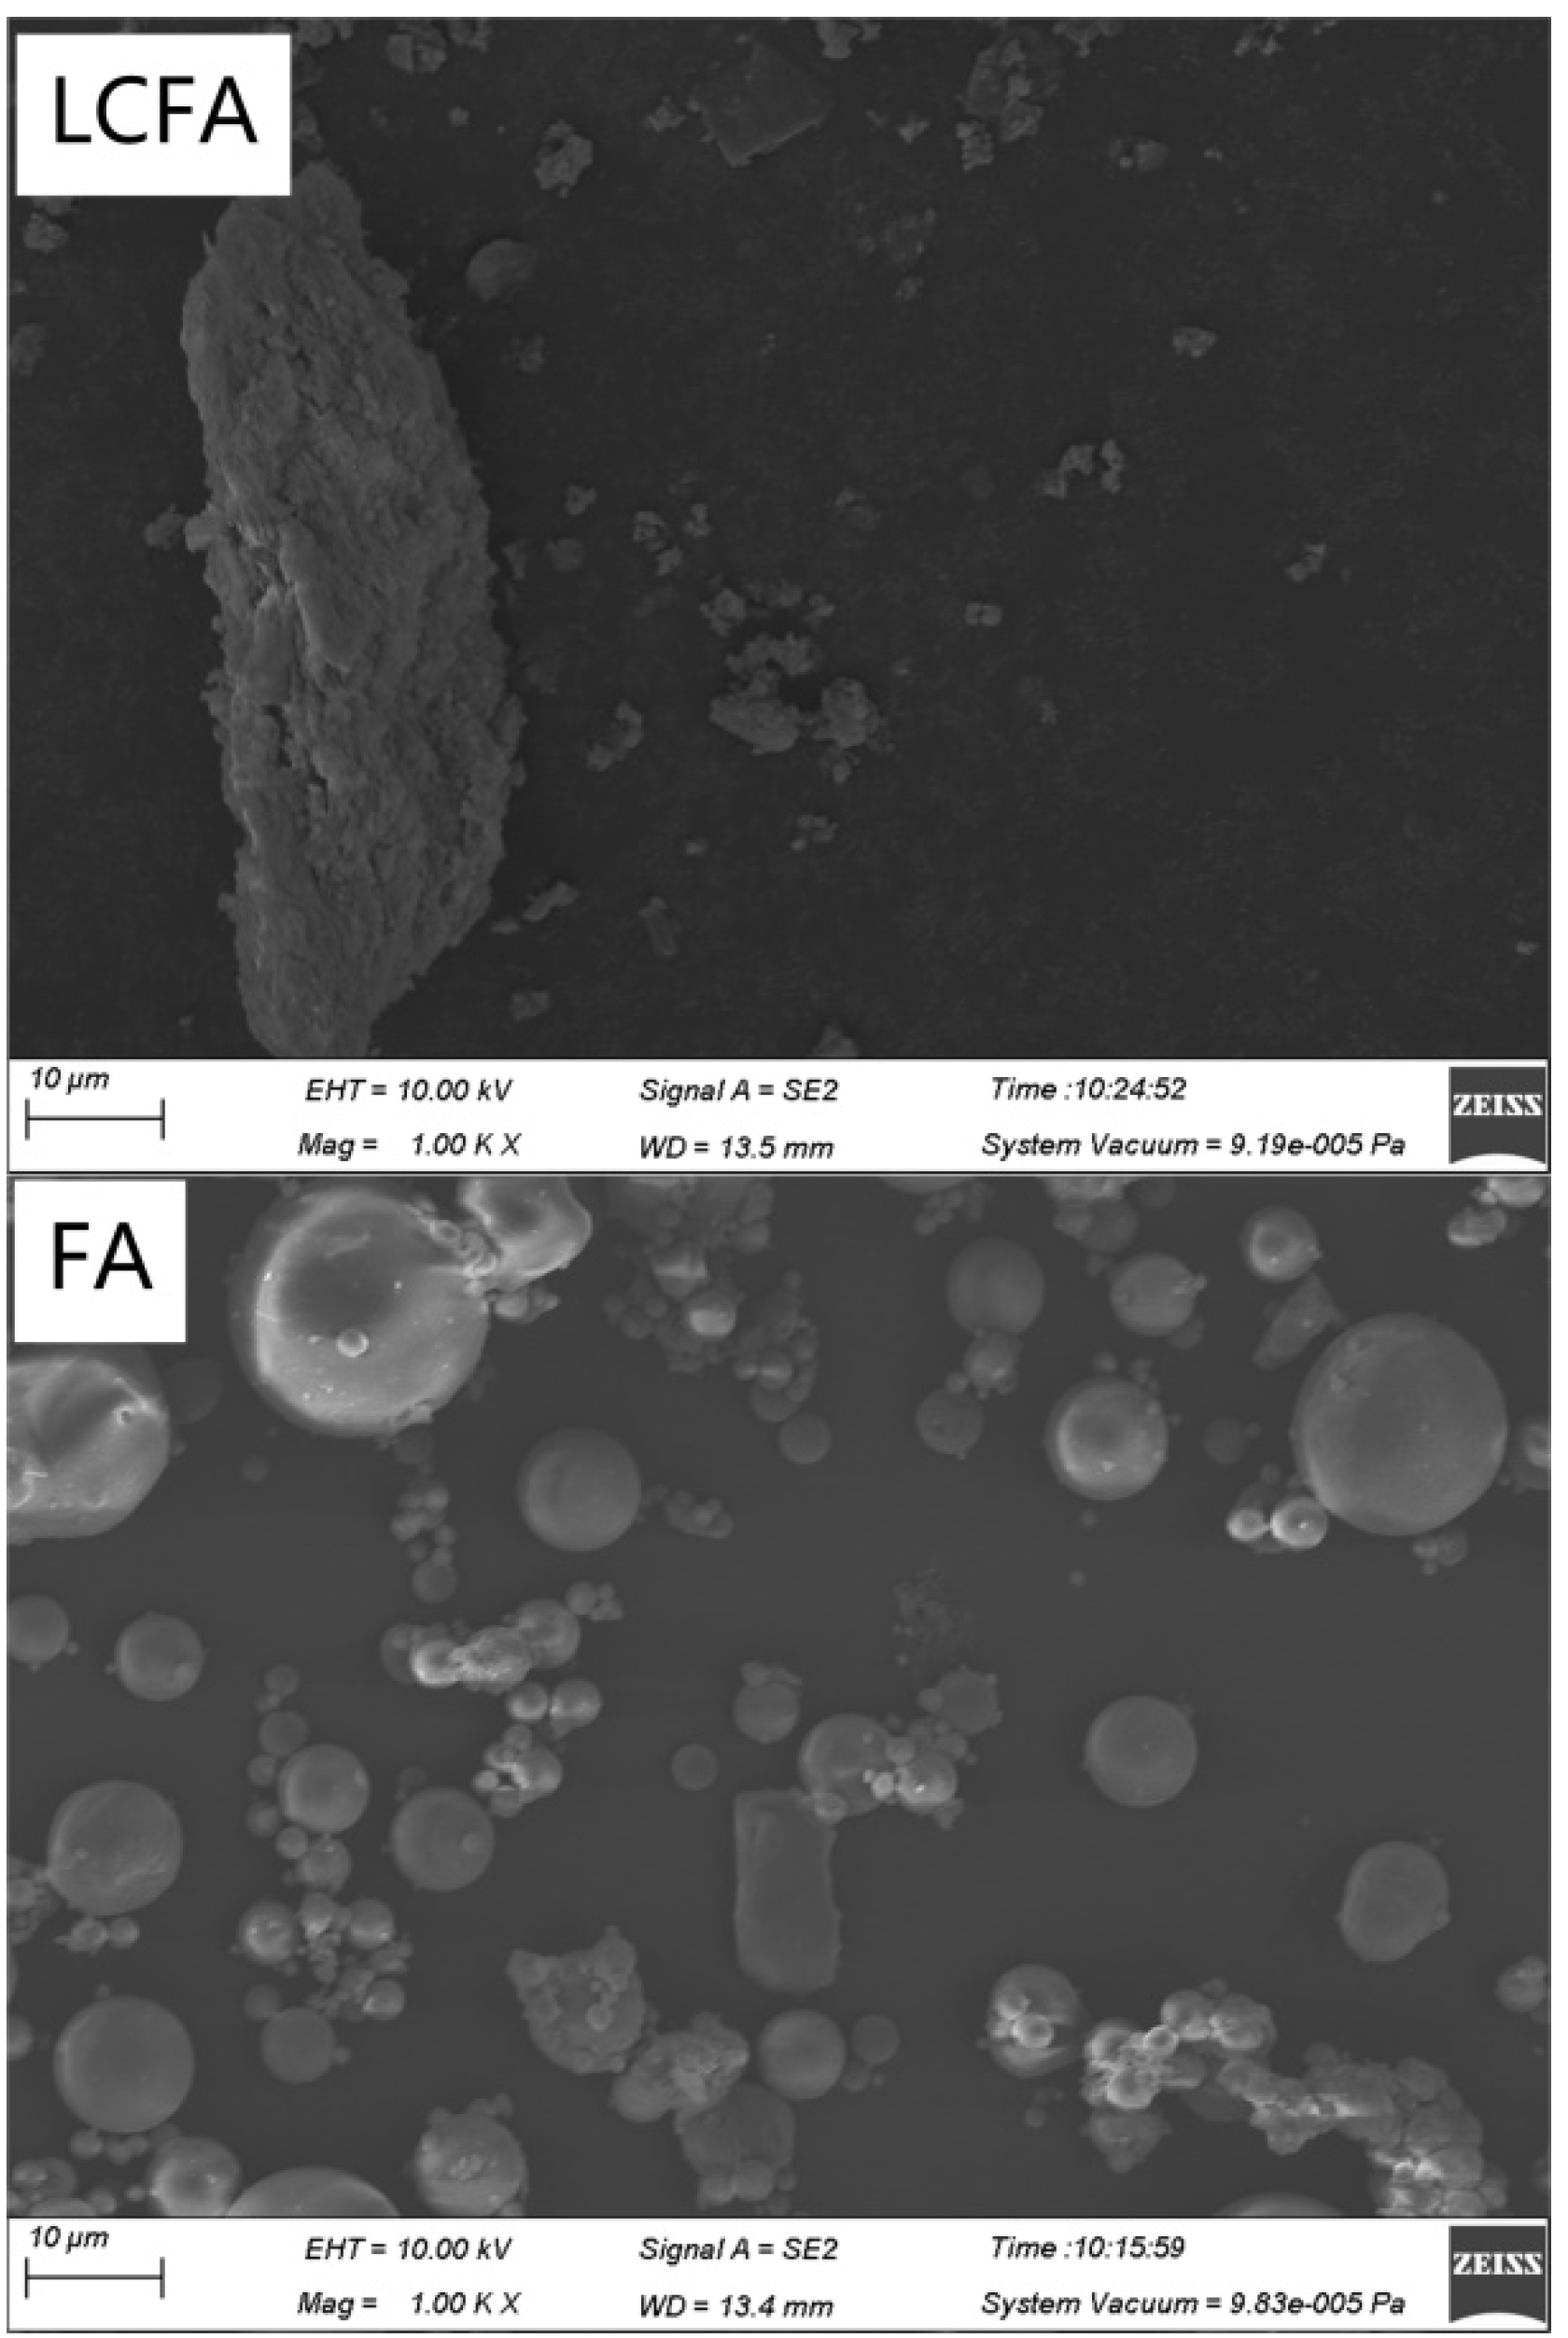
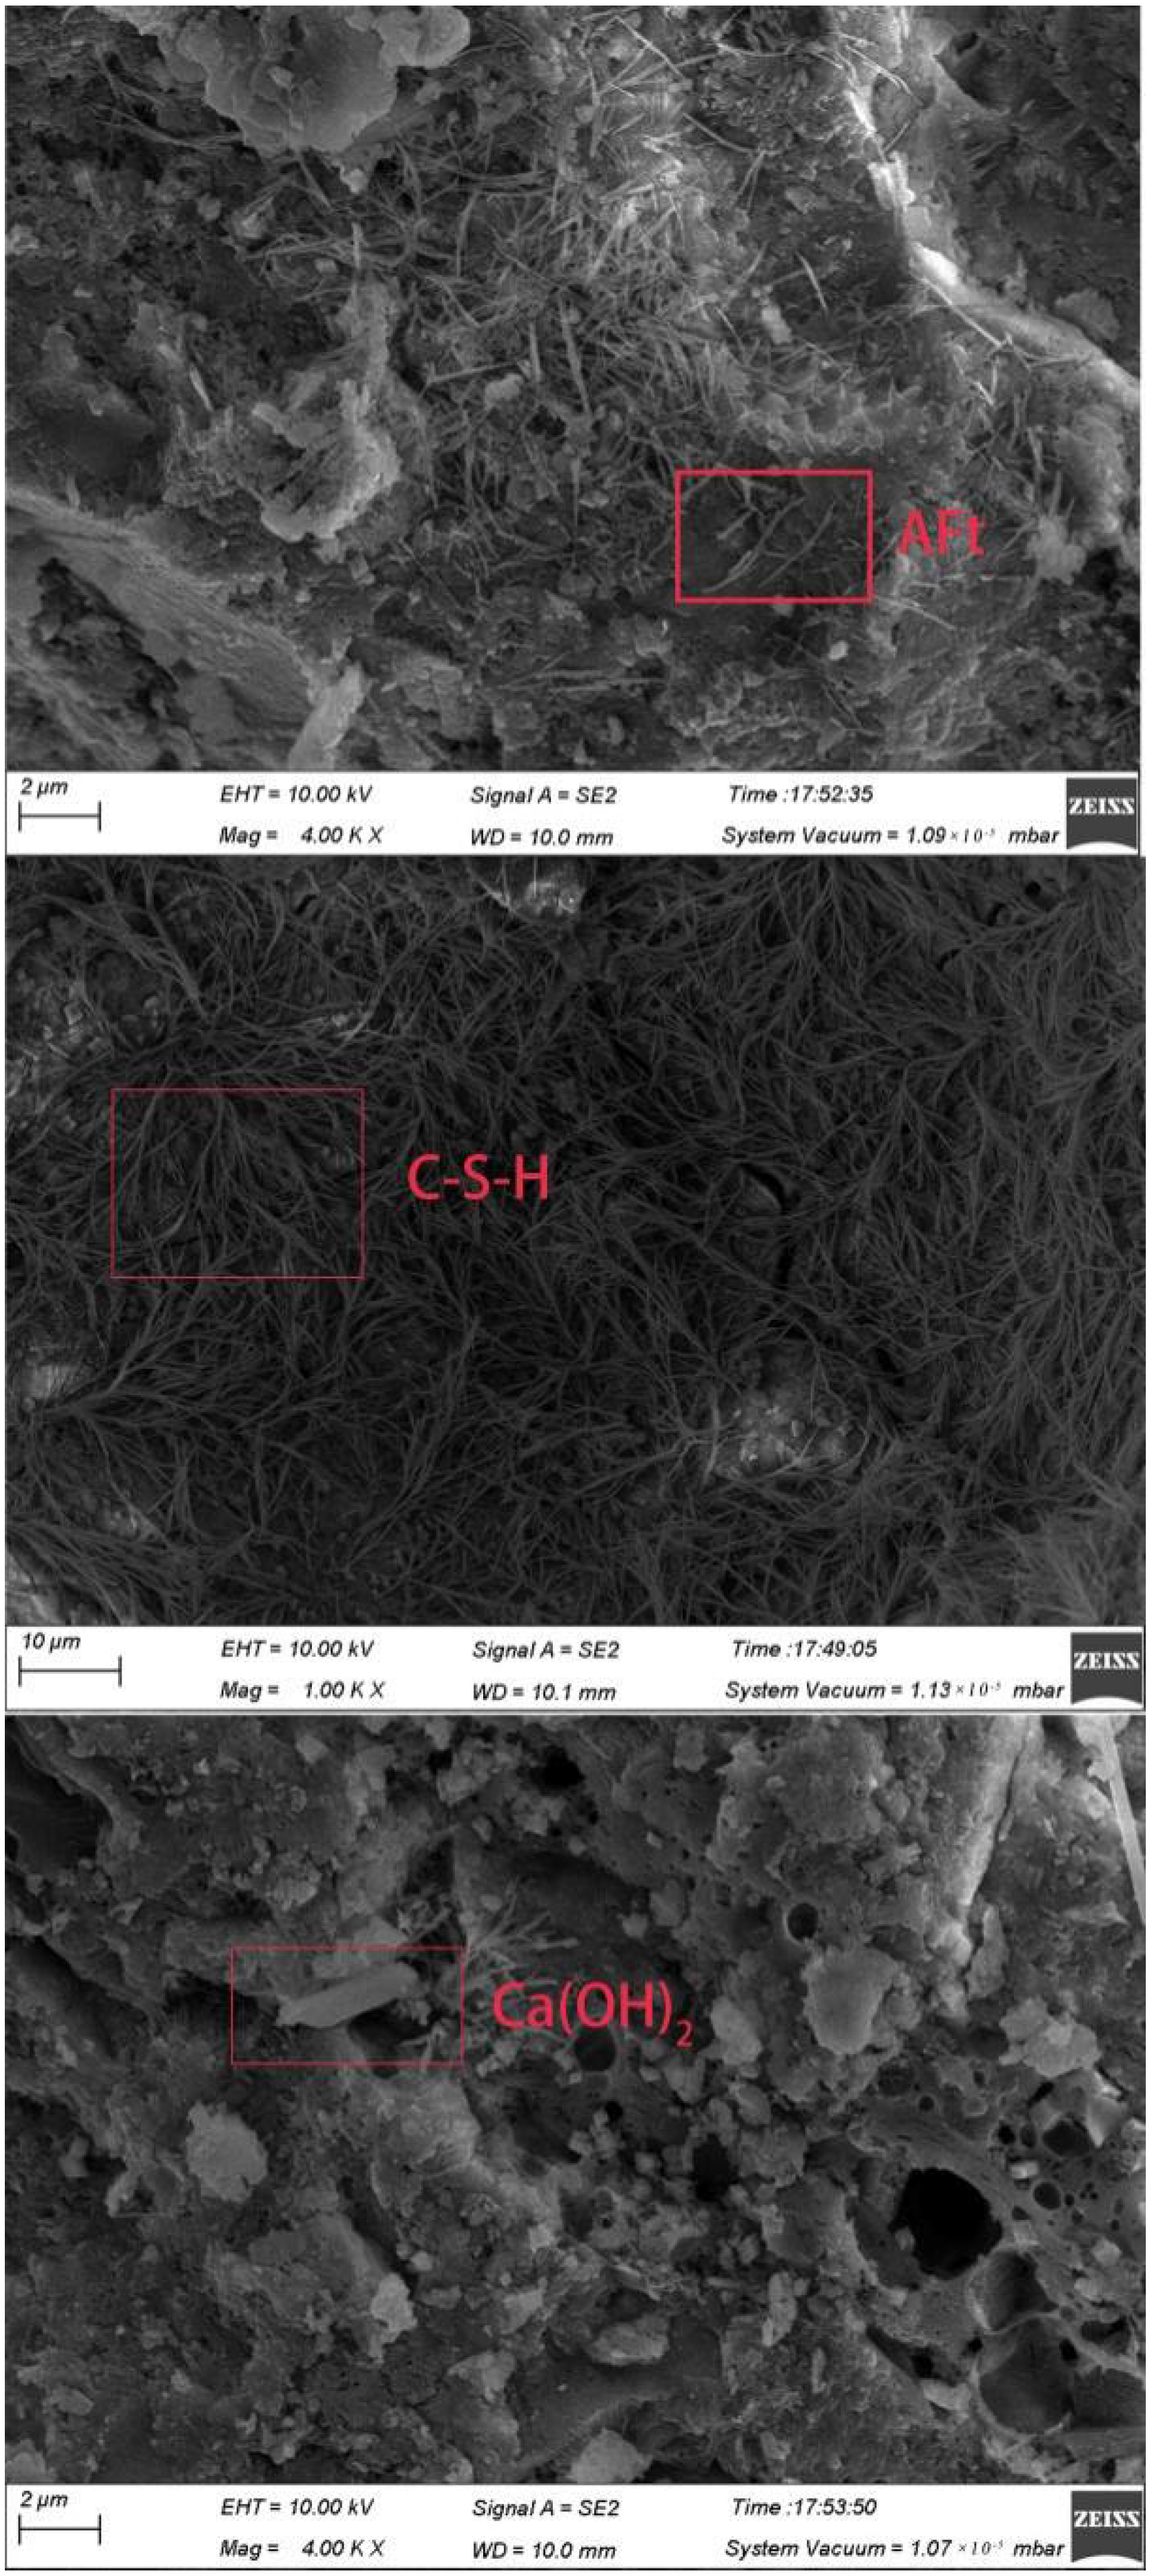
3.5.5. SEM Analysis
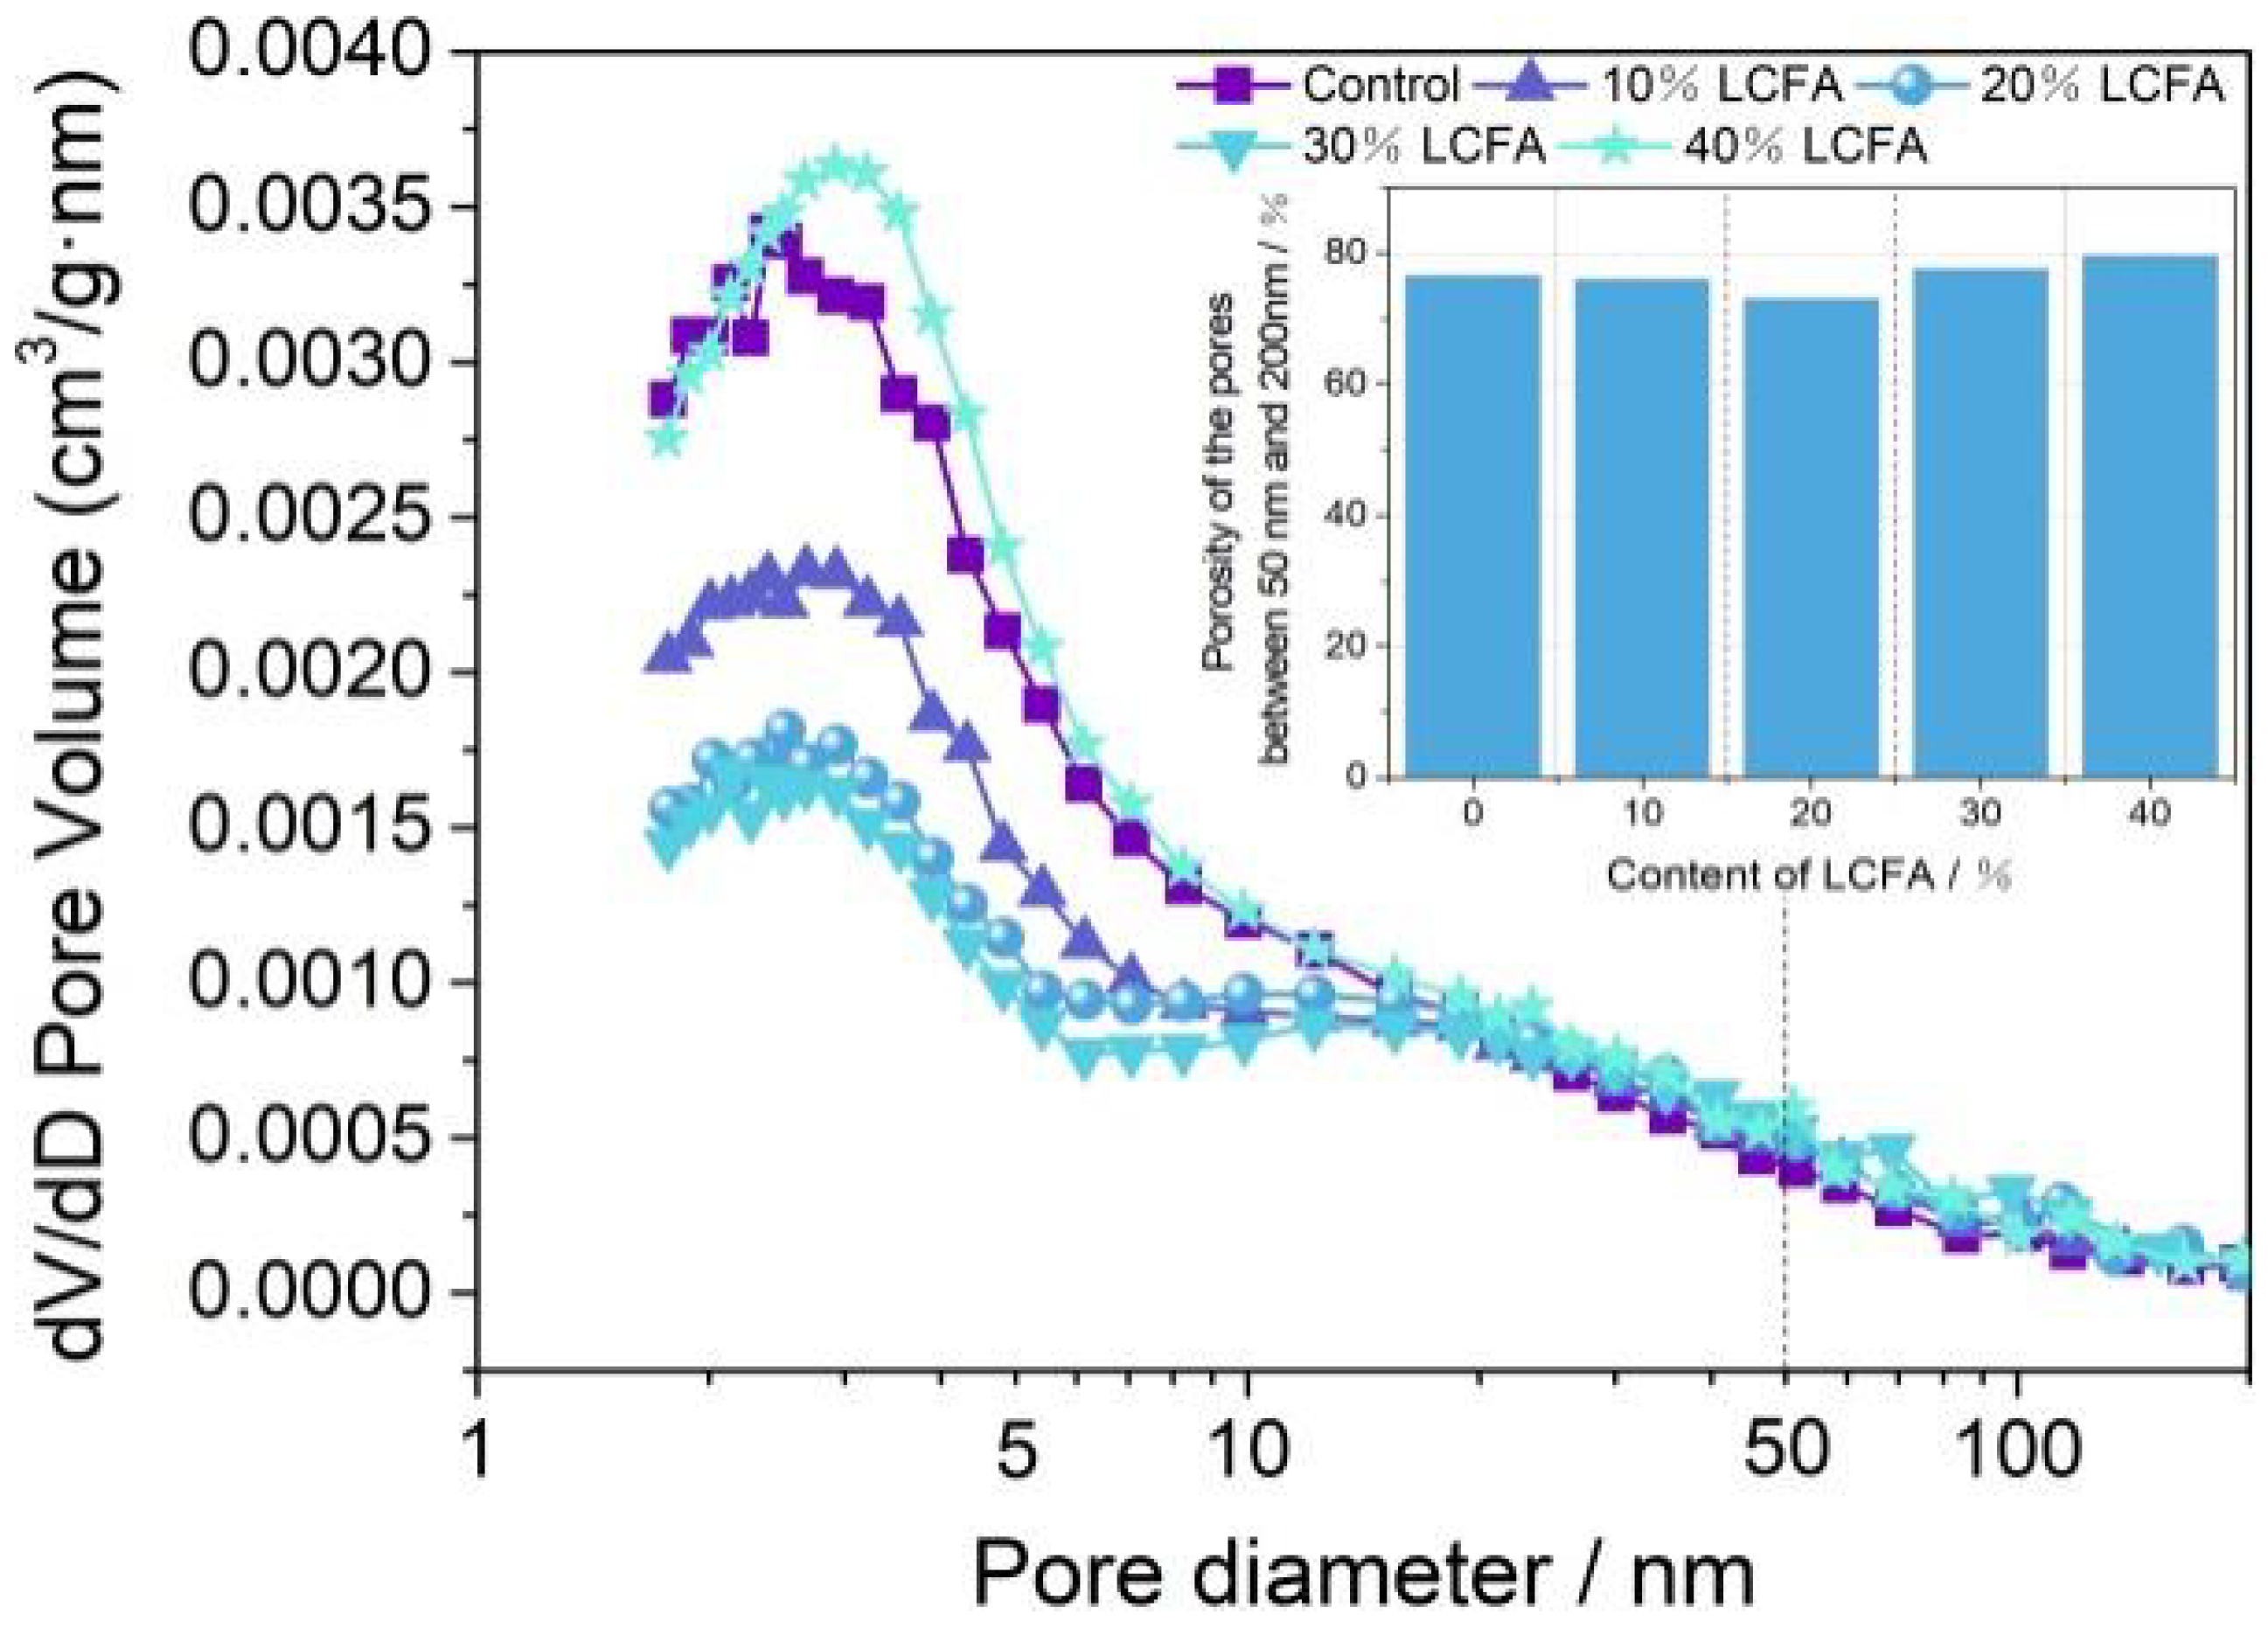
3.5.6. BET Analysis
4. Conclusions
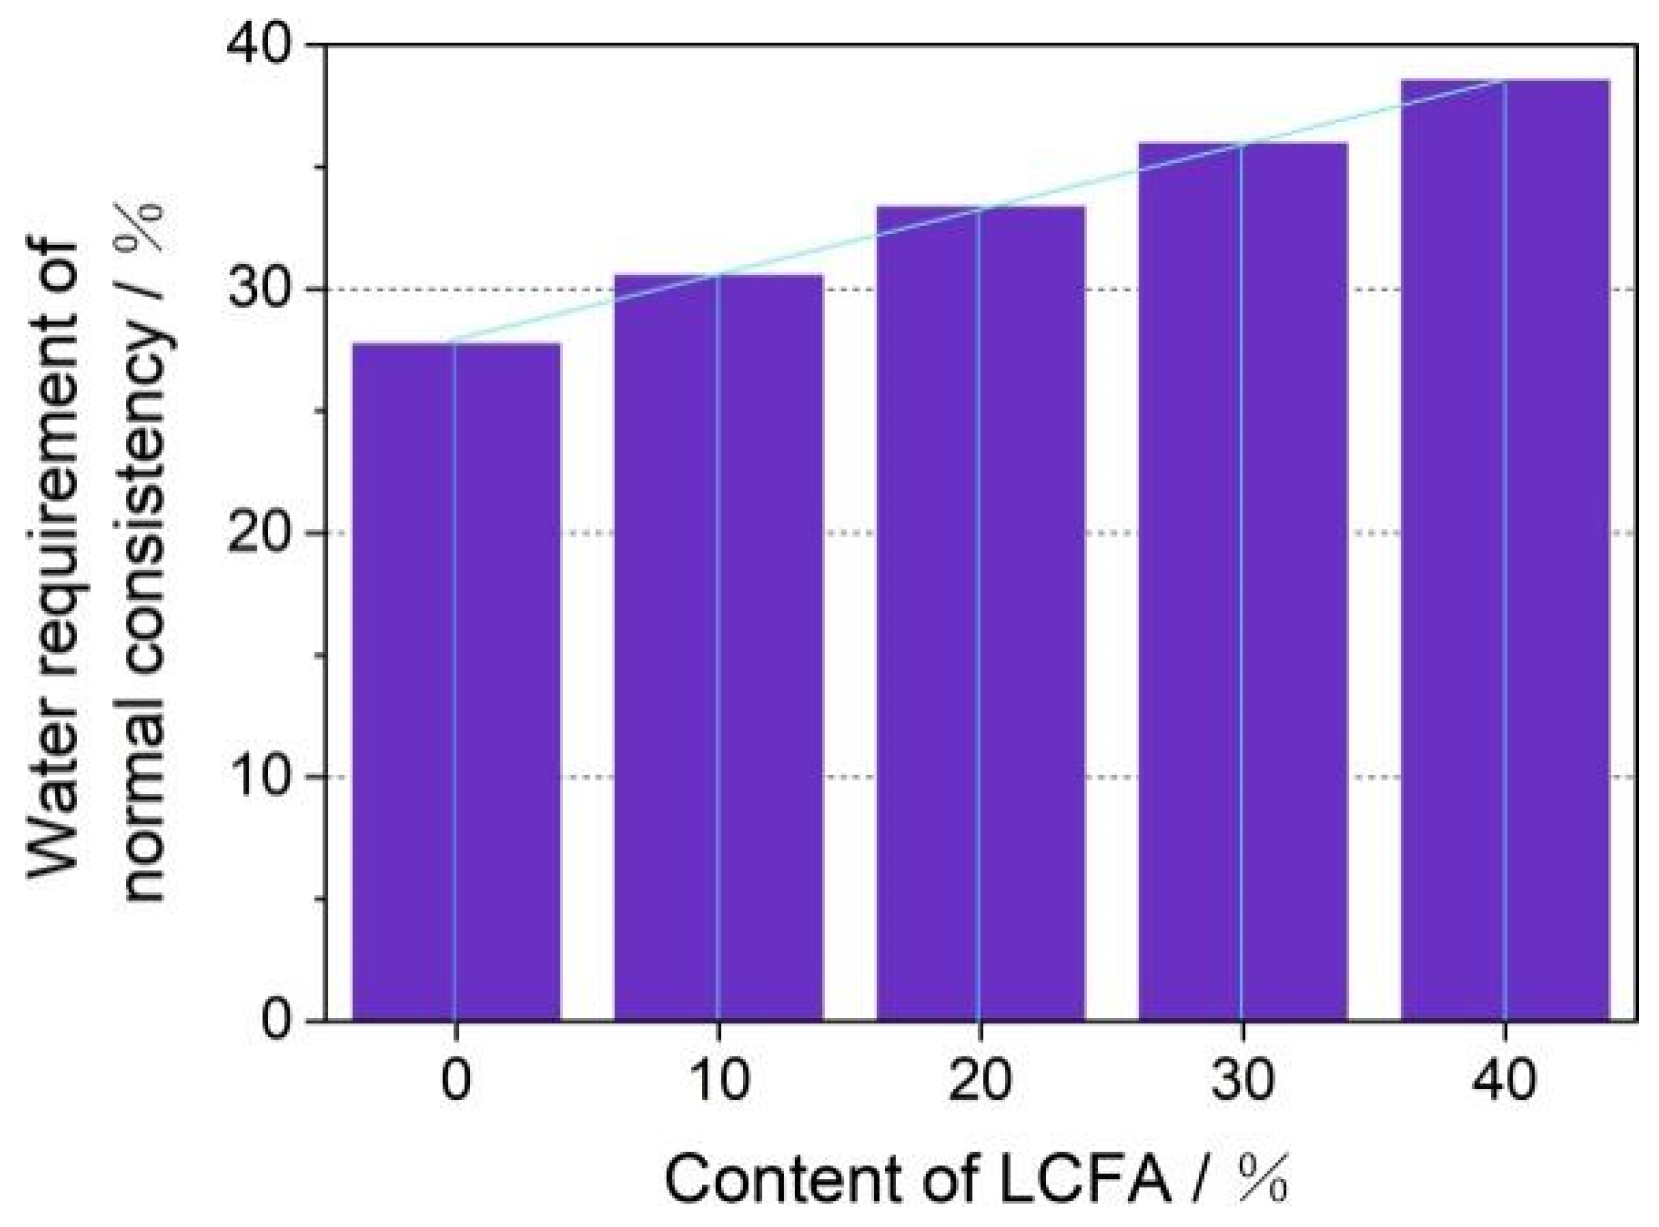
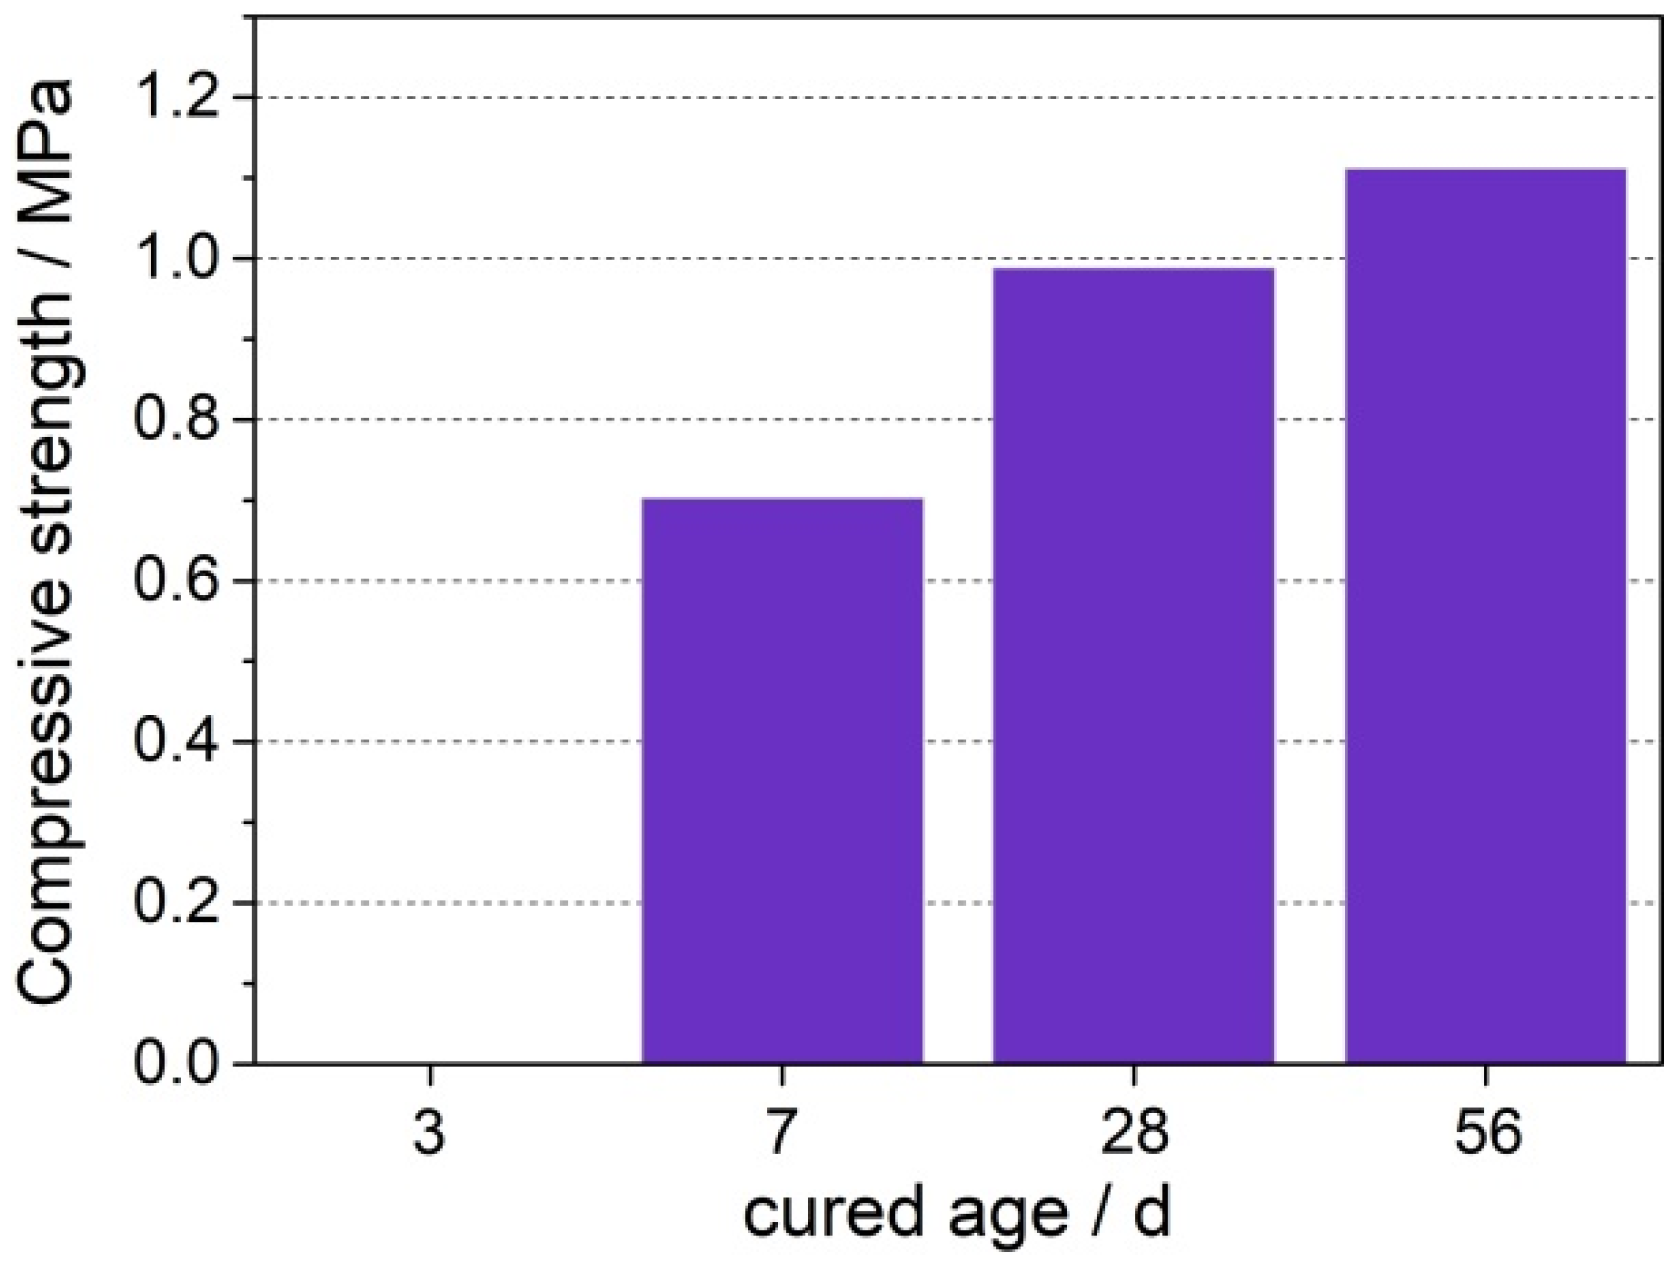
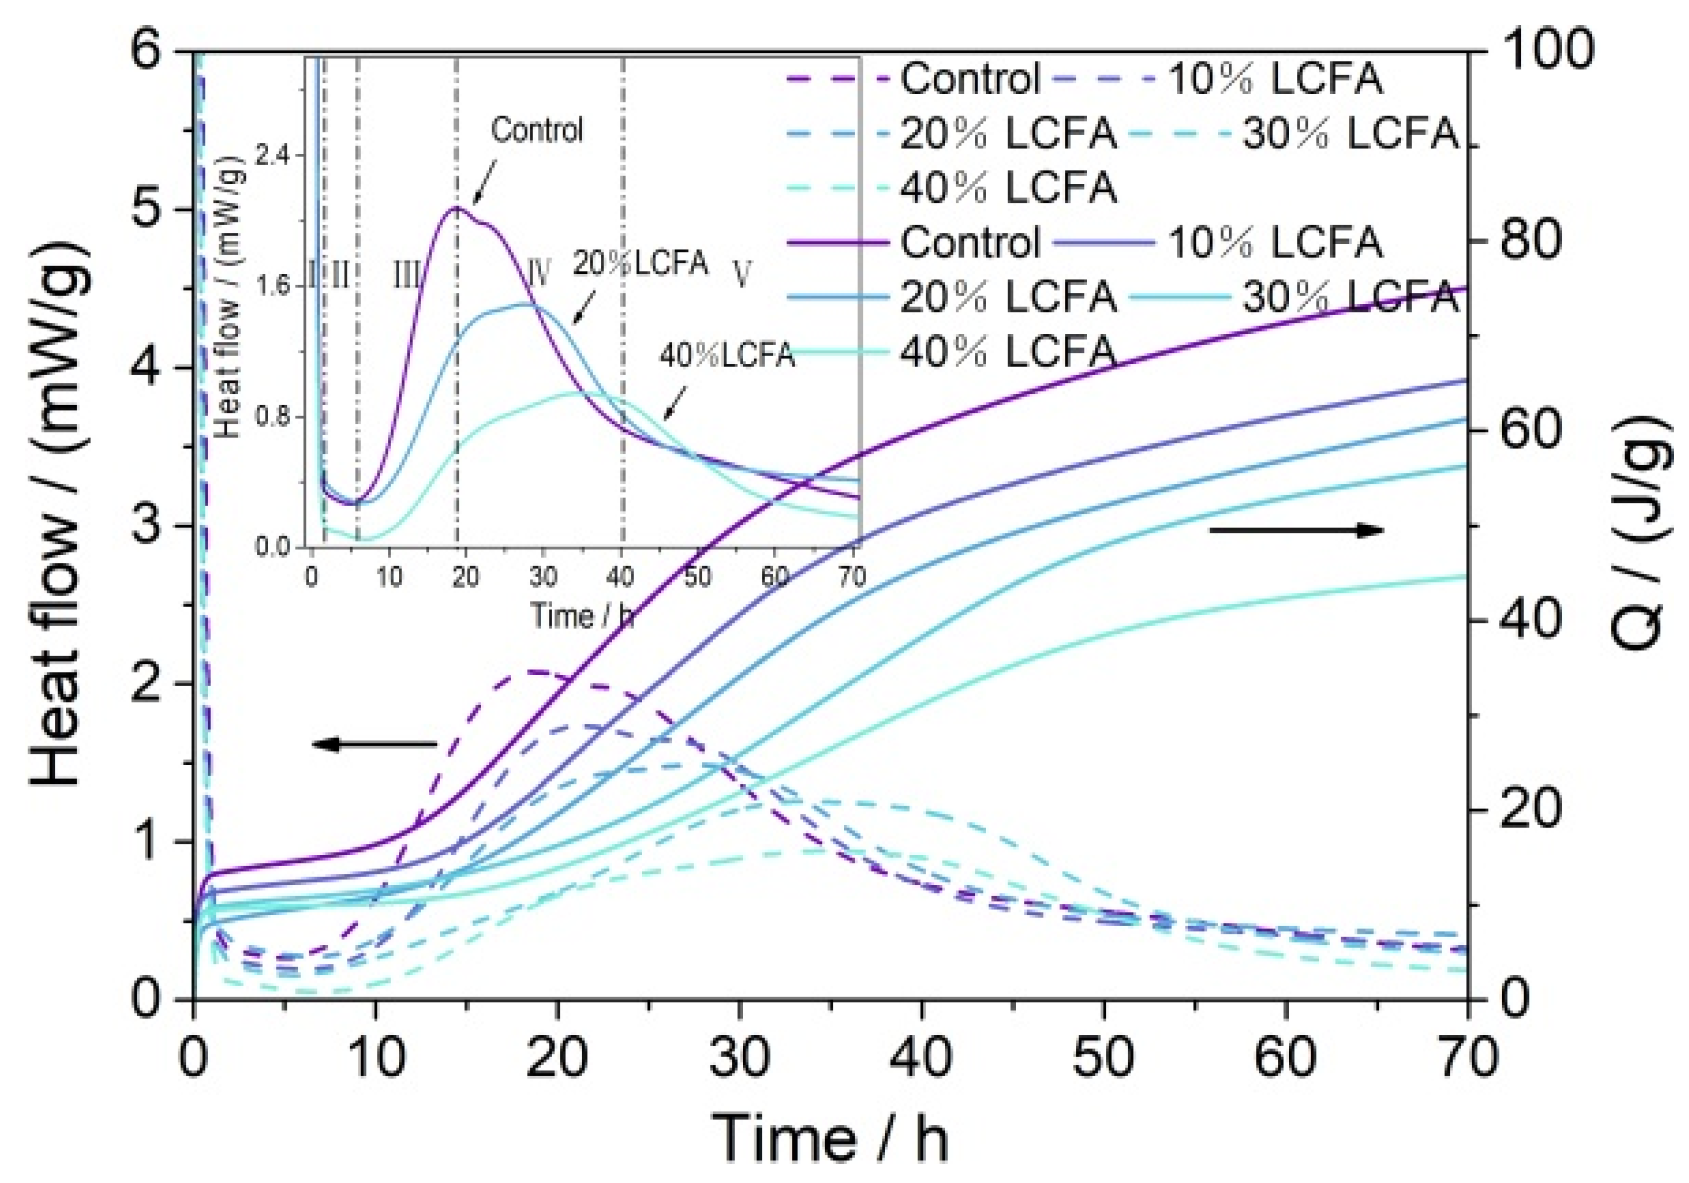
- The main mineral components of LCFA were quartz, hematite, anhydrite, and calcite. LCFA had certain self-hardening properties, but the high water requirement of LCFA was not favorable for developing the fluidity of cement-based materials. Therefore, attention is needed for selecting LCFA content in cement engineering applications. The addition of LCFA decreased the cumulative hydration heat of cement-based materials.
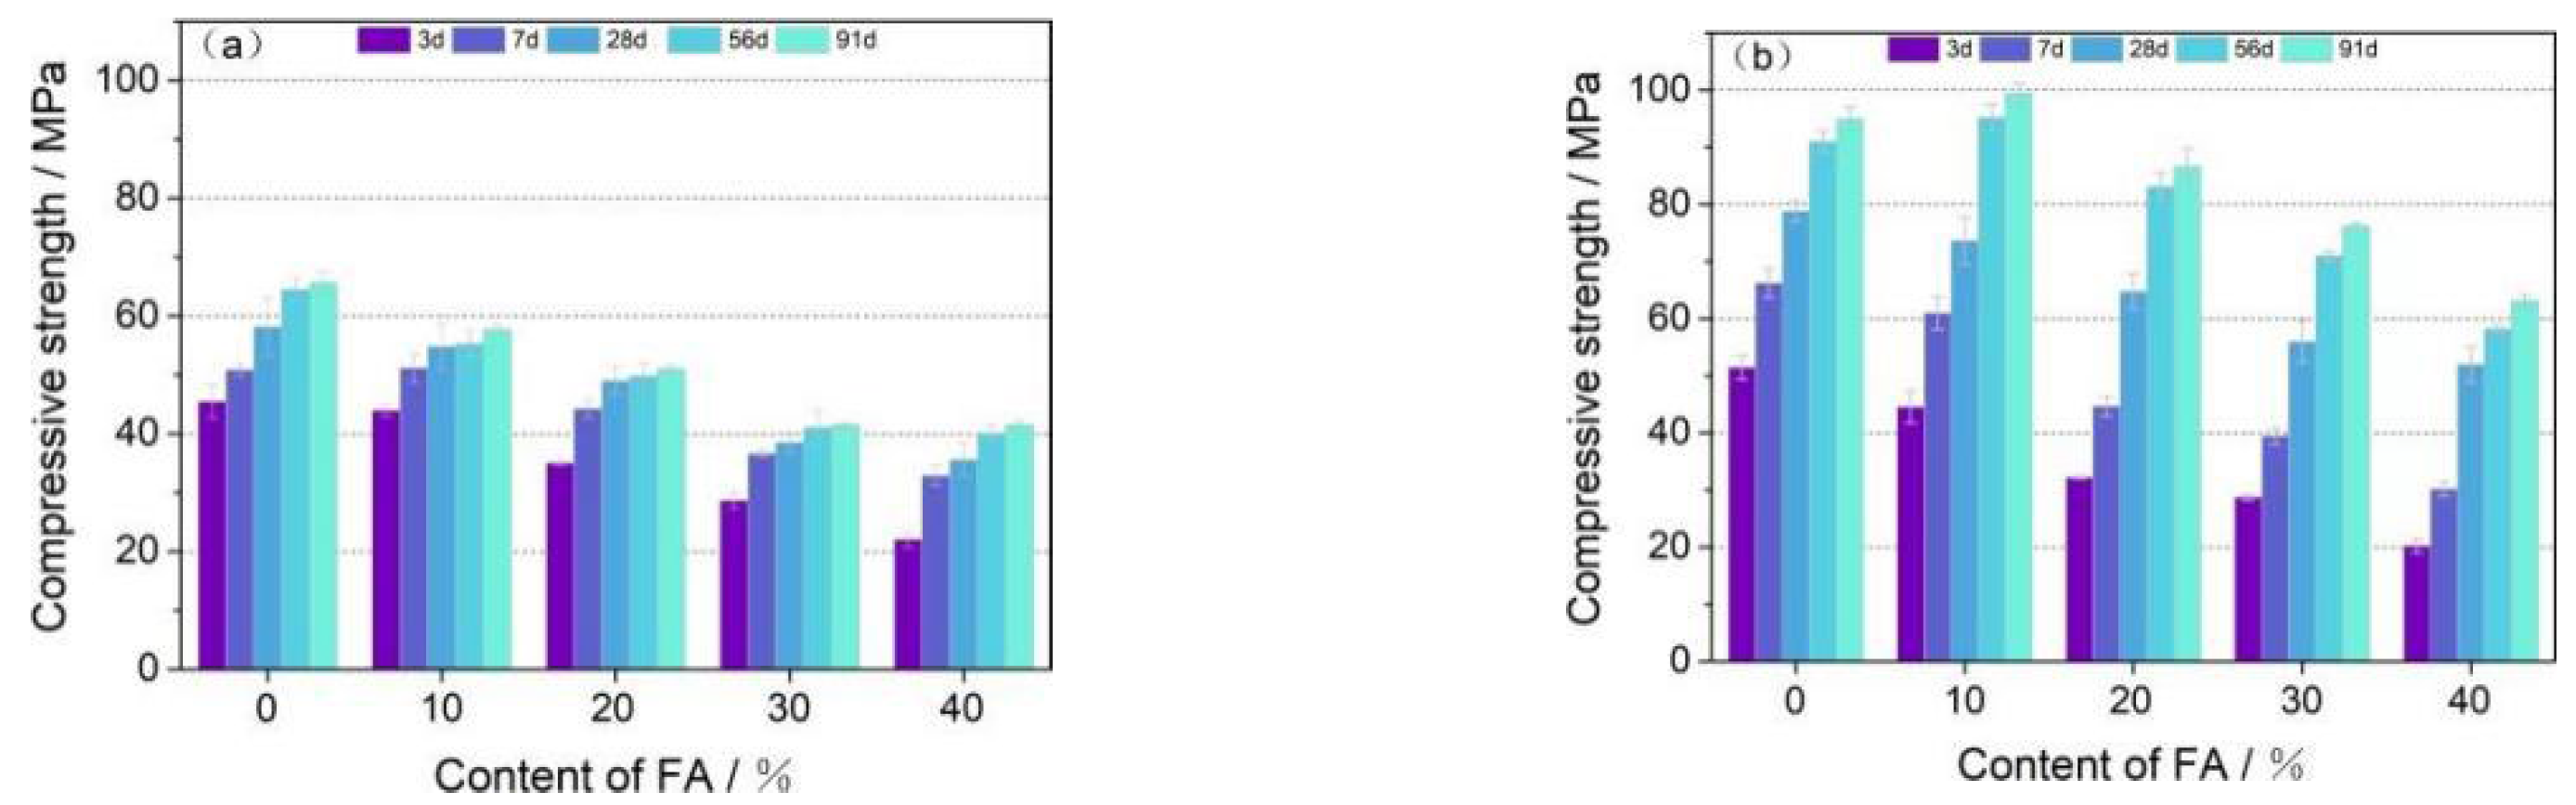
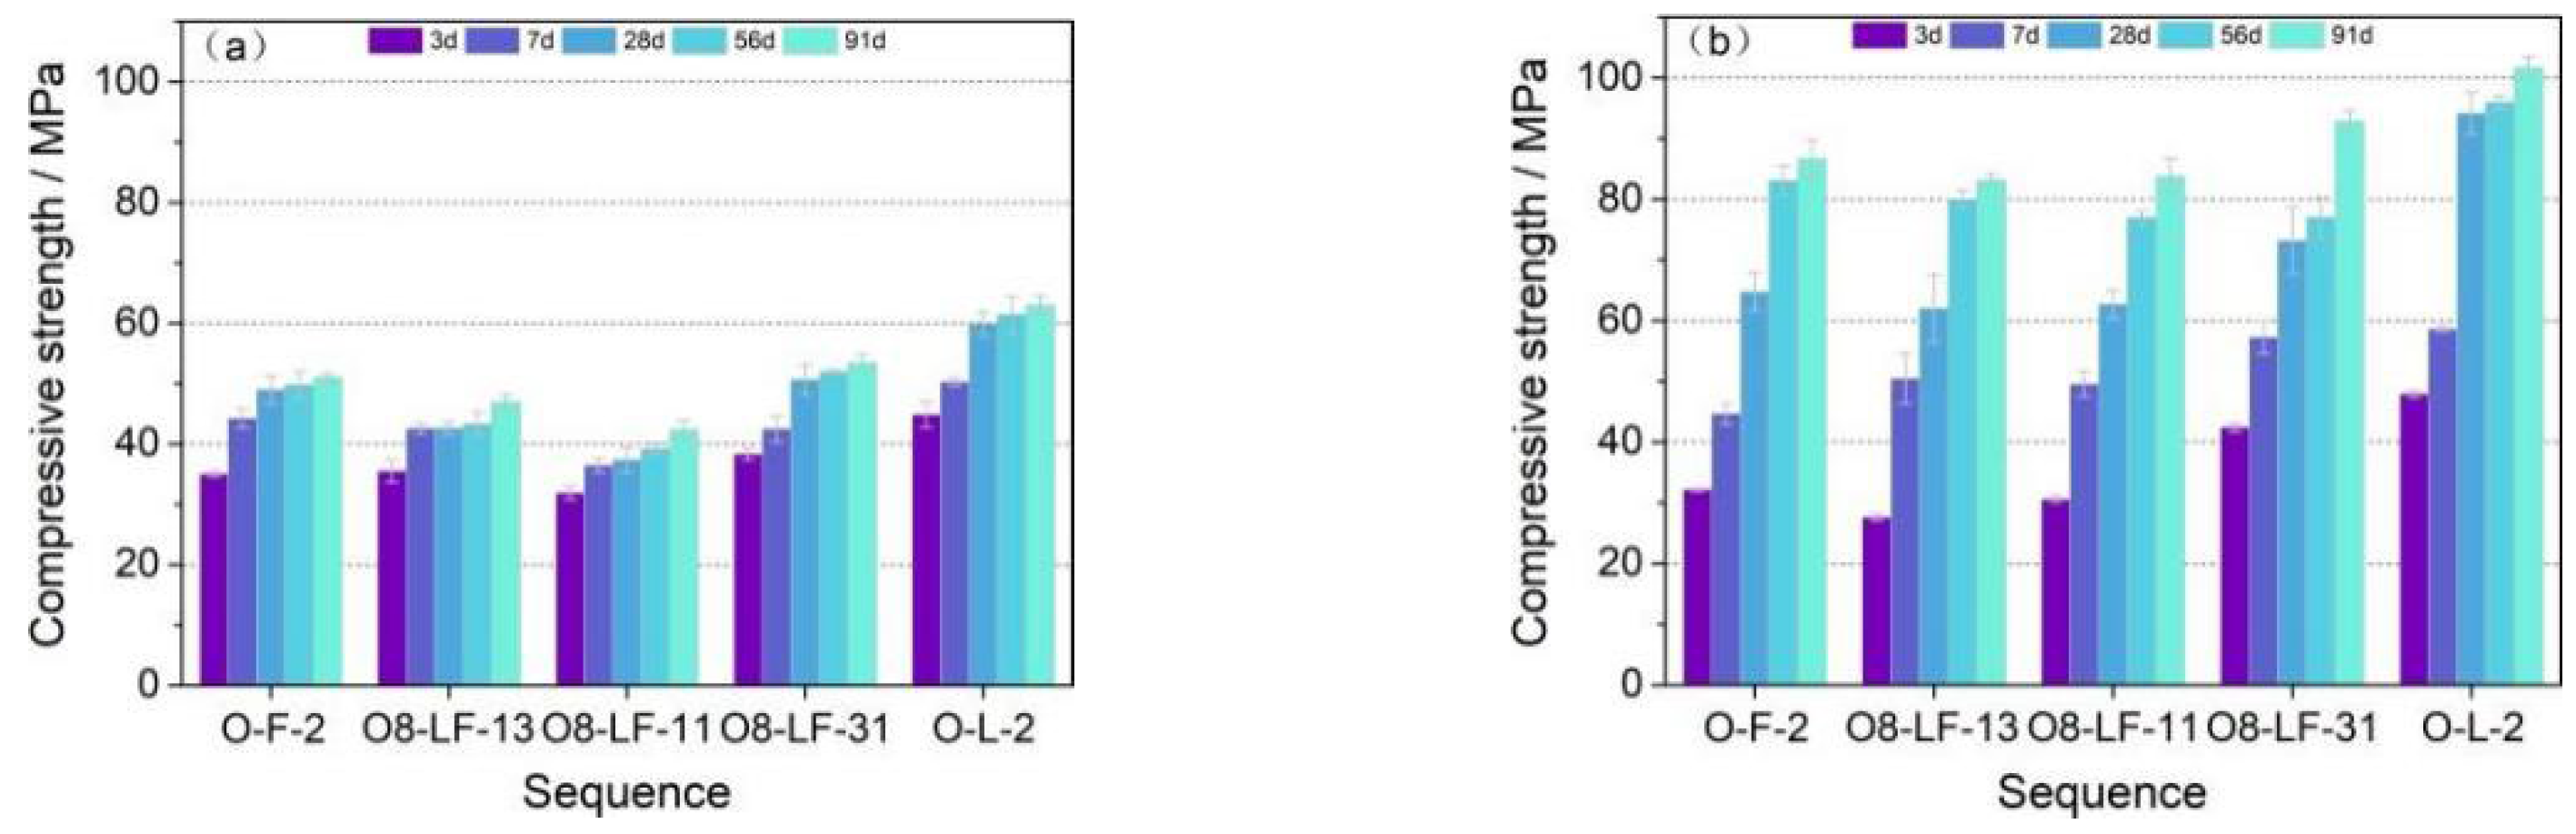
- The compressive strength of OPC-LCFA samples was better than OPC-FA samples, and the water curing was more favorable to the strength development of OPC-LCFA samples. The optimal dosage of LCFA as a binder to replace OPC was 20%, and the compressive strength of the sample reached 101 MPa after 91 days of water curing. The optimal mixing ratio of LCFA-FA was LCFA: FA = 3:1, and the total amount of LCFA and FA was 20%.
- The microscopic test results show that the main hydration products of OPC-LCFA samples were AFt, C-S-H gel, and Ca(OH)2. Further, AFt and C-S-H gels determined the strength development of OPC-LCFA samples. The formation rate of AFt and C-S-H gel mineral phases in the OPC-LCFA sample was higher than in the OPC-FA sample. The pozzolanic activity of LCFA was better than FA, which is essential for the resource utilization of LCFA. The appropriate amount of LCFA is beneficial to reduce the porosity and improve the pore structure of cement-based materials.
- Compared with the OPC-FA sample, the OPC-LCFA sample had a faster hydration product formation rate, more compact pore structure, and higher compressive strength.
- LCFA has potential application value as a binder, and its mechanical properties can meet engineering needs. To promote the resource utilization of LCFA, it is critical to further investigate the durability of OPC-LCFA.
Author Contributions
Funding
Institutional Review Board Statement
Informed Consent Statement
Data Availability Statement
Acknowledgments
Conflicts of Interest
References
- Zhang, W.; Lin, H.; Xue, M.; Wang, S.; Ran, J.; Su, F.; Zhu, J. Influence of shrinkage reducing admixtures on the performance of cementitious composites: A review. Constr. Build. Mater. 2022, 325, 126579. [Google Scholar] [CrossRef]
- Luo, S.; Zhao, M.; Jiang, Z.; Liu, S.; Yang, L.; Mao, Y.; Pan, C. Microwave preparation and carbonation properties of low-carbon cement. Constr. Build. Mater. 2022, 320, 126239. [Google Scholar] [CrossRef]
- Feng, C.; Cui, B.; Huang, Y.; Guo, H.; Zhang, W.; Zhu, J. Enhancement technologies of recycled aggregate—Enhancement mechanism, influencing factors, improvement effects, technical difficulties, life cycle assessment. Constr. Build. Mater. 2022, 317, 126168. [Google Scholar] [CrossRef]
- Armesto, L.; Merino, J.L. Characterization of some coal combustion solid residues. Fuel 1999, 78, 613–618. [Google Scholar] [CrossRef]
- Siddique, S.; Jang, J.G. Effect of CFBC ash as partial replacement of PCC ash in alkali-activated material. Constr. Build. Mater. 2020, 244, 118383. [Google Scholar] [CrossRef]
- Zhao, J.; Wang, D.; Liao, S. Effect of mechanical grinding on physical and chemical characteristics of circulating fluidized bed fly ash from coal gangue power plant. Constr. Build. Mater. 2015, 101, 851–860. [Google Scholar] [CrossRef]
- Shi, Y.; Liu, Q.; Shao, Y.; Zhong, W. Energy and exergy analysis of oxy-fuel combustion based on circulating fluidized bed power plant firing coal, lignite and biomass. Fuel 2020, 269, 117424. [Google Scholar] [CrossRef]
- Huang, Z.; Deng, L.; Che, D. Development and technical progress in large-scale circulating fluidized bed boiler in China. Front. Energy 2020, 14, 699–714. [Google Scholar] [CrossRef]
- He, K.W.; Lu, Z.Y.; Li, J.; Song, K.M. Comparative study on properties of circulating fluidized bed combustion ash and slag. J. Wuhan Univ. Technol. 2014, 36, 6–13. [Google Scholar]
- Chi, M.; Huang, R. Effect of circulating fluidized bed combustion ash on the properties of roller compacted concrete. Cem. Concr. Compos. 2014, 45, 148–156. [Google Scholar] [CrossRef]
- Chen, X.; Yan, Y.; Liu, Y.; Hu, Z. Utilization of circulating fluidized bed fly ash for the preparation of foam concrete. Constr. Build. Mater. 2014, 54, 137–146. [Google Scholar] [CrossRef]
- Lind, T.; Valmari, T.; Kauppinen, E.; Nilsson, K.; Sfiris, G.; Maenhaut, W. Ash formation mechanisms during combustion of wood in circulating fluidized beds. Proc. Combust. Inst. 2000, 28, 2287–2295. [Google Scholar] [CrossRef]
- Yang, Q.C.; Ma, S.H.; Zheng, S.L.; Zhang, R. Recovery of alumina from circulating fluidized bed combustion Al-rich fly ash using mild hydrochemical process. Trans. Nonferrous Met. Soc. China 2014, 24, 1187–1195. [Google Scholar] [CrossRef]
- Fu, X.; Li, Q.; Zhai, J.; Sheng, G.; Li, F. The physical–chemical characterization of mechanically-treated CFBC fly ash. Cem. Concr. Compos. 2008, 30, 220–226. [Google Scholar] [CrossRef]
- Zhou, M.; Chen, P.; Chen, X.; Ge, X.; Wang, Y. Study on hydration characteristics of circulating fluidized bed combustion fly ash (CFBCA). Constr. Build. Mater. 2020, 251, 118993. [Google Scholar] [CrossRef]
- Wu, T.; Chi, M.; Huang, R. Characteristics of CFBC fly ash and properties of cement-based composites with CFBC fly ash and coal-fired fly ash. Constr. Build. Mater. 2014, 66, 172–180. [Google Scholar] [CrossRef]
- Chi, M.C.; Huang, R.; Wu, T.H.; Fou, T.C. Utilization of circulating fluidized bed combustion (CFBC) fly ash and coal-fired fly ash in portland cement. Key Eng. Mater. 2014, 629–630, 306–313. [Google Scholar] [CrossRef]
- Hlaváček, P.; Šulc, R.; Šmilauer, V.; Rößler, C.; Snop, R. Ternary binder made of CFBC fly ash, conventional fly ash, and calcium hydroxide: Phase and strength evolution. Cem. Concr. Compos. 2018, 90, 100–107. [Google Scholar] [CrossRef]
- Chen, C.; Li, Q.; Shen, L.; Zhai, J. Feasibility of manufacturing geopolymer bricks using circulating fluidized bed combustion bottom ash. Energy Procedia 2012, 17, 1313–1321. [Google Scholar] [CrossRef]
- Xu, X.; Hu, Z.; Duan, L.; Zhang, Y.; Xiao, Y.; Lin, W. Investigation of high volume of CFBC ash on performance of basic magnesium sulfate cement. J. Environ. Manag. 2020, 256, 109878. [Google Scholar]
- Xu, H.; Li, Q.; Shen, L.; Zhang, M.; Zhai, J. Low-reactive circulating fluidized bed combustion (CFBC) fly ashes as source material for geopolymer synthesis. Waste Manag. 2010, 30, 57–62. [Google Scholar] [CrossRef] [PubMed]
- Li, Q.; Xu, H.; Li, F.; Li, P.; Shen, L.; Zhai, J. Synthesis of geopolymer composites from blends of CFBC fly and bottom ashes. Fuel 2012, 97, 366–372. [Google Scholar] [CrossRef]
- Ma, B.G.; Chen, Q.B.; Li, X.G.; Wang, W.Q.; Yin, X.B. Influence of activation methods on self-cementitious properties of CFBC desulfurized ash. J. Build. Mater. 2013, 16, 60–64. [Google Scholar]
- GB/T 1346–2011; Test Methods for Water Requirement of Normal Consistency, Setting Time and Soundness of the Portland Cement. The Standardization Administration of China: Beijing, China, 2011.
- GB/T 17671–1999. Method of Testing Cements—Determination of Strength. The Standardization Administration of China: Beijing, China, 1999.
- Sheng, G.H.; Li, Q.; Zhai, J.P.; Yu, J.L. The mineral compositions of fly ash from cofiring coal and petroleum coke in a circulating fluidized bed compensator. J. Nanjing Univ. 2007, 43, 329–334. [Google Scholar]
- Yan, P.Y.; Zheng, F. Kinetics model for the hydration mechanism of cement-based materials. J. Chin. Ceram. Soc. 2006, 34, 555–559. [Google Scholar]
- Xu, Z.; Zhou, Z.; Du, P.; Cheng, X. Effects of nano-limestone on hydration properties of tricalcium silicate. J. Therm. Anal. Calorim. 2017, 129, 75–83. [Google Scholar] [CrossRef]
- Hou, G.H.; Zhong, B.Q.; Yang, N.R. Effects of calcined gypsum on early hydration of portland cement. J. Chin. Ceram. Soc. 2002, 30, 675–680. [Google Scholar]
- Yang, N.R.; Zhong, B.Q.; Dong, P.; Wang, J. Formation and stabilization conditions of ettringite. J. Chin. Ceram. Soc. 1984, 12, 155–165. [Google Scholar]
- Kim, G.M.; Jang, J.G.; Naeem, F.; Lee, H.K. Heavy metal leaching, CO2 uptake and mechanical characteristics of carbonated porous concrete with alkali-activated slag and bottom ash. Int. J. Concr. Struct. Mater. 2015, 9, 283–294. [Google Scholar] [CrossRef] [Green Version]
- Xu, X.; Fan, X.; Yang, C. Investigation on physical properties, strength and phase evolution of binary cementitious materials made of CFBC ash and lime. Constr. Build. Mater. 2020, 265, 120302. [Google Scholar]
- Constantinides, G.; Ulm, F.J. The nanogranular nature of C–S–H. J. Mech. Phys. Solids 2007, 55, 64–90. [Google Scholar] [CrossRef]
- Zajac, M.; Skocek, J.; Adu-Amankwah, S.; Black, L.; Ben Haha, M. Impact of microstructure on the performance of composite cements: Why higher total porosity can result in higher strength. Cem. Concr. Compos. 2018, 90, 178–192. [Google Scholar] [CrossRef]
- Zhang, B.; Tan, H.; Shen, W.; Xu, G.; Ma, B.; Ji, X. Nano-silica and silica fume modified cement mortar used as surface protection material to enhance the impermeability. Cem. Concr. Compos. 2018, 92, 7–17. [Google Scholar] [CrossRef]


| SiO2 | Al2O3 | Fe2O3 | CaO | MgO | Na2O | K2O | SO3 | TiO2 | LOI | |
|---|---|---|---|---|---|---|---|---|---|---|
| LCFA | 51.79 | 29.46 | 4.54 | 6.29 | 0.89 | 0.32 | 1.88 | 2.77 | 1.40 | 1.12 |
| OPC | 18.46 | 4.98 | 4.18 | 62.81 | 3.82 | 0.44 | 0.78 | 2.97 | 0.38 | 0.69 |
| FA | 51.10 | 27.90 | 8.80 | 5.14 | 0.68 | 0.62 | 1.92 | 1.66 | 1.42 | 0.71 |
| Series | Code | LCFA /wt% | FA /wt% | OPC /wt% | W/B /wt% | J/B /wt% | Fluidity/mm | Curing Condition | |
|---|---|---|---|---|---|---|---|---|---|
| 1 | O-L-10 | 100 | 0 | 0 | 65 | 2.22 | — | Dry curing | |
| O-L-0 | 0 | 0 | 100 | 35 | 0.30 | 184 | Water curing | Dry curing | |
| O-L-1 | 10 | 0 | 90 | 0.50 | 180 | ||||
| O-L-2 | 20 | 0 | 80 | 0.80 | 180 | ||||
| O-L-3 | 30 | 0 | 70 | 1.10 | 182 | ||||
| O-L-4 | 40 | 0 | 60 | 1.43 | 180 | ||||
| 2 | O-F-1 | 0 | 10 | 90 | 0.30 | 180 | |||
| O-F-2 | 0 | 20 | 80 | 0.33 | 176 | ||||
| O-F-3 | 0 | 30 | 70 | 0.33 | 182 | ||||
| O-F-4 | 0 | 40 | 60 | 0.27 | 177 | ||||
| 3 | O8-LF-31 | 15 | 5 | 80 | 0.67 | 175 | |||
| O8-LF-11 | 10 | 10 | 80 | 0.48 | 181 | ||||
| O8-LF-13 | 5 | 15 | 80 | 0.47 | 182 | ||||
| O6-LF-31 | 30 | 10 | 60 | 0.85 | 183 | ||||
| O6-LF-11 | 20 | 20 | 60 | 0.60 | 178 | ||||
| O6-LF-13 | 10 | 30 | 60 | 0.37 | 185 | ||||
Publisher’s Note: MDPI stays neutral with regard to jurisdictional claims in published maps and institutional affiliations. |
© 2022 by the authors. Licensee MDPI, Basel, Switzerland. This article is an open access article distributed under the terms and conditions of the Creative Commons Attribution (CC BY) license (https://creativecommons.org/licenses/by/4.0/).
Share and Cite
Zhang, W.; Wang, S.; Zhao, L.; Ran, J.; Kang, W.; Feng, C.; Zhu, J. Investigation of Low-Calcium Circulating Fluidized Bed Fly Ash on the Mechanical Strength and Microstructure of Cement-Based Material. Crystals 2022, 12, 400. https://doi.org/10.3390/cryst12030400
Zhang W, Wang S, Zhao L, Ran J, Kang W, Feng C, Zhu J. Investigation of Low-Calcium Circulating Fluidized Bed Fly Ash on the Mechanical Strength and Microstructure of Cement-Based Material. Crystals. 2022; 12(3):400. https://doi.org/10.3390/cryst12030400
Chicago/Turabian StyleZhang, Wenyan, Shuai Wang, Liya Zhao, Junsheng Ran, Wenjing Kang, Chunhua Feng, and Jianping Zhu. 2022. "Investigation of Low-Calcium Circulating Fluidized Bed Fly Ash on the Mechanical Strength and Microstructure of Cement-Based Material" Crystals 12, no. 3: 400. https://doi.org/10.3390/cryst12030400
APA StyleZhang, W., Wang, S., Zhao, L., Ran, J., Kang, W., Feng, C., & Zhu, J. (2022). Investigation of Low-Calcium Circulating Fluidized Bed Fly Ash on the Mechanical Strength and Microstructure of Cement-Based Material. Crystals, 12(3), 400. https://doi.org/10.3390/cryst12030400