Article

The Structure, Magnetic, and Gas Sensing Characteristics of W-Substituted Co-Ferrite Nanoparticles

by
Omar Abd-Elkader
1,*,
Abdullah M. Al-Enizi
2,
Shoyebmohamad F. Shaikh
2,
Mohd Ubaidullah
2,
Mohamed O. Abdelkader
3 and
Nasser Y. Mostafa
4
1
Department of Physics and Astronomy, College of Science, King Saud University, P.O. Box 2455, Riyadh 11451, Saudi Arabia
2
Department of Chemistry, College of Science, King Saud University, P.O. Box 2455, Riyadh 11451, Saudi Arabia
3
Department of Biochemistry, College of Science, King Saud University, P.O. Box 2455, Riyadh 11451, Saudi Arabia
4
Department of Chemistry, Faculty of Science, Suez Canal University, Ismailia 41522, Egypt
*
Author to whom correspondence should be addressed.
Crystals 2022, 12(3), 393; https://doi.org/10.3390/cryst12030393
Submission received: 14 February 2022 / Revised: 12 March 2022 / Accepted: 12 March 2022 / Published: 14 March 2022
(This article belongs to the Section Materials for Energy Applications)

Abstract

:
Ferrites have been broadly investigated as gas sensors. The present article reports on the synthesis of Co-ferrite doped with W ions and their gas sensing abilities. A series of single phase CoFe2O4 powder with different W-doping (0.0 ≤ x ≤ 0.15) was synthesized using sol-gel synthesis. A variation in the saturation magnetization (Ms) and the lattice dimension with W(VI) substitution was associated with a change in the distribution of Fe(III) ions between tetrahedral and octahedral sites. Introducing W(VI) ions into the spinel lattice induced the rearrangement of Fe(III) ions. The total Ms increased with W-doping up to x = 0.05 (Ms = 50.1 Am2/kg) and it dramatically decreased to 34.6 Am2/kg with x = 0.15 of doping. However, the lattice parameter increased with increasing doping levels. Different W-doped CoFe2O4 were examined for a gas sensing response in the temperature range of 200–450 °C. Comparing the sensor responses to various reducing gases, the material’s response was shown to be sensitive and selective for acetone. The addition of W (0.15%) had a significant impact on the response and on the operating temperature of the sensor material, indicating that it might be used as an acetone sensor.

1. Introduction

Industrial growth provoked atmospheric pollution, which induced the public and the scientific community to find better detection devices [1]. Research into gas and volatile liquid sensors is one of the main research topics targeting safety in the industrial and the environmental sectors [2]. The sensing mechanism involves changing the properties of materials with an analyte concentration [3]. This commonly occurs due to physical or chemical adsorption [4]. Nanosized materials are expected to play an essential role because of their large surfaces, which enhances the adsorption phenonium as well as the sensor response.
Generally, gas sensors are built based on various sensing mechanisms, such as the chemiresistive [5], fiber optic [6], and potential sensor [7]. The chemiresistor sensors are mainly built on metal oxide semiconductors. The popularity of chemiresistor sensors is due to their simplicity and their low cost. However, the main challenge for these types of sensors is increasing their sensitivity selectivity [8].
Spinel ferrites with the chemical formula MX2O4 (M = divalent metal and X = Fe3+) are a large group of mixed oxides with diverse physicochemical properties [9,10,11]. Mixing different magnetic and nonmagnetic ions in the spinel structure enables magnetic tuning and the photocatalytic properties of ferrites [12,13,14]. Nano-ferrite based transition metals are very important materials due to their different applications in various fields such as surface chemistry and catalysis [11,13,15,16,17]. Many factors affect the performance and the properties of ferrites: preparation method, precursor compounds, molar ratios, thermal treatment, and the presence of doping. The ferrite materials exhibit a gas sensing efficiency toward different gases [18]. The traditional method for ferrite synthesis is the conventional ceramic route: heating of the desired divalent metal/iron precursor compounds at elevated temperatures for a certain period. Yet, this method has some disadvantages such as elevation of the preparation temperature, large particle size, inhomogeneity, sinterability of products with a low surface, and a long period of calcination temperatures [19].
In previous studies [15,17,20], we investigated various magnetic and nonmagnetic dopants on the structure and the physicochemical properties of spinel ferrites. Due to their stability, faster response and recovery time, low cost, and simple electronic structure, spinel ferrites such as ZnFe2O4, MnFe2O4, NiFe2O4, and CoFe2O4 have shown good sensitivity for a variety of gases [21,22,23]. The magnetic characteristics and gas-sensing efficiency of ferrites are determined by their microstructural properties, which are linked to their manufacturing procedures. With its excellent chemical stability, mechanical hardness, appropriate saturation magnetization, and high magneto-crystalline anisotropy, cobalt ferrite has been widely investigated for gas sensing [24]. For these characteristics, it is a prospective possibility for a variety of applications, including magnetic data storage, magnetic drug targeting, biosensors, and magnetic refrigeration. The synthesis route has a significant impact on the physical and the chemical properties of spinel nanoparticles. The chemical, structural, and magnetic properties of nanoparticles are widely understood to be substantially influenced by their composition and their microstructures, which are susceptible to fabrication procedures. Doping La and Ce ions in MgFe2O4 increases their sensing sensitivities and decreases their working temperatures [25,26].
In the present research, we tuned the physicochemical properties of Co-ferrite to better sense gas. This paper highlights the sensing application of Co-ferrite doped with tungsten ions. We used tungsten ions as substituents for ferric ions in the CoFe2O4 spinel structure. The influence of W(VI) substitution on the crystalline size, microstrain, morphology, magnetic properties, and gas sensing response was systematically studied.

2. Materials and Methods

2.1. Materials and Preparation Route

A series of single-phase CoFe2O4 powder with different W-doping (0.0 ≤ x ≤ 0.15) was synthesized by a sol-gel method using citric acid as a complexant. Analytical grade Cobalt (II) nitrate hexahydrate Co (NO3)2.6H2O, Iron (III) nitrate nonahydrate Fe (NO3)3.9H2O, and Citric acid HOC (CO2H) (CH2CO2H)2 were placed in a molar ratio of 1:2:3, with Tungstic acid H2WO4 as a source of W were all obtained from Sigma-Aldrich, double-deionized water was used for preparing all solutions. The sol–gel synthesis process started with the homogenous solution of metal soluble salts and proceeded with the formation of a stable sol. The chemical condensation of the sol produced a homogenous gel. The final step involved drying the gel and formation solid products. Details of the whole preparation process are provided in Figure 1. Both precursors were initially separately dispersed in deionized water for half an hour by stirring. Following this dispersion, the chelating agent was added, and the mixture was left reacting under vigorous stirring for 2 h. Both solutions were then mixed together and left stirring for 24 h, then the precursors were heated to 85 °C for 1.5 h under magnetic stirring until a dark red gel was formed. The gel was dried at 110 °C for 12 h, transferred to an alumina crucible, and further treated at 850 °C for 6 h. W-substituted CoFe2O4 nanoparticles and CoFe2−2xWxO4 (0.0 ≤ x ≤ 0.15) were prepared. In order to maintain the charge neutrality, we replaced two Fe(III) ions with one W(VI) ion so the produced powder would have the following formula: CoWxFe2−2xO4 (where, x = 0.0, 0.05, 0.10 and 0.15).

2.2. Characterization Techniques

Using a BRUKER D8 diffractometer, XRD were measured. The diffraction patterns were collected at 40 kV with Cu-Kα (λ = 0.15406 nm) radiation and 40 mA with scanning speeds of 2 theta 2° min−1. The XRD data was analyzed, indexed, and least squares fitted using the software X’Pert High Score Plus. The crystallite sizes (D) and lattice microstrain (ε) were determined from XRD using the Williamson–Hall method [27]:
β cos θ = 0.98 λ D + 4 ε sin θ
where, D is the crystallite size, λ is the wavelength of the X-ray, β is full-width half maximum (FWHM) of diffraction line and θ is the Bragg angle. Details regarding applying the W–H method to XRD data was given in our publication [15].
A PerkinElmer spectrophotometer was used to measure the examined Fourier transform infrared spectrum (FTIR) (type 1430, PerkinElmer, Unit a Llantrisant CF72 United Kingdom). The IR spectra were recorded from 4000 to 400 cm−1. The samples (2 mg) were mixed with 200 mg of vacuum-dried KBr then pressed in a 13 mm diameter disk with a steel die and subjected to a 12-ton pressure after being dispersed for 3 min in a vibrating ball mill. The sample disk was put into the holder of the double grating IR spectrometer.
The samples were dispersed in ethanol and then treated ultrasonically for a few minutes to disperse individual particles over a mount setup and Copper grids using JEOL JAX-840A and JEOL Model 1230 (JEOL, Tokyo, Japan) scanning electron microscopes (SEM) and a transmittance electron microscope (TEM) at 25, 100 Kev operating voltage, respectively. The sample disk was put further into the holder.
With such a Delta kevex device attached to an electron microscope, JED-2200 Series, energy dispersive X-ray analysis (EDS with Mapping) was done (JEOL, Tokyo, Japan). The following parameters were used: an accelerating voltage of 25 kV, an accumulation time of 120 s, and a window width of 6 mm. The surface molar composition was deter-mined using the Asa technique, Zaf correction, and Gaussian approximation.
The surface properties of different samples, such as specific surface area (SBET), statistical thickness surface area (St), total pore volume (VP), and mean pore radius (ȓ) were determined from nitrogen adsorption isotherms at 77 K using a conventional volumetric apparatus (Brunauer Emmett Teller method) using Micrometrics’ Gemini VII 2390 V1.03 series of surface area analyzer (Microtrac, Alpharetta, GA, USA). Before the measurements, each sample was out-gassed for 2 h at 200 °C at a decreased pressure of 10−5 Torr.
The photoelectron energy was evaluated with an Omicron E125 concentric hemispherical analyzer operating in pulse count mode; XPS measurements were started with achromatic Al K α radiation (1486.6 eV) with an incident angle of roughly 85° with regard to the sample normal. With pass energies of 200 eV and 900 eV, a comprehensive scan of the photoemission characteristics from all components and detailed scans of particular elemental areas were acquired.
The magnetic characteristics of the materials were investigated in a maximum field of 20 kOe at room temperature using a vibrating sample magnetometer (VSM) (9600-1 LDJ, Weistron Co., Ltd., West Holly-wood, CA, USA). Hysteresis loops, saturation magnetization (Ms), remanence magnetization (Mr), and coercivity (Hc) were all established.

2.3. Gas Sensor Setup

A laboratory made static gas sensing setup was used for measuring the sensor response. Ferrite samples were ground in ethanol, dried and pressed into discs with diameters of 15 mm and thicknesses of 2.5 mm. The resulting discs were fixed on a cupper sheet as electrodes and pressed by stainless steel mesh, which acted as the other electrode. A heating element was used to heat the sensor in a closed chamber. The sensor resistance was measured in air atmosphere (Ra) and in tested gas (Rg), respectively. The sensor response (Res) is calculated in the following formula:
R e s   ( % ) = ( R a R g ) ÷ R a × 100
where Ra is the sensor resistance in the absence of test gas at a specific temperature, and Rg is the sensor resistance in the presence of test gas at the same temperature. The response of the sensor was tested as a function of temperature for 2000 ppm of several gas/vapor species to identify the sensor’s optimum working temperature. The calibration curve was established based on the relationship between the gas concentration and the change in conductivity.

3. Results and Discussion
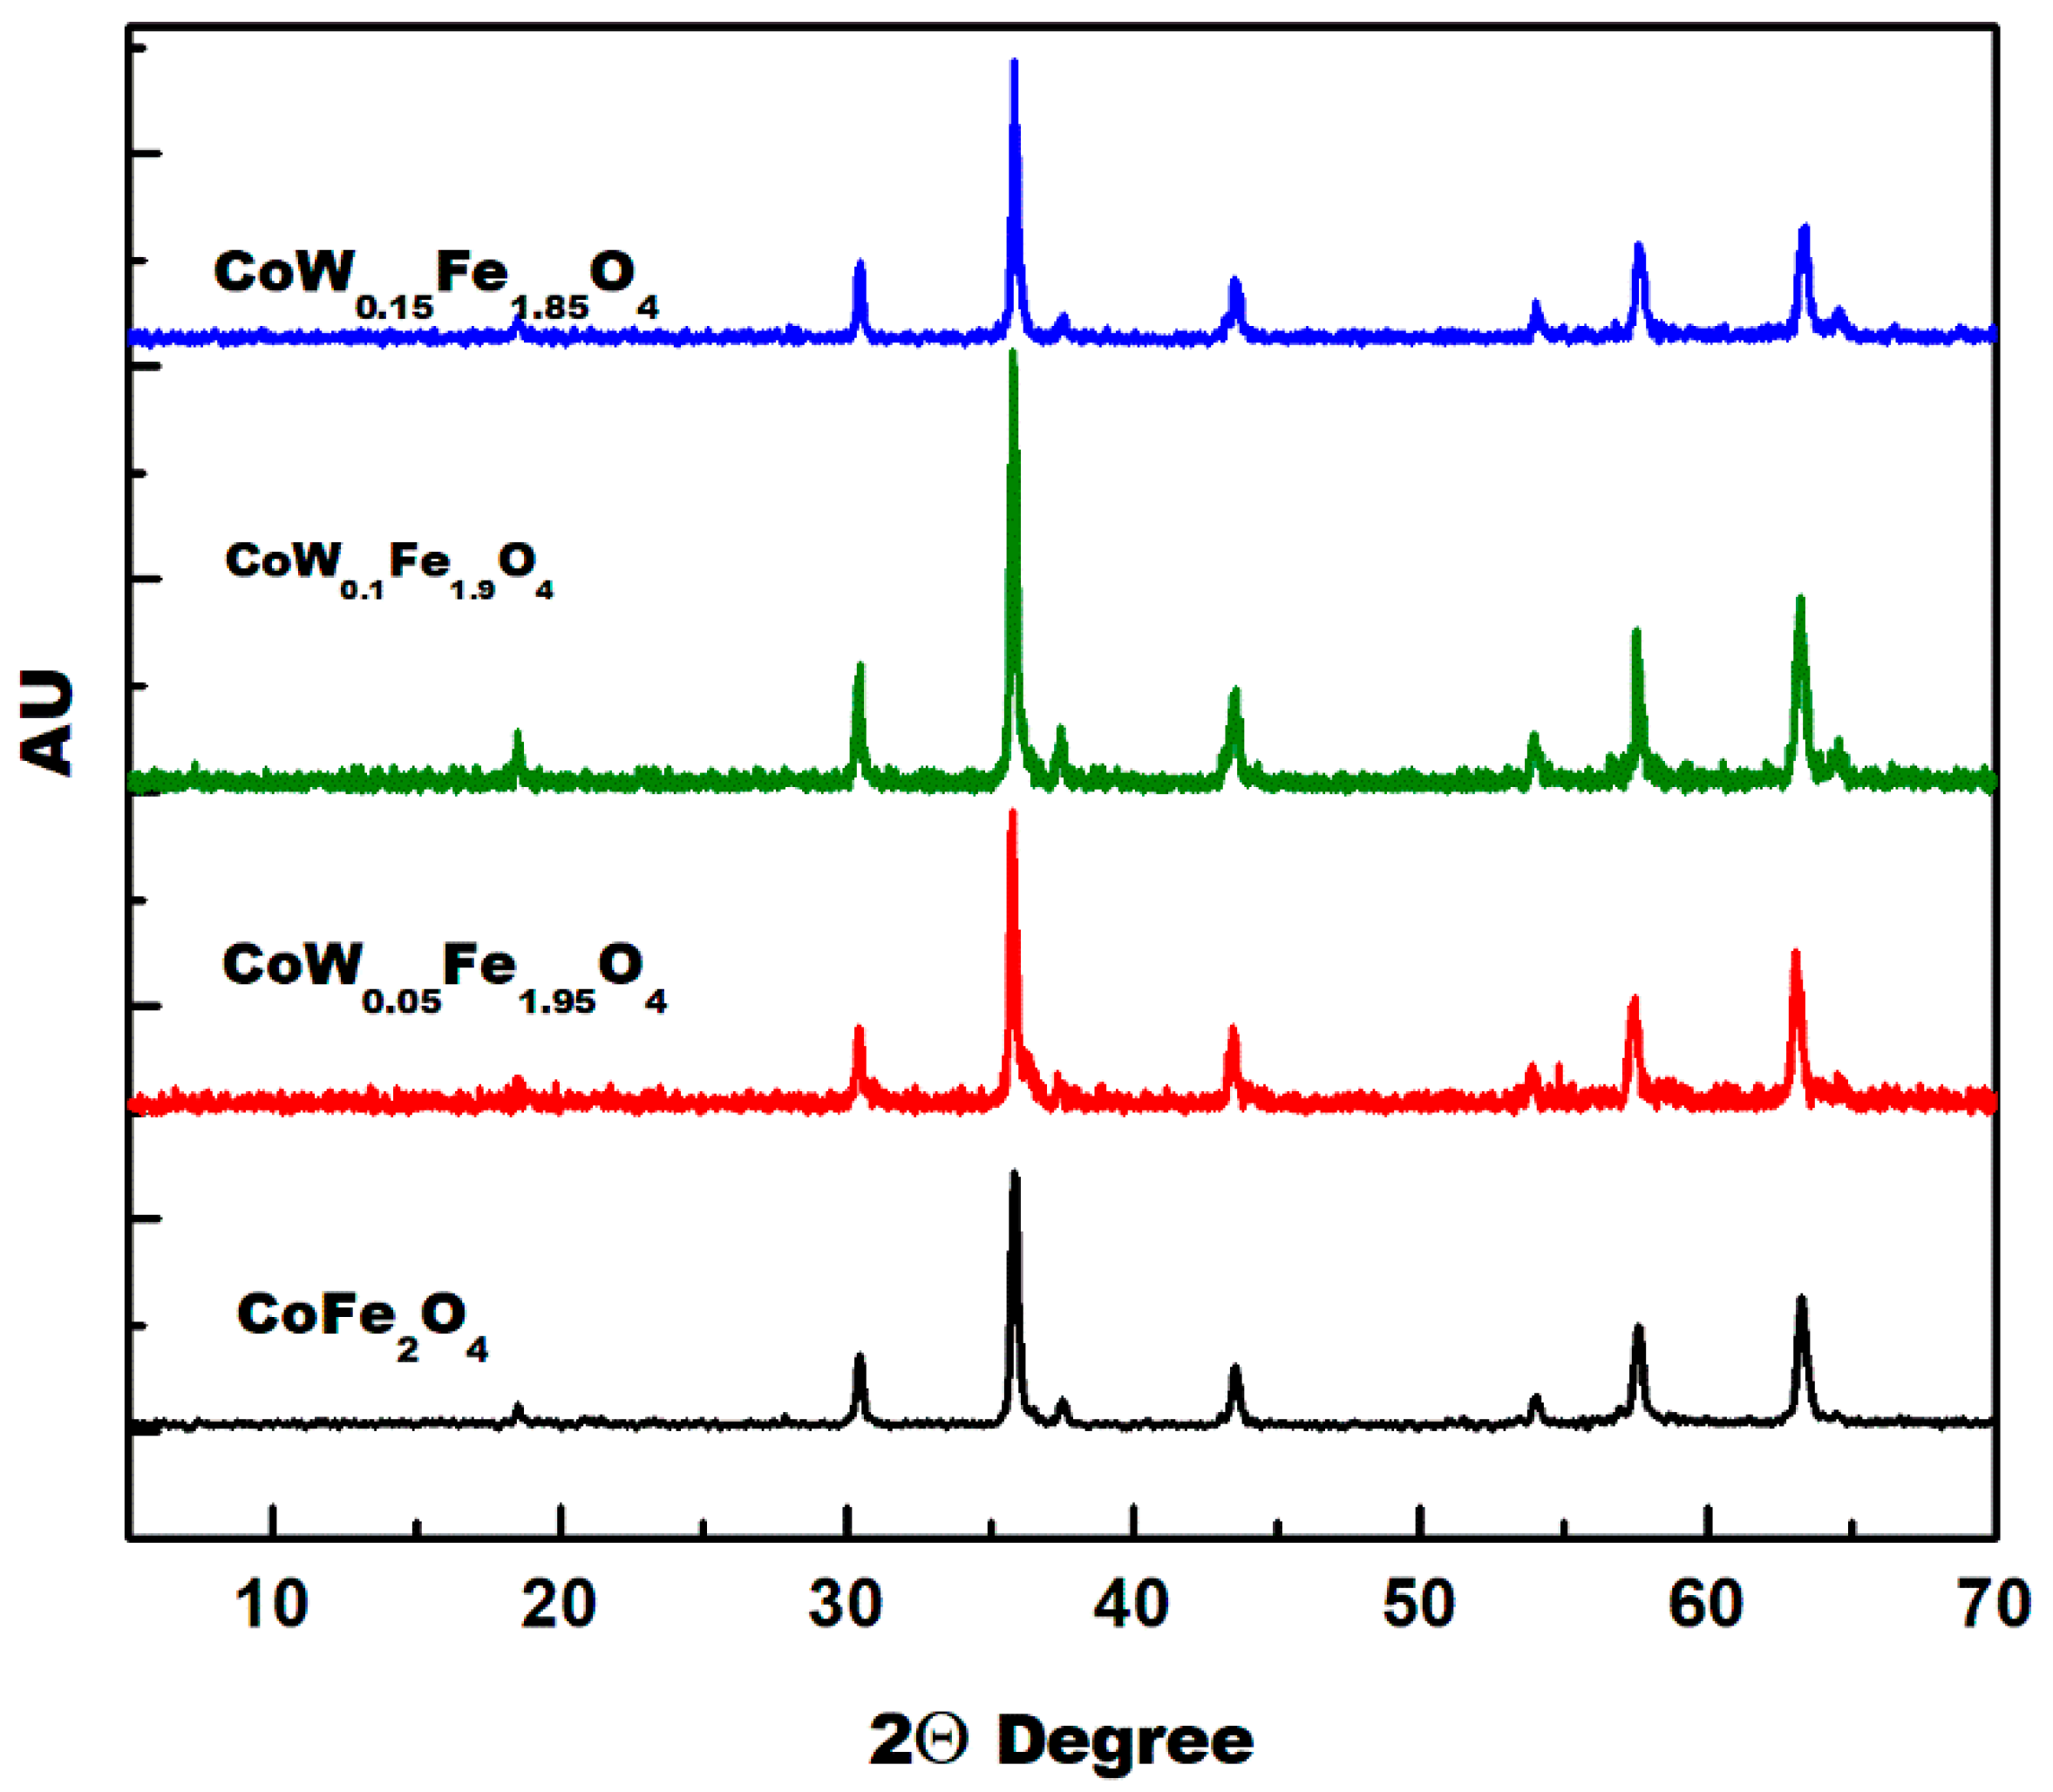
3.1. XRD Analysis

Figure 2 shows the XRD patterns of Co-ferrite powders obtained with different W-doping (x = 0.0, 0.05, 0.10 and 0.15). A cubic spinel ferrite phase was formed in all samples. The broadening of the diffraction peaks increased with an increasing amount of W-substitution due to a decrease in the particle size or an increase in the defects and the microstrain [15,27]. The lattice parameters of cubic CoFe2O4 with different W-doping were determined from XRD data and they are given in Table 1. The value of the lattice parameter increases with the increasing of W-contents. The ionic radii of W(VI) ion is smaller than that of Fe(III) ions in tetrahedral sites (see Table 2) and the reverse is true with respect to octahedral sites. The W(VI) ionic radius in B-sites is higher than that of Fe(III) in the same site. This result indicated that W(VI) substitutions in the B-site had displaced Fe(III). These variations in the lattice parameter are due to the difference in the ionic radii between Fe(III) and W(VI) ions in the octahedral sites. Table 2 summarizes the ionic radii (Å) of different metal cations in A-sites (tetrahedral) and B-sites (octahedral) [28]. However, the increase in the lattice parameter and the lattice volume may be partially due to the rearrangement of Co (II) between the tetrahedral and the octahedral sites. The crystallite sizes (D) and the lattice strains (ε) were determined from XRD data using the Williamson–Hall method (W–H) [27]. Details regarding the W–H method were given in our recent publications [15,29]. The determined microstrains are shown in Table 1.

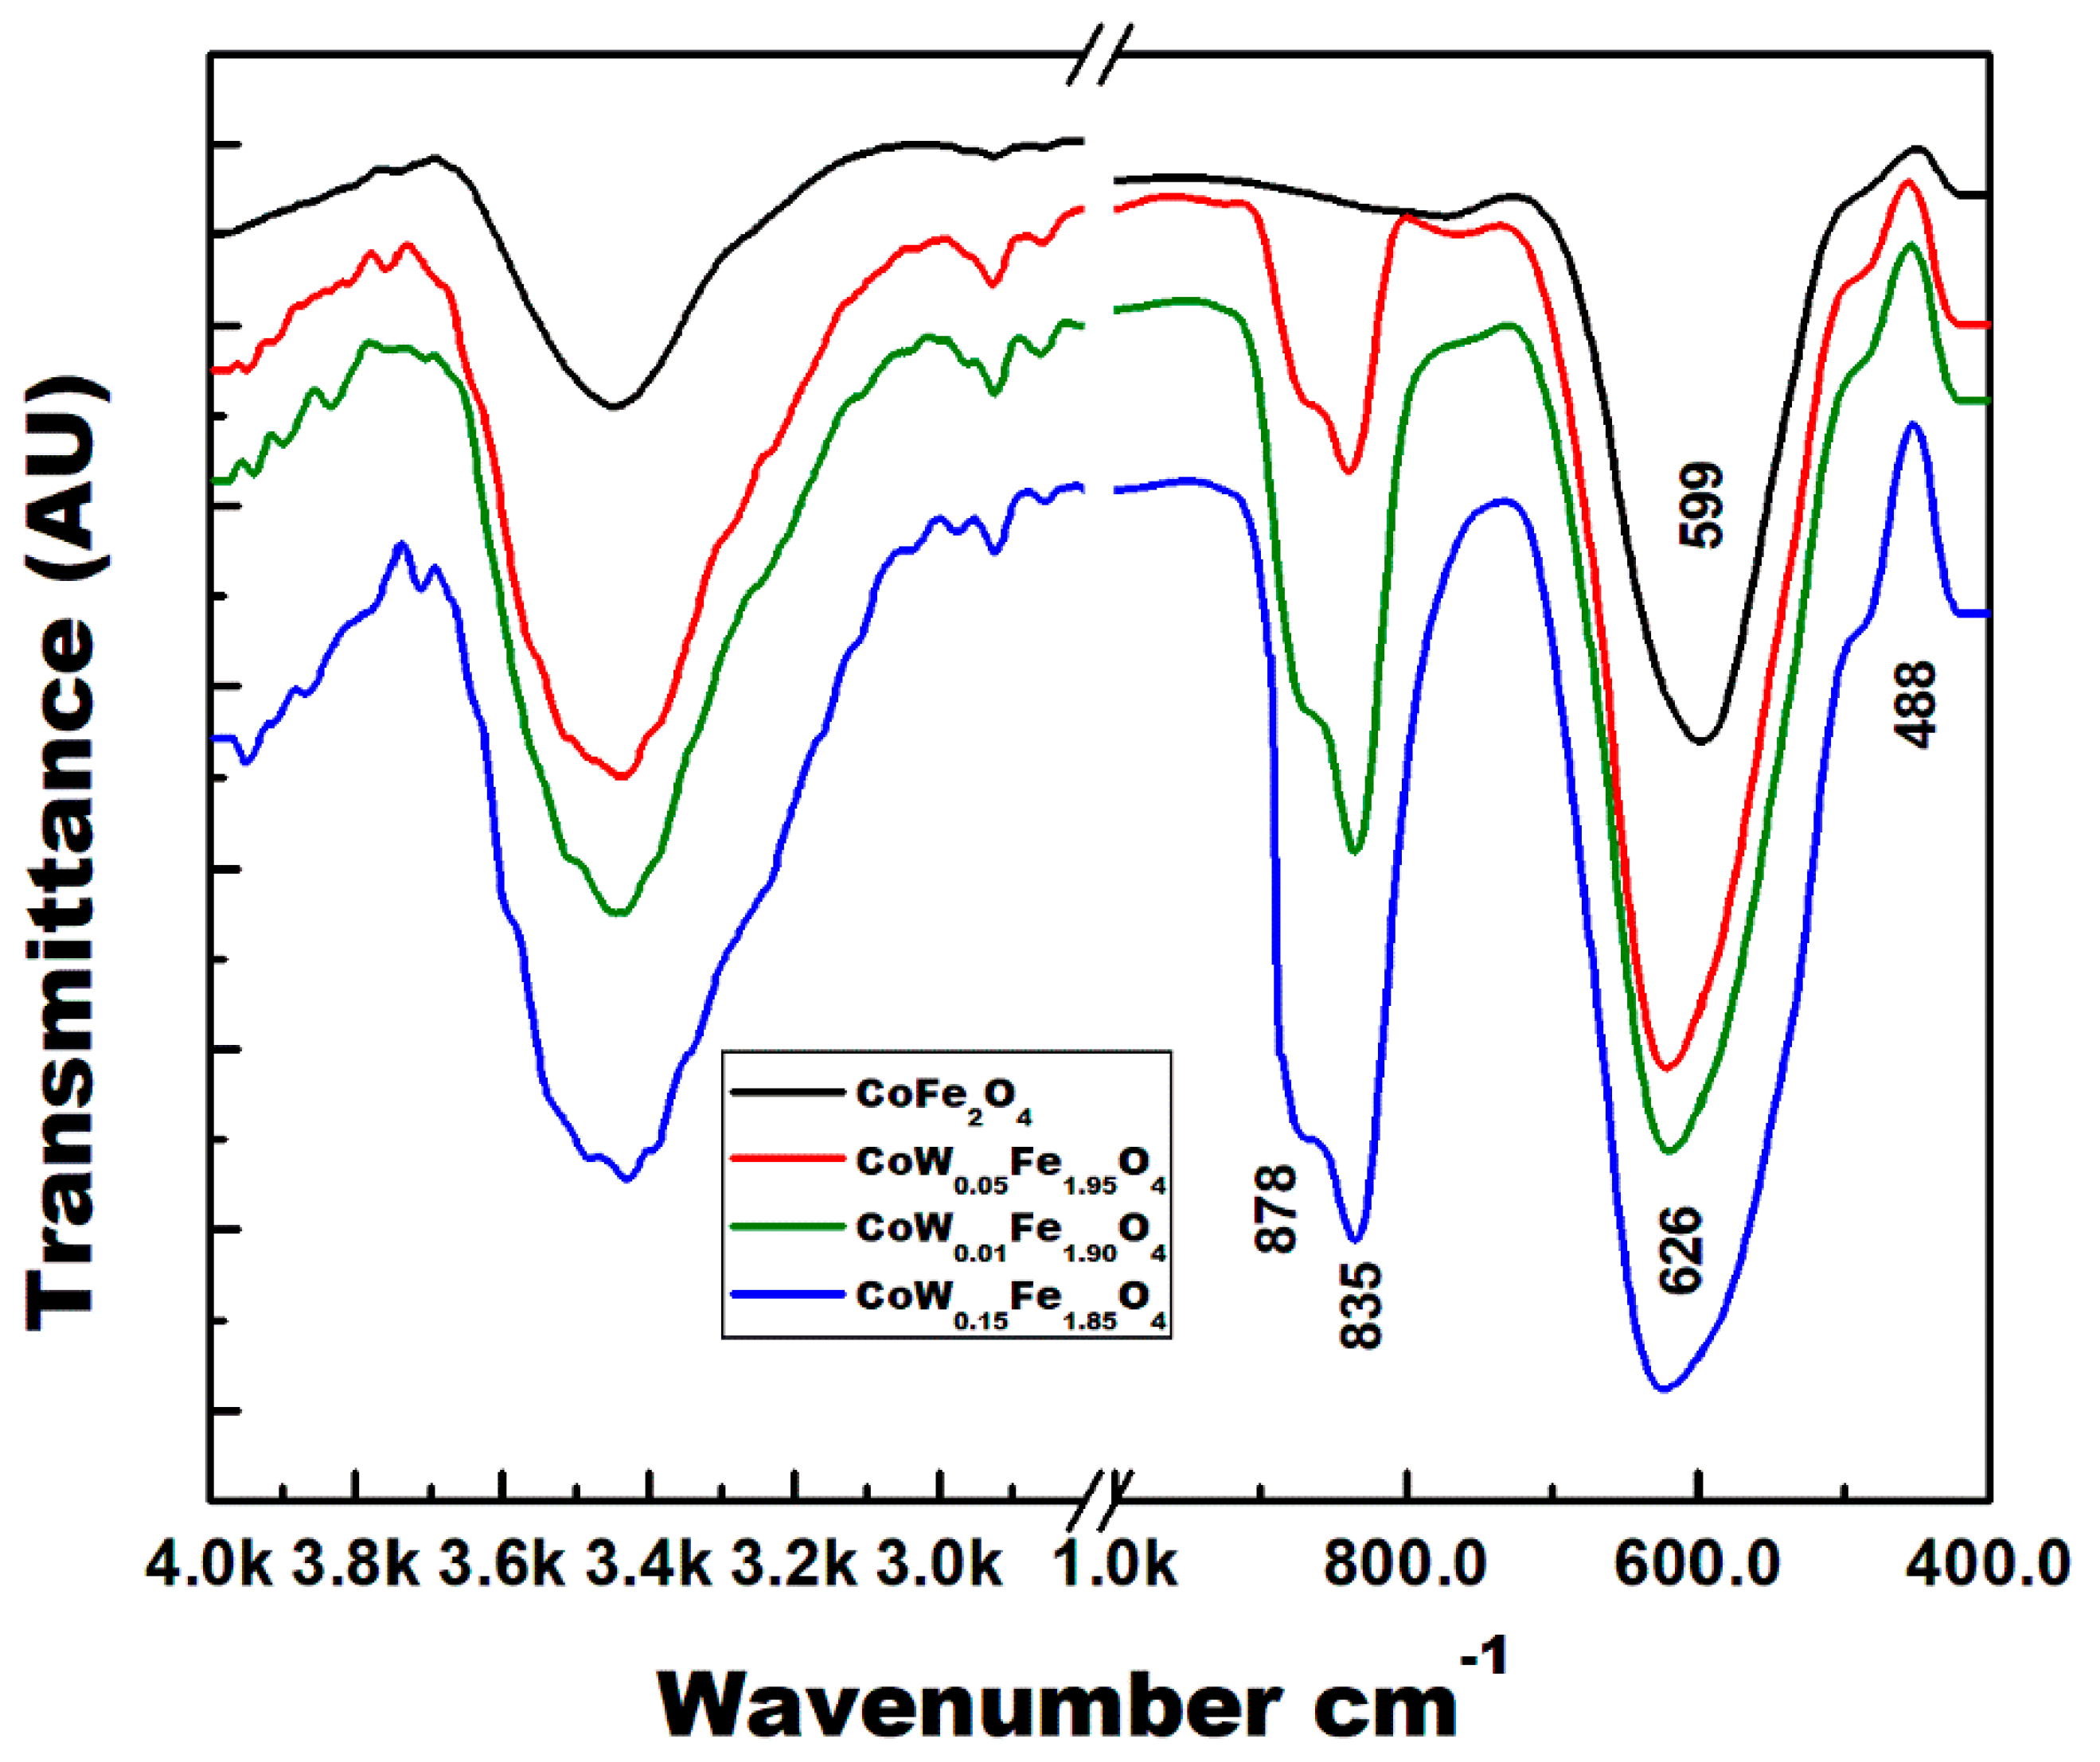
3.2. ATR-FTIR Spectra

Figure 3 shows the FTIR spectra of the pure CoFe2O4 and the W-substituted CoFe2O4. Generally, spinel ferrites show two broad bands of metal–oxygen in octahedral and tetrahedral sites [30]. The stretching frequency of the tetrahedral M–O appears at high frequencies because of the short bond length and the high force constants of the tetrahedral M–O bonds [31]. The stretching vibration of the tetrahedral M–O band is observed at approximately 500–600 cm−1, and it corresponds to the metal ions at the tetrahedral A-site. This band appears at 599 cm−1 in pure CoFe2O4 and it shifts gradually with W substitutions to 626 cm−1 for a sample with 15% W. The octahedral M–O stretching appears at low frequencies between 400–500 cm−1 [31], thus appearing for all ferrites. It is not specific to a W–O bond, thus appearing even for CoFe2O4. This broad band appears as a shoulder at nearly 488 cm−1. The insertion of W(VI) in CoFe2O4 has been confirmed by ATR-FTIR spectroscopy. The tungstate group (WO4−2) exhibits several bands in the 900–700 cm−1 region. These bands intensify with the increasing amount of tungsten in the samples. The FTIR bands at 878 and 835 cm−1 are characteristic of WO4−2 groups. These bands are due to a vibration of the O–W–O bonds [32].

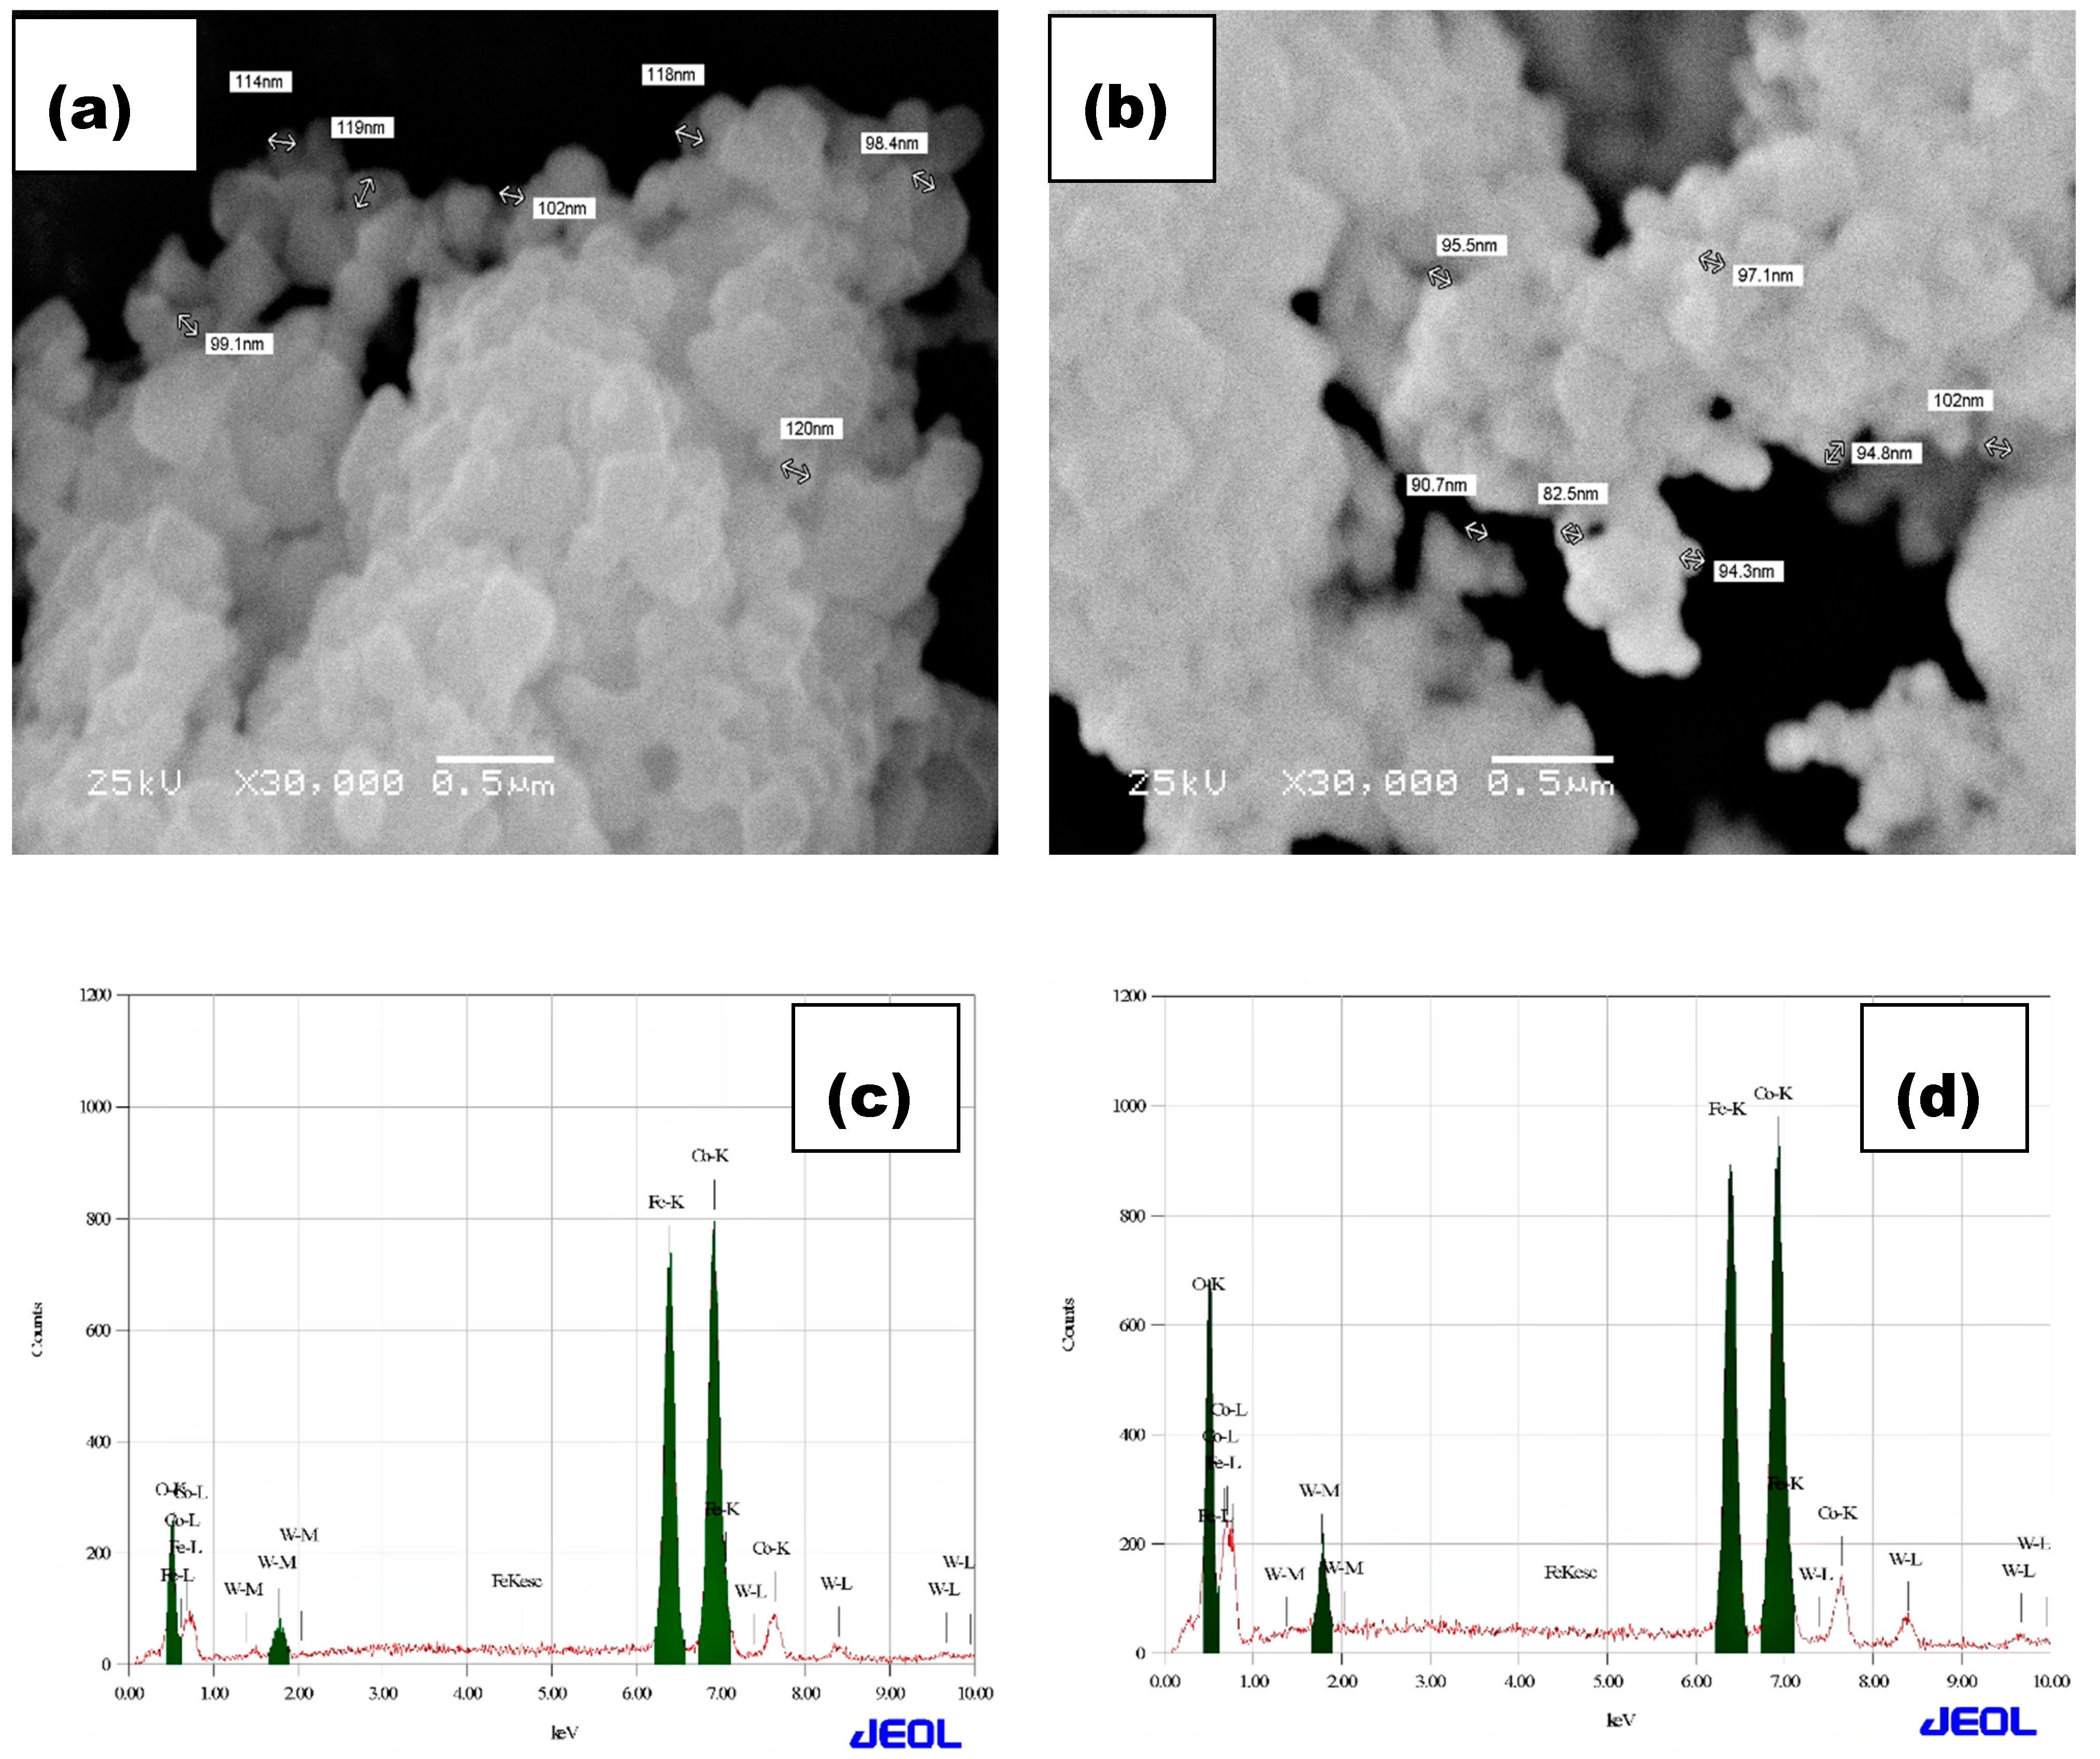
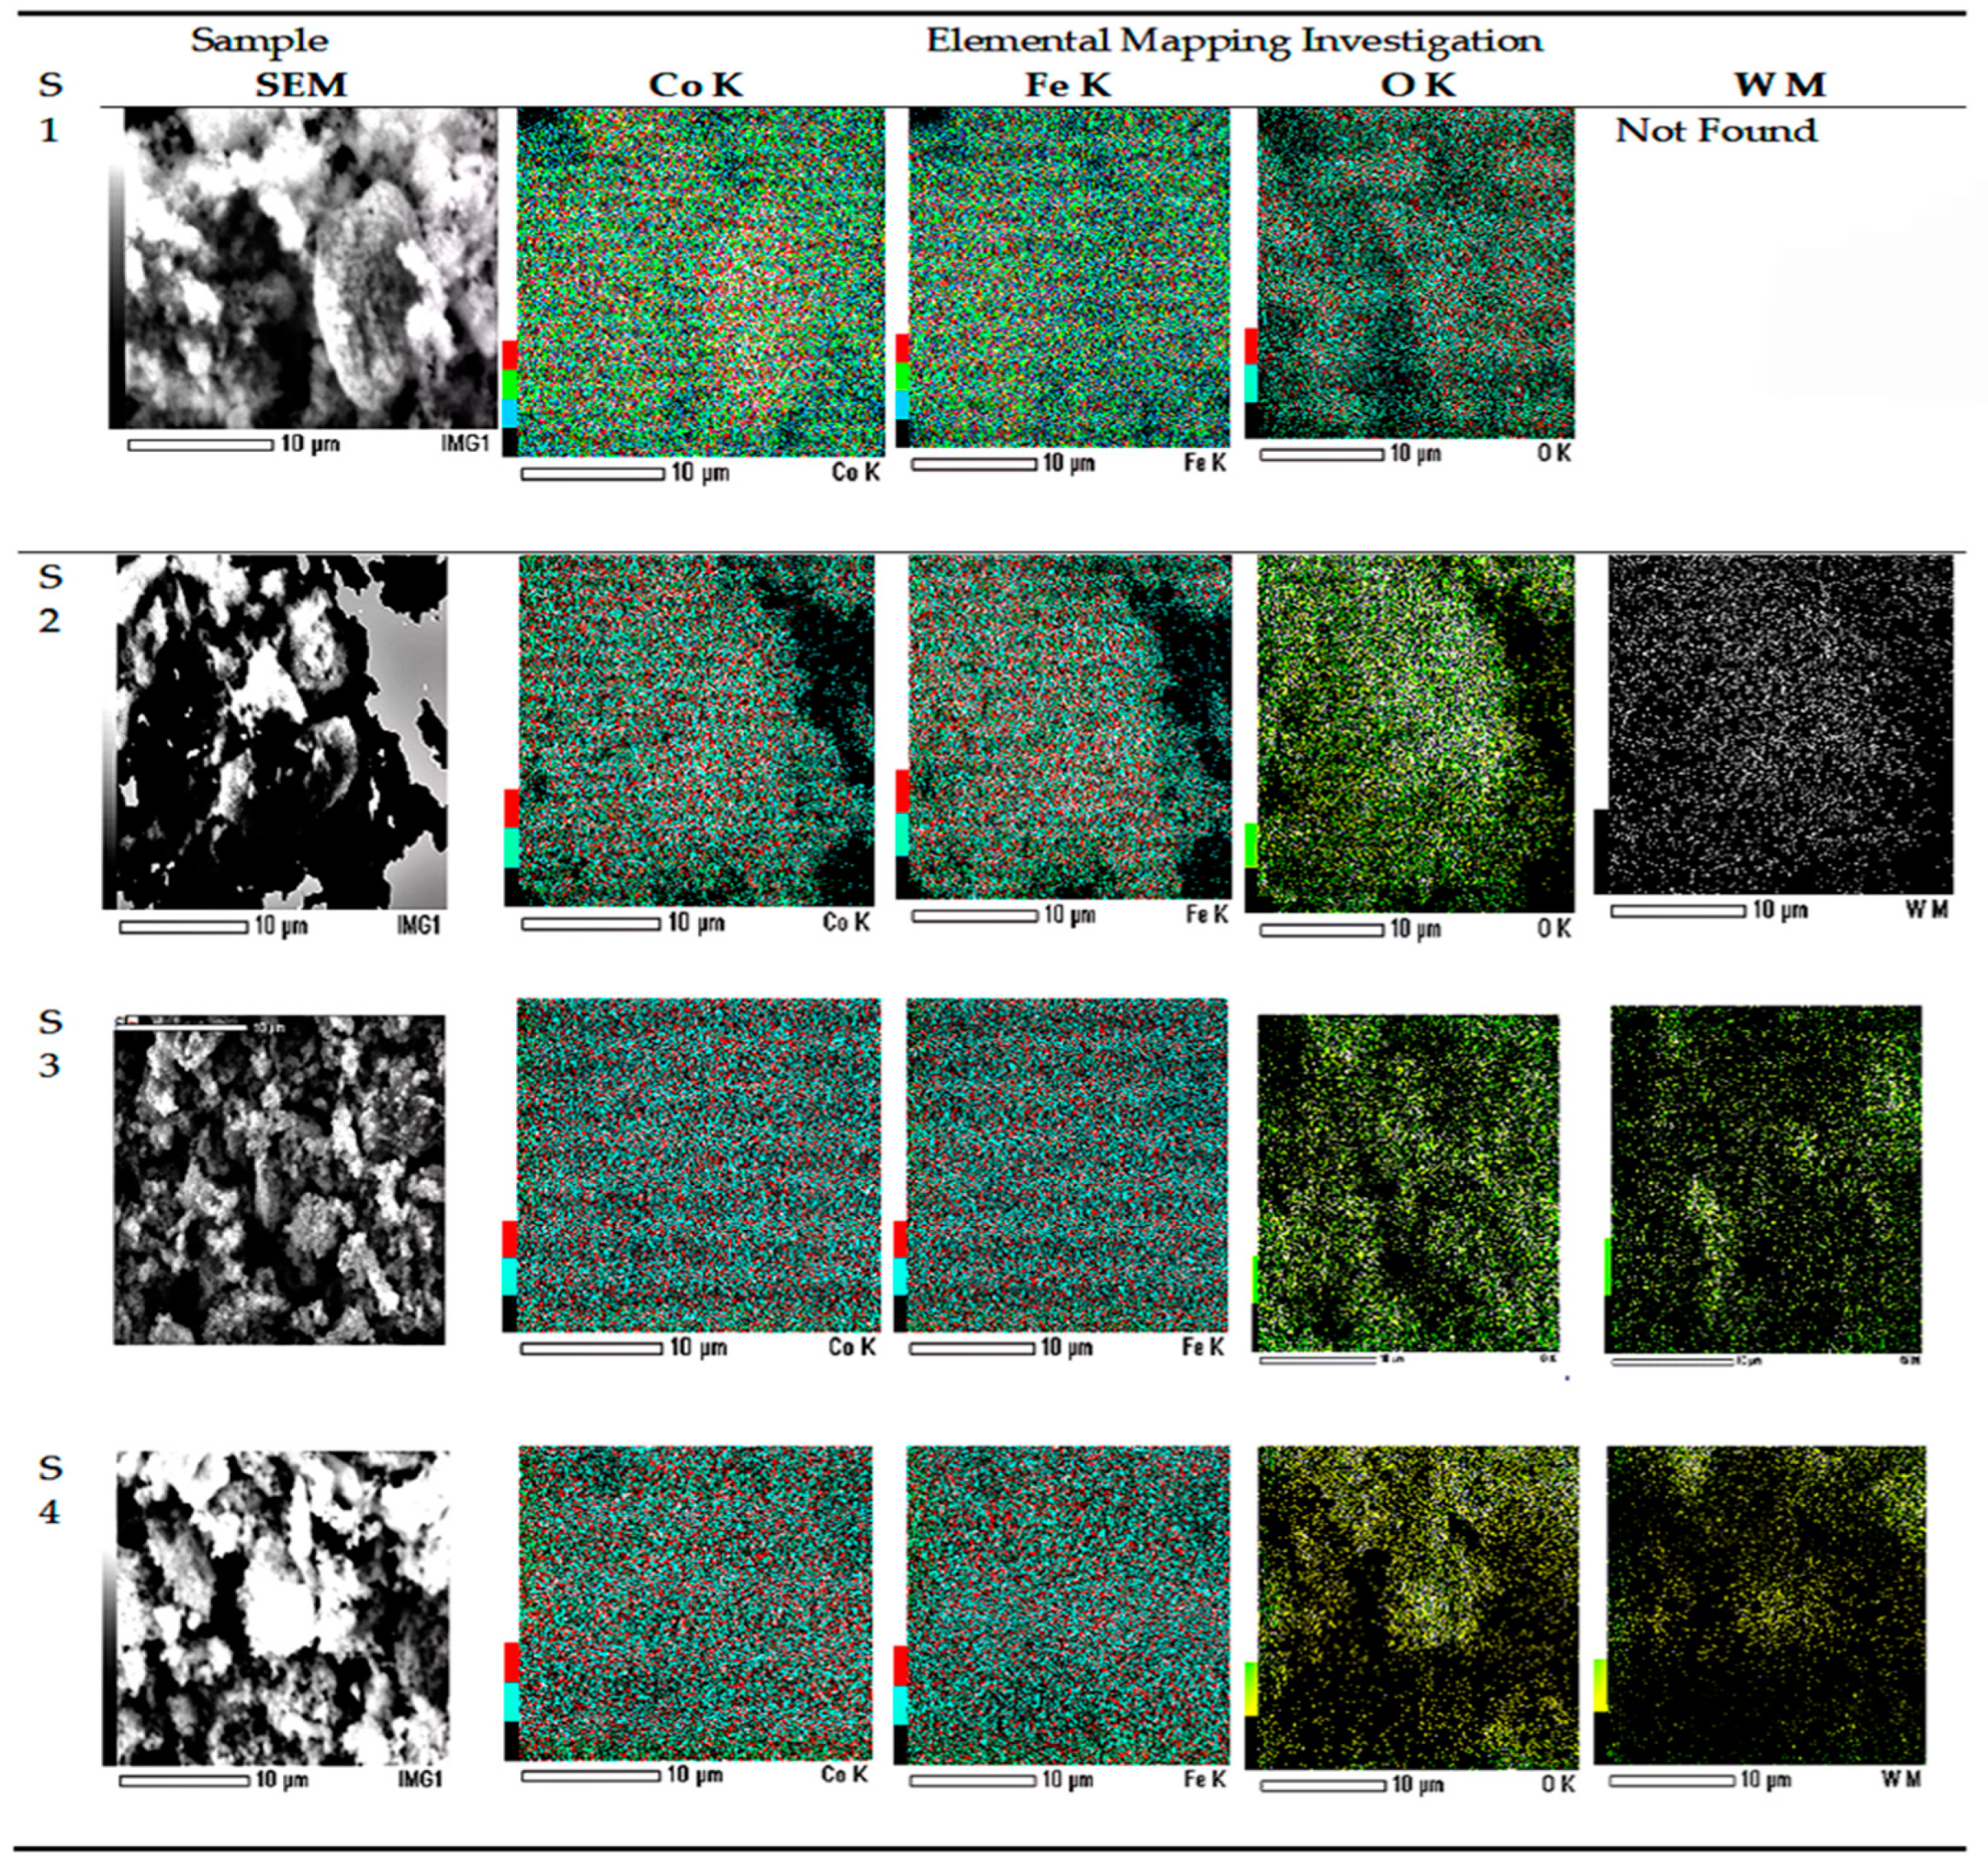
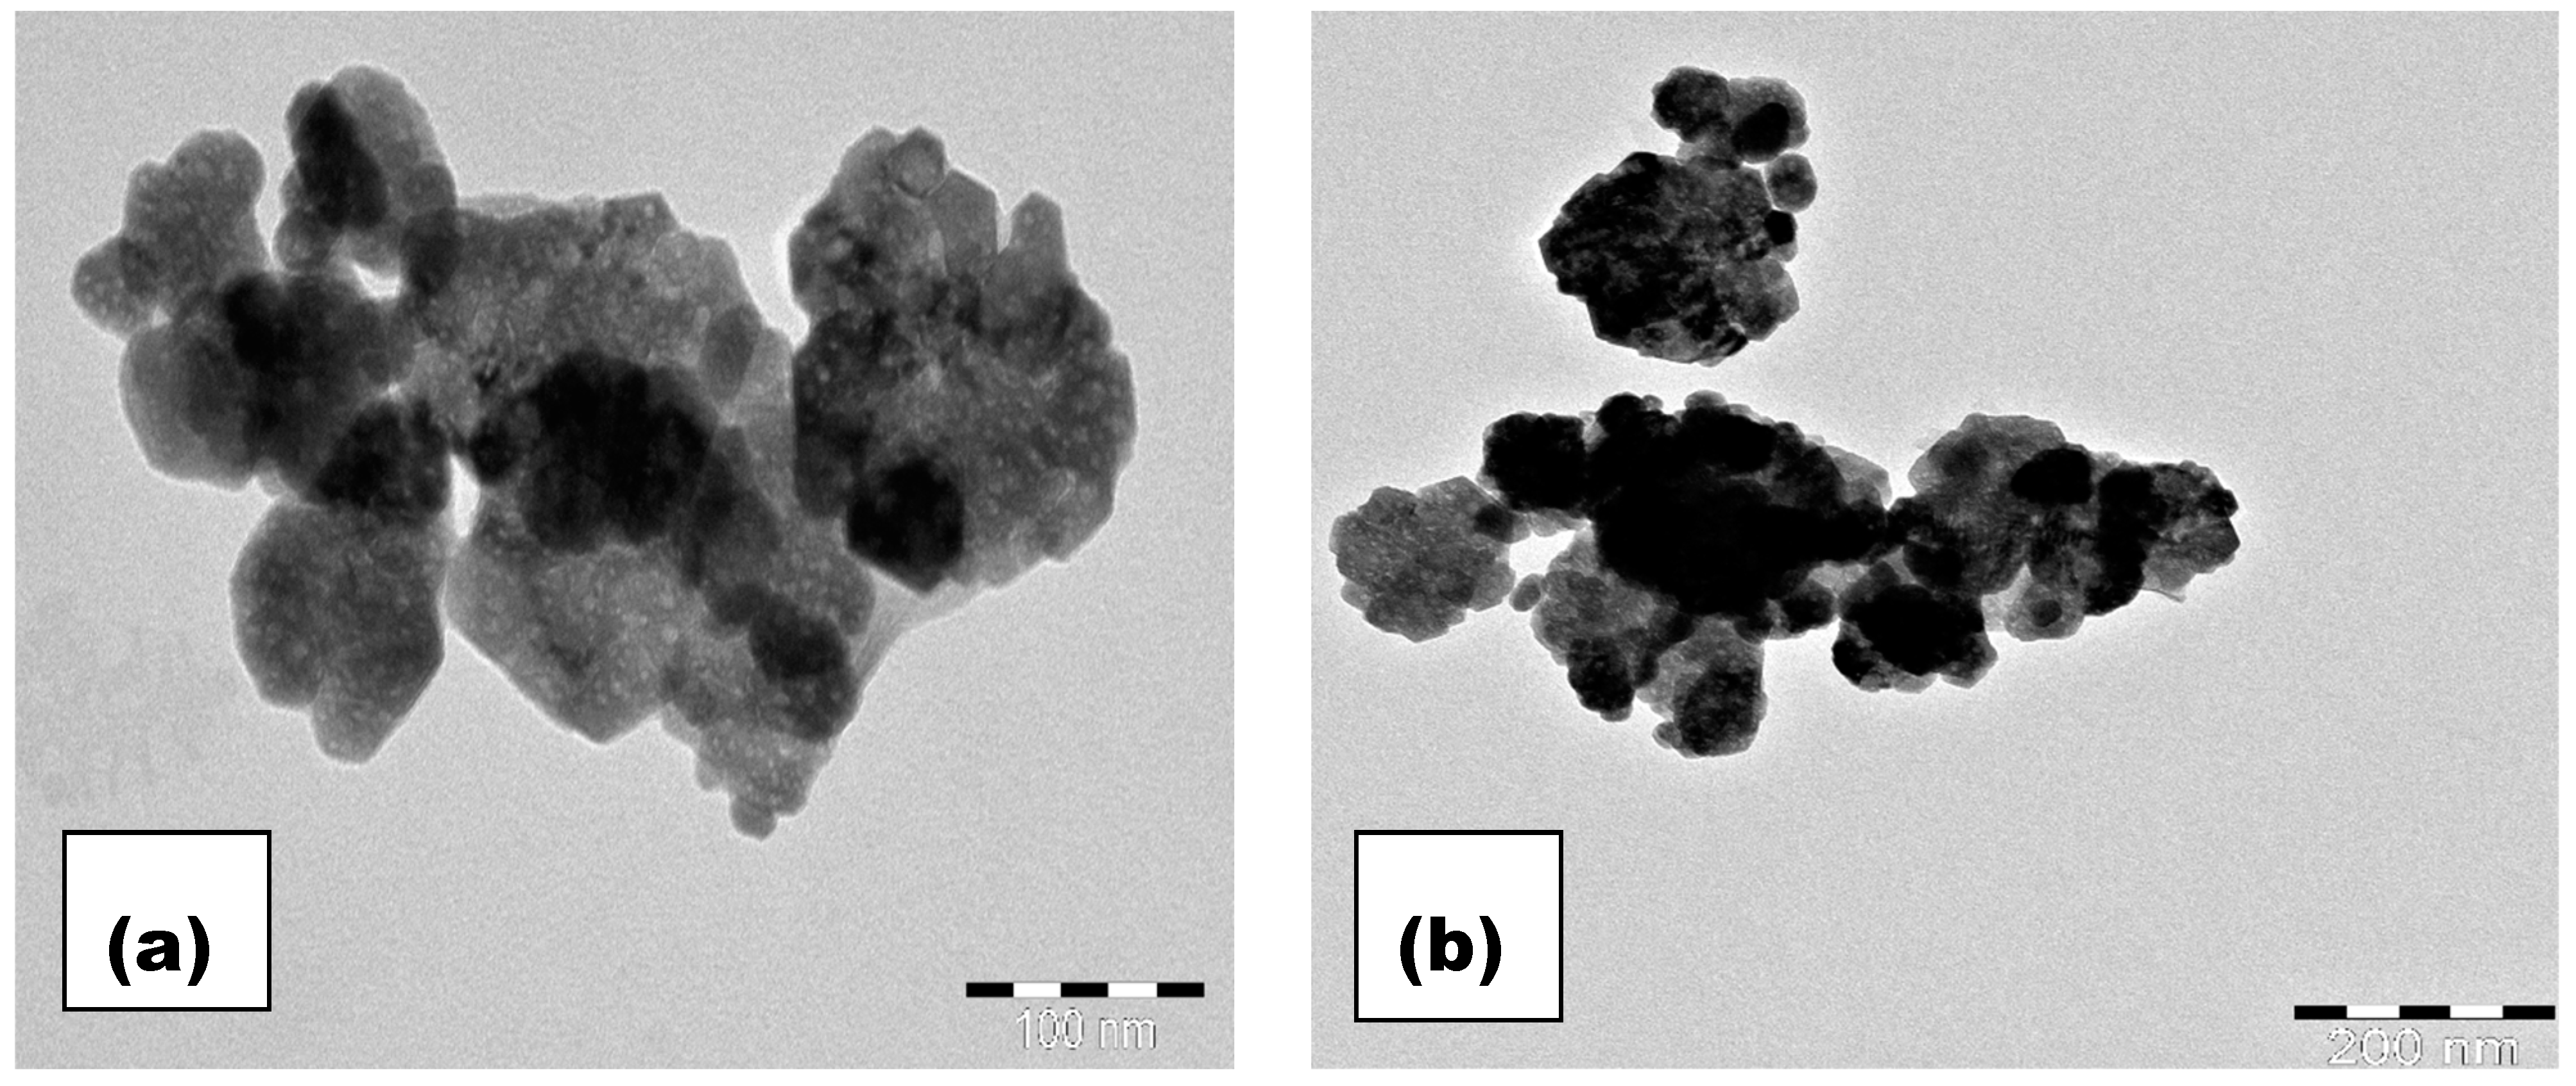
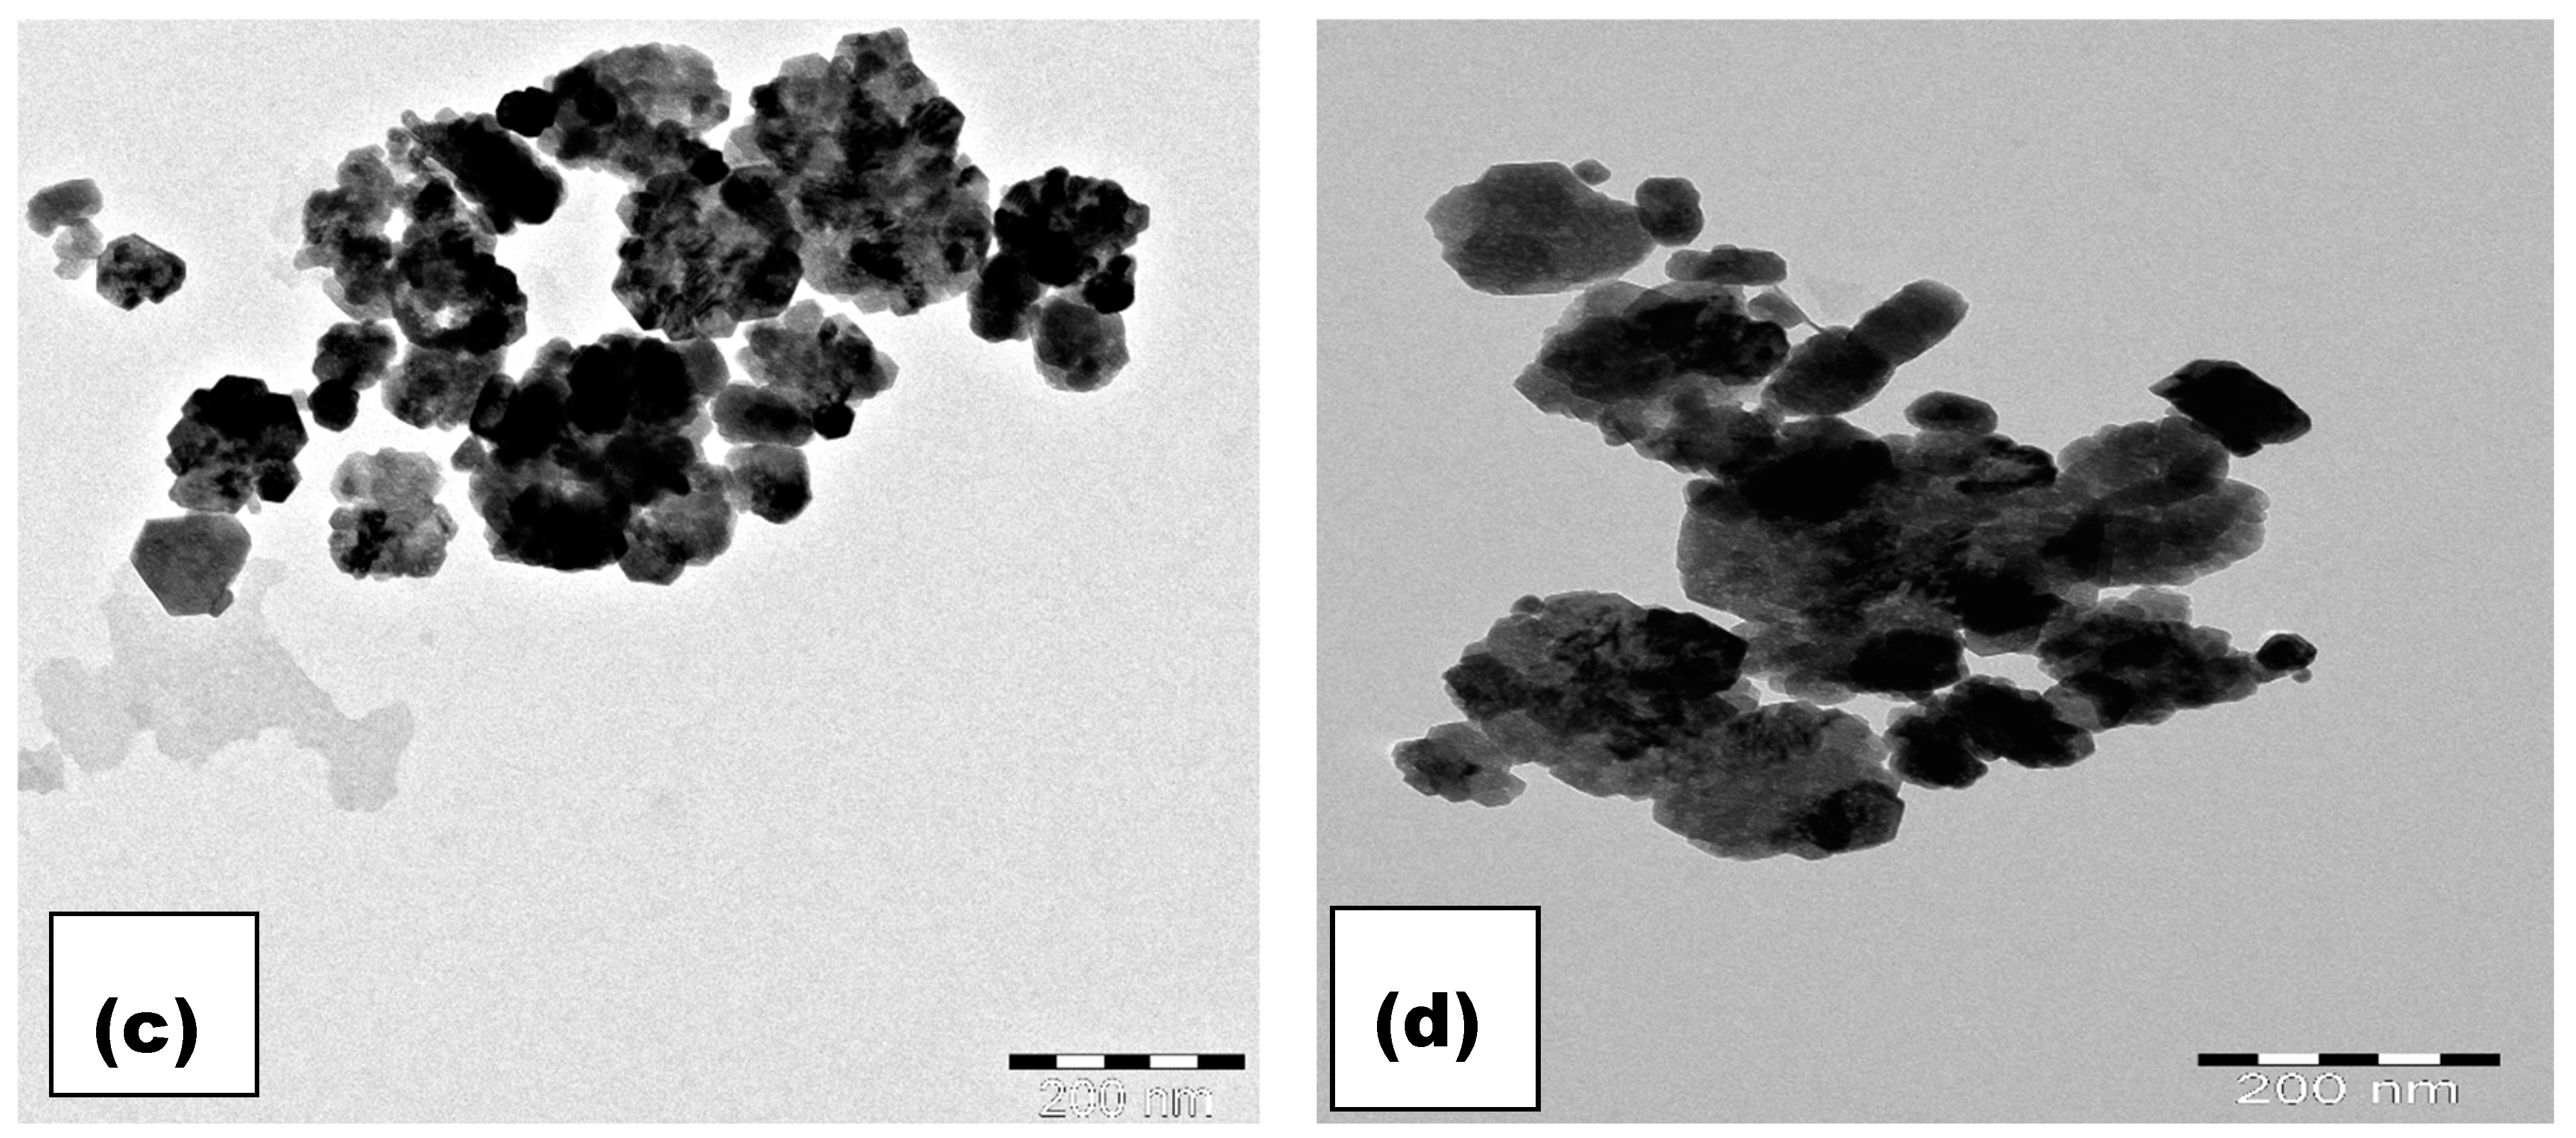
3.3. Microstructure Analysis

The microstructure and the surface morphology of CoFe2O4 and W-substituted CoFe2O4 powders were explored by SEM. The SEM digital photo images of all samples are shown in Figure 4a,b and Figure 5a,b. The scanning electron microscopy images and the EDAX mapping were performed for the analysis of the surface morphology and the elemental content of as-synthesized CoFe2O4 and W-substituted CoFe2O4 nanoparticles, respectively. Figure 4a,b demonstrates that the nanoparticles are in a homogenous agglomeration with non-uniform size distribution. Normally, the observed agglomeration appeared due to magnetic behavior and a van der Waals dipole–dipole interaction between particles [33]. Figure 4a reveals the SEM image of as-synthesized pure CoFe2O4 and demonstrates the agglomerated nanoparticle’s type of morphology. Figure 4b shows the SEM image of the 0.05 W-CoFe2O4 nanoparticle where, due to the low concentration, fewer tungstate nanoparticles are incorporated with the CoFe2O4. Noticeably, a smaller size of nanoparticle in the 0.15 W-CoFe2O4 was found as compared with the pristine CoFe2O4 nanoparticles in Figure 5b.
The composition of W-CoFe2O4 nanoparticles is investigated using the energy dispersive spectroscopy (EDAX) analysis as shown in Figure 4c,d and Figure 5c,d. The EDAX spectra confirm the existence of O, Fe, Co, and W elements in the pristine CoFe2O4 and the presence of tungstate in W-substituted CoFe2O4 nanoparticles as shown in Figure 6. The TEM images as shown in Figure 7a–d demonstrate the formation of nanoparticles with an agglomeration type of interconnected morphology and small nanoparticles are interlocked with large nanoparticles because of their magnetic nature.

3.4. Surface and Pore Size Distribution Analysis

The N2 adsorption–desorption analysis of as-synthesized CoFe2O4 and W-substituted CoFe2O4 nanoparticles were attempted to observe the surface area and the type of porosity present (Figure 8a,b). The nature of the isotherms for all nanoparticles was in accordance with the type II with a H3 hysteresis loop. The adsorption study confirmed a high specific surface area of each isotherm documented 5.100, 4.952, 2.109, 2.658 m2 g−1 calculated via multipoint BET equation in a P/P0 range of 0.05–1.0, respectively as shown as in Table 3. The obtained pore size distribution calculated via the Barrett–Joyner–Halenda (BJH) method demonstrated the mesoporous nature of 18.28, 17.19, 37.33, 24.29 nm CoFe2O4 and the W-substituted CoFe2O4 nanoparticles.

3.5. XPS Analysis

The chemical state of as-synthesized CoFe2O4 and W-substituted CoFe2O4 nanoparticles were investigated by using XPS analysis. The survey spectra of these samples took place in the wide binding energy in the range of 200–900 eV and they are denoted in Figure 9a–e. The binding energy spectra of as-synthesized CoFe2O4 and W-substituted CoFe2O4 nanoparticles were calibrated by C1s peak as a reference (~286 eV) [34]. The XPS spectra shown in Figure 9a displayed two spin–orbit doublet peaks of Co2p. The average binding energy of Co2p1/2 for both CoFe2O4 and W-substituted CoFe2O4 nanoparticles was approximately 795.4 eV, while that of Co2p3/2 was approximately 780.2 eV and double satellite peaks confirmed the oxidation state of Co as Co in CoFe2O4 and W-substituted CoFe2O4 nanoparticles [35]. Figure 9b demonstrates that the average binding energy values of two XPS peaks originating at 711.2 and 723.9 eV could be demonstrating the presence of Fe 2p3/2 and Fe 2p1/2 doublets [36]. The present result in this study for Co and Fe have confirmed the Co (II) and the Fe(III) oxidation state as reported by other researchers and as shown in Figure 9c. The slight difference observed in the binding energy spectra of all four samples of CoFe2O4 and W-substituted CoFe2O4 nanoparticles is most likely due to the change in their chemical structure caused by the presence of “W”. The XPS spectra of W-substituted CoFe2O4 nanoparticles demonstrated two 4f7/2 (35.7 eV) and 4f5/2 (37.6 eV) peaks, corresponding to a dual state of tungsten and corroborated in a wide XPS scan Figure 9d [37]. As depicted in Figure 9e, the XPS explains the origin of oxygen vacancies and the main peak at the high resolution O1s peak having binding energies of 530.3 eV, respectively [38]. The XPS analytical results shown above are consistent with XRD for CoFe2O4 and W-substituted CoFe2O4 nanoparticles, confirming the formation of pure CoFe2O4 and W-substituted CoFe2O4 structures free from any type of impurities and a mixed phase.

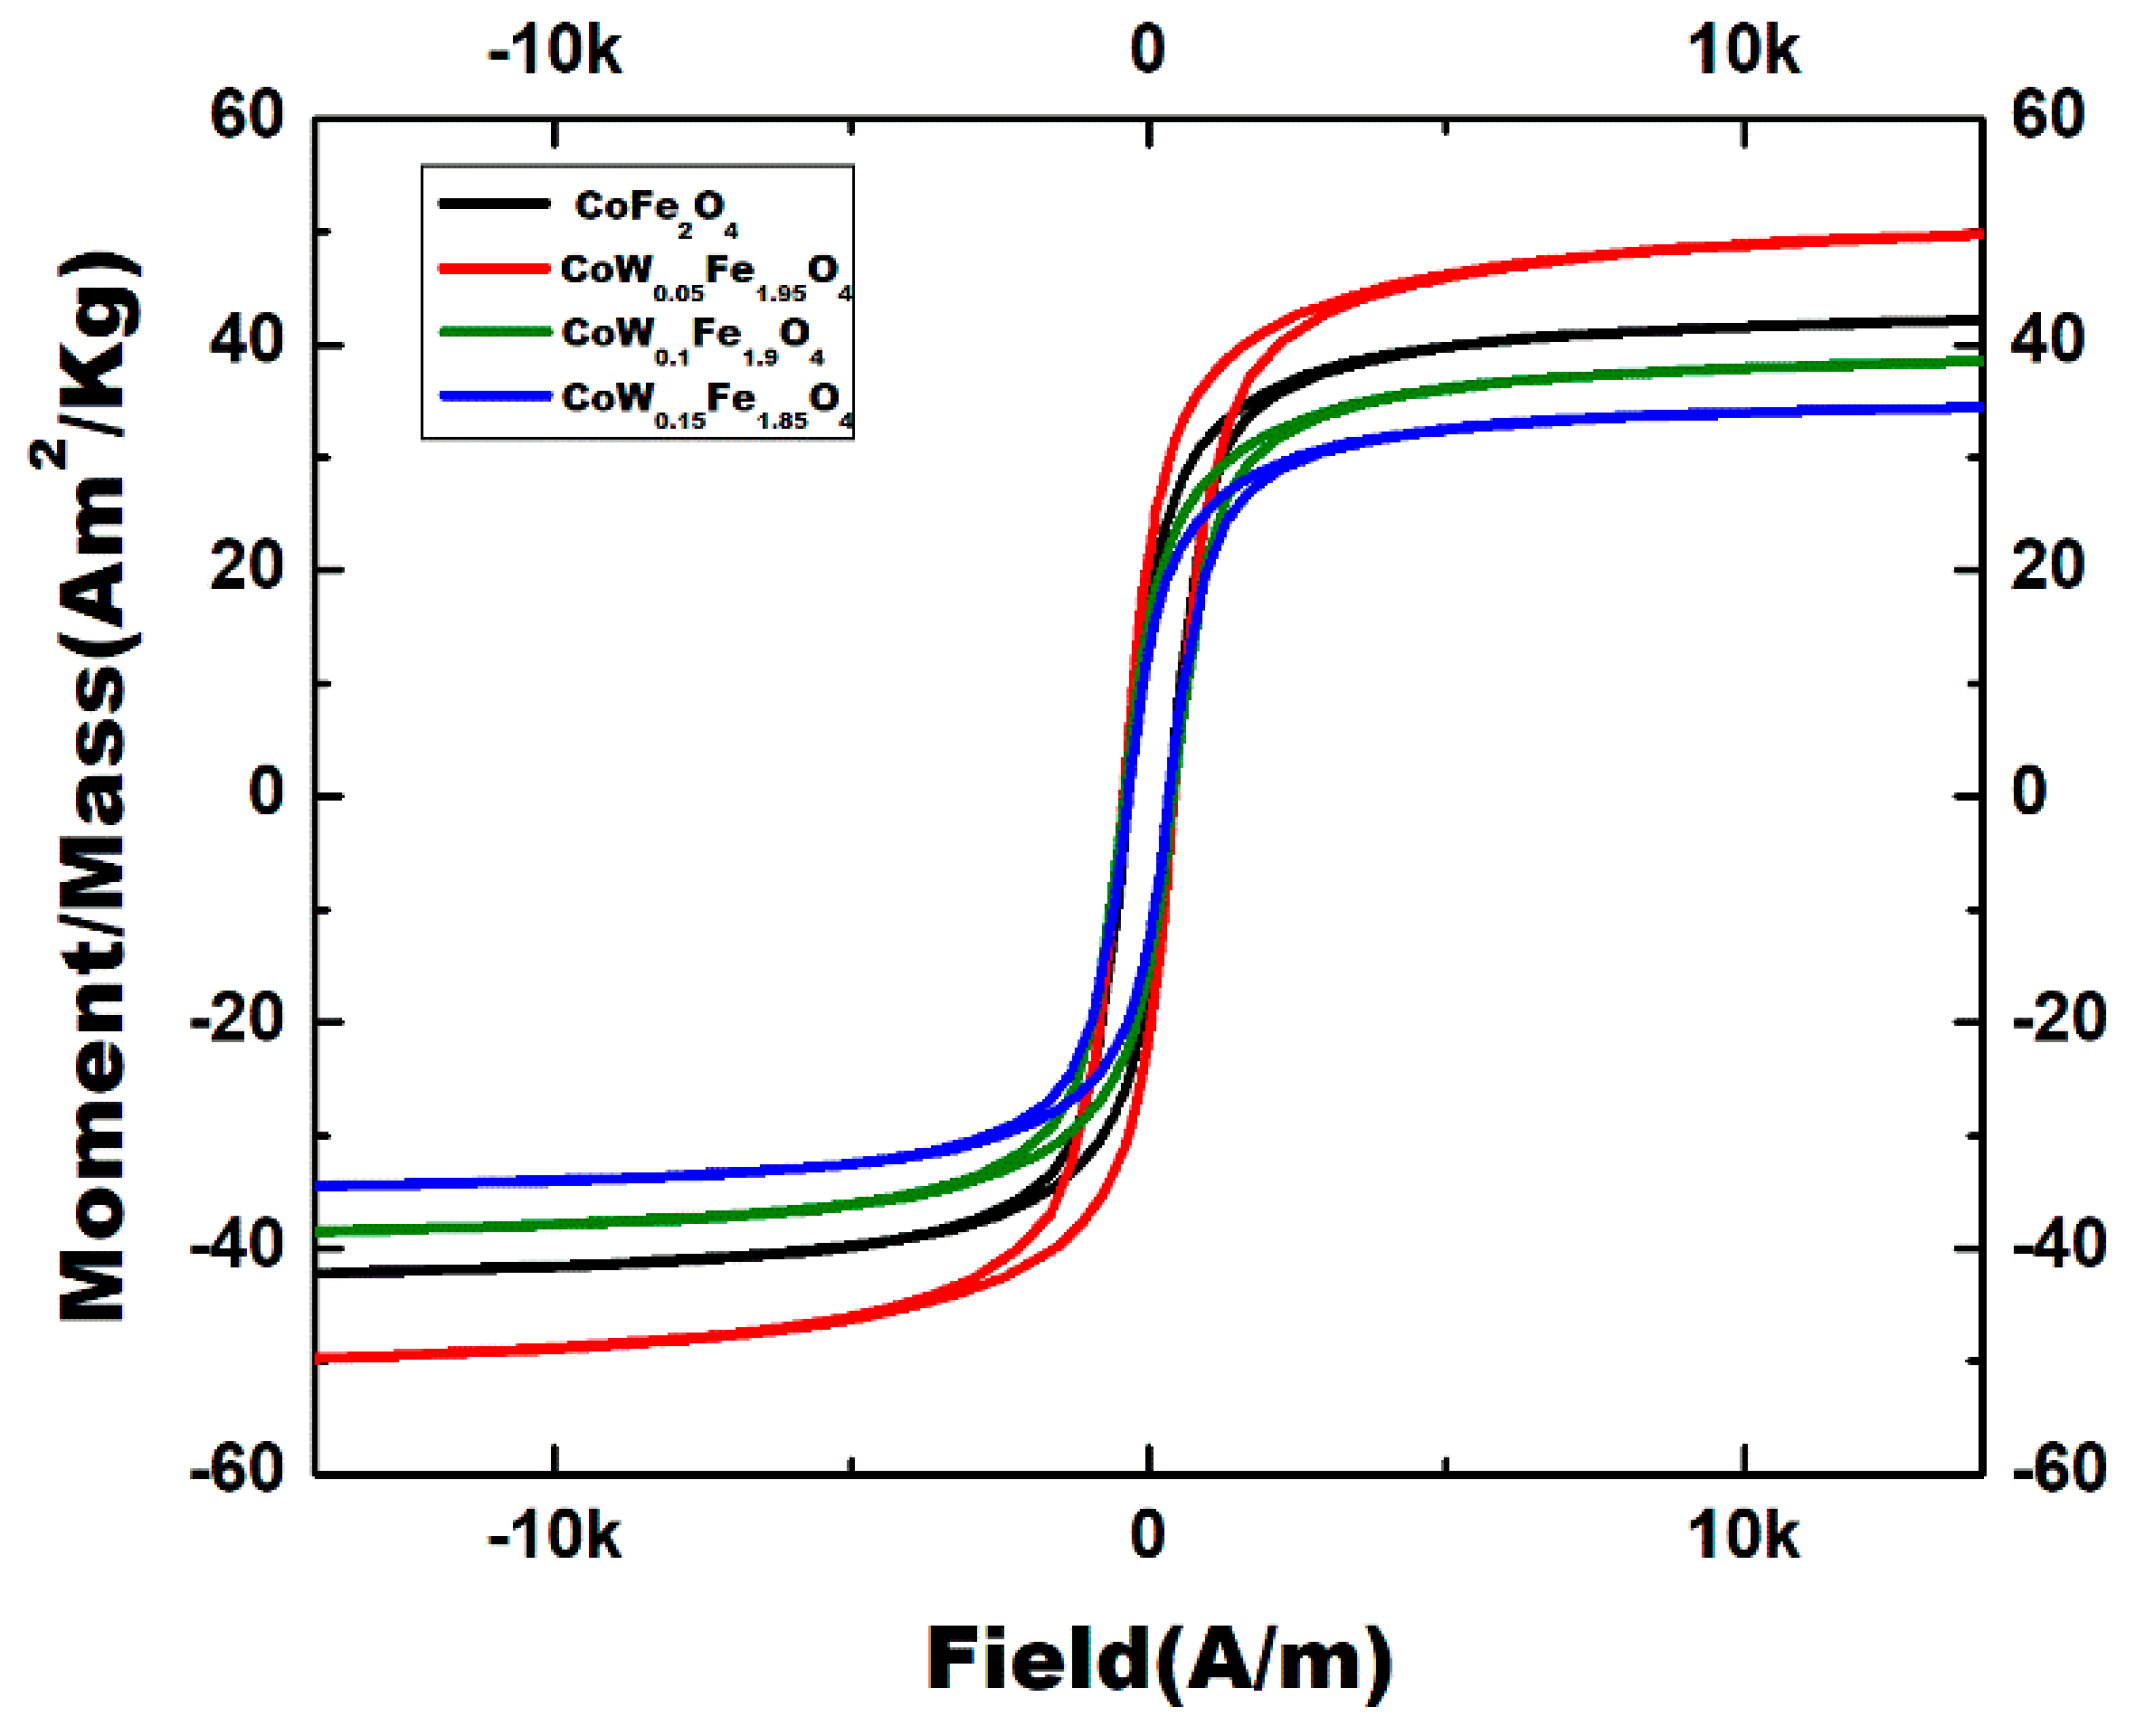
3.6. Magnetic Properties
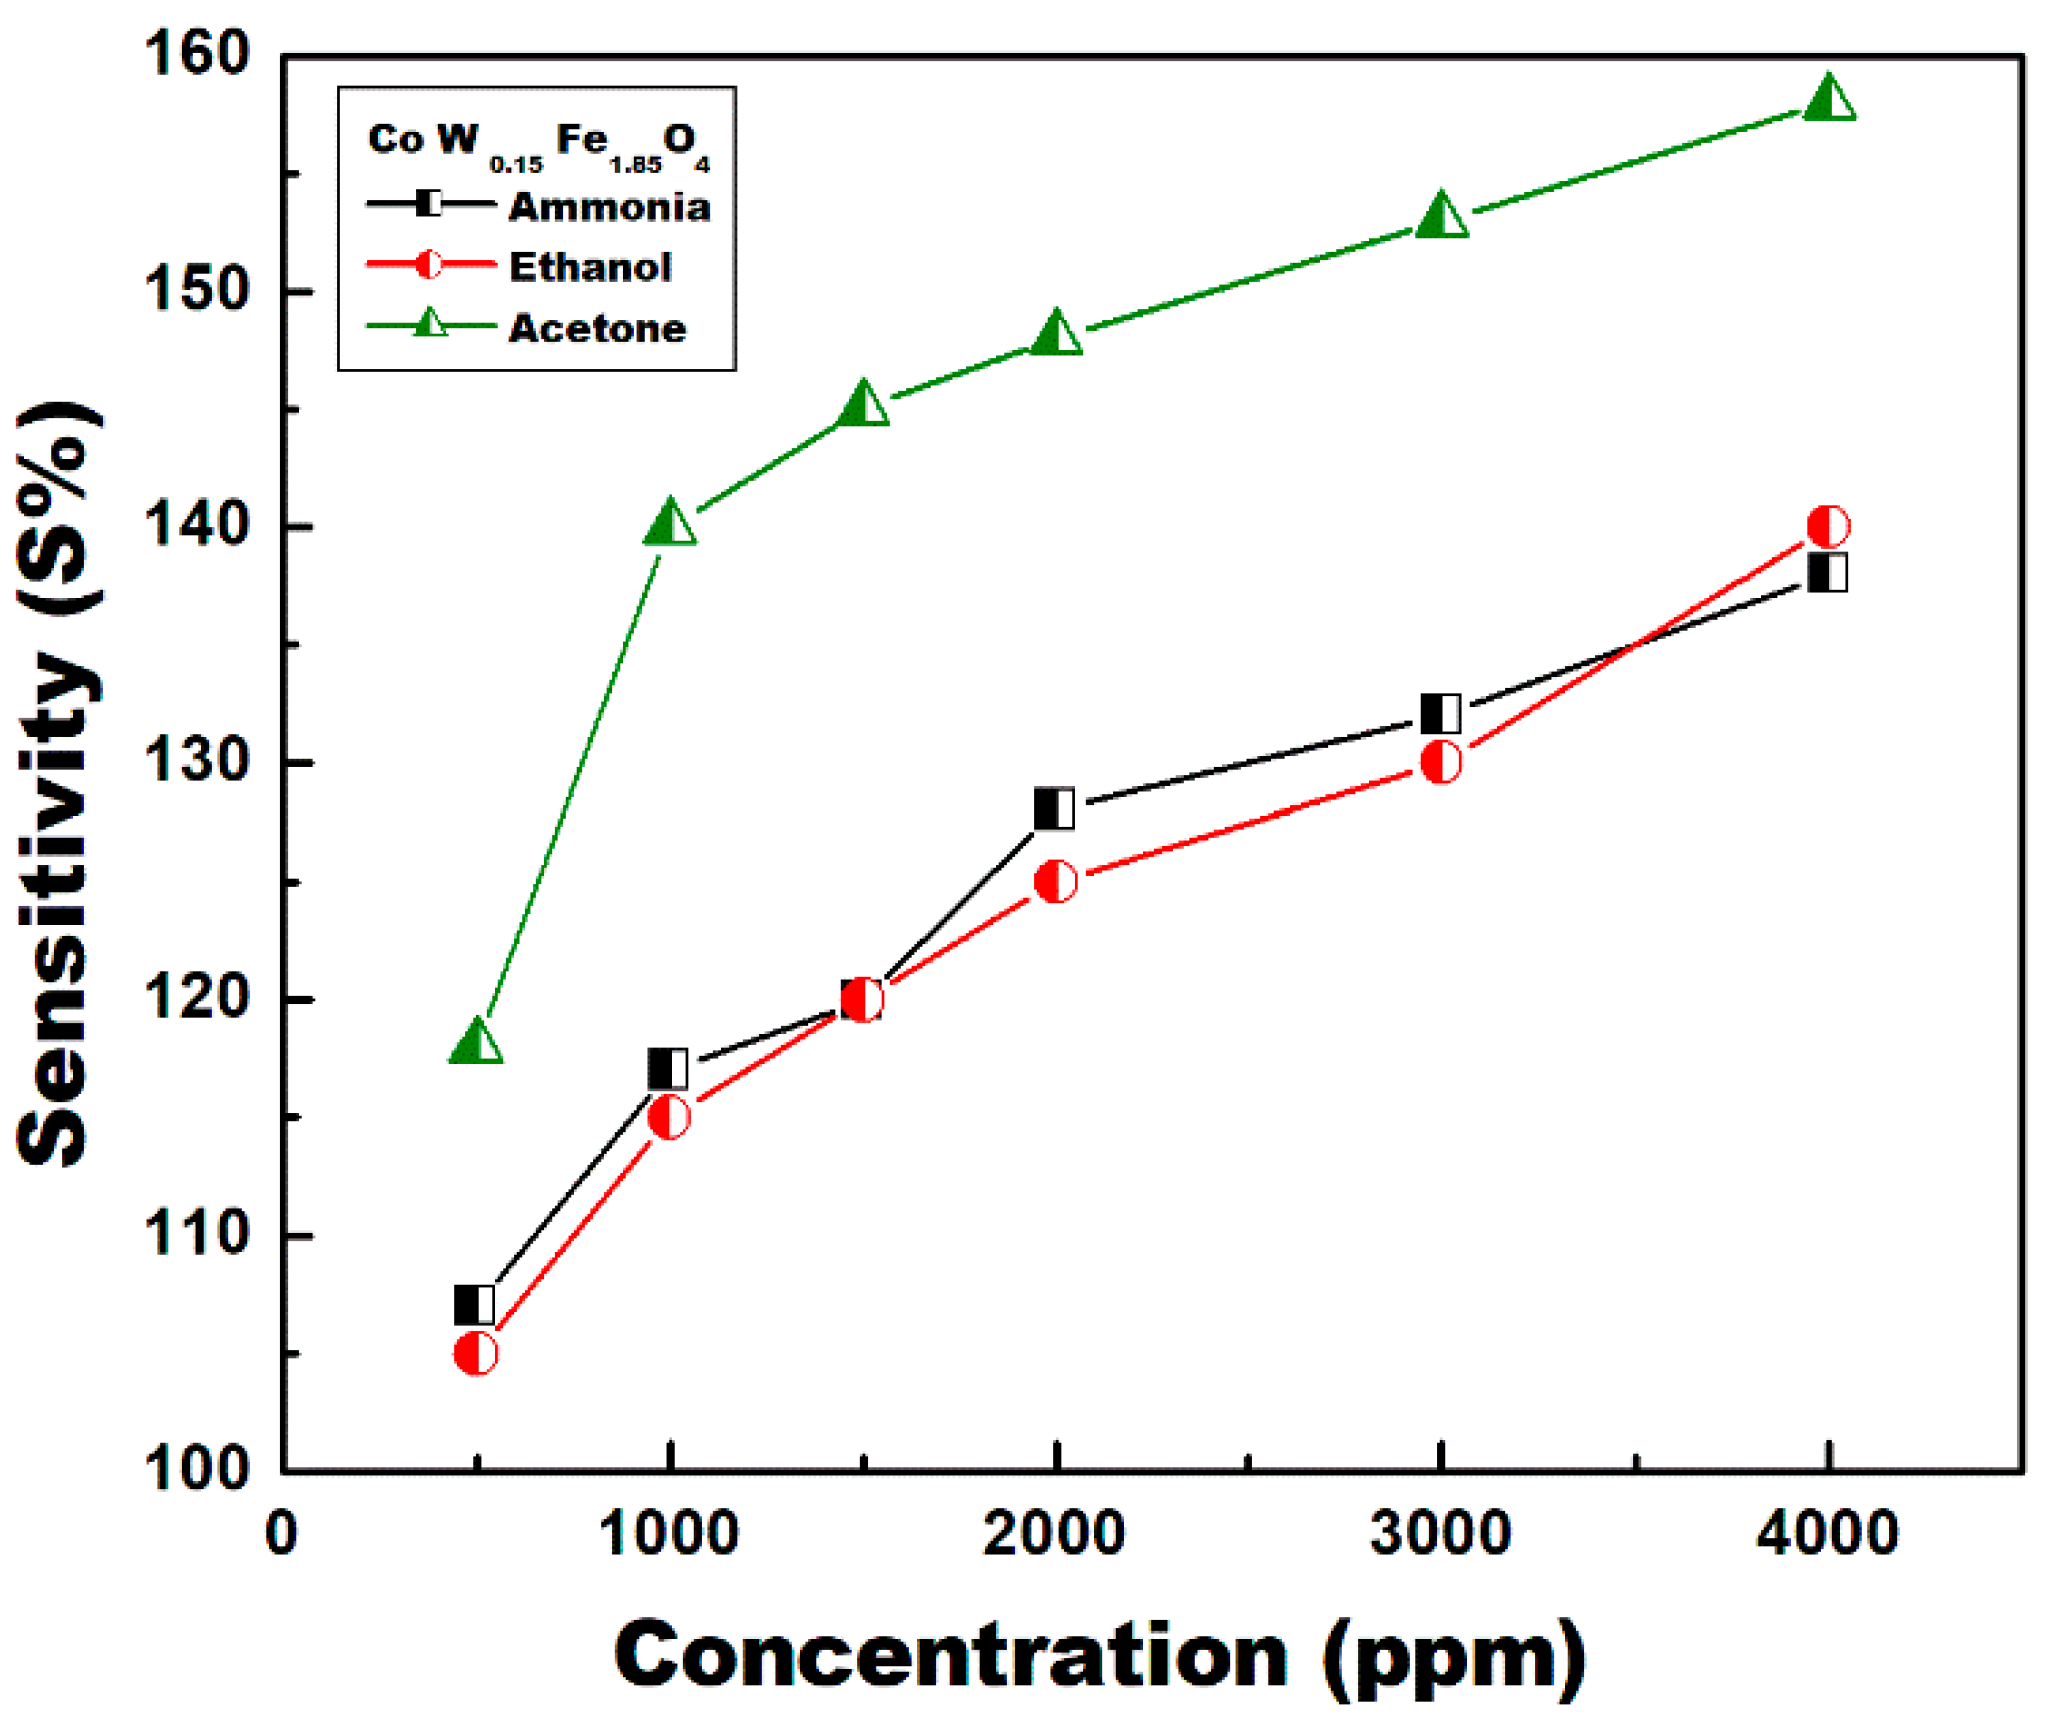
The magnetization curves (M-H) measured at room temperature for CoFe2O4 nanoparticles with a different level of W-doping are shown in Figure 10. Table 4 summarizes the magnetic parameters. At ambient temperature, all nanocrystals have an S-like shape with nonzero coercivity (Hci) and remnant magnetization (Mr), indicating that they are ferromagnetic. All powders display a hysteresis loop of hard magnetic material with coercivities close to those previously published for CoFe2O4 [16]. Generally, the current pure CoFe2O4 prepared using a sol-gel method have a low saturation magnetization (Ms = 42.48 Am2/kg) with respect to those prepared at high sintering temperatures (Ms = 56 Am2/kg) [39] or by a hydrothermal method [16].The changes in the hysteresis loops of the CoFe2O4 powders produced with different W-doping can be credited mainly to the change in the ionic occupancy due to the W(VI) substitution for Fe(III) ions at the octahedral (B) sites. Since CoFe2O4 has a spinel structure, its magnetic moment results from the difference in the total magnetic moments of the ions at the B-sites and those at the A-sites (µ = µB-site-µA-site). Furthermore, Fe(III) ions are partially allocated between sites A and B. The net magnetization is the difference between magnetic moments of A and B sublattice magnetization, so the saturation magnetization depends on the cationic distributions. The XRD analysis indicated that W(VI) replaces the B-site, so the magnetic Fe(III) ions at the B-sites are lower than those at the A-Sites. The saturation magnetization (Ms) increases with W-doping up to x = 0.05 (Ms = 50.15 Am2/kg). However, with x = 0.1 and x = 0.15, the Ms dramatically decreases to 38.72 and 34.67 Am2/kg, respectively. This behavior is illustrated in Figure 11.

3.7. Gas Sensing

Gas sensors fabricated from different W-doped nanoparticles were exposed to 2000 ppm acetone, ethanol, and ammonia in a fixed atmosphere. The response of each sensor was recorded at different operating temperatures from 200 °C to 450 °C. Resistance was recorded before and after exposure to the test gas. The response of each sensor at different temperatures was calculated as shown in Figure 12a–d. Generally, all sensors showed the highest response and sensitivity for acetone. For sensors made from pristine CoFe2O4, the optimum sensing temperature was 350 °C for all test gases (Figure 12a). As the W-doping increased, the optimum sensing temperature shifted to lower values. Sensors fabricated from CoFe2O4/0.5%W sample showed an optimum sensing temperature of 300 °C for ethanol and of 250 °C for acetone and ammonia. Sensors fabricated from CoFe2O4/1.0%W and CoFe2O4/1.5%W samples showed an optimum sensing temperature of 200 °C for all tested gases. It is clear that increasing W-doping increases the defect because W(VI) with highly valent substitutions for two Fe/(III) ions is left at the vacant sites. The vacancy and the defects increase sensitivity due to the increase in gas adsorption on the sensing surfaces. Sutka and Doebelin [40] showed that gas response and sensitivity increases with increasing non-stoichiometry and defects in ZnFe2O4.
Figure 13 shows the sensor response of sample CoFe2O4/1.5%W at different gas concentrations (ppm) at the optimum operating temperature of 200 °C. The sensor responses increase by increasing the gas concentrations in a semi linear mode. The response for acetone is higher than those of ethanol and ammonia.

4. Conclusions

The CoFe2O4 spinel with W-doping (x = 0, 0.05, 0.1 and 0.15) was synthesized by a sol-gel technique. The purity of all produced ferrite powders was confirmed by XRD and TEM, and the addition of tungsten up to x = 0.15 did not lead to the formation of a second phase. Variations in the saturation magnetization (Ms) and the lattice dimension with W(VI) substitution were associated with the change in the distribution of Fe(III) ions between tetrahedral and octahedral sites. Introducing W(VI) ions in the spinel lattice induced a rearrangement of Fe(III) ions. W-doping in ferrites leads to the creation of vacancies because the W(VI) ion replaces two Fe(III) ions in the ferrite lattice. However, W(VI) occupies one of the position, leaving the other empty. The total saturation magnetization (Ms) increases with W-substitution up to x = 0.05 from 42 to 50 emu/g. However, the lattice parameter increases, and the total magnetic moment decreases to 34.6 emu/g with x = 0.15 doping. The W-doping content has a significant impact on the gas response, selectivity, and optimum working temperature of the sensor. The pure CoFe2O4 sensor has an optimum working temperature of 350 °C. However, following W inclusion, the sensitivity to acetone increases and the working temperature reduces to 200 °C at a doping level with x = 0.15. When compared to the parent CoFe2O4, the 1.5 percent W doped CoFe2O4 material demonstrated good responsiveness and selectivity toward acetone vapors.

Author Contributions

Methodology set up: N.Y.M., O.A.-E., as well as A.M.A.-E.; technique, S.F.S., M.U. and O.A.-E.; program, O.A.-E.; validation, N.Y.M., O.A.-E., as well as A.M.A.-E.; formal analysis, N.Y.M., O.A.-E., as well as A.M.A.-E.; systematic evaluation, N.Y.M. and O.A.-E.; inquiry, N.Y.M.; resources, N.Y.M., A.M.A.-E. and O.A.-E.; curation of results, S.F.S., M.U. and M.O.A.; writing—original preparation of the draft, N.Y.M. and O.A.-E.; writing—review and editing, N.Y.M. and O.A.-E.; visualization, N.Y.M. and O.A.-E.; supervision, N.Y.M. and O.A.-E.; project management A.M.A.-E. and O.A.-E.; procurement of financing, O.A.-E. All authors have read and agreed to the published version of the manuscript.

Funding

This Project was funded by the National Plan for Science, Technology and Innovation (MAARIFAH), King Abdulaziz City for Science and Technology, Kingdom of Saudi Arabia, Award Number (13-ADV 1478-02).

Institutional Review Board Statement

Not applicable.

Informed Consent Statement

Not applicable.

Data Availability Statement

The data presented in this study are available on request from the corresponding author.

Acknowledgments

The authors would like to extend their sincere appreciation to the National Plan for Science, Technology and Innovation (MAARIFAH), King Abdulaziz City for Science and Technology, Kingdom of Saudi Arabia, Award Number (13-ADV 1478-02).

Conflicts of Interest

The authors declare no conflict of interest.

References

  1. Sheoran, N.; Kumar, A.; Kumar, K.; Banerjee, A. Structural, Optical, and Multiferroic Properties of Yttrium (Y3+)-Substituted BiFeO3 Nanostructures. J. Supercond. Nov. Magn. 2020, 33, 2017–2029. [Google Scholar] [CrossRef]
  2. Ranga, R.; Kumar, A.; Kumari, P.; Singh, P.; Madaan, V.; Kumar, K. Ferrite application as an electrochemical sensor: A review. Mater. Charact. 2021, 178, 111269. [Google Scholar] [CrossRef]
  3. Nemufulwi, M.I.; Swart, H.C.; Mhlongo, G.H. Enhanced Propanol Response Behavior of ZnFe2O4 NP-Based Active Sensing Layer Induced by Film Thickness Optimization. Processes 2021, 9, 1791. [Google Scholar] [CrossRef]
  4. Xiangfeng, C.; Dongli, J.; Yu, G.; Chenmou, Z. Ethanol gas sensor based on CoFe2O4 nano-crystallines prepared by hydrothermal method. Sens. Actuators B Chem. 2006, 120, 177–181. [Google Scholar] [CrossRef]
  5. Madake, S.B.; Hattali, M.R.; Thorat, J.B.; Pedanekar, R.S.; Rajpure, K.Y. Chemiresistive gas sensing properties of copper substituted zinc ferrite thin films deposited by spray pyrolysis. J. Electron. Mater. 2021, 50, 2460–2465. [Google Scholar] [CrossRef]
  6. Hernandez, P.T.; Kuznetsov, M.V.; Morozov, Y.G. High-Temperature Synthesis of Nickel-Based Nanoparticles for Use as Materials in Sensors of Potentially Hazardous Gases. Int. J. Self-Propag. High-Temp. Synth. 2019, 28, 159–172. [Google Scholar] [CrossRef]
  7. Matatagui, D.; Bahos, F.A.; Gràcia, I.; Horrillo, M.D.C. Portable Low-Cost Electronic Nose Based on Surface Acoustic Wave Sensors for the Detection of BTX Vapors in Air. Sensors 2019, 19, 5406. [Google Scholar] [CrossRef] [Green Version]
  8. Kumar, E.R.; Srinivas, C.; Seehra, M.S.; Deepty, M.; Pradeep, I.; Kamzin, A.S. Particle size dependence of the magnetic, dielectric and gas sensing properties of Co substituted NiFe2O4 nanoparticles. Sens. Actuator A Phys. 2018, 279, 10–16. [Google Scholar] [CrossRef]
  9. El-Shobaky, G.A.; Turky, A.M.; Mostafa, N.Y.; Mohamed, S.K. Effect of preparation conditions on physicochemical, surface and catalytic properties of cobalt ferrite prepared by coprecipitation. J. Alloys Compd. 2010, 493, 415–422. [Google Scholar] [CrossRef]
  10. Aljuraide, N.I.; Mousa, M.A.A.; Mostafa, N.Y.; El-Shobaky, G.A.; Hamdeh, H.H. Microstructure analysis of zinc ferrite nanoparticles by means of X-ray powder diffraction and Mössbauer spectroscopy. Int. J. Nanopart. 2012, 5, 56–63. [Google Scholar] [CrossRef]
  11. Mostafa, N.Y.; Hessien, M.M.; Shaltout, A.A. Hydrothermal synthesis and characterizations of Ti substituted Mn-ferrites. J. Alloys Compd. 2012, 529, 29–33. [Google Scholar] [CrossRef]
  12. Hemeda, O.M.; Mostafa, N.Y.; Abd Elkader, O.H.; Ahmed, M.A. Solubility limits in Mn–Mg ferrites system under hydrothermal conditions. J. Magn. Magn. Mater. 2014, 364, 39–46. [Google Scholar] [CrossRef]
  13. Hemeda, O.M.; Mostafa, N.Y.; Abd Elkader, O.H.; Hemeda, A.; Tawfik, A. Electrical and morphological properties of magnetocaloric nano ZnNi ferrite. J. Magn. Magn. Mater. 2015, 394, 96–104. [Google Scholar] [CrossRef]
  14. Mostafa, N.Y.; Zaki, Z.; Hessien, M.M.; Shaltout, A.A.; Alsawat, M. Enhancing saturation magnetization of Mg ferrite nanoparticles for better magnetic recoverable photocatalyst. Appl. Phys. A 2018, 124, 12. [Google Scholar] [CrossRef]
  15. Shaltout, A.A.; Hassan, S.K.; Karydas, A.G.; Zaki, Z.I.; Mostafa, N.Y.; Kregsamer, P.; Wobrauschek, P.; Streli, C. Comparative elemental analysis of fine particulate matter (PM2.5) from industrial and residential areas in Greater Cairo-Egypt by means of a multi-secondary target energy. Spectrochim. Acta Part B At. Spectrosc. 2018, 145, 29–35. [Google Scholar] [CrossRef]
  16. Heiba, Z.K.; Mostafa, N.Y.; Abd-Elkader, O.H. Structural and magnetic properties correlated with cation distribution of Mo-substituted cobalt ferrite nanoparticles. J. Magn. Magn. Mater. 2014, 368, 246–251. [Google Scholar] [CrossRef]
  17. Mostafa, N.Y.; Zaki, Z.I.; Heiba, Z.K. Structural and magnetic properties of cadmium substituted manganese ferrites prepared by hydrothermal route. J. Magn. Magn. Mater. 2013, 329, 71–76. [Google Scholar] [CrossRef]
  18. Srinivasamurthy, K.M.; Manjunatha, K.; El-Denglawey, A.; Rajaramakrishna, R.; Kubrin, S.P.; Pasha, A.; Angadi, V.J. Evaluation of structural, dielectric and LPG gas sensing behavior of porous Ce3+-Sm3+ doped Cobalt nickel ferrite. Mater. Chem. Phys. 2022, 275, 125222. [Google Scholar] [CrossRef]
  19. Bartůněk, V.; Sedmidubský, D.; Huber, Š.; Švecová, M.; Ulbrich, P.; Jankovský, O. Synthesis and Properties of Nanosized Stoichiometric Cobalt Ferrite Spinel. Materials 2018, 11, 1241. [Google Scholar] [CrossRef] [Green Version]
  20. Heiba, Z.K.; Mohamed, M.B.; Mostafa, N.Y.; El-Naggar, A.M. Structural and optical properties of Cd1−xMnxFe2O4/PMMA nanocomposites. J. Inorg. Organomet. Polym. Mater. 2020, 30, 1898–1906. [Google Scholar] [CrossRef]
  21. Dessai, G.P.P.; Singh, A.K.; Verenkar, V.M.S. Mn doped Ni-Zn ferrite thick film as a highly selective and sensitive gas sensor for Cl2 gas with quick response and recovery time. Mater. Res. Bull. 2022, 149, 111699. [Google Scholar] [CrossRef]
  22. Liu, Y.; Dong, X.; Chen, P. ChemInform Abstract: Biological and Chemical Sensors Based on Graphene Material. Chem. Soc. 2011, 41, 2283–2307. [Google Scholar] [CrossRef] [PubMed]
  23. Liu, Z.; Zhao, Z.G.; Miyauchi, M. Efficient Visible Light Active CaFe2O4/WO3 Based Composite Photocatalysts: Effect of Interfacial Modification. J. Phys. Chem. C 2009, 113, 17132–17137. [Google Scholar]
  24. Zou, Y.; Wang, H.; Yang, R.; Lai, X.; Wan, J.; Lin, G.; Liu, D. Controlled synthesis and enhanced toluene-sensing properties of mesoporous NixCo1−xFe2O4 nanostructured microspheres with tunable composite. Sens. Actuators B Chem. 2019, 280, 227–234. [Google Scholar] [CrossRef]
  25. Patil, J.Y.; Nadargi, D.Y.; Mulla, I.S.; Suryavanshi, S.S. Cerium doped MgFe2O4 nanocomposites: Highly sensitive and fast response-recoverable acetone gas sensor. Heliyon 2019, 14, e01489. [Google Scholar] [CrossRef] [Green Version]
  26. Yadav, A.K.; Singh, R.K.; Singh, P. Fabrication of Lanthanum Ferrite Based Liquefied Petroleum Gas Sensor. Sens. Actuators B Chem. 2016, 229, 25–30. [Google Scholar] [CrossRef]
  27. Mostafa, N.Y.; Qhtani, M.M.; Alotaibi, S.H.; Zaki, Z.I.; Alharthi, S.; Cieslik, M.; Gornicka, K.; Ryl, J.; Boukherroub, R.; Amin, M.A. Cathodic activation of synthesized highly defective monoclinic hydroxyl-functionalized ZrO2 nanoparticles for efficient electrochemical production of hydrogen in alkaline media. Int. J. Energy Res. 2020, 44, 10695–10709. [Google Scholar] [CrossRef]
  28. Pawar, R.A.; Patange, S.M.; Shitre, A.R.; Gore, S.K.; Jadhavd, S.S.; Shirsath, S.E. Crystal chemistry and single-phase synthesis of Gd3+ substituted Co–Zn ferrite nanoparticles for enhanced magnetic properties. RSC Adv. 2018, 8, 25258. [Google Scholar] [CrossRef] [Green Version]
  29. Mostafa, N.Y.; Zaki, Z.I.; Mohsen, Q.; Alotaibi, S.H.; El-moemen, A.A.; Amin, M.A. Carboxylate-assisted synthesis of highly-defected monoclinic zirconia nanoparticles. J. Mol. Struct. 2020, 1214, 128232. [Google Scholar] [CrossRef]
  30. Waldron, R.D. Infrared Spectra of Ferrites. Phys. Rev. 1955, 99, 1727–1735. [Google Scholar] [CrossRef]
  31. Shirsath, S.E.; Mane, M.I.; Yasukawa, Y.; Liu, X.; Morisako, A. Self-ignited high temperature synthesis and enhanced super-exchange interactions of Ho3+-Mn2+-Fe3+-O2-ferromagnetic nanoparticles. Phys. Chem. Chem. Phys. 2014, 16, 2347–2357. [Google Scholar] [CrossRef]
  32. Abozaid, R.M.; Lazarević, Z.Z.; Radojević, V.; Rabasović, M.S.; Šević, D.; Rabasović, M.D.; Romčević, N.Z. Characterization of Neodymium Doped Calcium Tungstate Single Crystal by Ra-man, IR and Luminescence Spectroscopy. Sci. Sinter. 2018, 50, 445–455. [Google Scholar] [CrossRef] [Green Version]
  33. Lim, E.W.; Feng, R. Agglomeration of magnetic nanoparticles. J. Chem. Phys. 2012, 136, 124109. [Google Scholar] [PubMed]
  34. Fang, D.; He, F.; Xie, J.; Xue, L. Calibration of binding energy positions with C1s for XPS results. J. Wuhan Univ. Technol. Mater. Sci. Ed. 2020, 35, 711–718. [Google Scholar] [CrossRef]
  35. Wang, W.P.; Yang, H.; Xian, T.; Jiang, J.L. XPS and magnetic properties of CoFe2O4 nanoparticles synthesized by a polyacrylamide gel route. Mater. Trans. 2012, 53, 1586–1589. [Google Scholar] [CrossRef] [Green Version]
  36. Shao, L.; Sun, A.; Zhang, Y.; Yu, L.; Suo, N.; Zuo, Z. Microstructure, XPS and magnetic analysis of Al-doped nickel–manganese–cobalt ferrite. J. Mater. Sci. Mater. Electron. 2021, 32, 20474–20488. [Google Scholar] [CrossRef]
  37. Sun, M.; Xu, N.; Cao, Y.W.; Yao, J.N.; Wang, E.G. Nanocrystalline tungsten oxide thin film: Preparation, microstructure, and photochromic behavior. J. Mater. Res. 2000, 15, 927–933. [Google Scholar] [CrossRef]
  38. Mosivand, S.; Kazeminezhad, I. Synthesis of electrocrystallized cobalt ferrite nanopowders by tuning the cobalt salt concentration. RSC Adv. 2015, 5, 14796–14803. [Google Scholar] [CrossRef]
  39. Pillai, V.; Shah, D.O. Synthesis of high-coercivity cobalt ferrite particles using water-in-oil microemulsions. J. Magn. Magn. Mater. 1996, 163, 243–248. [Google Scholar] [CrossRef]
  40. Sutka, A.; Doebelin, N. Study of defects by Rietveld technique and gas response of excess-iron zinc ferrite. J. Jpn. Soc. Powder Powder Metall. 2014, 61, S81–S84. [Google Scholar] [CrossRef] [Green Version]
Figure 1. Flow chart for synthesis of pure CoFe2O4 and W-substituted CoFe2O4 (0.5–0.15%) nanoparticles using a sol-gel method.
Crystals 12 00393 g001
Figure 2. XRD patterns of CoWxFe2−2xO4 spinel ferrites.
Crystals 12 00393 g002
Figure 3. FTIR of CoWxFe2−2xO4 spinel ferrite samples.
Crystals 12 00393 g003
Figure 4. SEM of (a) CoFe2O4 and (b) CoFe2O4 (0.5% W-doping), and EDX of (c) CoFe2O4 and (d) CoFe2O4 (0.5% W-doping).
Crystals 12 00393 g004
Figure 5. SEM of (a) CoFe2O4 (0.1% W-doping), and (b) CoFe2O4 (0.15% W-doping), and EDX of (c) CoFe2O4 (0.1% W-doping), and (d) CoFe2O4 (0.15% W-doping).
Crystals 12 00393 g005
Figure 6. SEM and EDS Mapping of (S1) CoFe2O4, (S2) CoFe2O4 (0.05% W-doping), (S3) CoFe2O4 (0.10% W-doping), and (S4) CoFe2O4 (0.15% W-doping).
Crystals 12 00393 g006
Figure 7. TEM analysis of (a) CoFe2O4, (b) 0.5% W-CoFe2O4, (c) 0.1% W-CoFe2O4, and (d) 0.15% W-CoFe2O4 nanoparticles.
Crystals 12 00393 g007aCrystals 12 00393 g007b
Figure 8. (a) BET plots, and (b) Pore-size distribution behavior of CoFe2O4 (red colure), 0.5% W-CoFe2O4 (blue colure), 0.1% W-CoFe2O4 (olive colure), and 0.15% W-CoFe2O4 (wine colure) of W-substituted CoFe2O4 nanoparticles.
Crystals 12 00393 g008
Figure 9. (a) Binding energy survey, high resolution XPS spectra of (b) Co2p, (c) Fe2p, (d) W4f, and (e) O1s of CoFe2O4 (red colure), 0.5% W-CoFe2O4 (blue colure), 0.1% W-CoFe2O4 (olive colure), and 0.15% W-CoFe2O4 (wine colure) of W-substituted CoFe2O4 nanoparticles.
Crystals 12 00393 g009aCrystals 12 00393 g009b
Figure 10. H-M hysteresis loops of CoWxFe2−2xO4 samples.
Crystals 12 00393 g010
Figure 11. Variation of saturation magnetization (Ms) with W-doping level.
Crystals 12 00393 g011
Figure 12. Sensors sensitivity at different temperatures exposed to 2000 ppm acetone, ethanol, and ammonia; (a) CoFe2O4, (b) CoFe2O4-0.5%W, (c) CoFe2O4-1.0%W, (d) CoFe2O4-1.5%W.
Crystals 12 00393 g012
Figure 13. CoFe2O4-1.5%W sensors response (Res %) at different gas concentrations (ppm) and 200 °C.
Crystals 12 00393 g013
Table 1. Refined values of cell parameters a (Å), crystallite size (nm), and microstrain (ε) of CoWxFe2−2xO4 spinel ferrite system.
Parameterx = 0.0x = 0.05x = 0.1x = 0.15
a (Å)8.364 (2)8.367 (6)8.371 (4)8.372 (3)
Size (nm)71.3972.9578.2980.22
Volume Å3585.04585.77586.59586.69
Strain (ε) × 10−44.864.754.434.94
Table 2. Ionic radii (Å) of different metal cations in A-sites (tetrahedral) and B-sites (octahedral) [29].
Metal CationA-Sites (Tetrahedral)B-Sites (Octahedral)
Co2+0.720.79
Fe3+0.490.55
W6+0.420.60
Table 3. Surface properties of CoFe2O4 with powder with different W-doping.
SamplesSBET (m2/g)Vm (cc/g)Vp (cc/g)ȓ (nm)
Pure5.10040.23180.02330918.280
0.05 W4.97520.21380.02058417.193
0.10 W2.10900.19680.0045537.334
0.15 W2.65870.16140.001424.292
Table 4. The magnetic properties of the CoWxFe2−2xO4 samples.
SamplesMs (Am2/kg)Mr (Am2/kg)Mr/Ms (Am2/kg)Hci (KA/m)
CoF2O442.48116.5750.390127.683
0.05 W50.15121.4560.427834.025
0.10 W38.72615.3080.395232.186
0.15 W34.67612.990.374626.999
Publisher’s Note: MDPI stays neutral with regard to jurisdictional claims in published maps and institutional affiliations.

