Article

Magnetic-Field-Tunable Intensity Transfer from Optically Active Phonons to Crystal-Field Excitations in the Reflection Spectra of the PrFe3(BO3)4 Antiferromagnet

by
Kirill N. Boldyrev
1,*,
Boris Z. Malkin
2 and
Marina N. Popova
1
1
Institute of Spectroscopy, Russian Academy of Sciences, Troitsk, 108840 Moscow, Russia
2
Institute of Physics, Kazan Federal University, 420008 Kazan, Russia
*
Author to whom correspondence should be addressed.
Crystals 2022, 12(3), 392; https://doi.org/10.3390/cryst12030392
Submission received: 25 February 2022 / Revised: 11 March 2022 / Accepted: 12 March 2022 / Published: 14 March 2022
(This article belongs to the Special Issue Active, Tunable and Reconfigurable Elastic Metamaterials)

Abstract

:
We analyze the field-dependent intensities of the coupled electron-phonon modes observed in the low-temperature far-infrared (terahertz) reflection spectra of PrFe3(BO3)4 and develop a theory based on the Green’s function approach. An excellent agreement between the experimental and theoretical data is achieved. The developed theory of the intensity transfer from phonons to quasi-electronic excitations can be applied to the electron-phonon modes in other compounds, in particular, in magnetodielectric materials, where it can be used to analyze the magnetodielectric response.

1. Introduction

A strong interaction between electronic, magnetic, and lattice degrees of freedom in multiferroics results in a vast variety of phases and phenomena [1,2,3,4], including electronic-structural phase transitions [5], coupled magnon-phonon [6,7] and electron-magnon modes [8], and formation of electromagnons [9,10]. Coupled electron-phonon modes in a terahertz spectral region and related new phenomena were recently discovered in an antiferromagnetic PrFe3(BO3)4 single crystal [11,12,13], a member of a new family of multiferroics [14,15,16,17]. The peculiarity of PrFe3(BO3)4 is that the 4f electronic excitation corresponding to the transition from the ground state to the first excited crystal-field (CF) level of the Pr3+ ion falls into the region between the TO and LO phonon frequencies. In this case, the electronic mode is inverted: the LO frequency becomes lower than the TO frequency. It was the first observation of an inverted electronic mode [13]. A new effect was observed—the splitting of the “reststrahlen” band corresponding to a non-degenerate phonon mode [11]. Investigation of the behavior of the coupled electron-phonon modes of PrFe3(BO3)4 in an external magnetic field made it possible to discover another new effect caused by the electron-phonon interaction, namely, the existence of a gap in the spectrum of quasi-electronic excitations of an easy-axis antiferromagnet in an arbitrarily small external magnetic field directed along the easy axis of magnetization [12]. As a result, the field behavior of the spectrum of excitations differs qualitatively from the behavior in the absence of electron-phonon coupling. How the formation of coupled electron-phonon modes affects the magnetic, magnetoelectric, and magnetodielectric properties of a multiferroic depends not only on the frequencies but also on the intensities of the coupled excitations. The magnetic field dependence of the far-infrared reflectivity of the rare-earth compound CeF3 was observed more than thirty years ago [18], but, to the best of our knowledge, the intensity transfer from optically active phonons to quasi-electronic excitations in coupled electron-phonon modes has not been theoretically analyzed in the literature.
Here, we investigate the intensity vs. magnetic field dependence for coupled electron-phonon modes of PrFe3(BO3)4 at low temperatures and develop a theory that describes the experimental findings well.

2. Structure and Properties of PrFe3(BO3)4 Crystals

The Praseodymium iron borate crystallizes in a noncentrosymmetric trigonal structure of the natural mineral huntite with the space symmetry group R32 [19,20]. FeO6 octahedra share edges forming helical chains along the c axis of the crystal. These isolated chains are interconnected by two kinds of BO3 triangles and by PrO6 distorted prisms. The Pr3+ ions occupy a single D3 symmetry position. The threefold symmetry axis z of the local D3 point symmetry group is parallel to the crystallographic c axis [19,20,21]. A detailed illustrated description of the huntite structure can be found, e.g., in Ref. [21]. Crystal-field levels of Pr3+ are characterized by the Γ1 and Γ2 nondegenerate and Γ3 doubly degenerate irreducible representations of the D3 point symmetry group. The ground and the first excited CF states of Pr3+ in PrFe3(BO3)4 are the Γ2 and Γ1 singlets, respectively, well isolated from other CF levels [22,23], which determines the magnetic and magnetoelectric properties of this compound [23,24,25].
At TN = 32 ± 1 K, Fe3+ spins of PrFe3(BO3)4 order into an easy-axis antiferromagnetic structure [20,24], and effective sign-alternative internal magnetic fields directed along the z axis appear at the praseodymium sites inducing the Zeeman term in the Hamiltonian of the Pr3+ ions, V = ± g0μBJzBint (here g0 = 4/5 is the Lande factor of the ground multiplet 3H4, μB is the Bohr magneton, and the ± sign denotes that one half of the Pr3+ ions experiences a positive field and the other half experiences a negative field). A non-zero matrix element of the Jz component of the angular momentum, <Γ1|Jz2>, results in a growing mutual repulsion of the lowest CF levels at temperatures below the second-order antiferromagnetic phase transition [22,23] accompanied by the unit cell doubling along the c-axis. In an external magnetic field applied along the c axis, the crystal undergoes a spin-flop transition at BSF ≈ 4.5 T, at which the antiferromagnetically ordered along the c axis magnetic moments of Fe3+ ions flop onto the ab plane [12,24].
The frequency 48 cm−1 of the electronic CF excitation corresponding to the symmetry-allowed for the π-polarized (kc, Ec) light Γ2 → Γ1 optical electric dipole transition in Pr3+ ions falls into the region between the TO and LO frequencies (ωTO = 38 cm−1 and ωLO = 55 cm−1, respectively; all frequencies at T = 120 K) of the lowest infrared-active in the π polarization Γ2 (A2 in notations accepted in lattice dynamics) phonon mode. This mode is associated mainly with motions of the heavy Pr3+ ions in PrFe3(BO3)4 [26]. Electric dipole optical transitions within the ground 4f2 configuration of Pr3+ are forbidden by the parity selection rule; a non-zero electric dipole moment appears due to mixing of the 4f2 configuration with excited configurations of opposite parity in the non-centrosymmetric crystal field. The oscillator strength of such f–f electronic transition is small (~10−6) and it cannot be observed in the reflection spectra. However, the electron-phonon interaction results in the intensity borrowing from a phonon mode and frequency renormalization, i.e., in a formation of the coupled electron-phonon mode in PrFe3(BO3)4, which is observed in the π-polarized reflection spectra [11,12].

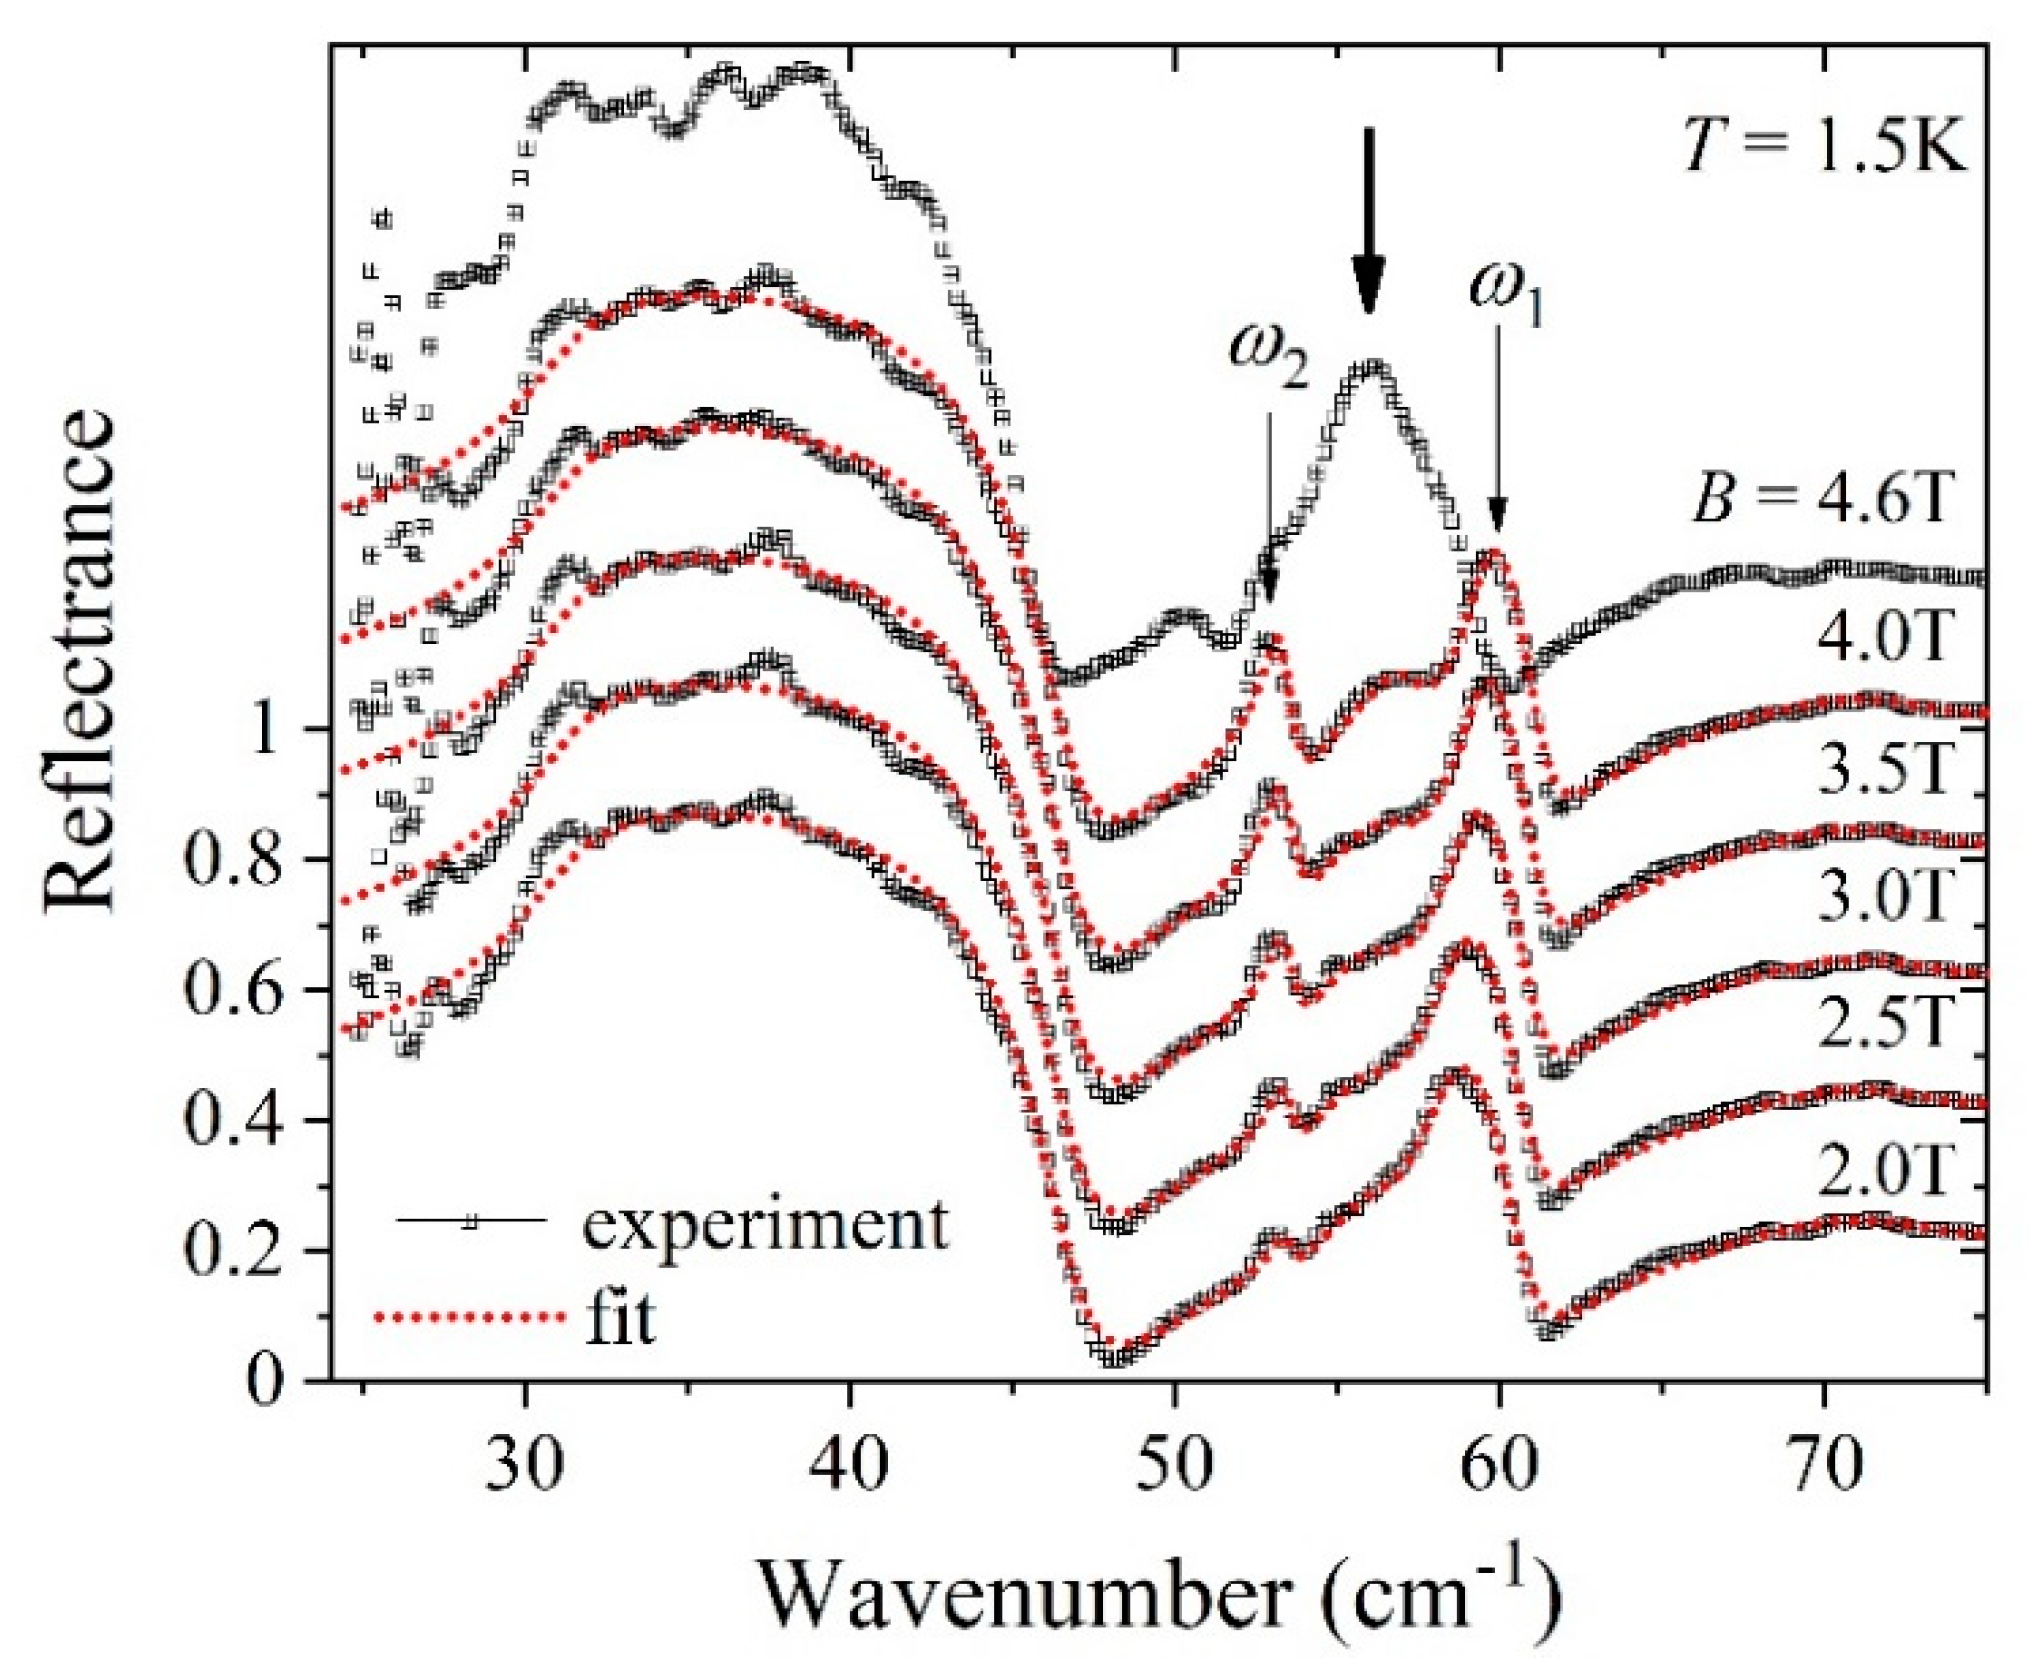
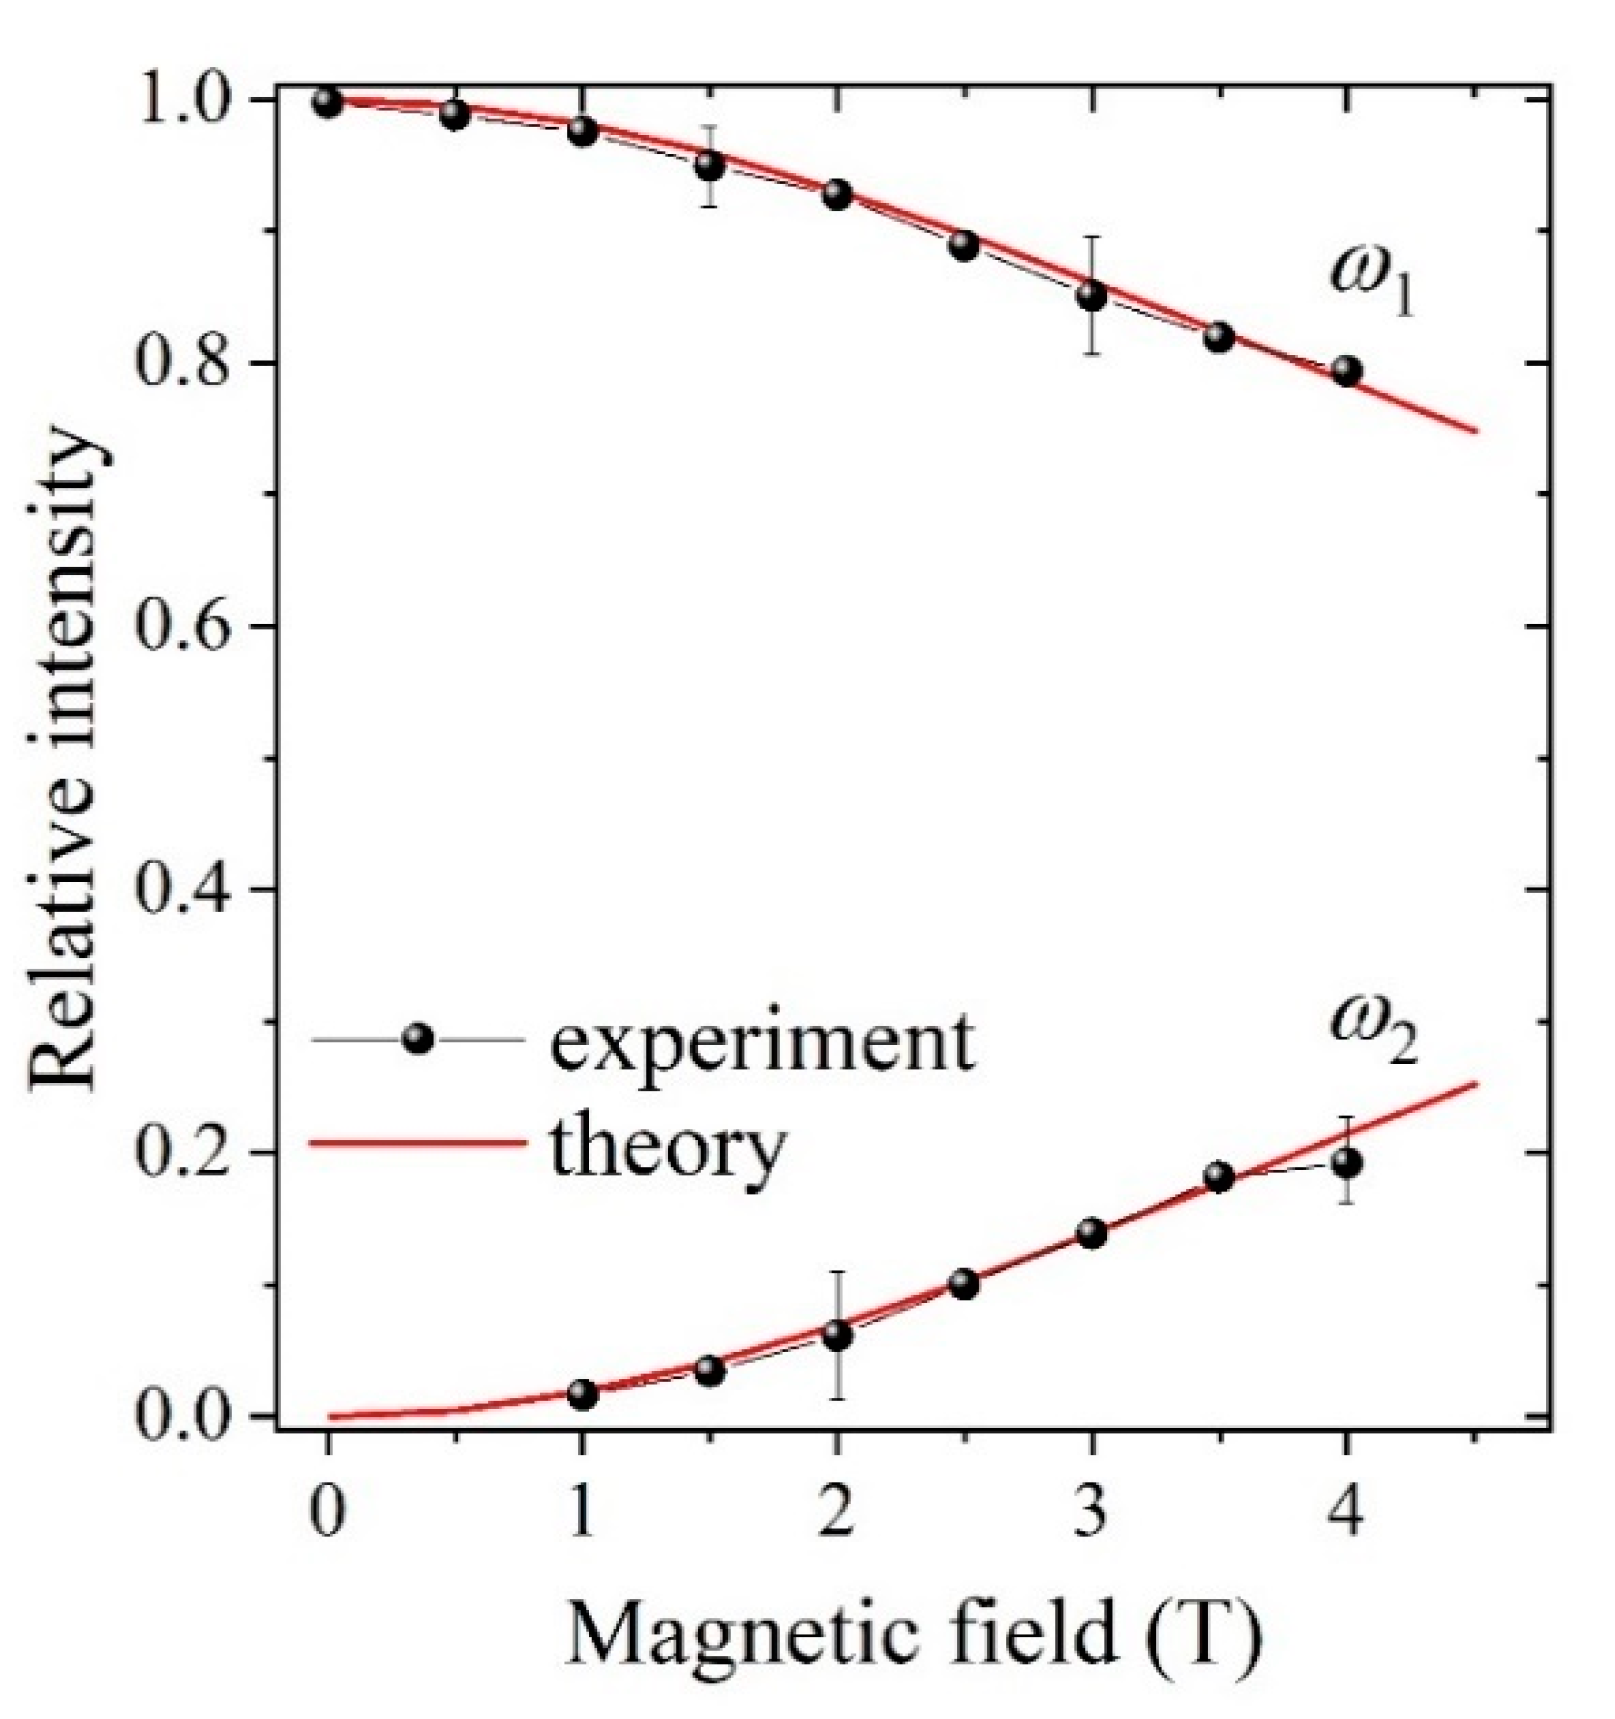
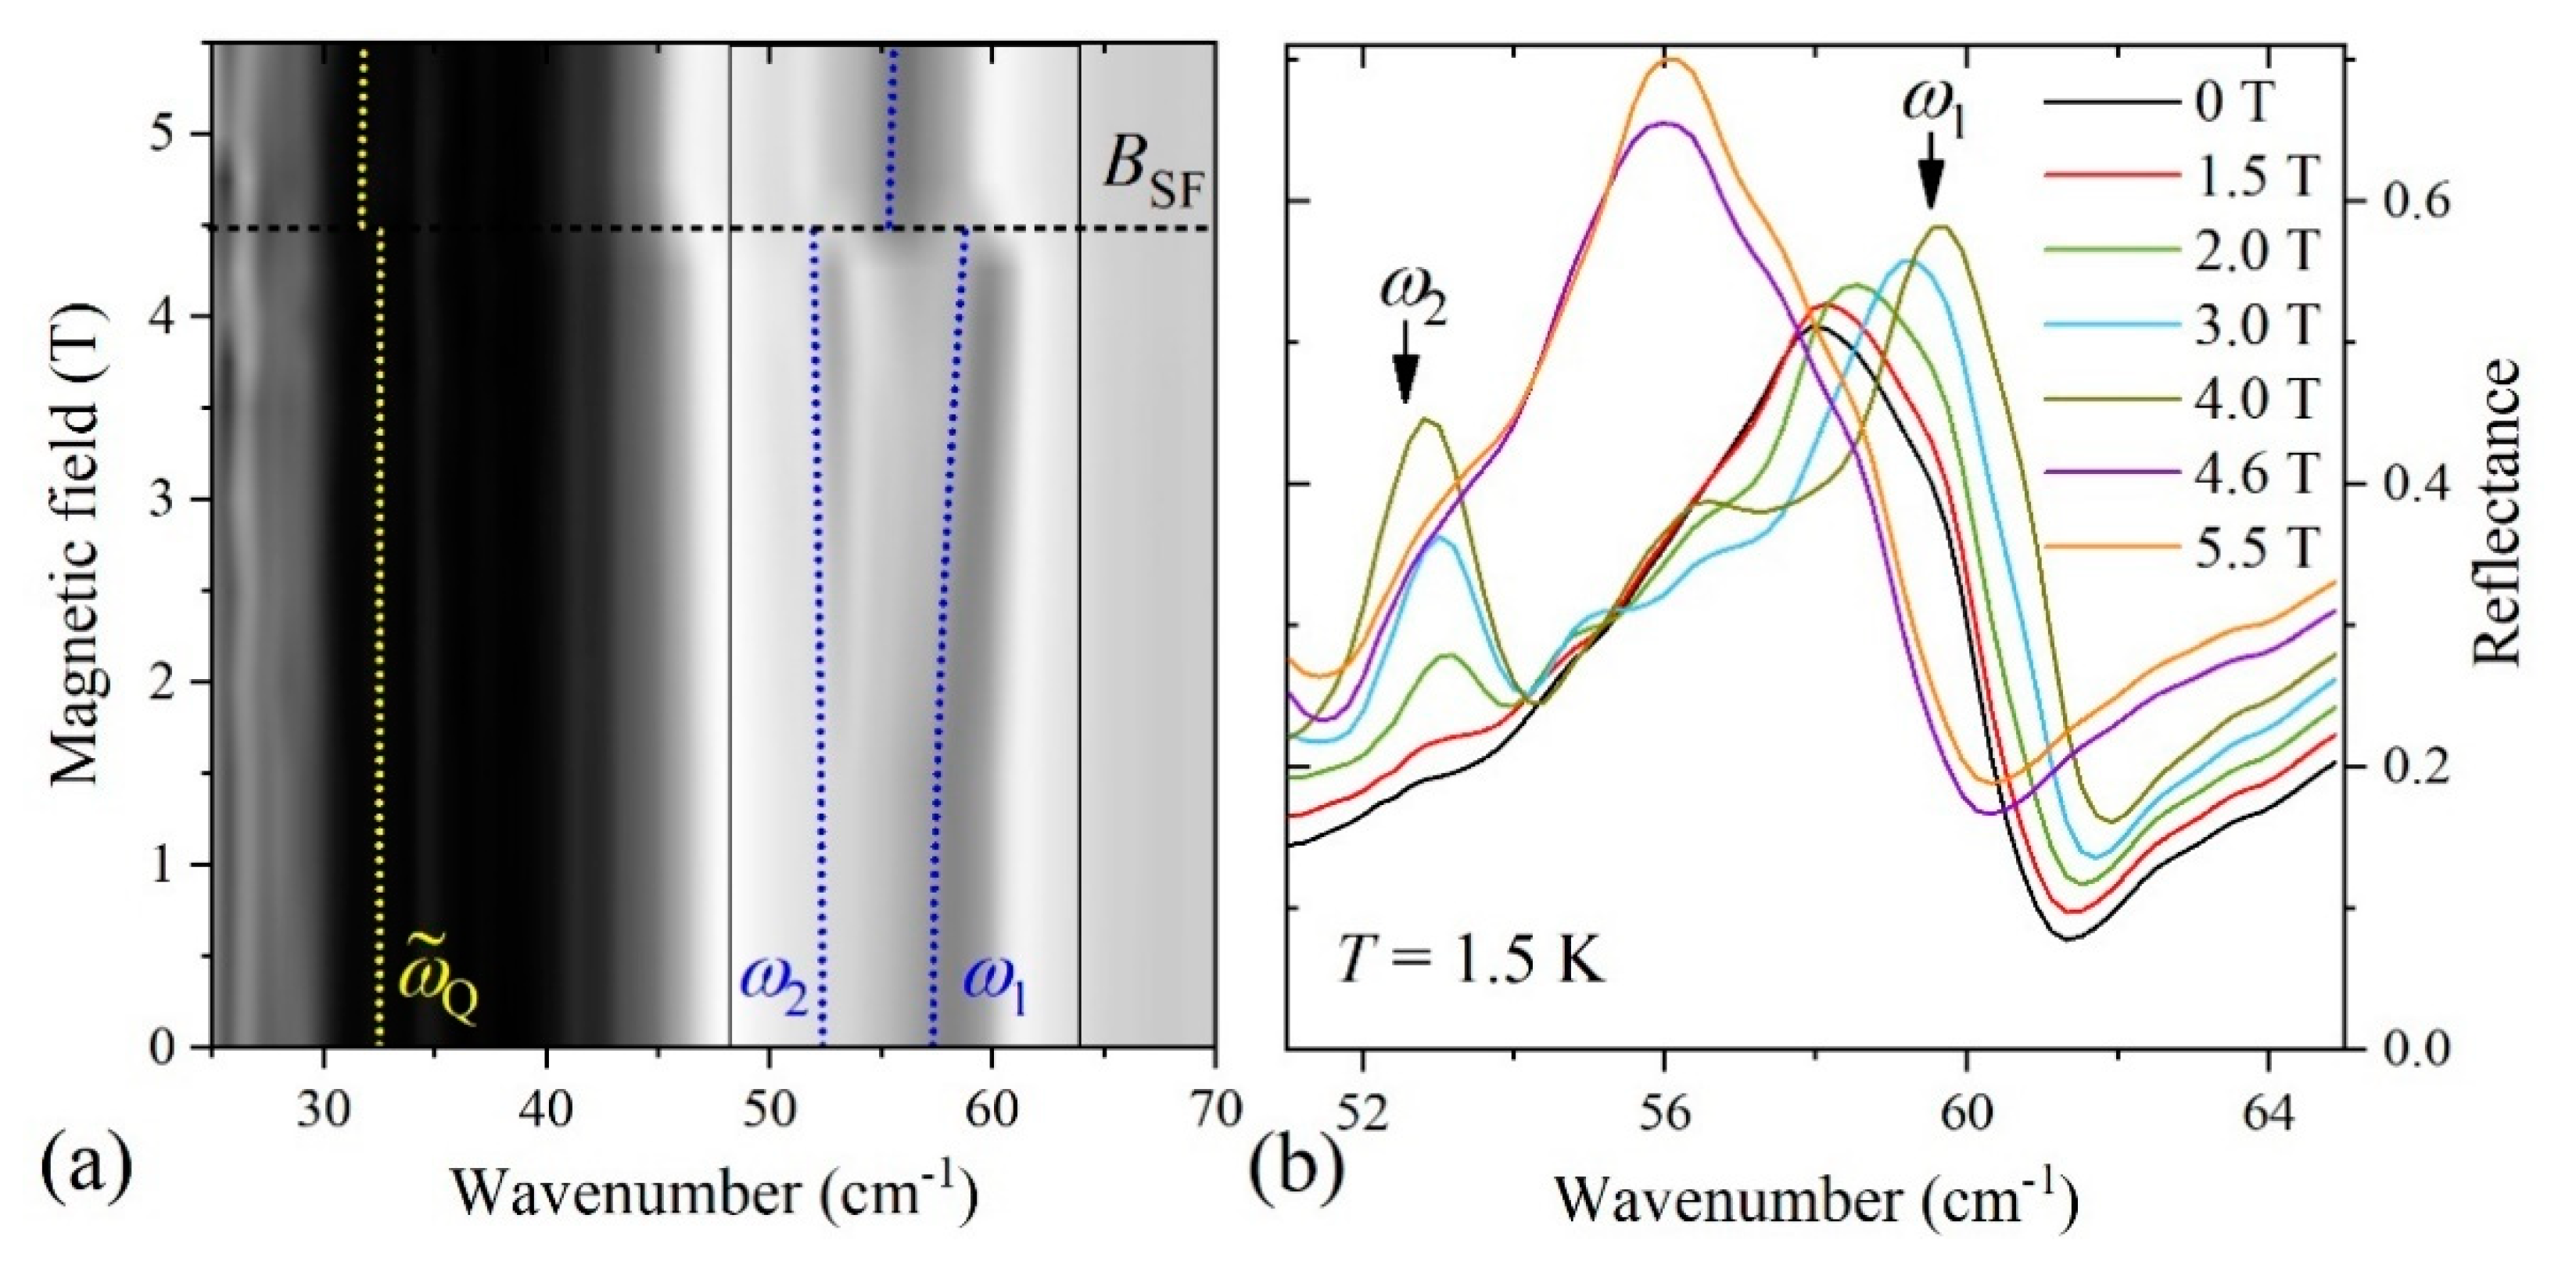
3. Experimental Results

To get information on the intensities for the quasi-phonon and quasi-electronic branches of the coupled mode as a function of the strength of an external magnetic field Bc, we used the earlier obtained [12] π-polarized far-infrared (terahertz) reflection spectra in the region of 25–100 cm−1 (0.75–3 THz) of a PrFe3(BO3)4 single crystal at the temperature of 1.5 K. Figure 1 shows the spectra.
At any nonzero value of the external field below BSF (Bc), there are two quasi-electronic branches in the spectrum of coupled modes in the easy-axis antiferromagnetic phase of PrFe3(BO3)4, with a gap between them at B → 0. This gap is mediated by the electron-phonon coupling and can be regarded as its signature. The physical nature of the gap was considered in detail in Ref. [12]. The low-frequency quasi-electronic branch appears at B > 0 and gradually gains its intensity with a growing magnetic field (see Figure 1). Above the spin-flop transition, at B > BSF, all praseodymium ions experience the same effective field, so that only one quasi-electronic mode remains [12] (see Figure 1 and Figure 2). Though the spin-flop is the first-order magnetic transition, weak traces of this single quasi-electronic mode are visible well below BSF, due to inhomogeneity of the magnetic field.
To obtain quantitative information on the intensities, the spectra were fitted using the RefFIT software [27,28]. The least-squares method was applied, and calculations were performed according to the equation:
R ( ω ) = ( ε ( ω ) 1 ε ( ω ) + 1 ) 2 ,    
where R(ω) is the reflection coefficient, ε(ω) is the dielectric function represented in the form of a sum of independent damped oscillators (Drude–Lorentz model) as
ε ( ω ) = ε + p = 1 K ω 0 p 2 f p ω 0 p 2 ω 2 + i ω γ p .    
Here, K is the total number of oscillators, ω 0 p ,   f p , and γ p are the transverse optical (TO) mode frequency, the oscillator strength, and the damping constant of the p-th oscillator, respectively, and ε is the dielectric constant at high frequencies.
Figure 2 shows the fitting results for the spectra taken at several values of the magnetic field.
Symbols in Figure 3 represent the relative oscillator strengths for two quasi-electronic branches of the coupled mode (see Figure 1), found from the described fitting procedure.

4. Theory

Our goal is to derive an analytical expression for relative intensities of quasi-phonon and quasi-electronic coupled electron-phonon modes in the far-infrared reflection (absorption) spectra of PrFe3(BO3)4 in the antiferromagnetic phase, under an applied external magnetic field. As far as we know, a theoretical analysis of the intensity transfer from optically active phonons to quasi-electronic excitations in coupled electron-phonon modes has not yet been presented in the literature.
In the antiferromagnetic phase, the crystallographic unit cell of PrFe3(BO3)4 doubles along the trigonal symmetry axis, a new unit cell contains two Pr3+ ions with antiparallel magnetic moments along the c-axis. In an external magnetic field Bc, B < BSF, these ions have different energy spectra. In the absence of the electron-phonon interaction, the differences between energies of their first excited and ground CF levels are ћωel,1 and ћωel,2, respectively,
ω el , s 2 = E 2 + 4 μ B 2 g 0 2 | Γ 1 | J Z | Γ 2 | 2 | B eff ( s ) | 2 ,   s = 1 , 2 ,  
where E is the energy of the Γ 1 first excited CF level of Pr3+ in paramagnetic PrFe3(BO3)4, B eff ( 1 ) = B int + B at one half of the praseodymium sites, B eff ( 2 ) = B int + B at the other half (Bint ≈ 10.5 T at 1.5 K [23] is an internal staggered magnetic field at the praseodymium sites).
The Hamiltonian of the considered system is written as follows:
H = H Q + s = 1 , 2 ( H e l , s + V s ) ,
where
H Q = 1 2 ( Q ˙ 2 + ω Q 2 Q 2 )
is a phonon Hamiltonian for the normal mode Q with the wave vector q = 0 (at the Brillouin zone center) and the frequency ω Q ;
H e l , s = n = 1 N M = 1 , 2 E M , s P M M n , s
is the Hamiltonian for the s-th two-level electronic center in the n-th unit cell with energies E1,s and E2,s (E2,sE1,s = ћωel,s) and corresponding wave functions |1n,s> and |2n,s>, respectively, but P M K n , s = | M n , s > < K n , s | are projection operators;
V s = n 1 N Q ( w P 12 n , s + w * P 21 n , s )
is the Hamiltonian of the electron-phonon interaction, w is the coupling constant related to the parameter W (measured in wave numbers and determined in [12]) by the relation w = 2 π c ( ω Q ) 1 2 W .
We assume the effective electric dipole moment of the TO phonon mode to be proportional to the normal mode displacement Q. In this case, the intensity of the electric dipole absorption at the frequency ω is proportional to the imaginary part of the dynamic susceptibility of the Q mode, i.e., the imaginary part of the spectral representation of the thermodynamic Green’s function G Q Q ( t ) = i ϑ ( t ) < [ Q ( t ) , Q ( 0 ) ] > :
I ( ω ) I m G Q Q ( ω ) ,     G Q Q ( ω ) = 1 2 π G Q Q ( t ) e i ω t d t .  
Equations for the Green’s function can be written as
d 2 d t 2 G Q Q ( t ) = δ ( t ) + i ϑ ( t ) < [ d 2 Q ( t ) d t 2 , Q ( 0 ) ] > .
Here, the relation [ d Q d t , Q ] = i was used. Equations of motion for considered operators are:
d 2 Q d t 2 = 1 i [ d Q d t , H ] = ω Q 2 Q n , s 1 N ( w P 12 n , s + w * P 21 n , s ) ,
d P 12 n , s d t = d P 21 n , s * d t = i ω e l , s P 12 n , s i Q N w * ( P 11 n , s P 22 n , s ) .  
Next, to decouple the equations of motion of electronic and phonon dynamic variables, we linearize Equation (11) substituting non-zero average values for diagonal components of projection operators P M M n , s ,
< P M M n , s > = ρ M , s = exp ( E M , s / k B T ) / M exp ( E M , s / k B T ) ,
where ρ M , s are relative populations of the corresponding electronic states at the temperature T. Substituting (10) into (9) and passing to spectral representations, we obtain the following expression for the Green’s function:
G Q Q ( ω ) = 2 π [ ( ω Q 2 ω 2 ) + 2 s ω e l , s ( ρ 1 , s ρ 2 , s ) | w | 2 ( ω 2 ω e l , s 2 ) ] .  
The poles of this function, i.e., the roots ω 1 , ω 2 and ω ˜ Q of the equation
( ω 2 ω Q 2 ) 2 s ω e l , s ( ρ 1 , s ρ 2 , s ) | w | 2 ( ω 2 ω e l , s 2 ) = ( ω 2 ω 1 2 ) ( ω 2 ω 2 2 ) ( ω ω ˜ Q 2 ) = 0 ,  
are the frequencies of coupled excitations.
Equation (13) was analyzed in Ref. [12]. The magnetic-field-dependent values of ω ˜ Q , ω1, and ω2 were found from Equation (13) using the experimentally determined values E = 49 cm−1 and g 0 Γ 1 | J Z | Γ 2 = 1.9 and obtained from the fitting procedure values | W | = 14.8 cm−1, ω Q = 40 cm−1 [12]. The calculated frequencies are shown by dotted lines in Figure 1. It was shown that the experimentally observed frequencies of the quasi-phonon and two quasi-electronic modes in the far-infrared reflection spectra of PrFe3(BO3)4 at T = 1.5 K in the external magnetic field Bc coincide with the roots of Equation (13) ω ˜ Q , ω 1 and ω 2 , respectively. We note that the value of the effective electron-phonon coupling constant |W| presented above does not contradict the estimates of derivatives of the crystal-field parameters with respect to the ligand distances from Pr3+ ions.
Furthermore, to get insight into the intensities of the coupled modes, we represent (12) in the form
G Q Q ( ω ) = 2 π ( ω 2 ω e l , 1 2 ) ( ω 2 ω e l , 2 2 ) ( ω 2 ω 1 2 ) ( ω 2 ω 2 2 ) ( ω 2 ω ˜ Q 2 ) .    
Replacing the excitation frequency with a complex variable, ω 2 ω 2 + i ε , ε 0 , we obtain the following expression for the absorption intensity:
I ( ω ) ( ω ˜ Q 2 ω e l , 1 2 ) ( ω ˜ Q 2 ω e l , 2 2 ) ( ω ˜ Q 2 ω 1 2 ) ( ω ˜ Q 2 ω 2 2 ) δ ( ω 2 ω ˜ Q 2 ) + ( ω 1 2 ω e l , 1 2 ) ( ω 1 2 ω e l , 2 2 ) ( ω 1 2 ω ˜ Q 2 ) ( ω 1 2 ω 2 2 ) δ ( ω 2 ω 1 2 ) + ( ω 2 2 ω e l , 1 2 ) ( ω 2 2 ω e l , 2 2 ) ( ω 2 2 ω ˜ Q 2 ) ( ω 2 2 ω 1 2 ) δ ( ω 2 ω 2 2 ) .
Above, we did not consider the widths of the excitations; they can be taken into account by replacing in (15) frequencies of phonon and electronic excitations with complex quantities.
The coefficients at the delta-functions in (15) determine the relationship between the intensities of the quasi-phonon mode and the intensities of the two quasi-electronic modes. Solid lines in Figure 3 show the theoretical field dependence of the two quasi-electronic modes. An excellent agreement with the experimental data is evident.

5. Conclusions

To summarize, the theory is developed of the intensity transfer from optically active phonons to quasi-electronic excitations in coupled electron-phonon modes. The theory is applied to the magnetic-field-dependent coupled crystal-field and phonon excitations observed in the terahertz frequency region in the low-temperature reflection spectra of the easy-axis antiferromagnet PrFe3(BO3)4 [12]. Analysis of the earlier obtained field-dependent spectra of PrFe3(BO3)4 [12] using the Drude–Lorentz model revealed the oscillator strengths of the quasi-phonon and quasi-electronic branches of the coupled electron-phonon mode. An excellent agreement between the experimental and theoretical results was demonstrated. The developed theory can be applied to optically active coupled modes in the infrared spectra of other compounds, in particular, rare-earth magnetodielectric materials [29] and can be used to analyze their magnetodielectric response.

Author Contributions

Conceptualization, K.N.B. and M.N.P.; methodology, K.N.B. and B.Z.M.; data acquisition K.N.B.; theory and calculations, B.Z.M. writing—original draft preparation, M.N.P. and K.N.B.; writing—review and editing, M.N.P. and B.Z.M.; figures, K.N.B. All authors have read and agreed to the published version of the manuscript.

Funding

Financial support from the Russian Science Foundation (Grant No. 19-12-00413) was given.

Institutional Review Board Statement

Not applicable.

Informed Consent Statement

Not applicable.

Data Availability Statement

The data that support the plots within the paper and other findings of this study are available from the corresponding author upon reasonable request.

Conflicts of Interest

The authors declare no conflict of interest.

References

  1. Spaldin, N.A.; Ramesh, R. Advances in magnetoelectric multiferroics. Nat. Mater. 2019, 18, 203–212. [Google Scholar] [CrossRef] [PubMed]
  2. Liang, X.; Chen, H.; Sun, N.X. Magnetoelectric materials and devices. APL Mater. 2021, 9, 041114. [Google Scholar] [CrossRef]
  3. Pyatakov, A.P.; Zvezdin, A.K. Magnetoelectric and multiferroic media. Physics-Uspekhi 2012, 55, 557. [Google Scholar] [CrossRef]
  4. Khomskii, D. Classifying multiferroics: Mechanisms and effects. Physics 2009, 2, 20. [Google Scholar] [CrossRef] [Green Version]
  5. Hampel, A.; Liu, P.; Franchini, C.; Ederer, C. Energetics of the coupled electronic–structural transition in the rare-earth nickelates. NPJ Quantum Mater. 2019, 4, 5. [Google Scholar] [CrossRef]
  6. Man, H.; Shi, Z.; Xu, G.; Xu, Y.; Chen, X.; Sullivan, S.; Zhou, J.; Xia, K.; Shi, J.; Dai, P. Direct observation of magnon-phonon coupling in yttrium iron garnet. Phys. Rev. B 2017, 96, 100406. [Google Scholar] [CrossRef] [Green Version]
  7. Yildirim, T.; Vergara, L.I.; ĺṅiguez, J.; Musfeldt, J.L.; Harris, A.B.; Rogado, N.; Cava, R.J.; Yen, F.; Chaudhury, R.P.; Lorenz, B. Phonons and magnetoelectric interactions in Ni3V2O8. J. Phys. Condens. Matter 2008, 20, 434214. [Google Scholar] [CrossRef]
  8. Kang, T.D.; Standard, E.; Ahn, K.H.; Sirenko, A.A.; Carr, G.L.; Park, S.; Choi, Y.J.; Ramazanoglu, M.; Kiryukhin, V.; Cheong, S.-W. Coupling between Magnon and Ligand-Field Excitations in Magnetoelectric Garnet. Phys. Rev. B 2010, 82, 014414. [Google Scholar] [CrossRef] [Green Version]
  9. Pimenov, A.; Mukhin, A.A.; Ivanov, V.Y.; Travkin, V.D.; Balbashov, A.M.; Loidl, A. Possible evidence for electromagnons in multiferroic manganites. Nat. Phys. 2006, 2, 97–100. [Google Scholar] [CrossRef] [Green Version]
  10. Szaller, D.; Shuvaev, A.; Mukhin, A.A.; Kuzmenko, A.M.; Pimenov, A. Controlling of Light with Electromagnons. Phys. Sci. Rev. 2020, 5, 20190055. [Google Scholar] [CrossRef] [Green Version]
  11. Boldyrev, K.N.; Stanislavchuk, T.N.; Sirenko, A.A.; Bezmaternykh, L.N.; Popova, M.N. Coupling between Phonon and Crystal-Field Excitations in Multiferroic. Phys. Rev. B 2014, 90, 121101. [Google Scholar] [CrossRef] [Green Version]
  12. Boldyrev, K.N.; Stanislavchuk, T.N.; Sirenko, A.A.; Kamenskyi, D.; Bezmaternykh, L.N.; Popova, M.N. Bifurcations of Coupled Electron-Phonon Modes in an Antiferromagnet Subjected to a Magnetic Field. Phys. Rev. Lett. 2017, 118, 167203. [Google Scholar] [CrossRef] [PubMed] [Green Version]
  13. Popova, M.N.; Boldyrev, K.N. New Effects of the Electron-Phonon Interaction in Dielectrics (50th Anniversary of the Institute of Spectroscopy, Russian Academy of Sciences). Physics-Uspekhi 2019, 62, 275–281. [Google Scholar] [CrossRef]
  14. Kadomtseva, A.M.; Popov, Y.F.; Vorob’ev, G.P.; Pyatakov, A.P.; Krotov, S.S.; Kamilov, K.I.; Ivanov, V.Y.; Mukhin, A.A.; Zvezdin, A.K.; Kuz’menko, A.M.; et al. Magnetoelectric and Magnetoelastic Properties of Rare-Earth Ferroborates. Low Temp. Phys. 2010, 36, 511–521. [Google Scholar] [CrossRef]
  15. Kuzmenko, A.M.; Szaller, D.; Kain, T.; Dziom, V.; Weymann, L.; Shuvaev, A.; Pimenov, A.; Mukhin, A.A.; Ivanov, V.Y.; Gudim, I.A.; et al. Switching of Magnons by Electric and Magnetic Fields in Multiferroic Borates. Phys. Rev. Lett. 2018, 120, 027203. [Google Scholar] [CrossRef] [Green Version]
  16. Nakamura, S.; Masuda, T.; Ohgushi, K.; Katsufuji, T. Mössbauer Study of Rare-Earth Ferroborate NdFe3(BO3)4. J. Phys. Soc. Jap. 2020, 89, 084703. [Google Scholar] [CrossRef]
  17. Golosovsky, I.V.; Mukhin, A.A.; Skumryev, V.; Boehm, M.; Schmidt, W.; Regnault, L.-P.; Gudim, I.A. Magnetic Excitations and Exchange Interactions in the Substituted Multiferroics (Nd, Tb)Fe3(BO3)4 Revealed by Inelastic Neutron Scattering. Phys. Rev. B 2021, 103, 214412. [Google Scholar] [CrossRef]
  18. Gerlinger, H.; Schaack, G. Crystal-Field States of the Ce3+ ion in CeF3: A Demonstration of Vibronic Interaction in Ionic Rare-Earth Compounds. Phys. Rev. B 1986, 33, 7438–7450. [Google Scholar] [CrossRef] [PubMed]
  19. Leonyuk, N.I.; Leonyuk, L.I. Growth and Characterization of RM3(BO3)4 Crystals. Prog. Cryst. Growth Charact. Mater. 1995, 31, 179–278. [Google Scholar] [CrossRef]
  20. Ritter, C.; Vorotynov, A.; Pankrats, A.; Petrakovskii, G.; Temerov, V.; Gudim, I.; Szymczak, R. Magnetic Structure in Iron Borates RFe3(BO3)4 (R = Er, Pr): A Neutron Diffraction and Magnetization Study. J. Phys. Condens. Matter 2010, 22, 206002. [Google Scholar] [CrossRef]
  21. Klimin, S.A.; Fausti, D.; Meetsma, A.; Bezmaternykh, L.N.; van Loosdrecht, P.H.M.; Palstra, T.T.M. Evidence for Differentiation in the Iron-Helicoidal Chain in GdFe3(BO3)4. Acta Crystallogr. Sect. B Struct. Sci. 2005, 61, 481–485. [Google Scholar] [CrossRef] [Green Version]
  22. Popova, M.N.; Stanislavchuk, T.N.; Malkin, B.Z.; Bezmaternykh, L.N. Breaking of the Selection Rules for Optical Transitions in the Dielectric PrFe3(BO3)4 Crystal by a Praseodymium-Iron Exchange Interaction. Phys. Rev. Lett. 2009, 102, 187403. [Google Scholar] [CrossRef] [PubMed]
  23. Popova, M.N.; Stanislavchuk, T.N.; Malkin, B.Z.; Bezmaternykh, L.N. Optical Spectroscopy of PrFe3(BO3)4: Crystal-Field and Anisotropic Pr-Fe Exchange Interactions. Phys. Rev. B 2009, 80, 195101. [Google Scholar] [CrossRef]
  24. Kadomtseva, A.M.; Popov, Y.F.; Vorob’ev, G.P.; Mukhin, A.A.; Ivanov, V.Y.; Kuz’menko, A.M.; Bezmaternykh, L.N. Influence of the Ground State of the Pr3+ Ion on Magnetic and Magnetoelectric Properties of the PrFe3(BO3)4 Multiferroic. JETP Lett. 2008, 87, 39–44. [Google Scholar] [CrossRef]
  25. Kostyuchenko, N.V.; Popov, A.I.; Zvezdin, A.K. Features of Magnetic and Magnetoelectric Properties of Rare-Earth Multiferroic PrFe3(BO3)4 with the Singlet Ground State. Phys. Solid State 2012, 54, 1591–1597. [Google Scholar] [CrossRef]
  26. Chernyshev, V.A.; Nikiforov, A.E.; Petrov, V.P.; Serdtsev, A.V.; Kashchenko, M.A.; Klimin, S.A. Structure and Lattice Dynamics of Rare-Earth Ferroborate Crystals: Ab Initio Calculation. Phys. Solid State 2016, 58, 1642–1650. [Google Scholar] [CrossRef]
  27. Kuzmenko, A.B. Kramers–Kronig Constrained Variational Analysis of Optical Spectra. Rev. Sci. Instrum. 2005, 76, 083108. [Google Scholar] [CrossRef] [Green Version]
  28. Guide to RefFIT Software to Fit Optical Spectra. Available online: https://reffit.ch/wp-content/uploads/2018/10/Manual.pdf (accessed on 25 February 2022).
  29. Sethi, A.; Slimak, J.E.; Kolodiazhnyi, T.; Cooper, S.L. Emergent Vibronic Excitations in the magnetodielectric regime of Ce2O3. Phys. Rev. Lett. 2019, 122, 177601. [Google Scholar] [CrossRef] [PubMed] [Green Version]
Figure 1. The π-polarized far-infrared reflection spectra of PrFe3(BO3)4 at T = 1.5 K in the external magnetic field Bc (a) represented as a reflection intensity map [black (white) color corresponds to the reflectance close to unity (zero)] in the frequency—magnetic field axes and (b) for several selected values of B in the region shown by a rectangle in (a). The spin-flop transition in the field BSF ≈ 4.5 T is clearly observed in the spectra. Dotted lines in (a) represent the calculated transverse optical (TO) frequencies of the quasi-phonon ( ω ˜ Q ) and two quasi-electronic branches ( ω 1 and ω 2 ) of the coupled mode (see the text).
Crystals 12 00392 g001
Figure 2. Measured (black symbols) and fitted by Equation (1) (red dashed line) π-polarized far-infrared reflection spectra of PrFe3(BO3)4 at several values of the external magnetic field Bc at T = 1.5 K. Thin arrows point to the two quasi-electronic branches below BSF ≈ 4.5 T. Above BSF, they convert into a single quasi-electronic mode (indicated by a bold arrow).
Crystals 12 00392 g002
Figure 3. Relative intensities of the two quasi-electronic branches of the coupled mode in PrFe3(BO3)4 at T = 1.5 K vs. the external magnetic field Bc, B < BSF. Symbols represent the experimental data; solid red lines are calculated according to Equation (15).
Crystals 12 00392 g003
Publisher’s Note: MDPI stays neutral with regard to jurisdictional claims in published maps and institutional affiliations.

