
Study on the Visualization of Transport and Crystallization of Salt Solution in Simulated Wall Painting


Abstract
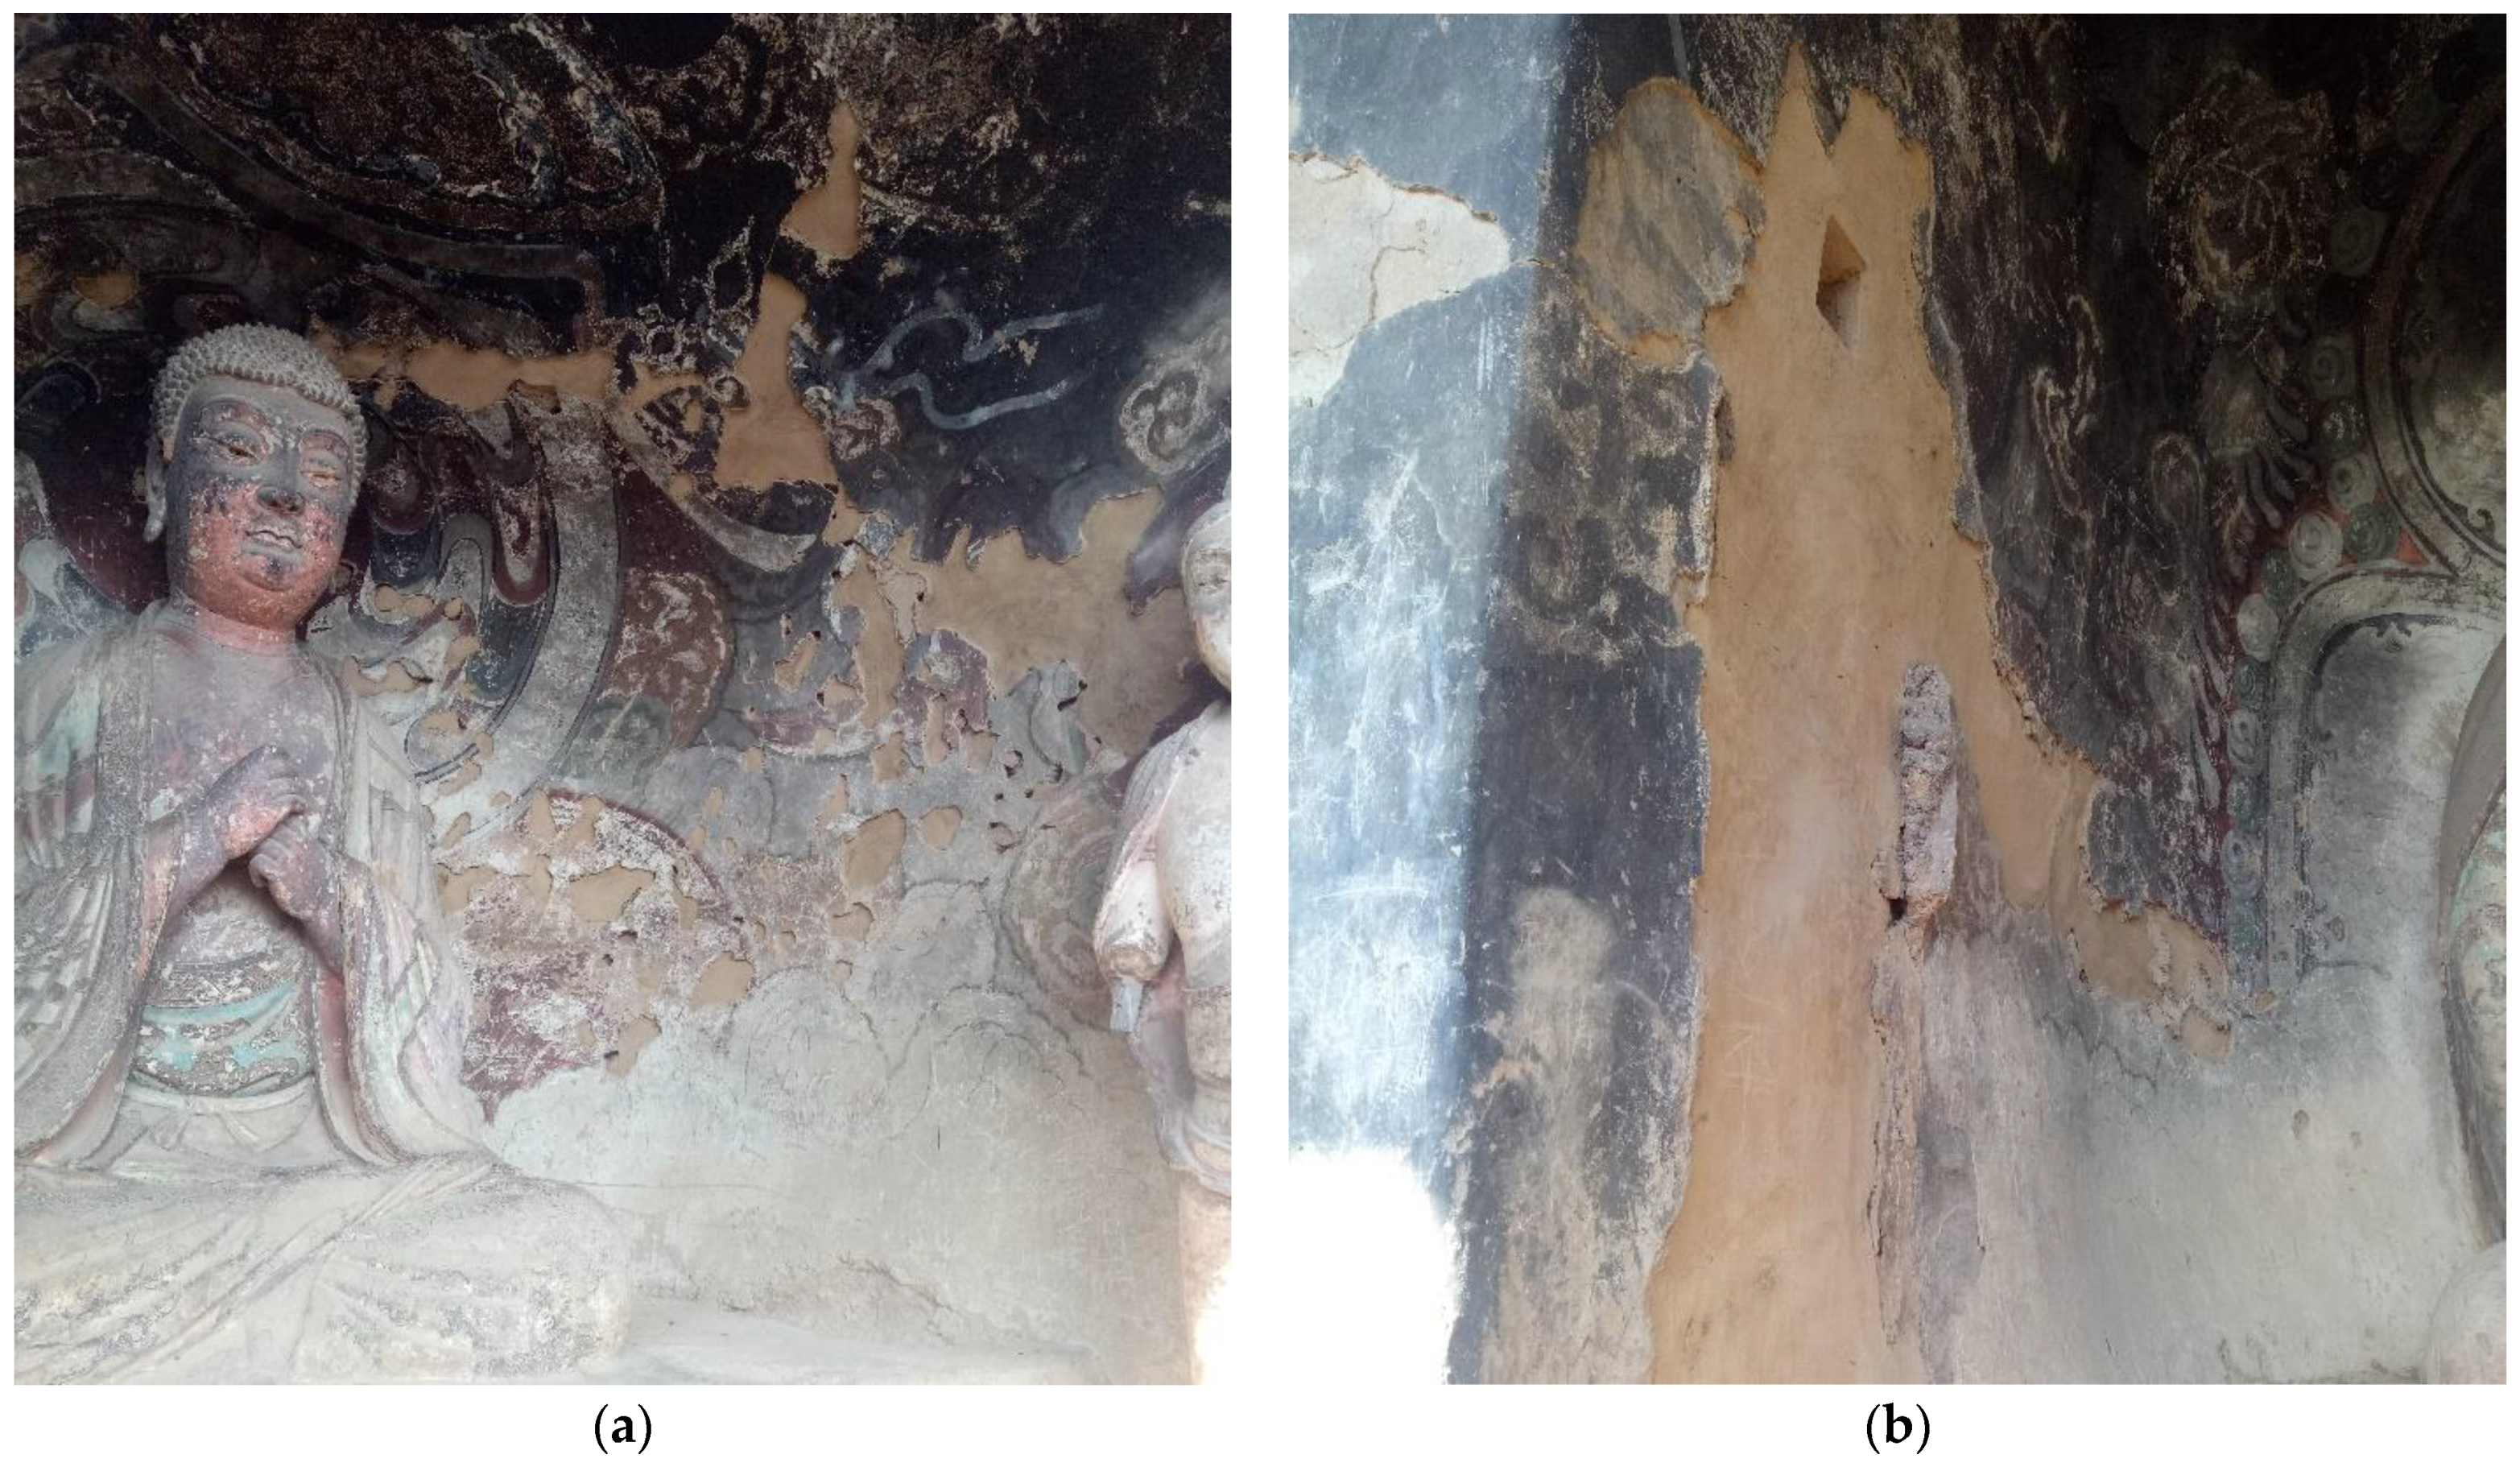
:1. Introduction
2. Experimental Methods and Detection Techniques
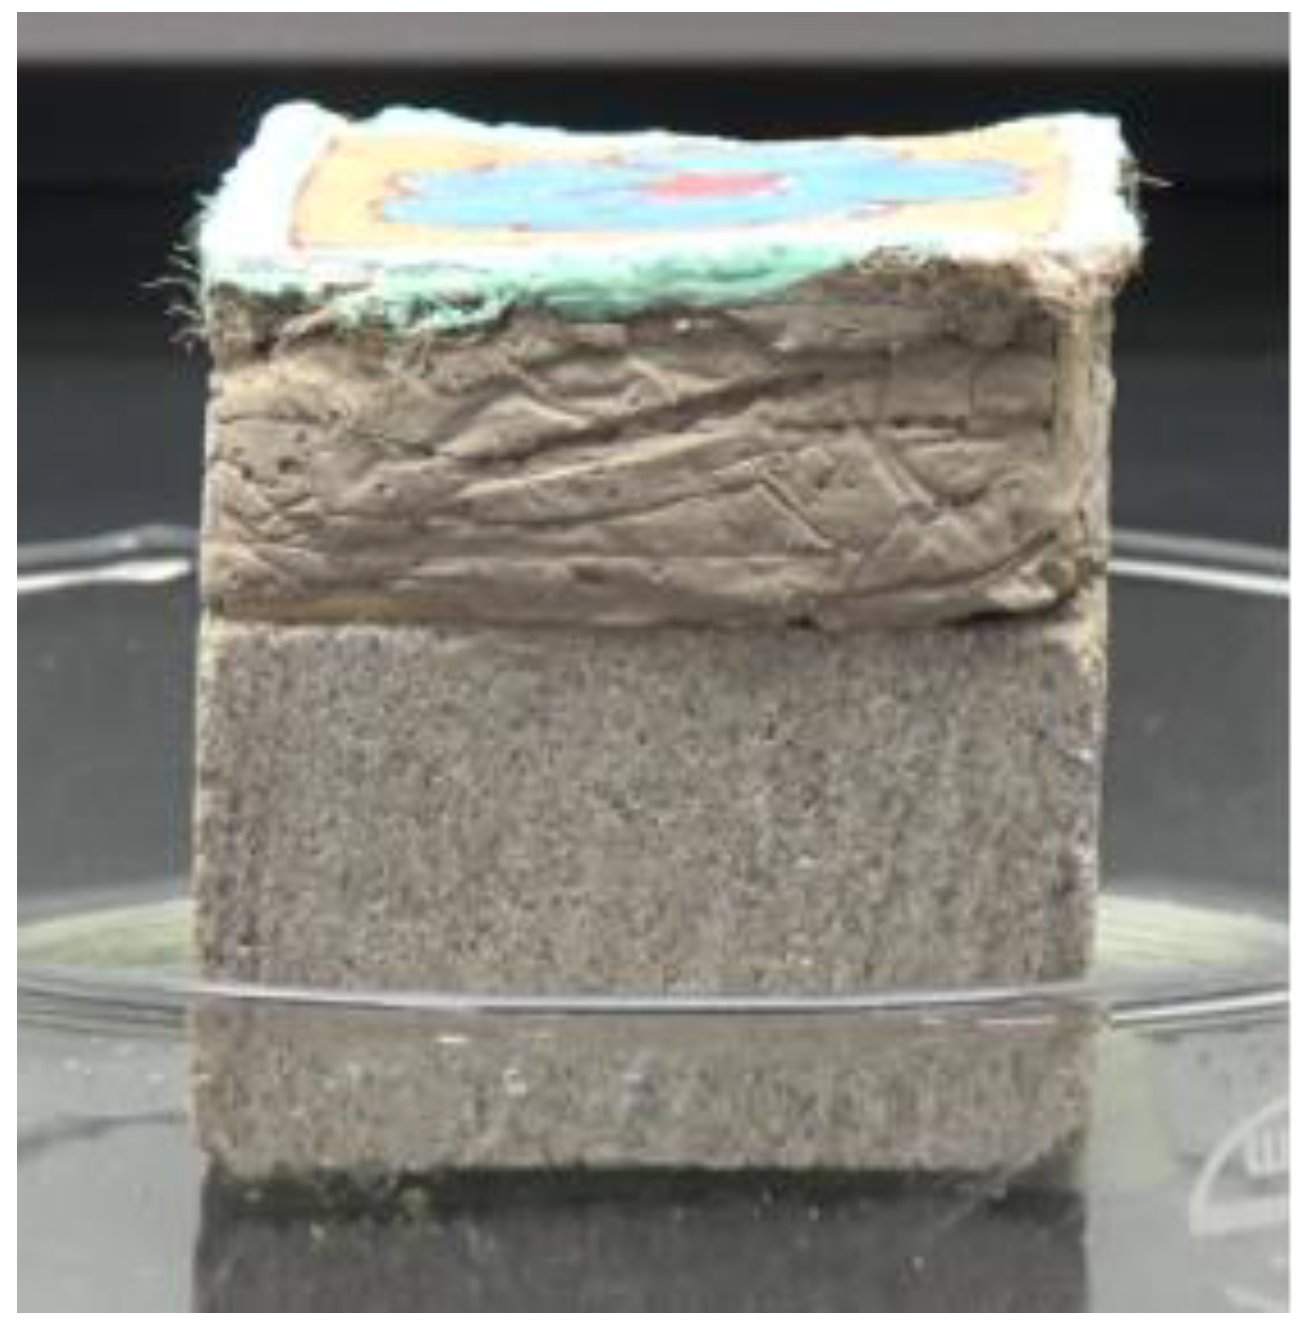
2.1. Preparation of Simulated Wall Painting Samples
2.2. Experimental Methods and Characterization of Results
2.2.1. Observation of the Transport and Crystallization of a Salt Solution in a Simulated Wall Painting Sample
2.2.2. Micromorphological Analysis of Crystals
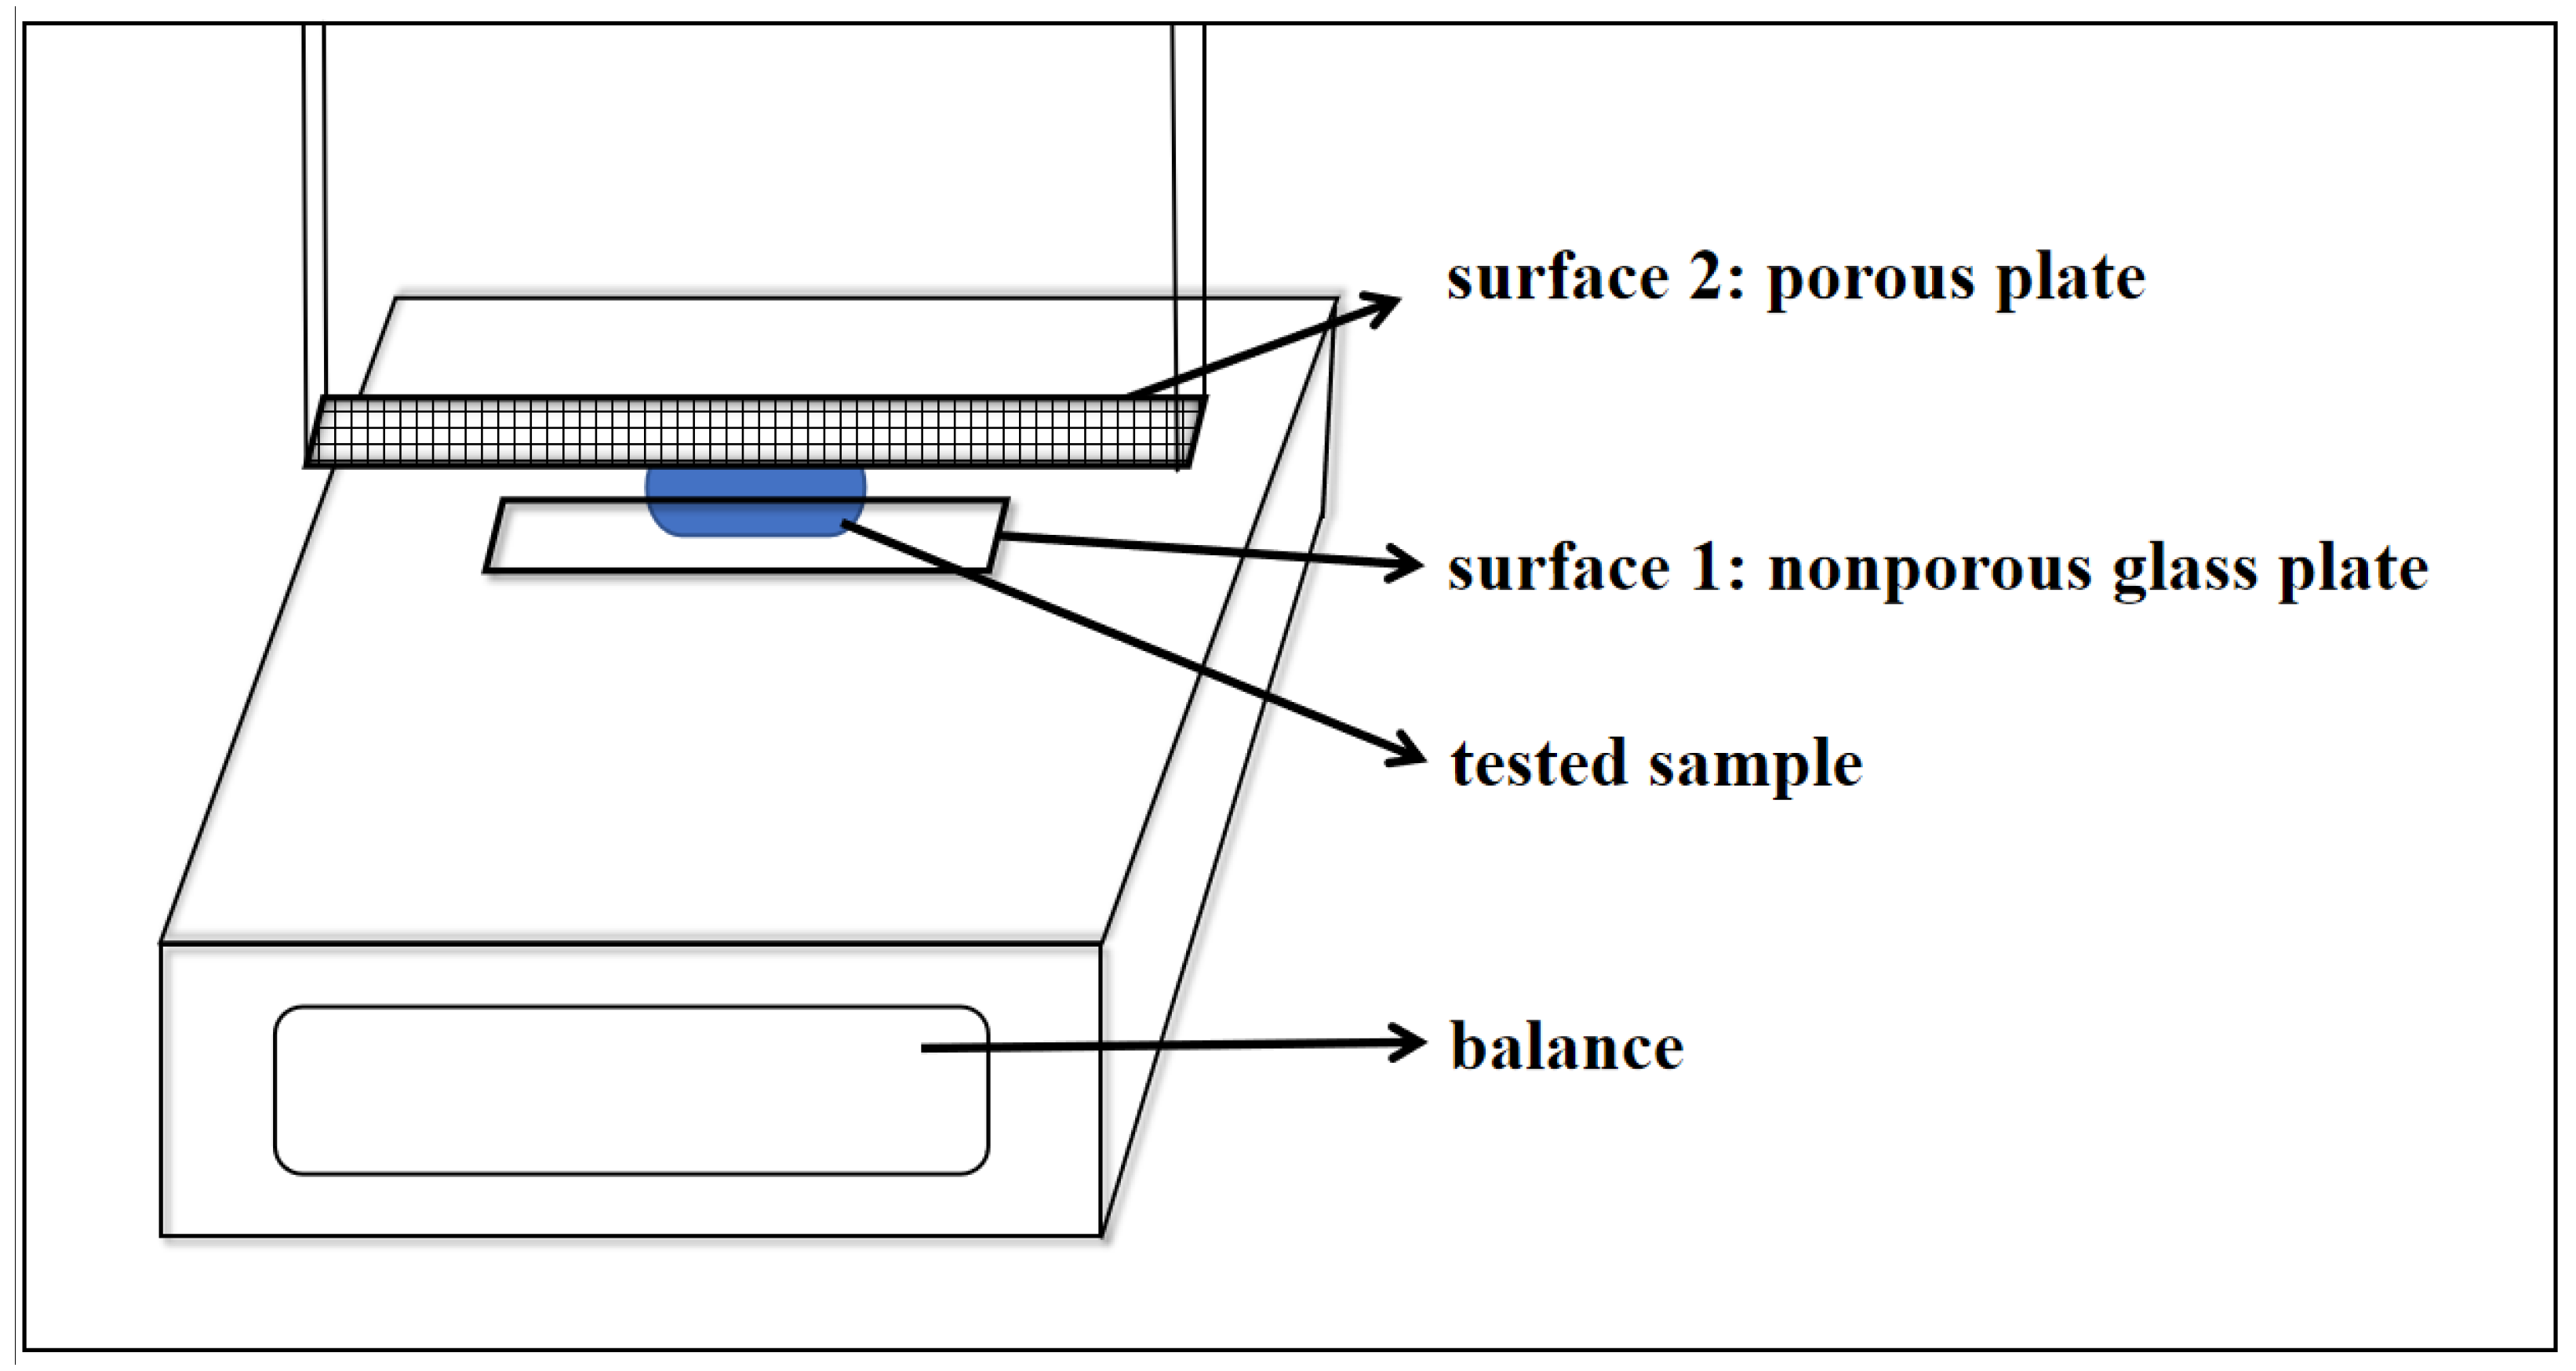
2.2.3. Micro-Force Test
3. Results and Discussion
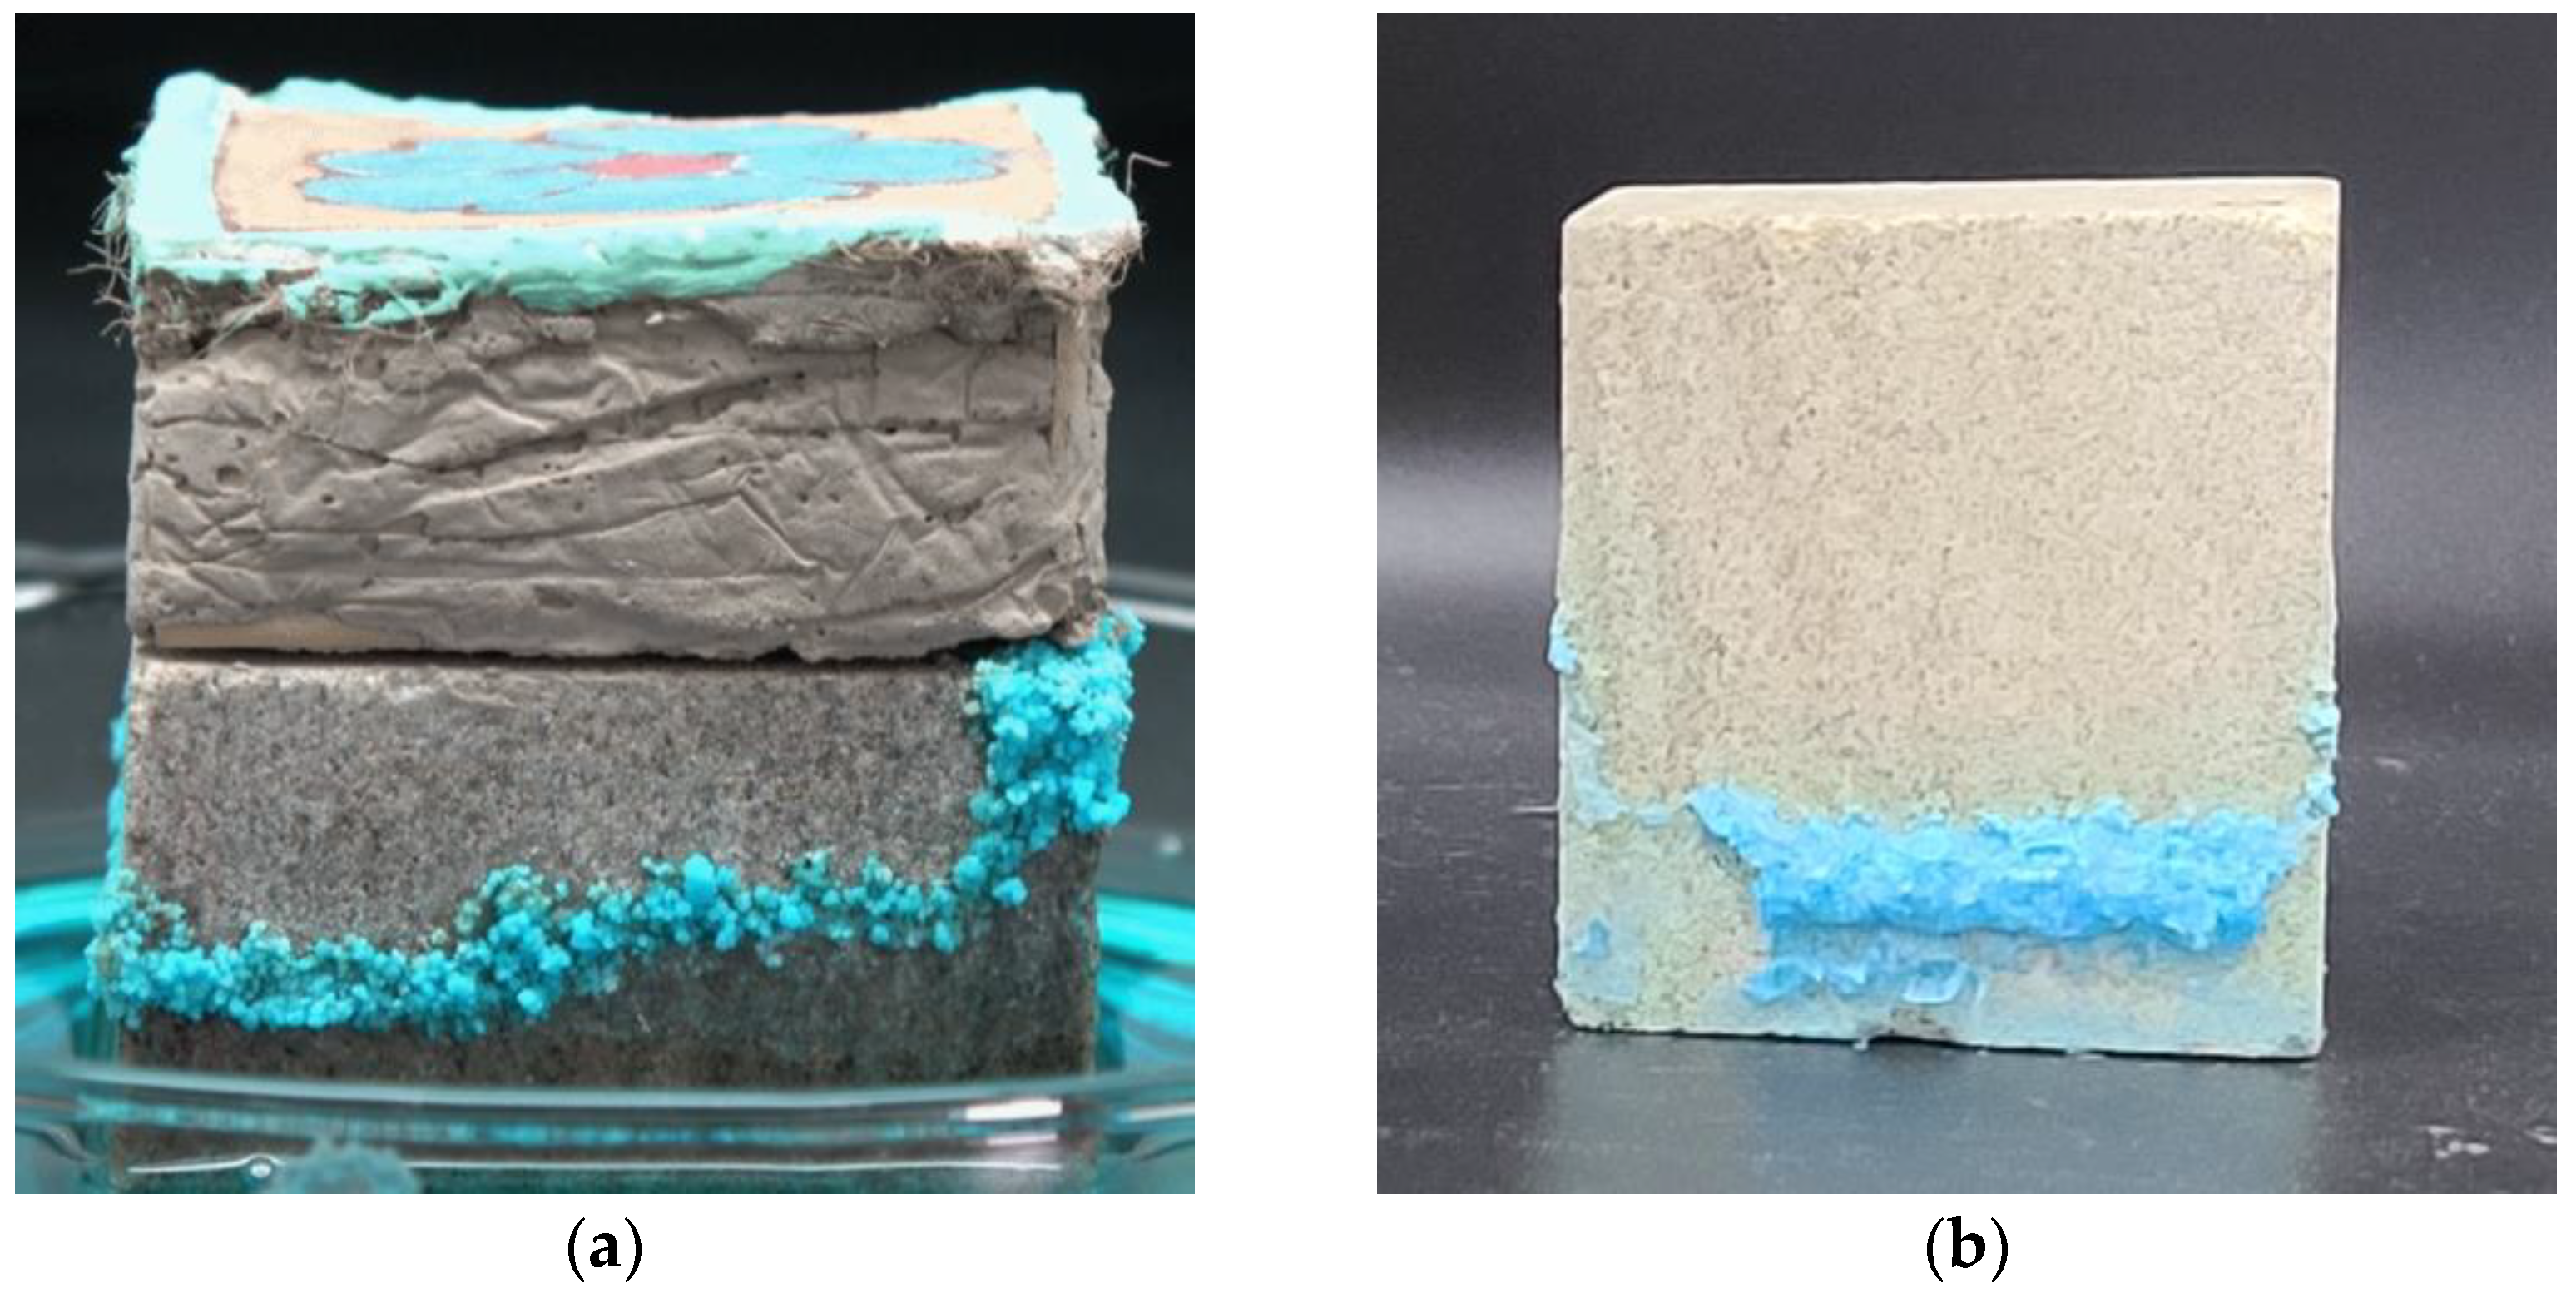
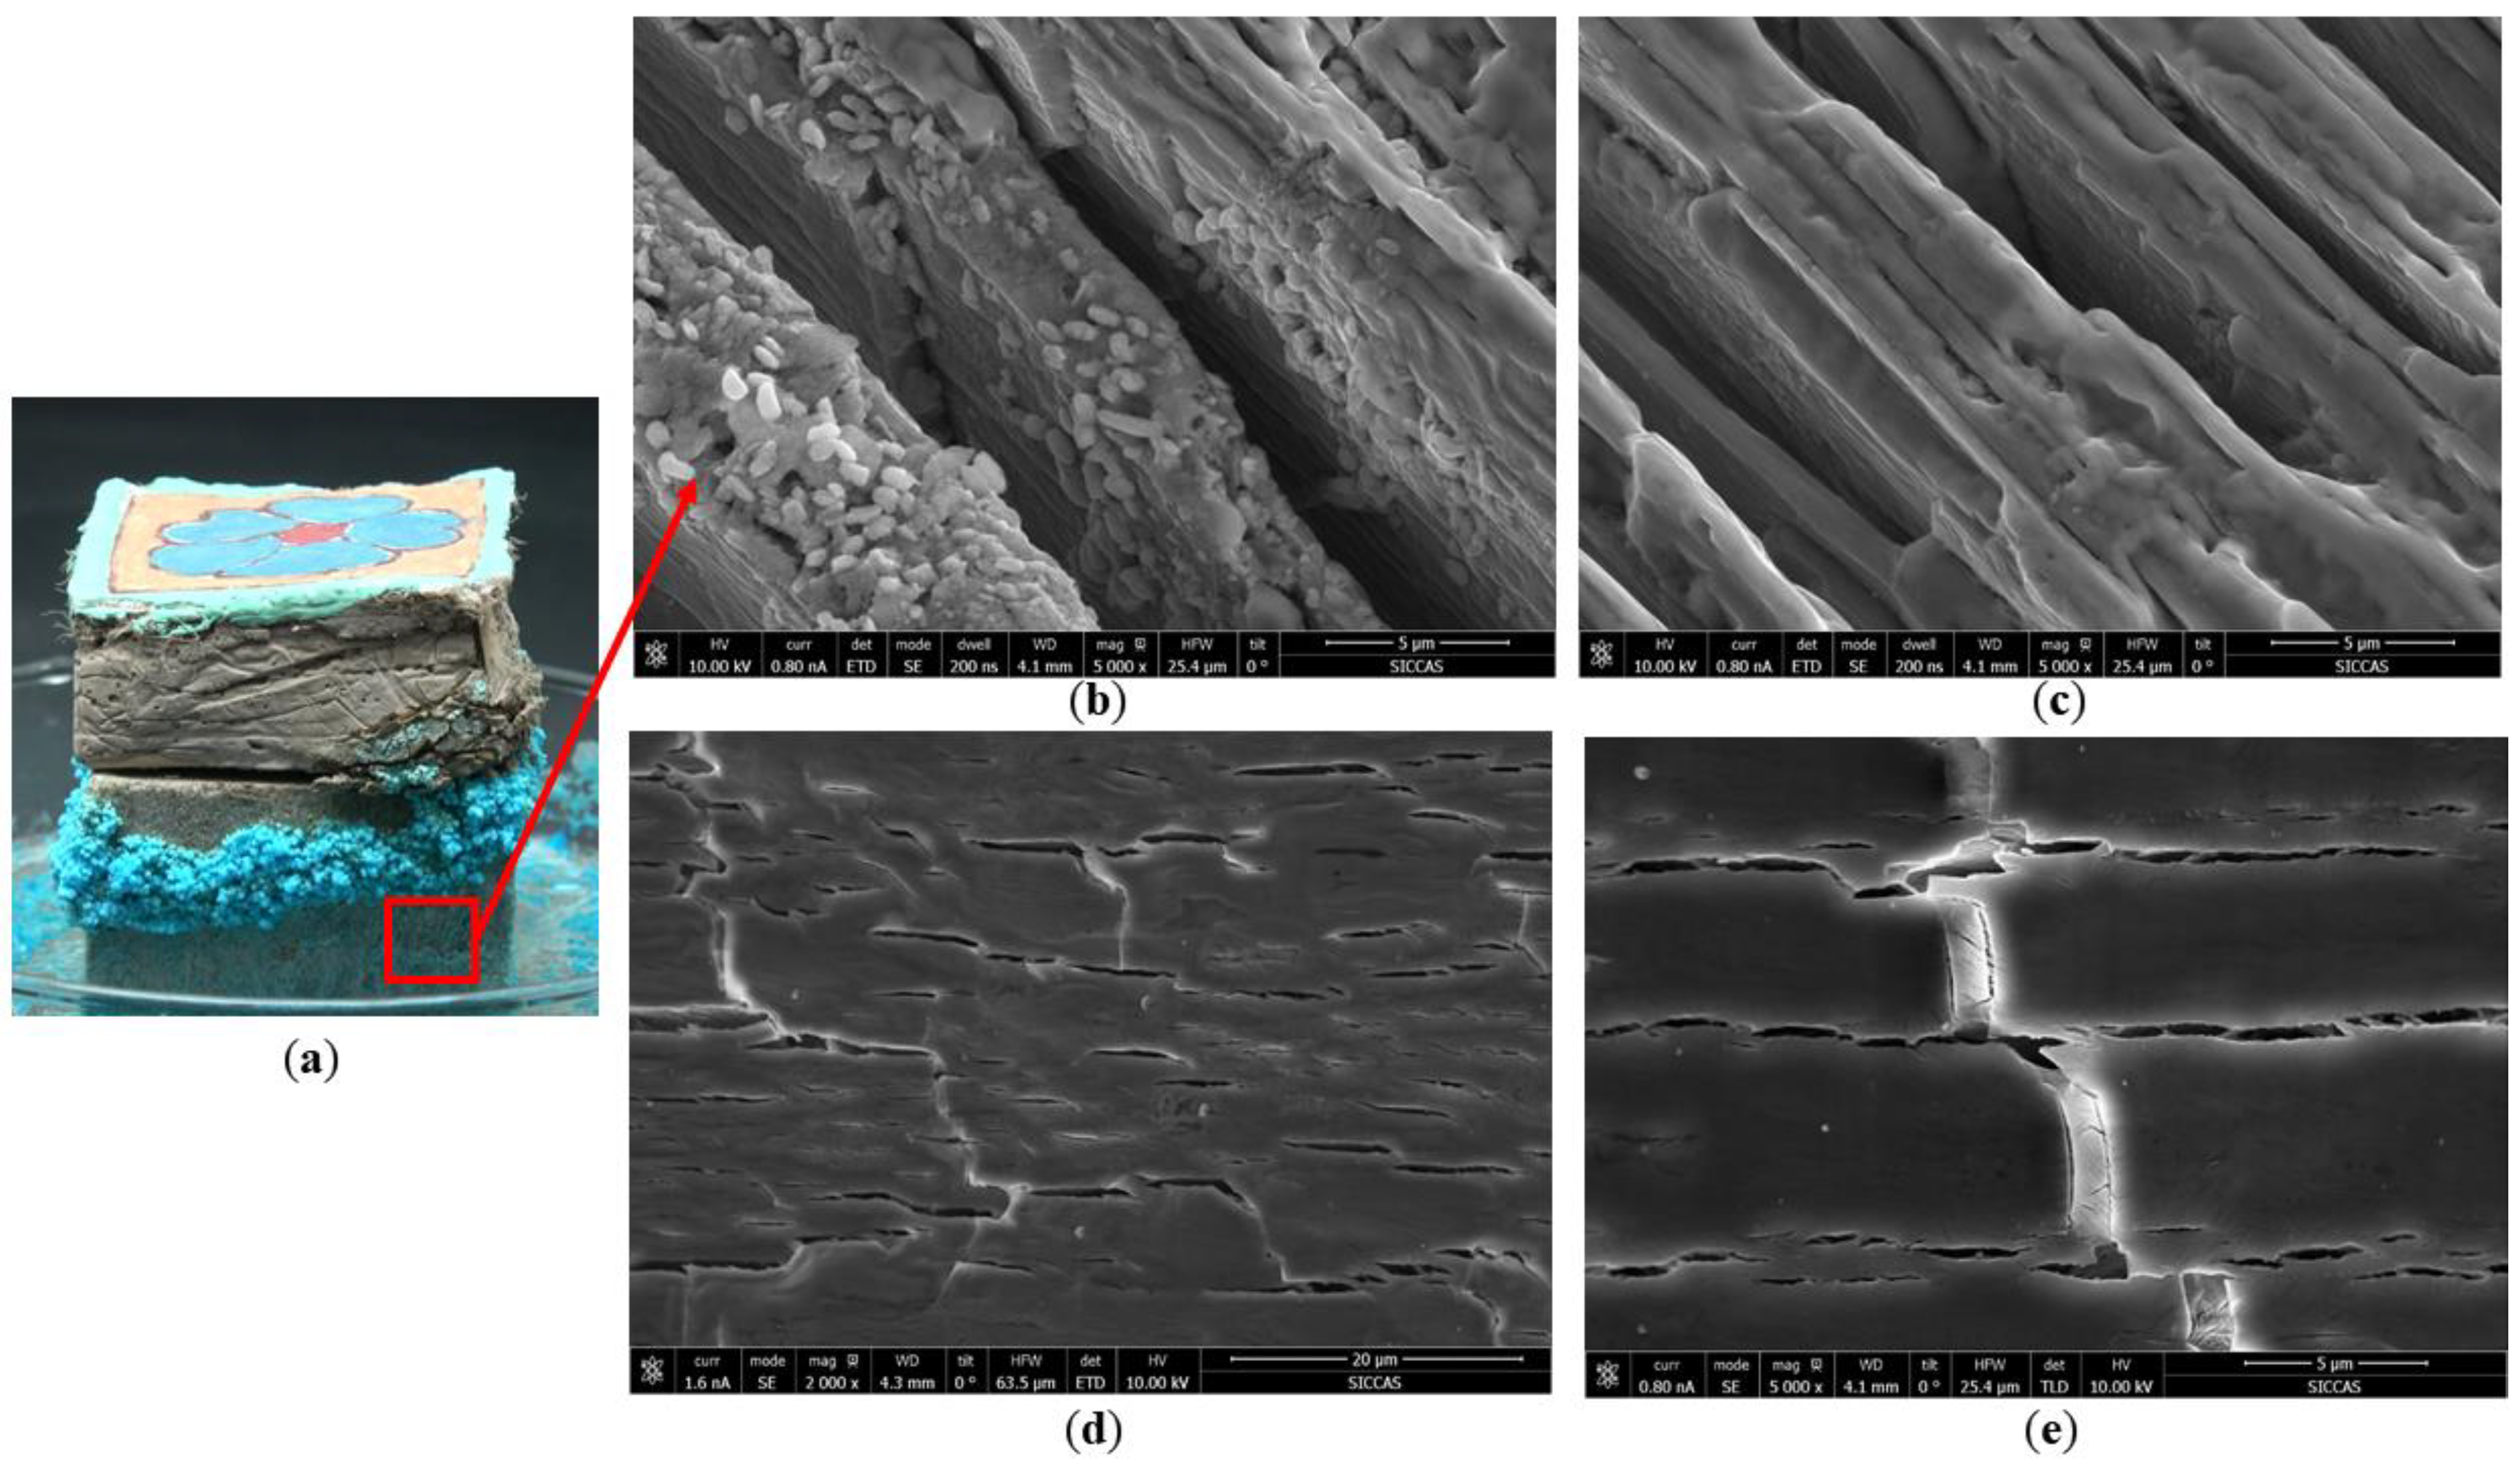
3.1. Transport and Crystallization of the Salt Solution in the Simulated Wall Painting Sample
3.2. Transport and Crystallization of a Salt Solution in the Simulated Coarse Plaster and Paint Layers
3.3. Micro-Forces Generated by the Salt Solution in the Changing Process
3.3.1. Micro-Forces Generated by the Salt Solution
3.3.2. Micro-Forces Generated by the Salt Solution in Coarse Plaster
4. Conclusions
- (1)
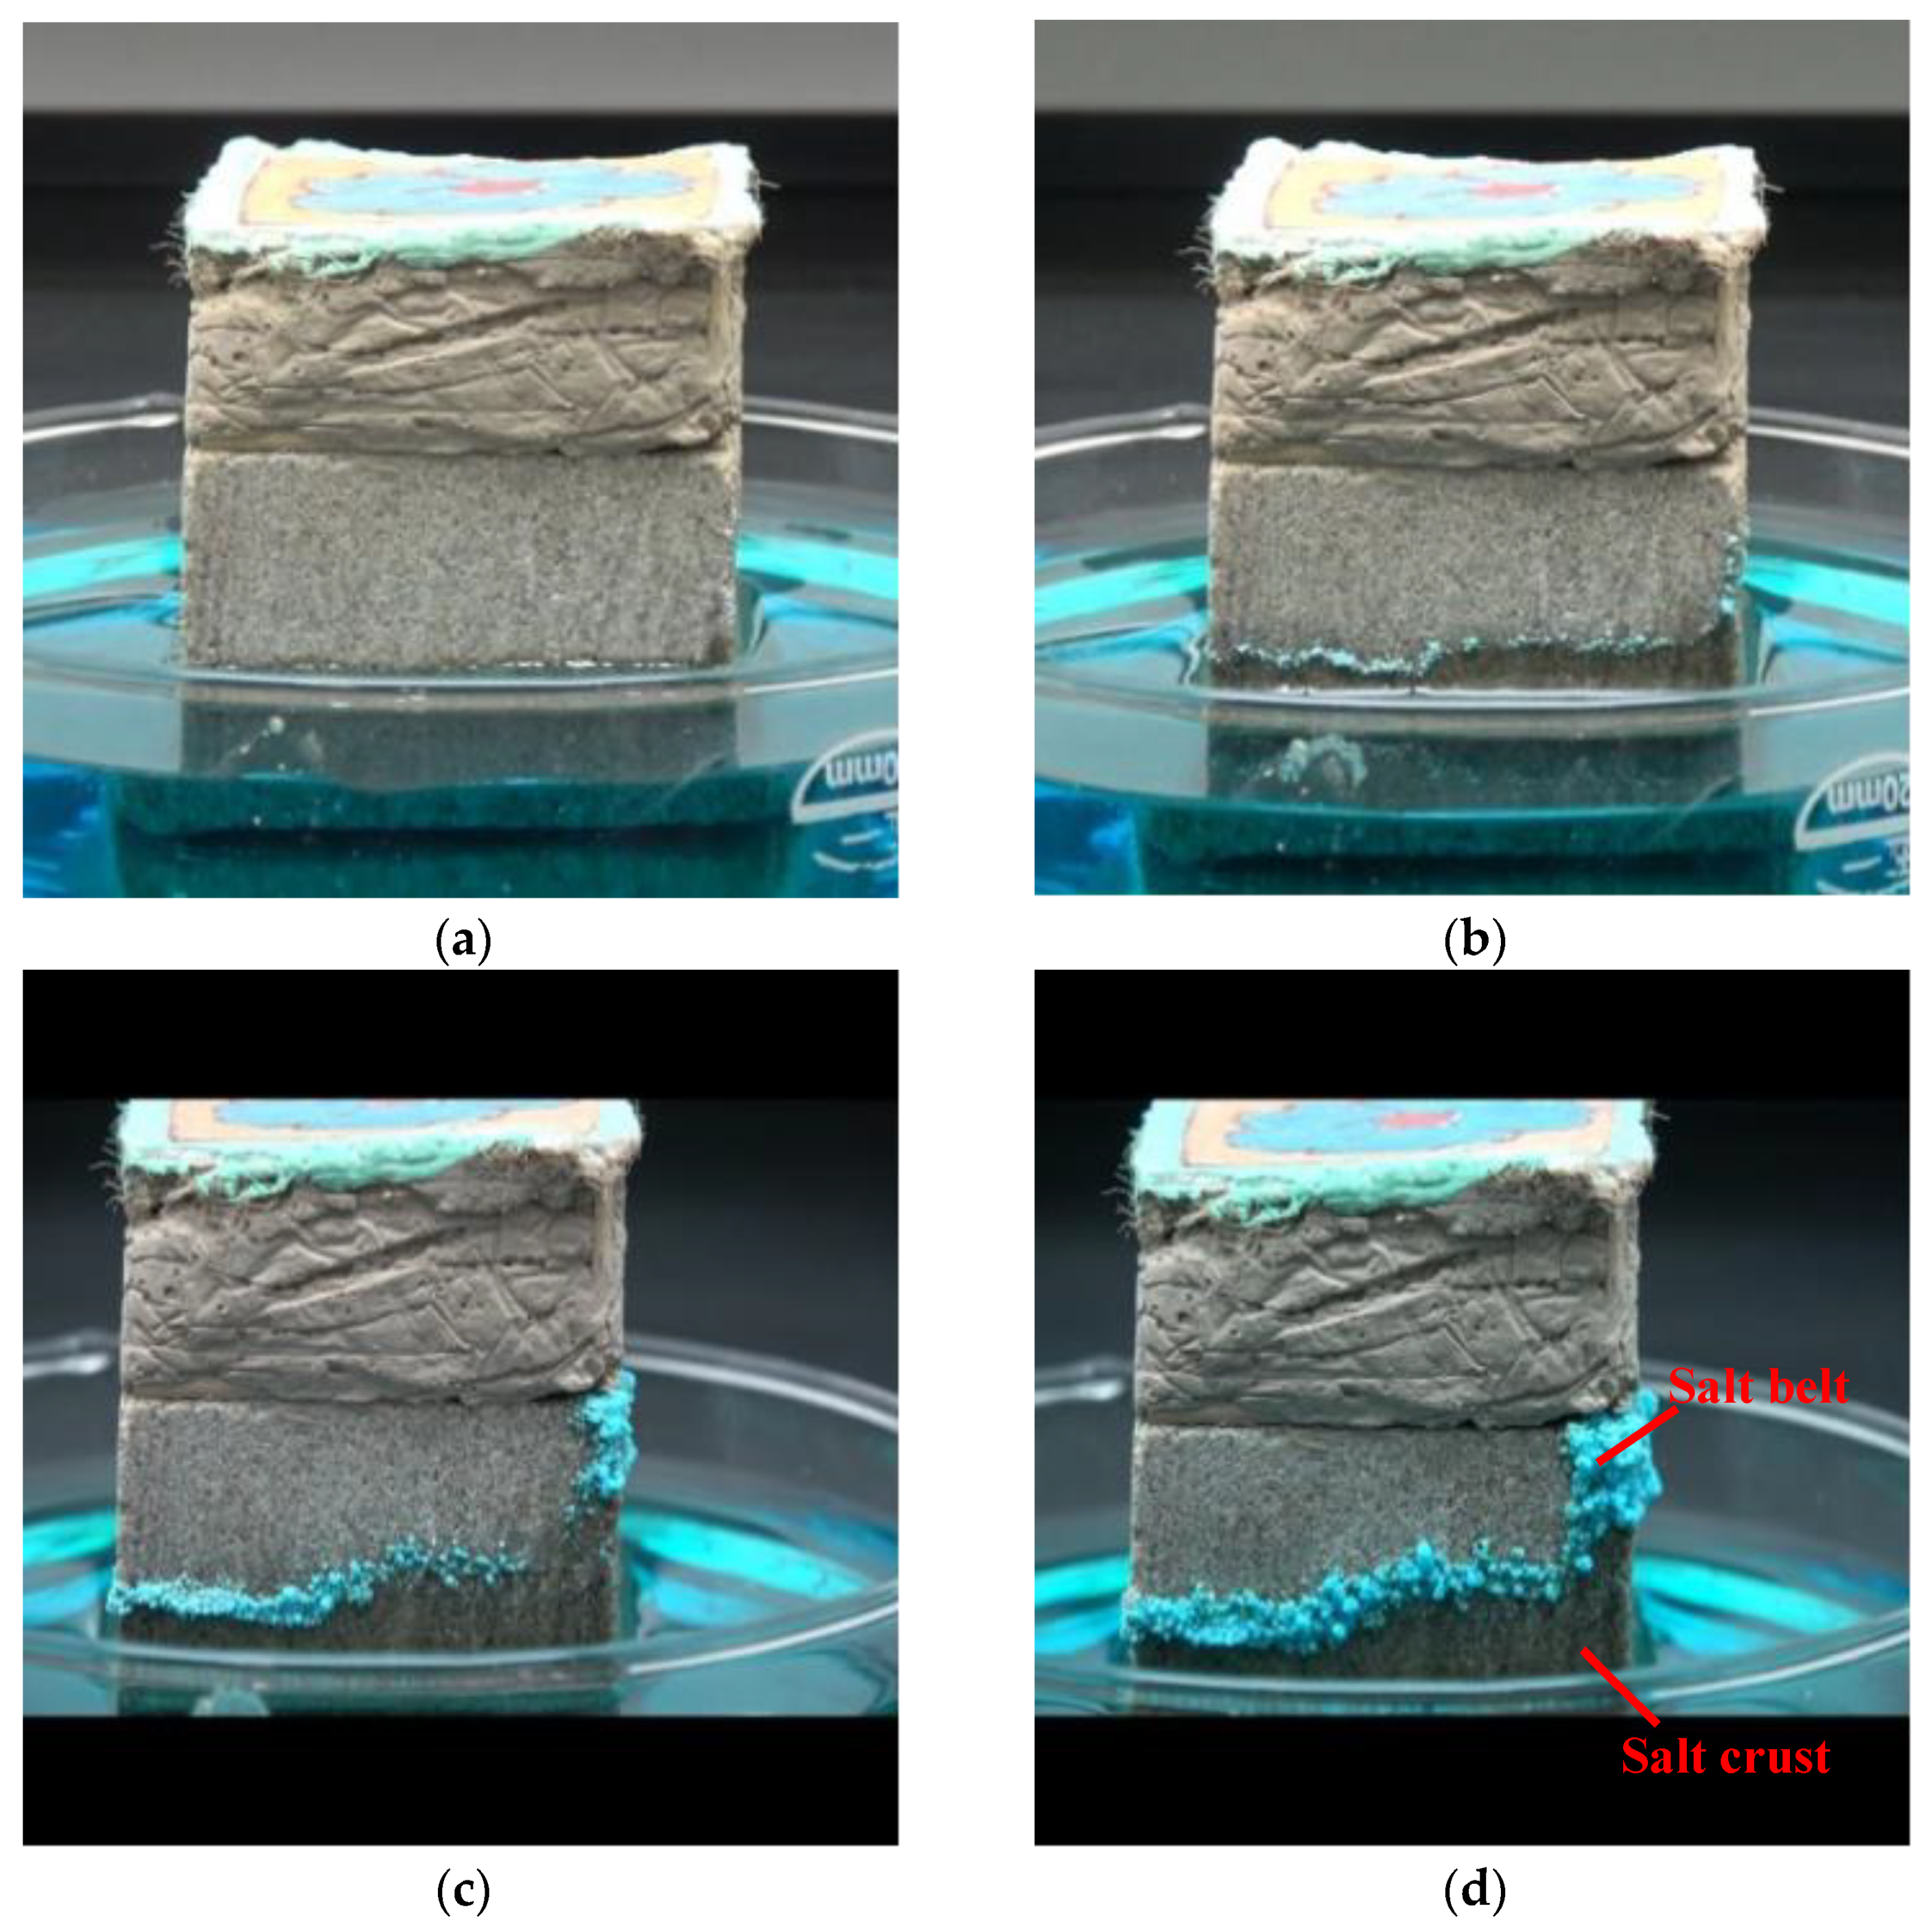
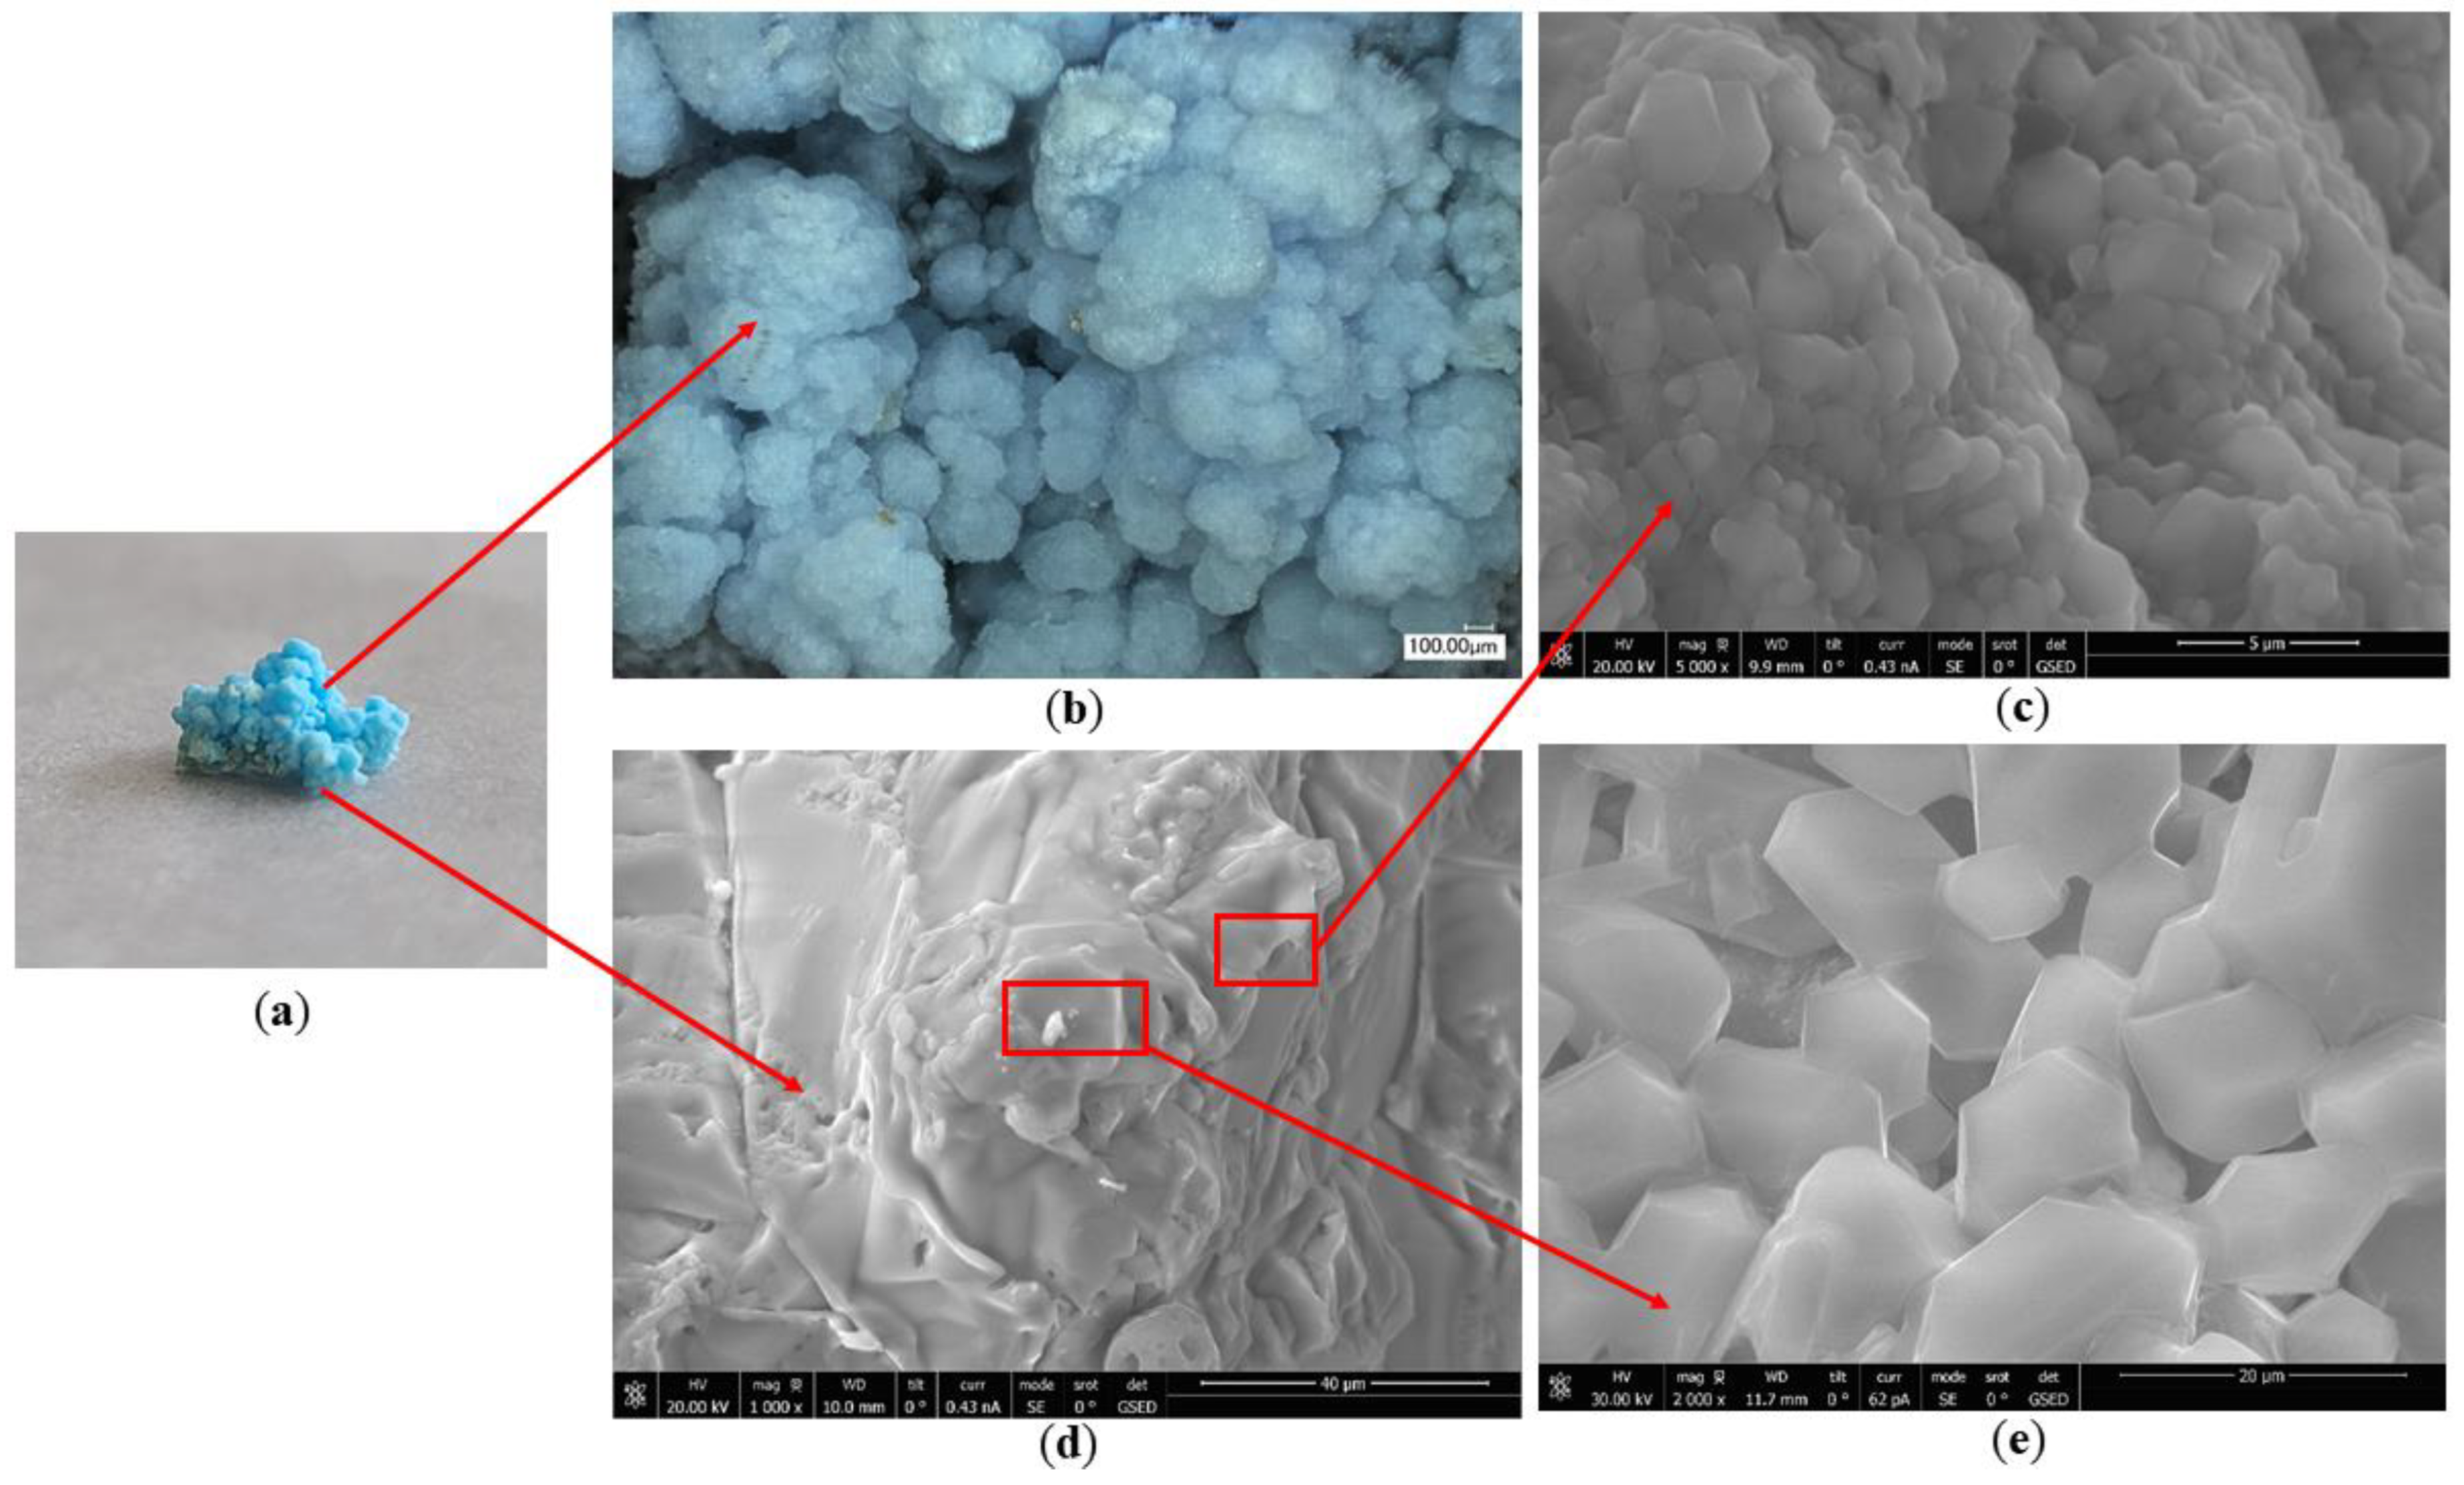
- Chromogenic CuSO4 solution formed two different shapes: a salt belt formed by clustered crystals and a salt crust layer below the salt belt. In the salt belt, the clustered crystals were larger in size, mainly presenting a ladder accumulation of 1.25–5.00 µm particles. The size of the crystals forming the salt crust were smaller, mainly particles of 0.01–0.50 µm, presenting a lamellar accumulation with a thickness of about 3–5 µm. It is speculated that the differences in crystal morphology are related to the growth conditions.
- (2)
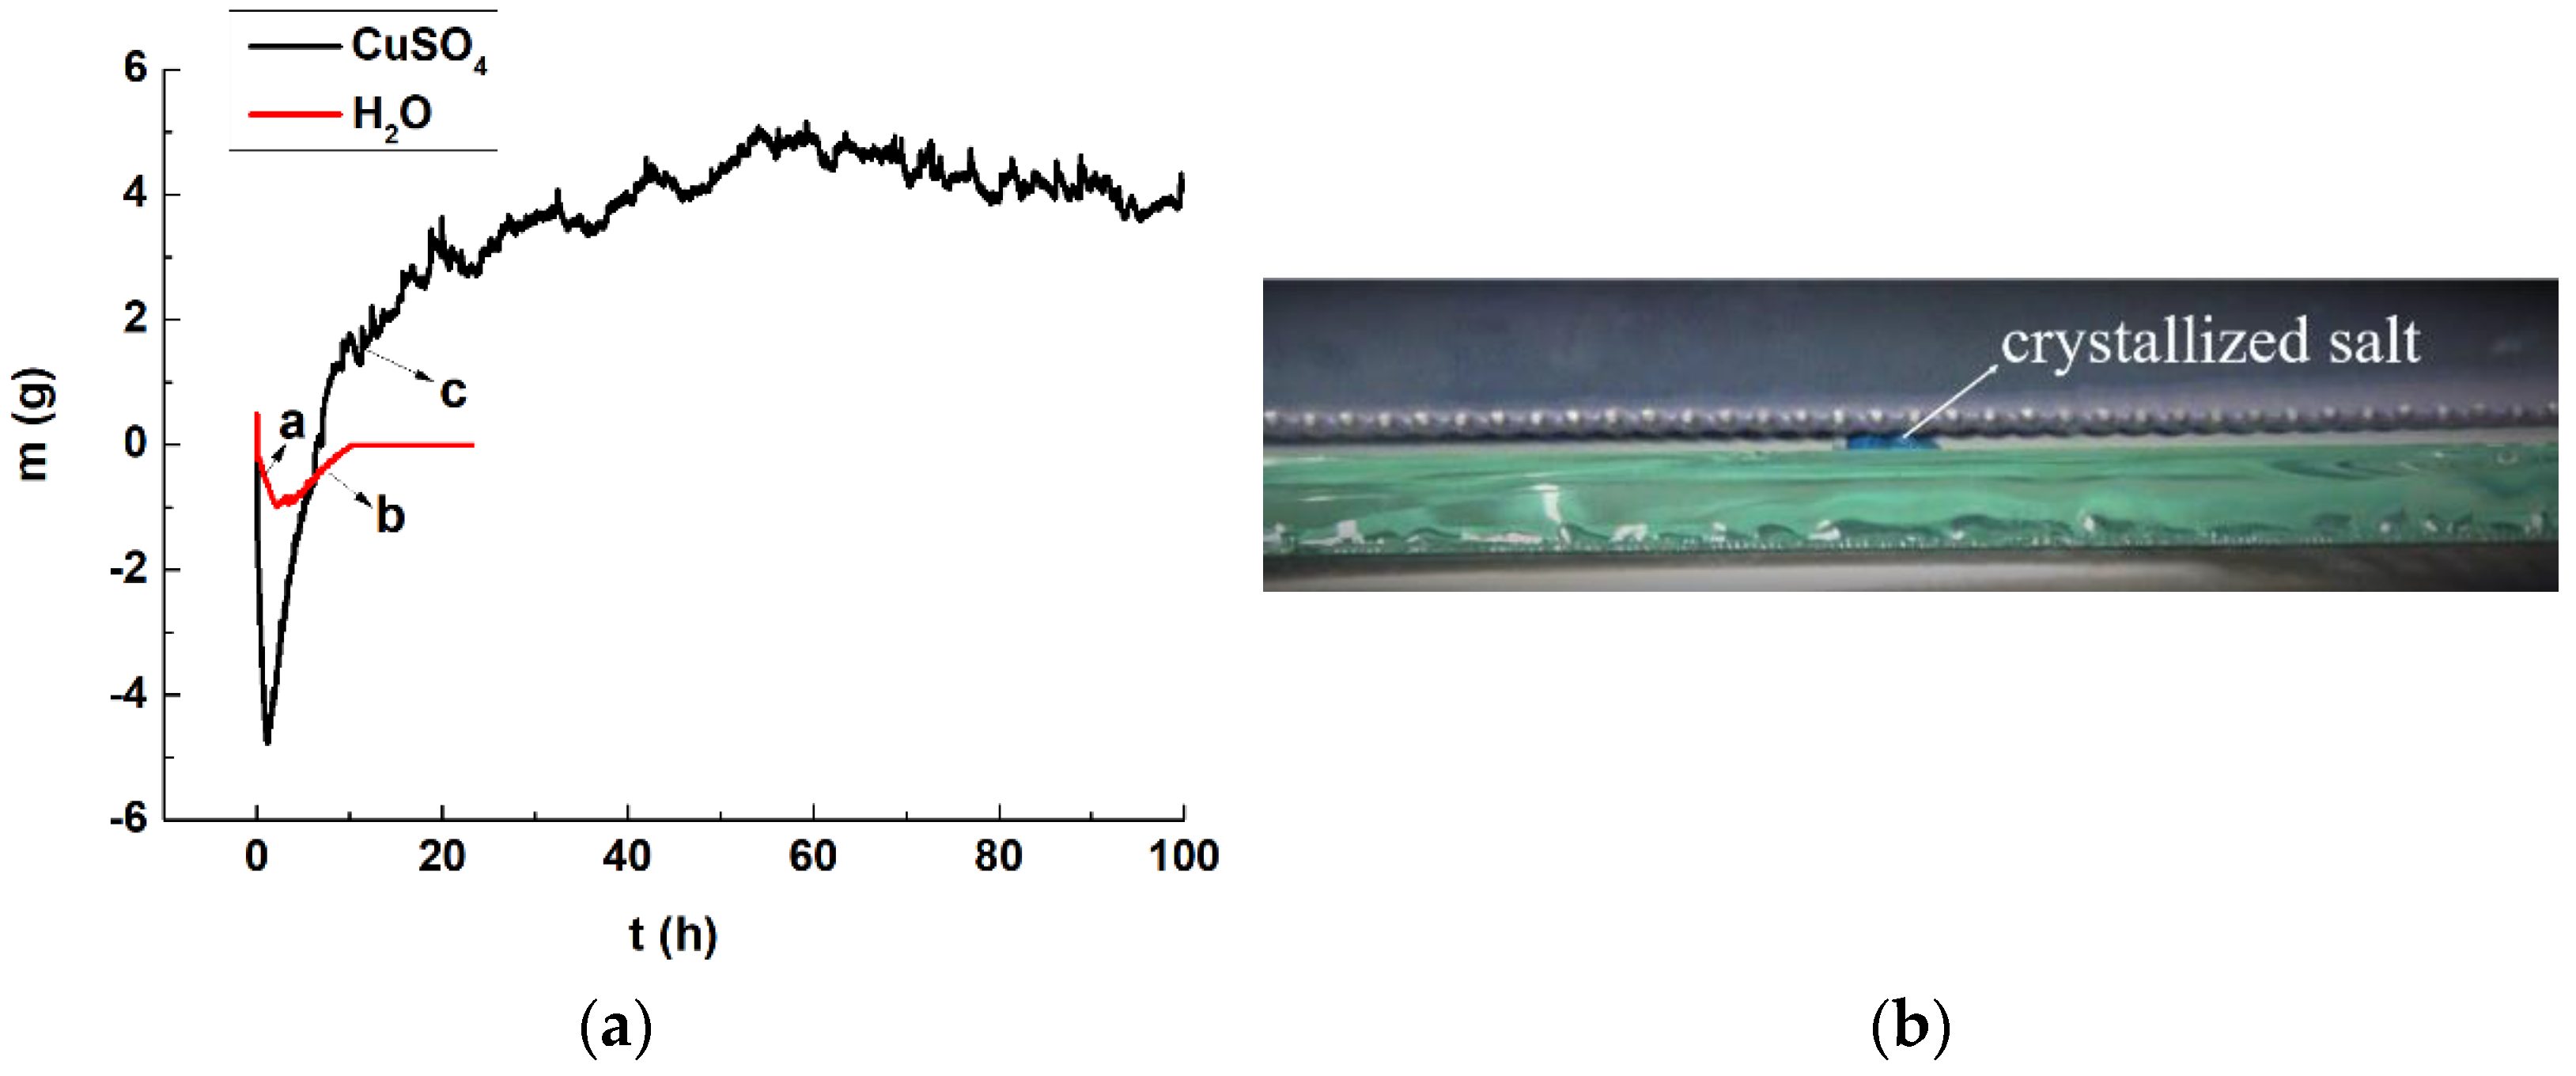
- The crystallization of the salt solution in the simulated wall painting sample weakened the bonding between the supporting body and the coarse plaster, resulting in the micro-deformation of the coarse plaster. Furthermore, the effect of the salt solution on the sample consisting of coarse plaster and a paint layer resulted in changes in the appearance change of the sample, from an initial cylinder to an irregular round table. The maximum expansion rate was about 43.85%, and the overall expansion rate was about 24.18%.
- (3)
- The double-layer surface contact internal pressure method showed that the main forces generated by the salt solution were an expansion force on the contact surfaces during crystallization and crystal growth, and a suction force generated when the crystals lost water and shrank. The expansion and suction forces were not stable and led to the contact surfaces continuously bending and stretching. Under the controlled experimental conditions, the maximum force on the double-layer surfaces reached about 0.049 N when the content of the solute was 0.025 g.
- (4)
- The process of “crystals’ crystallization and deliquescence” and “sample’s expansion and shrinkage” alternately changed. This was inferred to be related to the laminar flow of the solution in the sample, with the crystallization deliquescence of the salt solution accelerating the discontinuity in laminar flow. Due to the anisotropic nature of the materials used in wall paintings, compared with pure water, salt solutions can aggravate the loss of connectivity between different materials.
Supplementary Materials
Author Contributions
Funding
Institutional Review Board Statement
Informed Consent Statement
Data Availability Statement
Conflicts of Interest
References
- Ma, H. A summary of the influence of salt on ancient murals. Identif. Apprec. Cult. Relics 2022, 22, 63–65. [Google Scholar] [CrossRef]
- Yue, Y.Q. Condition Surveys of Deterioration and Research of Wall Paintings in Maijishan Cave-temple. Res. Herit. Preserv. 2019, 4, 127–131. [Google Scholar] [CrossRef]
- Yu, Z.R.; Wang, Y.W.; Wang, X.W.; Zhao, L.Y.; Guo, Q.L.; Wang, X.D. Research on the Water Vapor Source Induced Diseases of Wall Paintings in Longxing Temple. Adv. Earth Sci. 2017, 32, 668–676. [Google Scholar] [CrossRef]
- Wang, J.F. Salt deterioration and soluble salt characteristics of porous materials. Gansu Sci. Technol. 2011, 27, 55–58. [Google Scholar] [CrossRef]
- Su, Z.Y.; Yang, B.Z.; Zhang, H.Y. Soluble salt distribution and environmental monitoring of Cave 276 in the Mogao Grottoes. J. Lanzhou Univ. Nat. Sci. 2021, 57, 226–232. [Google Scholar] [CrossRef]
- Li, F.J.; Wang, X.D.; Guo, Q.L. Adsorbed Moisture Feature and Suction Variation Characteristics of Earthen plaster in Mogao Grottoes under Influence of Humidity. J. Eng. Geol. 2021, 29, 1188–1198. [Google Scholar] [CrossRef]
- Zhao, J.; Luo, H.J.; Huang, X. Migration, Distribution, and Crystallization of NaCl and Na2SO4 Solutions in Three Different Media. Crystals 2020, 10, 444. [Google Scholar] [CrossRef]
- Zheng, Z.H. Experimental investigation on state transform of sodium sulfate and its damaging effect on ancient mural in tomb of Princess Yongtai. J. Nat. Disasters 2020, 29, 158–163. [Google Scholar] [CrossRef]
- Godts, S.; Hayen, R.; De Clercq, H. Investigating salt decay of stone materials related to the environment, a case study in the St. James church in Liege, Belgium. Stud. Conserv. 2017, 62, 329–342. [Google Scholar] [CrossRef]
- Wang, J.L.; Zhang, Y.D.; Wu, Y.Q.; Liu, H.L.; Wang, X.D. Influence of Salt/Water Ratio on Emergence and Developing Rate of Mural Disruption. Surf. Technol. 2017, 46, 1–7. [Google Scholar] [CrossRef]
- Roberto, G.; Elena, M.M.; Mariano, C.; Emanuele, C. Deterioration of building materials and artworks in the ‘Santa Maria della Stella’ church, Saluzzo (Italy): Causes of decay and possible remedies. Stud. Conserv. 2017, 62, 474–493. [Google Scholar] [CrossRef]
- Jin, Z.L.; Liu, D.D.; Zhang, Y.K.; Chen, G.Q.; Xia, Y.; Su, B.M.; Zhou, T.; Lv, G.X.; Luo, H.J. Salt migrations and damage mechanism in cultural heritage objects. Sci. Conserv. Archaeol. 2017, 29, 102–116. [Google Scholar] [CrossRef]
- Jin, Z.L.; Chen, G.Q.; Qian, L.; Su, B.M.; Lv, G.X. Study on the mechanism of salt damages on the mural paintings of mogao grottoes. Chem. Res. App. 2009, 21, 450–454. [Google Scholar] [CrossRef]
- Jin, Z.L.; Chen, G.Q.; Qian, L.; Su, B.M.; Lv, G.X. Study on salt damage mechanism of murals in Mogao Grottoes (I). Dunhuang Res. 2008, 6, 50–53. [Google Scholar] [CrossRef]
- Jin, Z.L.; Chen, G.Q.; Qian, L.; Su, B.M.; Lv, G.X. Study on salt damage mechanism of murals in Mogao Grottoes (II). Dunhuang Res. 2009, 3, 100–102. [Google Scholar] [CrossRef]
- Jin, Z.L.; Chen, G.Q.; Xia, Y.; Su, B.M.; Zhou, T.; Lv, G.X. Comparative study of salt damage caused by sulfates and chlorides to mural paintings—Evidence of superpenetration, migration and crystallization destruction resulting from sodium sulfate. Sci. Conserv. Archaeol. 2015, 21, 29–38. [Google Scholar] [CrossRef]
- Wang, Y.J.; Yu, Q.L.; Yan, M.; Ma, L.Y.; Chen, G.Q. Research on the mobility of soluble salts for north temple murals. Sci. Conserv. Archaeol. 2010, 22, 15–20. [Google Scholar] [CrossRef]
- Su, B.M. Salt damage and daily maintenance of Dunhuang wall paintings. Dunhuang Res. 2010, 6, 14–16. [Google Scholar] [CrossRef]
- Vettori, S.; Bracci, S.; Cantisani, E.; Riminesi, C.; Sacchi, B.; D’Andria, F. A multi-analytical approach to investigate the state of conservation of the wall paintings of Insula 104 in Hierapolis (Turkey). Microchem. J. 2016, 128, 279–287. [Google Scholar] [CrossRef]
- Moussa, A.M.A.; Kantiranis, N.; Voudouris, K.S.; Stratis, J.A.; Christmas, M.F.A. The impact of soluble salts on the deterioration of pharaonic and coptic wall paintings at Al Qurna, Egypt: Mineralogy and chemistry. Archaeometry 2009, 51, 292–308. [Google Scholar] [CrossRef]
- Raphael, A.J.W.; Christian, S. The Origin of Soluble Salts in Rocks of the Thebes Mountains, Egypt: The Damage Potential to Ancient Egyptian Wall Art. J. Archaeol. Sci. 2000, 27, 1161–1172. [Google Scholar] [CrossRef]
- Chen, G.Q.; Hu, H.Y.; Li, Y.F.; Li, Z.; Jin, Z.L.; Qian, L.; Shui, B.W.; Lv, G.X. Micro-morphology and Composition of Mural Herpes in Mogao Grottoes. Surf. Technol. 2016, 45, 162–167. [Google Scholar] [CrossRef]
- Rong, Y.; Li, Y.H.; Wang, B.D. Study on damaged situation of the Xigou No.4 and No.5 tombs in Jiuquan. J. Shaanxi Norm. Univ. Nat. Sci. 2015, 43, 47–52. [Google Scholar] [CrossRef]
- Olmi, R.; Bini, M.; Ignesti, A.; Priori, P.; Riminesi, C.; Felici, A. Diagnostics and monitoring of frescoes using evanescent-field dielectrometry. Meas. Sci. Technol. 2006, 17, 2281–2288. [Google Scholar] [CrossRef]
- Wei, R.; Liu, C. Investigation and analysis of soluble salt in architectural wall paintings of Fengguo temple in Liaoning Province. Identif. Apprec. Cult. Relic 2018, 13, 92–93. [Google Scholar] [CrossRef]
- Li, J.M.; Tao, L.Y.; Zhang, B.J.; Zhang, H.; He, X.; Fan, Z.X.; Su, B.M. Laboratory simulation of the process of soluble salt damage to ancient grotto murals. Sci. Conserv. Archaeol. 2014, 26, 37–45. [Google Scholar] [CrossRef]
- Du, H.Y.; Zhou, L.; Su, B.M.; Hu, Z.D. Rapid detection and analysis of salt damage in Dunhuang murals by capillary electrophoresis. Dunhuang Res. 2009, 6, 44–49. [Google Scholar] [CrossRef]
- Zhou, L.; Du, H.Y.; Chen, G.Q.; Su, B.M.; Hu, Z.D. Growth Process &Features and Influencing Factors on Gully of The No. 4 Tomb in The Western Xia Mausoleums. Dunhuang Res. 2009, 6, 50–54. [Google Scholar] [CrossRef]
- Su, B.M.; Chen, G.Q.; Fan, Z.X.; Ma, J.T.; Kang, H.W.; Li, R. The Application Research of a New Synthesized Desalination Material on the Treatment of Salting Damage Wall Paintings in Mogao Grottoes. Relics Museol. 2009, 6, 175–183. [Google Scholar] [CrossRef]
- Chen, G.Q.; Fan, Z.X.; Yu, Q.L.; Su, B.M.; Li, Y.F.; Qiao, H.; Tang, W. Primary Test of Desalination to Treat the Disrupted Wall Painting in Cang Jie Temple of Baishui, Shaanxi Province. Dunhuang Res. 2009, 6, 8–12. [Google Scholar] [CrossRef]
- Zehnder, K.; Arnold, A. Crystal growth in salt efflorescence. J. Cryst. Growth. 1989, 97, 513–521. [Google Scholar] [CrossRef]
- Espinosa-Marzal, R.M.; Scherer, G.W. Advances in understanding damage by salt crystallization. Acc. Chem. Res. 2010, 43, 897–905. [Google Scholar] [CrossRef] [PubMed]
- Derluyn, H.; Saidov, T.A.; Espinosa-Marzal, R.M.; Pel, L.; Scherer, G.W. Sodium sulfate heptahydrate I: The growth of single crystals. J. Cryst. Growth. 2011, 329, 44–51. [Google Scholar] [CrossRef]
- Espinosa-Marzal, R.M.; Scherer, G.W. Impact of in-pore salt crystallization on transport properties. Environ. Earth. Sci. 2013, 69, 2657–2669. [Google Scholar] [CrossRef] [Green Version]
- Shahidzadeh-Bonn, N.; Rafaï, S.; Bonn, D.; Wegdam, G. Salt Crystallization during Evaporation: Impact of Interfacial Properties. Langmuir 2008, 24, 8599–8605. [Google Scholar] [CrossRef]
- Tamerlan, A.S.; Pel, L.; Kopinga, K. Crystallization Pressure of Sodium Sulfate Heptahydrate. Cryst. Growth Des. 2015, 15, 2087–2093. [Google Scholar] [CrossRef]
- Steiger, M. Crystal growth in porous materials I: The crystallization pressure of large crystals. J. Cryst. Growth 2005, 282, 455–469. [Google Scholar] [CrossRef]
- Steiger, M. Crystal growth in porous materials II: Influence of crystal size on the crystallization pressure. J. Cryst. Growth 2005, 282, 470–481. [Google Scholar] [CrossRef]
- Katz, A.J.; Thompson, A.H. Prediction of rock electrical conductivity from mercury injection measurements. J. Geophys. Res. 1987, 92, 599–607. [Google Scholar] [CrossRef]
- Pel, L.; Kopinga, K.; Kaasschieter, E.F. Saline absorption in calcium silicate brick observed by NMR scanning. J. Phys. D Appl. Phys. 2000, 33, 1380–1385. [Google Scholar] [CrossRef]
- Cano, F.D.; Bremner, T.W.; McGregor, R.P.; Balcom, B.J. Magnetic resonance imaging of 1H, 23Na, and 35Cl penetration in Portland cement mortar. Cem. Concr. Res. 2002, 32, 1067–1070. [Google Scholar] [CrossRef]
- Ruiz-Agudo, E.; Mees, F.; Jacobs, P.; Rodriguez-Navarro, C. The role of saline solution properties on porous limestone salt weathering by magnesium and sodium sulfates. Environ. Geol. 2007, 52, 269–281. [Google Scholar] [CrossRef]
- Pel, L.; Pishkari, R.; Casti, M. A simplified model for the combined wicking and evaporation of a NaCl solution in limestone. Mater. Struct. 2018, 51, 66. [Google Scholar] [CrossRef]
- Zhao, J.; Luo, H.J.; Huang, X. Migration, Crystallization and Dissolution Changes of Salt Solution with Color Rendering Property in Porous Quartz Materials. Molecules 2020, 25, 5708. [Google Scholar] [CrossRef]
- Zhao, J.; Luo, H.J.; Huang, X. CuSO4 chromogenic tracing for migration and crystallization of salt solution in porous materials. J. Cryst. Growth 2021, 559, 126040. [Google Scholar] [CrossRef]
- Wang, C.Y.; Li, M.; Xia, Y.; Fu, Q.L.; Wang, W.F.; Jin, H.B. Study on the making technology of ancient Chinese grotto murals. Relics Mus. 2014, 4, 74–78. [Google Scholar] [CrossRef]
- Xu, W.Y.; Zhou, G.X.; Li, Y.H. X-ray analysis report on inorganic pigments of murals and color sculptures in Mogao Grottoes. Dunhuang Res. 1983, 3, 187–197. [Google Scholar]
- Ministry of Water Resources of the People’s Republic of China. GB/T 50123-1999; Standard for Soil Test Method. China Planning Publishing House: Beijing, China, 1999; pp. 151–173.
- Zhao, J.; Luo, H.J.; Huang, X. Preliminary Analysis of Crystallization of Na2SO4 Solution in Silicate Cultural Relics. Stud. Conserv. 2020, 65, 321–332. [Google Scholar] [CrossRef]
- Gupta, S.; Terheiden, K.; Pel, L.; Sawdy, A. Influence of Ferrocyanide Inhibitors on the Transport and Crystallization Processes of Sodium Chloride in Porous Building Materials. Cryst. Growth Des. 2012, 12, 3888–3898. [Google Scholar] [CrossRef] [Green Version]
- Qazi, M.J.; Salim, H.; Doorman, C.A.W.; Jambon-Puillet, E.; Shahidzadeh, N. Salt creeping as a self-amplifying crystallization process. Sci. Adv. 2019, 5, eaax1853. [Google Scholar] [CrossRef] [Green Version]
- Derluyn, H.; Dewanckele, J.; Boone, M.N.; Cnudde, V. Crystallization of hydrated and anhydrous salts in porous limestone resolved by synchrotron X-ray microtomography. Nucl. Instrum. Meth. B 2014, 324, 102–112. [Google Scholar] [CrossRef] [Green Version]


Publisher’s Note: MDPI stays neutral with regard to jurisdictional claims in published maps and institutional affiliations. |
© 2022 by the authors. Licensee MDPI, Basel, Switzerland. This article is an open access article distributed under the terms and conditions of the Creative Commons Attribution (CC BY) license (https://creativecommons.org/licenses/by/4.0/).
Share and Cite
Yu, W.; Yang, L.; Zhao, J.; Luo, H. Study on the Visualization of Transport and Crystallization of Salt Solution in Simulated Wall Painting. Crystals 2022, 12, 351. https://doi.org/10.3390/cryst12030351
Yu W, Yang L, Zhao J, Luo H. Study on the Visualization of Transport and Crystallization of Salt Solution in Simulated Wall Painting. Crystals. 2022; 12(3):351. https://doi.org/10.3390/cryst12030351
Chicago/Turabian StyleYu, Wendi, Lu Yang, Jing Zhao, and Hongjie Luo. 2022. "Study on the Visualization of Transport and Crystallization of Salt Solution in Simulated Wall Painting" Crystals 12, no. 3: 351. https://doi.org/10.3390/cryst12030351
APA StyleYu, W., Yang, L., Zhao, J., & Luo, H. (2022). Study on the Visualization of Transport and Crystallization of Salt Solution in Simulated Wall Painting. Crystals, 12(3), 351. https://doi.org/10.3390/cryst12030351