Abstract
Salt damage is one of the most common and serious diseases in silicate cultural relics. In this research, low-field nuclear magnetic resonance (low-field NMR), automatic high-speed X-ray microtomography imaging, polarized light microscopy, and ultra-depth of field microscopy were applied to investigate the migration, distribution, and crystallization of NaCl and Na2SO4 on the surface of hydrophilic media, glass capillaries, and porous SiO2 materials, respectively. The results show that these two salts have different crystal growth behaviors in the same medium. NaCl grows in a granular form on the surface of hydrophilic medium and generally crystallizes outside the glass capillary tube, whereas Na2SO4 grows in a circular ring and always crystallizes inside, and some bubbles can be seen clearly in the hydrophilic medium. Meanwhile, different from NaCl, which is mainly concentrated on the upper surface of SiO2 sample, the migration of the Na2SO4 solution is distributed in the whole sample, and crystals accumulate on the interior of the sample surface. The different crystallization behaviors of salts are speculated to be related to damage conditions such as efflorescence and mural blisters in silicate cultural relics.
1. Introduction
For immovable silicate cultural relics, such as murals, grottoes, and earthen sites, soluble salts are transported continuously with water by capillary forces into the pores of silicate materials [1,2,3]. Some murals in Mogao Grottoes, a world cultural heritage site, have faded in only a few decades due to the repeated dissolution of soluble salts [4]. In Yungang Grottoes, another world cultural heritage site [5,6], damage to rock bodies (including stone sculptures) caused by the crystallization of salt in the pores of rocks has also been widely observed. For movable silicate cultural relics such as ancient potteries, soluble salts enter the cultural relics along with groundwater during long-term underground burial, when the concentration of the salt solution reaches saturation in a certain area after water evaporation. The salt crystallizes and expands, resulting in the efflorescence of the silicate material [7,8,9,10].
The thermodynamics and kinetics of salt crystallization [11,12,13,14,15] in porous silicate cultural relics have been well studied. Flatt [16] and Steiger [17,18] derived equations describing crystallization pressure in terms of solution concentrations and the growing crystals on the pore wall. Scherer [19] analyzed the effects of the curvature of crystals on the crystallization pressure and the phenomena related to crystal growth. Salt saturation also impacts the morphological changes in pores [20,21], and the solubility of salts in porous material was measured by nuclear magnetic resonance [22]; meanwhile, the solid surface fraction in contact with growing crystals was determined based on the pore distribution model obtained by mercury intrusion porosimetry [23], and crystal nucleation and growth from an evaporating salt solution were examined using molecular simulations [24], all of which have focused on the effects of the environment on the crystallization of soluble salts and the effects of crystallization on porous materials. However, the destruction of ancient cultural relics due to salt crystallization is not simply related to the crystallization pressure of the salt. The migration of salt solution within porous samples, the process of crystal growth, especially the sodium sulfate solution in different diameter capillary pores during salt crystallization, and the role of water in the drying stage should also be considered comprehensively.
Based on previous work [25,26] on the crystallization of sodium chloride, the most typical sodium chloride and sodium sulfate solutions were used for comparison, and their migration, distribution, and crystallization on glass capillaries, nanofibrous membranes, and simulated porous silicate media were studied. Low-field nuclear magnetic resonance and automatic high-speed X-ray microtomography techniques were used to study the changes in the salt in the sample, especially in the interior of the sample, which will help to explain the different pathological changes in silicate cultural relics.
2. Materials, Methods, and Experiments
2.1. Materials
The materials included NaCl, Na2SO4 (purity: 99.999%, Aladdin Industrial Co., Ltd., Shanghai, China), a hydrophilic substrate (a nanofibrous membrane, where the network structure of cellulose fiber with diameter was generally 40–50 nm and porosity was about 60%), and glass capillaries (considering the pore diameter distribution range of silicate cultural relics, the inner diameters of the capillaries were selected as 10.0 and 20.0 μm, respectively).
Porous silicate media with 98% SiO2, a particle size of about 250 microns, and a porosity of about 35% were selected to test the migration and changes in the salt solution in porous substrate.
2.2. Methods
2.2.1. Ultrafine Three-Dimensional Microscopic Analysis
The change process of the salt solution on the hydrophilic substrate was recorded using a Japanese VHX-2000 ultrafine 3D microscope (Keyence Co., Ltd., Osaka, Japan) and a SONY FDR-AXP55 4K HD digital camera (Sony Co., Ltd., Tokyo, Japan), with constant temperature and humidity being controlled. The ultrafine 3D microscope system has a very large depth of field, which enables clear and deeper images to be observed online in situ.
2.2.2. Polarized Light Microscopic Analysis
A reflective polarizing microscope (59XE-PC, Shanghai Optical Instrument Factory, Shanghai, China) was used to record the changing process of the salt solution. A large field of vision PL10X/22 mm has a coarse adjustment stroke of 30 mm, a fine-tuning accuracy of 0.002 mm, an adaptive wide voltage of 100–240 V, and a penetration lamp room of 12 V and 50 W.
2.2.3. Low-Field Nuclear Magnetic Resonance (Low-Field NMR)
Low-field NMR (MesoMR23-060H-I, Suzhou Newmark Analytical Instruments Co., Ltd., Suzhou, China) was used to test the moisture content and radial water distribution in porous SiO2 materials. Resonance frequency: 23.403 mHz; magnet temperature: 32.00 ± 0.02 °C; probe coil diameter: 25 mm. The experimental procedures have been described in the literature [22].
2.2.4. Automatic High-Speed X-Ray Microtomography System (Micro-CT)
The instrument used in the test was the automatic high-speed X-ray microtomography system (model: SKYSCAN 1275, Bruker Technology Co., Ltd., Karlsruhe, Germany); it was adopted to perform CT scanning of the crystallization process of the salt solution in SiO2 samples, and to observe the size, shape, and distribution of the salt produced. The scanning period had a sample height of 30.0 mm, and 275 gray level images of 488 × 486 pixels were acquired. It was designed to rapidly scan and track the changing process of migration and accumulation crystal growth in the solution.
2.3. Experiments
A constant temperature of 25 °C and a relative humidity of 50% was maintained for each experimental test.
In order to study the changes in the salt solution in porous cultural relics, it is necessary to first understand the crystallization of salt droplets on the surface of similar hydrophilic media. The continuous observation of crystallization changes on the nanofibrous membrane with a 10% salt solution was detected by an ultrafine three-dimensional microscope.
The crystallization change process of the salt solution in a capillary tube could be observed continuously and in real time by using a polarizing microscope (Figure 1). In order to avoid the influence of the changes on capillary opening at the bottom on the test, plasticine was used to seal the bottom of the capillary when removing it from solution.
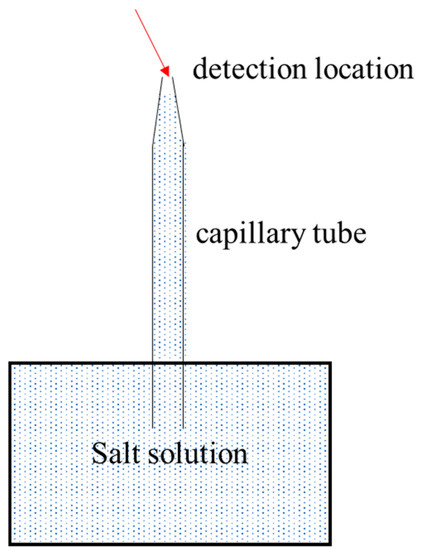
Figure 1.
Sketch of migration and crystal morphology of solutions in capillary tubes.
For comparison, the NaCl and Na2SO4 salt solution as well as the water samples were tested by low-field NMR, and image observation and the T2 spectrum were used to analyze the distribution of water content between different layers of the sample. Firstly, it was determined that the slice stratification direction of the sample was from the surface to the bottom in the testing process, and the sample was divided into four layers in total, with the thickness of each layer being about 7 mm. The signal strength for different layers of samples at different drying times was studied.
The experiment further detected and verified the precipitation process of soluble salt crystals on the surface of samples through the automatic high-speed X-ray micro-CT system.
3. Results and Analysis
3.1. Morphologies of Salt Crystals on the Nanofibrous Membrane
Figure 2 indicated the process of the crystallization changes of NaCl droplets, and the membrane fibers are moistened by water. This means that at least a monolayer of water faces hydrogen bonds with the membrane material; i.e., the solvation of ions in the solution changes. Water decreases and supersaturation can occur only as a result of wetting the membrane. According to the classic theory of crystal growth, it is speculated that there is solid nucleation at the interface between the gas and liquid solution (Figure 2b); supersaturation could be quickly reached, and a smaller crystal nucleus could be formed in accordance with the combination and assignment of ions of cations and anions. During growth, ions in the liquid phase were settled, the angular tip and edge of the crystal could be continuously supplied with ions to grow, and the crystal surface moved outwards in parallel layer by layer, while the crystal size was constantly growing (Figure 2c). When the crystal grew completely, the liquid drops lost water, and the crystal was completely dry; the morphology of NaCl crystals could reach 652.1 μm, as determined by a three-dimensional image test.
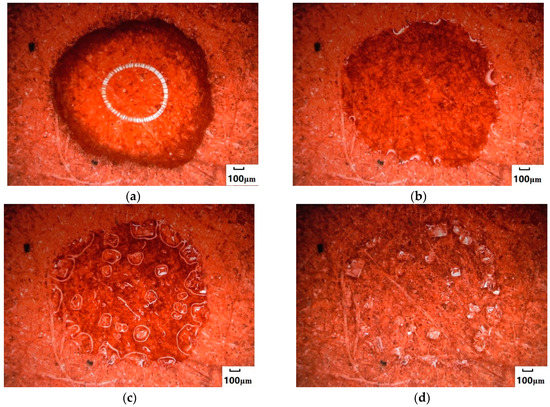
Figure 2.
Crystallization process of NaCl droplets on the surface of hydrophilic media. (a) Droplets. The dark part is the edge of the droplet, and the white circle is the reflected light at the top of the circular droplet. (b) The edge of droplets began to crystallize. (c) Crystals grew. (d) Crystals were desiccated.
Different from NaCl droplets, Na2SO4 crystallized at the edge of higher concentrations (Figure 3c) and formed a circular, centripetal aqueous crystal around the edge (Figure 3d). The growth direction of the annular crystal was along its edge; it accumulated and grew toward the center of the circle, forming an obvious annular water-bearing crystal. The center of the circular droplet began to lose water (Figure 3e) and was then desiccated from the inside of the circular ring to the outside (Figure 3f). The droplets of Na2SO4 underwent two parts: circular annular water-bearing crystallization with edges toward the center (for short, inward growth) and completely dry crystallization with annular center outward (for short, outward drying) during central water loss. The morphology of Na2SO4 crystals after crystallization reached 1308.2 μm by the test of 3D image fitting, and the crystal distribution area was relatively wide.

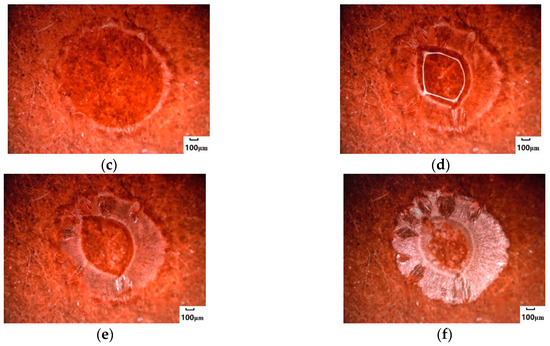
Figure 3.
Crystallization process of Na2SO4 salt droplets on the surface of hydrophilic media. (a) Droplets. (b) The edge of droplets began to crystallize. (c) The crystal area at the edge of droplets increased. (d) Crystals grew inwards. (e) Crystals were gradually desiccated. (f) Crystals were completely desiccated.
Under the same conditions, the time required for the Na2SO4 solution to go from droplets to the beginning of crystallization was shorter, but the time from crystals growing inwards to central dehydration and to complete crystallization was longer (see the red curve of Figure 4). It was calculated that it would take twice as long as NaCl for complete crystallization of the Na2SO4 solution.
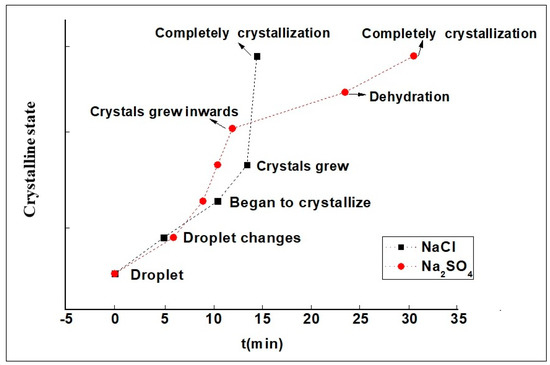
Figure 4.
Time curve of salt droplets in different crystallization stages.
3.2. Migration Rate and Crystal Morphology of Salt Solutions in Capillary Tubes
Figure 5a–d shows the crystallization change process of the NaCl solution, and Figure 5e,h shows the crystallization process of the Na2SO4 solution at the mouth and the wall of the capillary tube with a diameter of 10.0 μm.
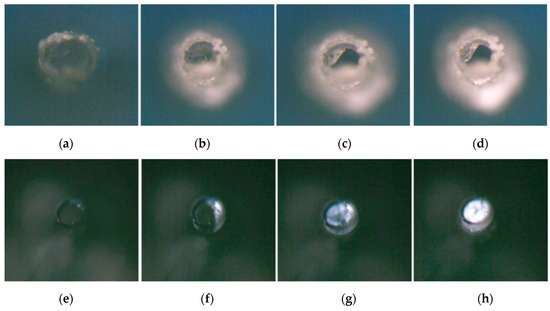
Figure 5.
The polarizing microscope of the changing process of a solution in a 10-μm capillary vertically. (a) The crystallization of the NaCl solution in the pipe orifice and the outer wall of the tube. (b) The crystallization area of the NaCl solution increased. (c) The crystals in the capillary dehydrated. (d) The crystals completely desiccated. (e) The Na2SO4 solution began to crystallize on the inner wall of the pores. (f,g) The crystallization area of the Na2SO4 solution in the pores increased continuously, and it was in a continuous and dynamic state of alternating crystallization and dissolution. (h) The Na2SO4 solution crystalized and desiccated in the pores.
Considering that the capillary force, the gravity of the solution, the viscosity resistance, and the atmospheric pressure were the main forces in the capillary tube, when the capillary force of the solution in the tube was greater than the sum of the other pressures, the salt solution migrated to the opening tube and started to crystallize (heterogeneous nucleation), and the formed crystal nucleus was surrounded by a water film in the liquid region (Figure 5a,e). At the same time, the surface area of the atmosphere contacted by the solid phase for the capillary orifice was the largest, and it was most likely to meet the condition that the salt solution reached the saturation state and started to crystallize. According to the chemical bonding theory that can be used to reveal the crystal growth process [27,28,29], as the bonding came into the crystal lattice, the crystallization area of the outer wall increased continuously (Figure 5b,c), and it was in a continuous and dynamic state of alternating crystallization and dissolution. When the capillary force in the salt solution gradually reached a balance with the other pressures, the migration of solution in the pores appeared in a discrete state, until crystals of the capillary dehydrated in the center and the deliquesced crystals were desiccated, after which crystallization was complete (Figure 5d).
The migration and crystallization of the Na2SO4 solution in the capillary tube was also divided into three stages, and the difference from the NaCl solution was that the Na2SO4 solution crystallized in the inner part of the tubes. As the salt solution continued to crystallize at the capillary orifice and the inner wall (Figure 5f), the salt crystals were in a continuous and dynamic alternating state of crystallization and dissolution at the pipe orifice; they were still in a state of constant dynamic change. The area of crystallization from the orifice to the internal tube increased continuously (Figure 5g). After being placed at room temperature for 10 days, there were white crystals in the orifice (as shown in Figure 5h). Considering that the crystals of the Na2SO4 solution in the capillary tube were constantly changing, it was speculated that the crystals contained aqueous crystalline salt. The test further showed the changes in the solution in the capillary tube with a larger diameter, which was placed horizontally, as shown in Figure 6. After the migration of the salt solution to the pipe orifice, in-tube crystals were formed on the surface of the orifice (Figure 6a). With the continuous migration of the pipe solution, swelling bubbles appeared in the capillary orifice (Figure 6b), and the bubbles grew along with the migration of the solution (Figure 6c) until its final demise, after which new bubbles reappeared (Figure 6d) and burst again before the crystals dried (Figure 6e). Similarly, the crystals in the capillary tube did not easily become completely crystallized under constant external environment conditions (Figure 6f).
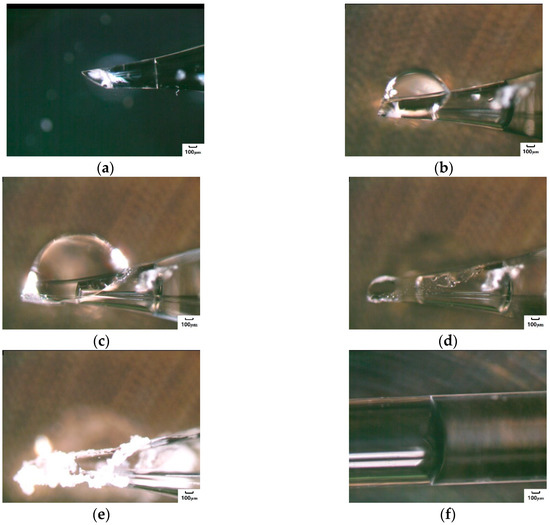
Figure 6.
Crystallization process of the Na2SO4 solution in the capillary tube with a large pore diameter. (a) Crystals appeared on the inner wall of tube. (b) Bubbles appeared. (c) Bubbles swelled. (d) New bubbles reappeared after previous bubbles collapsed. (e) Crystals dried up. (f) Solution was stable inside the capillary.
The main difference between the NaCl and Na2SO4 solutions was that NaCl mainly crystallized on the outer wall of the tube, and the crystals were relatively single and stable. In contrast, the crystallization of the Na2SO4 solution was mainly manifested in the inner part of the tube, as different crystals with crystal water. This was related to dynamic surface tension changes that decreased gradually with the increase in concentration [30].
3.3. Migration, Distribution, and Crystallization of Salt Solutions in Silicate Media
The migration of salt solutions in the sample was tested by low-field NMR, and, under the condition of different drying times, the changing rate of the water content in the samples exponentially declined (Figure 7), in which the water content in the sample containing the Na2SO4 solution was higher than that in the sample containing the NaCl solution and in the sample containing H2O. In the drying process, the water content changes for the sample containing NaCl and the sample containing H2O were quicker. The calculated time required for solutions with different water content values decreased by about 25%. The result showed that the time needed for the sample containing Na2SO4 was 1.45 times and 3.50 times as much as those for samples containing NaCl and H2O.
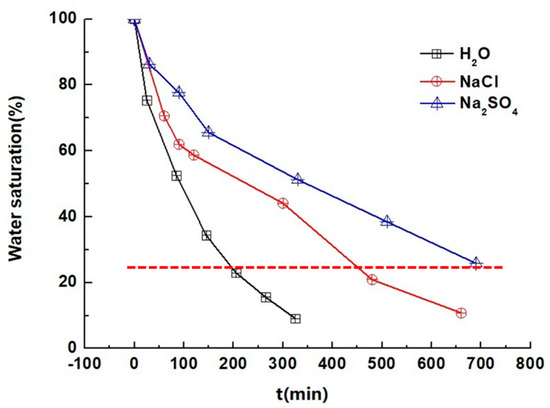
Figure 7.
Water content changes in the sample in the drying process.
In order to more specifically demonstrated the water content change of each layer inside the sample, Figure 8 shows the stratified water content of samples at different times with the one-dimensional frequency coding sequence test. The decrease in water content in the different layers of samples varies, and, at the beginning of drying at 60 min, the water content for the sample containing H2O and NaCl appeared largely reduced at the surface layer, whereas the water content for the sample containing Na2SO4 started to decrease after 330 min. When comparing the changing rate of water content for the sample containing NaCl and the sample containing Na2SO4 in different layers, the changing rate of water content for the Na2SO4 solution samples is much lower than that of the samples containing NaCl. Figure 9 shows the high-water brightness in the central region of the nuclear magnetic imaging map. The water content of the first layer was decreased at 330 min, and the water content value in the center was higher than that in the edge; they were estimated to be 87.18 and 60.95 mg, respectively.
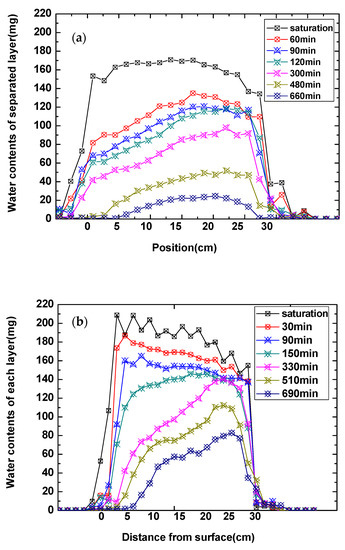
Figure 8.
The layered water content curve of the sample at different drying times. (a) The NaCl solution; (b) the Na2SO4 solution.
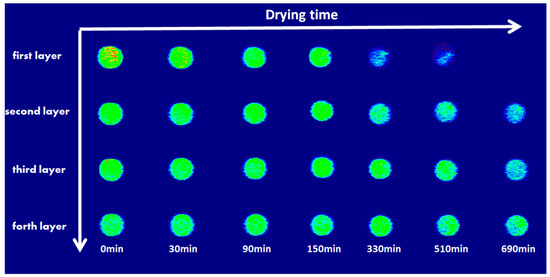
Figure 9.
Images for the nuclear magnetic imaging of the Na2SO4 solution sample at different drying times (the higher the brightness, the higher the water content).
The process of water evaporation was accompanied by crystallization, according to the gray contrast in the micro-CT two-dimensional images of Figure 10. The solution inside the pores was determined to have a higher gray level, and the salt crystals in the edges and pores of the sample had a lower gray level. Comparing Figure 10a,b, pore network images of SiO2 samples with NaCl solutions drying for 30 min and 150 min, it can be seen that the intercommunicating pores were transported from the internal part to the surface, and the depth of the salt solution that penetrated the sample was about 4.5 mm. Meanwhile, the growth and accumulation of the salt crystals first occurred in the surface pore of the sample after drying.
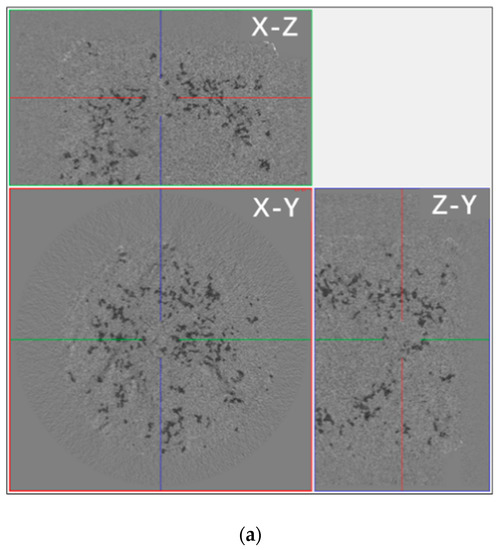
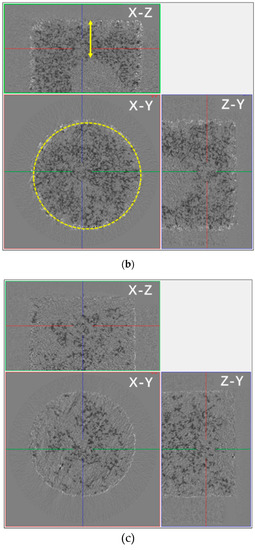
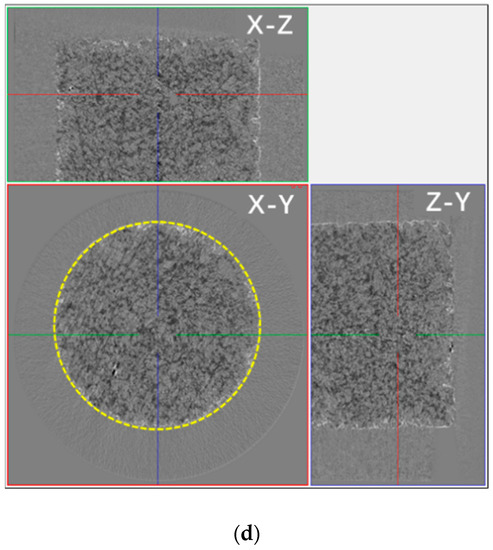
Figure 10.
The distribution of water in the pore network and pores in the SiO2 sample containing a saline solution during drying in micro-CT two-dimensional imaging. (a) The sample containing the NaCl solution after drying for 30 min and (b) after drying for 150 min. (c) The sample containing the Na2SO4 solution after drying for 30 min and (d) after drying for 150 min. In the figure, X-Y, X-Z, and Y-Z respectively indicate the three directions of the tested sample. In the picture, black represents the solution, white represents the precipitated crystals, and the yellow circle represents the edge position of the sample.
Different from the samples containing NaCl, the Na2SO4 solution in the SiO2 sample could permeate almost all sample pores. Figure 10c,d show that the salt solution was distributed to all sample pores, and the crystals were piled up in the interior surface of the sample (the yellow line in Figure 10d). Analyzing the differences in the distribution and depth of penetration of the porous SiO2 sample of the NaCl solution and the Na2SO4 solution, they were speculated to be mainly associated with the spreading properties of salt solutions. As the spreading coefficient (S) formula S = σgas-solid − (σliquid-solid + σgas-liquid) (σ = surface tension) shows, the spreading ability of the salt solution on the same sample surface was related to the surface tension of the solutions directly; e.g., under the same condition of the solid phase (SiO2 sample), the smaller the surface tension of the solution is, the better the spreading ability is for the solution on the surface of the solid phase. Thus, it was speculated the spreading ability of the Na2SO4 solution was superior to that of the NaCl solution, and the penetration of Na2SO4 was deeper than that of NaCl. Like the change in the capillary, the Na2SO4 crystals were piled up in the interior surface of the sample, while the NaCl crystals only piled up on the surface of the sample.
4. Conclusions
The migration, distribution, and crystallization of NaCl and Na2SO4 salt solutions on the surface of hydrophilic media, glass capillaries, and porous SiO2 materials were analyzed, and the results showed the following:
(1) The growth of salt crystals from the liquid phase of droplets includes the following four parts: the local increase in the concentration of the solution; the growth stage of the crystals; the loss of water in the center of the droplets; and complete crystallization. Among these, NaCl crystals were stacked on the edge of the droplets as cubes, while Na2SO4 droplets underwent two stages: circular annular aqueous crystallization with edges toward the center and complete, drying crystallization inside the circular ring outward during central water loss.
(2) The difference between the NaCl and Na2SO4 solutions in the capillary crystallization process is mainly due to the fact that NaCl is mainly crystallized on the outer wall of the tube and SiO2 samples. The crystallization of the Na2SO4 solution is mainly in the inner part of the tube, and mainly in the form of salt crystals containing crystal water with bubbles, which are always unstable and do not easily crystallize completely. The penetration depth of the Na2SO4 solution in porous SiO2 materials is extensive, and the crystal layer is distributed in the interior surface of the sample.
(3) The migration, distribution, and crystallization conditions are different for NaCl and Na2SO4 salt solutions in hydrophilic media, glass capillaries, and porous SiO2 materials. It is speculated that this difference directly affects the different types of pathological damage to cultural relics.
Author Contributions
Data analysis, J.Z.; methodology, H.L.; writing—original draft preparation, J.Z.; writing—review and editing, X.H.; funding acquisition, H.L. All authors have read and agreed to the published version of the manuscript.
Funding
This work was supported by the Key Program of the National Natural Science Foundation of China (51732008).
Conflicts of Interest
The authors declare no conflict of interest.
References
- Rörig-Dalgaard, I. Development of a poultice for electrochemical desalination of porous building materials: Desalination effect and pH changes. Mater. Struct. 2013, 46, 959–970. [Google Scholar] [CrossRef]
- Francesco, C.; Timothy, W.; Flatt, R.J. Easy illustration of salt damage in stone. J. Chem. Educ. 2018, 95, 1615–1620. [Google Scholar]
- Vázquez, P.; Luque, A.; Alonso, F.J. Surface changes on crystalline stones due to salt crystallization. Environ. Earth Sci. 2013, 69, 1237–1248. [Google Scholar] [CrossRef]
- Jiang, X. Study on Capillary Transport Mechanism of Salts in Murals. Master’s Thesis, Lanzhou University, Lanzhou, China, 2014. [Google Scholar]
- Ma, Z.P.; Huang, J.Z. Chemical weathering of carbonate cement in sandstone and the related cultural relic diseases in Yungang grottoes. Carsologica Sinica 2005, 24, 71–76. [Google Scholar]
- Yan, S.J.; Fang, J.; Liu, J.H. Deterioration experiment with soluble salt on sandstone of Yungang grottoes and its model creation. Rock Soil Mech. 2013, 34, 3410–3416. [Google Scholar]
- Espinosa-Marzal, R.M.; Scherer, G.W. Advances in understanding damage by salt crystallization. Acc. Chem. Res. 2010, 43, 897–905. [Google Scholar] [CrossRef]
- Espinosa-Marzal, R.M.; Scherer, G.W. Impact of in-pore salt crystallization on transport properties. Environ. Earth Sci. 2013, 69, 2657–2669. [Google Scholar] [CrossRef]
- Rodriguez-Navarro, C.; Linares-Fernandez, L.; Doehne, E. Effects of ferrocyanide ions on NaCl crystallization in porous stone. J. Cryst. Growth 2002, 243, 503–516. [Google Scholar] [CrossRef]
- Veran-Tissoires, S.; Marcoux, M.; Prat, M. Salt crystallization at the surface of a heterogeneous porous medium. Europhys. Lett. 2012, 98, 1–5. [Google Scholar] [CrossRef]
- Webb, M.B.; Garofalini, S.H.; Scherer, G.W. Molecular dynamics investigation of solution structure between NaCl and quartz crystals. J. Phys. Chem. C 2011, 115, 19724–19732. [Google Scholar] [CrossRef]
- Webb, M.B.; Garofalini, S.H.; Scherer, G.W. Use of a dissociative potential to simulate hydration of Na+ and Cl− ions. J. Phys. Chem. B 2009, 113, 9886–9893. [Google Scholar] [CrossRef] [PubMed]
- Bonn, N.S.; Rafaı, S.; Bonn, D. Salt crystallization during evaporation: Impact of interfacial properties. Langmuir 2008, 24, 8599–8605. [Google Scholar] [CrossRef] [PubMed]
- Tamerlan, A.S.; Pel, L.; Kopinga, K. Crystallization pressure of sodium sulfate heptahydrate. Cryst. Growth Des. 2015, 15, 2087–2093. [Google Scholar]
- Désarnaud, J.; Grauby, O.; Bromblet, P.; Vallet, J.-M.; Baronnet, A. Growth and dissolution of crystal under load: New experimental results on KCl. Cryst Growth Des. 2013, 13, 1067–1074. [Google Scholar] [CrossRef]
- Flatt, R.J.; Steiger, M.; Scherer, G.W. A commented translation of the paper by C.W. Correns and W. Steinborn on crystallization pressure. Environ. Geol. 2007, 52, 187–203. [Google Scholar] [CrossRef]
- Steiger, M. Crystal growth in porous materials I: The crystallization pressure of large crystals. J. Cryst. Growth 2005, 282, 455–469. [Google Scholar] [CrossRef]
- Steiger, M. Crystal growth in porous materials II: Influence of crystal size on the crystallization pressure. J. Cryst. Growth 2005, 282, 470–481. [Google Scholar] [CrossRef]
- Scherer, G.W. Crystallization in pores. Cem. Concr. Res. 1999, 29, 1347–1358. [Google Scholar] [CrossRef]
- Desarnaud, J.; Derluyn, H.; Carmeliet, J.; Bonn, D.; Shahidzadeh, N. Hopper growth of salt crystals. J. Phys. Chem. Lett. 2018, 9, 2961–2966. [Google Scholar] [CrossRef]
- Xu, S.; Simmons, G.C.; Mahadevan, T.; Scherer, G.W.; Garofalini, S.H.; Pacheco, C. Transport of water in small pores. Langmuir 2009, 25, 5084–5090. [Google Scholar] [CrossRef]
- Rijniers, L.A.; Pel, L.; Huinink, H.P.; Kopinga, K. Salt crystallization as damage mechanism in porous building materials: A nuclear magnetic resonance study. Magn. Reson. Imag. 2005, 23, 273–276. [Google Scholar] [CrossRef] [PubMed]
- Koniorczyk, M.; Gawin, D. Modelling of salt crystallization in building materials with microstructure-Poromechanical approach. Constr. Build. Mater. 2012, 36, 860–873. [Google Scholar] [CrossRef]
- Mucha, V.M.; Jungwirth, P. Salt crystallization from an evaporating aqueous solution by molecular dynamics simulations. J. Phys. Chem. B 2003, 33, 8271–8274. [Google Scholar] [CrossRef]
- Zhao, J.; Luo, H.J.; Wang, L.Q. Process of salt crystallization in NaCl solution at efflorescence pottery. Sci. Sin. Technol. 2016, 46, 1–8. [Google Scholar]
- Zhao, J.; Luo, H.J. Transport and crystallization of NaCl solution in porous silicate materials. J. Cryst. Growth 2019, 519, 25–34. [Google Scholar] [CrossRef]
- Sun, C.; Xue, D. IR Spectral study of mesoscale process during urea crystallization from aqueous solution. Cryst. Growth Des. 2015, 15, 2867–2873. [Google Scholar] [CrossRef]
- Sun, C.; Xue, D. In situ IR spectral identification of NH4H2PO4 structural evolution during crystallization in water–ethanol mixed solvent. CrystEngComm 2015, 17, 2728–2736. [Google Scholar] [CrossRef]
- Sun, C.; Xue, D. Chemical bonding theory of single crystal growth and its application to crystal growth and design. Cryst. Eng. Comm. 2016, 18, 1262–1272. [Google Scholar] [CrossRef]
- Zhao, J.; Luo, H.J.; Huang, X. Preliminary analysis of crystallization of Na2SO4 solution in silicate cultural relics. Stud. Conserv. 2019. [Google Scholar] [CrossRef]
© 2020 by the authors. Licensee MDPI, Basel, Switzerland. This article is an open access article distributed under the terms and conditions of the Creative Commons Attribution (CC BY) license (http://creativecommons.org/licenses/by/4.0/).