Abstract
Experimental and theoretical investigations on the optimized geometrical structure, electronic and vibrational features of 2-[(1H-benzimidazol-1-yl)-methyl]benzoic acid are provided using the B3LYP/6-311++G(d,p) basis set. The Vibrational Energy Distribution Analysis (VEDA) program was used to perform the vibrational assignments and calculate the Potential Energy Distribution (PED). The acquired FT-IR and FT Raman data were used to complete the vibrational assignment and characterization of the compound fundamental modes. Theoretical and actual NMR chemical shifts were found to be quite similar. The UV-vis spectrum of 21HBMBA, as well as effects of solvents, have been investigated. The calculated HOMO and LUMO energies reveal that charge transfer happens within the molecule and MEP surface to be a chemically reactive area appropriate for drug action. Furthermore, a thorough examination of Non-Bonding Orbitals, excitation energies, AIM charges, Fukui functions and the Electron Localization Function (ELF) is carried out. The research is also expanded to compute first-order hyperpolarizability and forecast NLO characteristics. The details of the docking studies aided in the prediction of protein binding.
1. Introduction
One of the benzimidazole derivatives is 2-[(1H-benzimidazol-1-yl)-methyl]benzoic acid (21HBMBA). Benzimidazole is a white crystal that is also known as azaindole, 3-azindole, benzoglyoxaline, 1,3-diazaindene and 3-benzodiazole [1]. Benzimidazole is one of the earliest nitrogen heterocycles known, having been originally synthesized by Hoebrecker in 1872 and then by Ladenberg and Wundt in 1878 [2]. Benzimidazole is a structural motif that may be found in a variety of natural and non-natural compounds, including vitamins [3]. In the realm of medications and pharmaceuticals, benzimidazole and its derivatives constitute an important family of bioactive compounds [4]. Antimicrobial [5], anti-inflammatory [6], anticancer [7], antiparasitic [6], antiprotozoal agents [8], HIV [9], RNA [10] and human cytomegalovirus (HCMV) [11], are just a few of the viruses they may kill. Derivatives, such as thiabendazole, cambendazole, parbendazole, mebendazole, albendazole and flubendazole are frequently used antihelminth drugs and also used to treat gastrointestinal worm infections in humans and animals [12] (Figure 1). Antihelminth medicines are particularly well known for two classes of benzimidazole derivatives, specifically 5,6-dinitro- and 2-trifluromethyl derivatives [13]. By inhibiting tubulin polymerization, 2-methoxycarbonylamino derivatives have demonstrated strong antiprotozoal activity against several protozoan parasites, such as Giardia lamblia and Entamoebahistolytica, making them better antiprotozoal drugs than albendazole and metronidazole [4]. The antitumoral, antiparasitic, antiviral and antibacterial properties of imidazole and benzimidazole derived compounds, as well as their N-oxides, have been reviewed by Boiani and Gonález [14]. The parent molecule also acts as a precursor for vitamin B12 production [15]. UV filters and pigments made from benzimidazole derivatives are employed in industry [16,17].
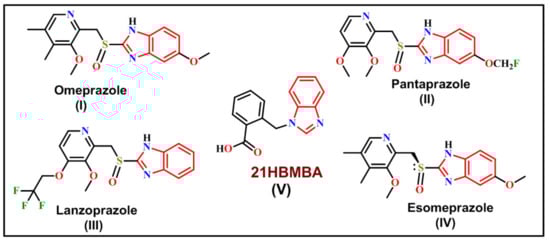
Figure 1.
Some established benzimidazole derivatives as antiulcer agents in clinical practice.
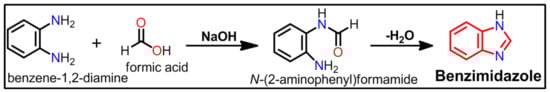
In the presence of formic acid, 1, 2-diaminobenzene can be converted to benzimidazole (Scheme 1).
Scheme 1.
Synthesis of benzimidazole from 1, 2-diaminobenzene and formic acid.
On the other hand, the synthesis of benzimidazoles by condensation of 1,2-diaminobenzenes with aldehydes, necessitates the use of an oxidative reagent to create the benzimidazole nucleus. Furthermore, combining 1,2-diaminobenzenes with carboxylic acid derivatives such as nitriles, imidates, orthoesters, anhydrides or lactones can yield a range of benzimidazoles [18]. Our group reported the synthesis, crystal structure and Hirshfeld analysis of 2-[(1H-benzimidazol-1-yl)-methyl]benzoic acid (21HBMBA) recently [19]. According to a thorough review of the literature, there is yet to be a complete theoretical investigation of 21HBMBA. This stimulates a comprehensive vibrational spectroscopic examination of the molecule in order to identify the fundamental bands in FTIR spectra in detail using the computed PED. A comprehensive spectroscopic evaluation of the title compound utilizing the B3LYP/6-311++G(d,p) level of the theory is presented in this work. Experimental FT-IR, 1H NMR and UV-vis spectra are compared to the optimized geometry and vibrational frequencies. The intermolecular interactions and stability of 21HBMBA are determined using natural bond orbital analysis (NBO). The electron transitions are obtained by measuring the maximum absorption wavelength from 21HBMBA in DCM, DMSO, EtOH, and MeOH solvents using the PCM model. The Molecular Electrostatic Potential provides a qualitative estimate of the molecule reactive area, whereas Fukui function analysis provides a quantitative estimate. Molecular docking experiments are used to find the interaction of ligand (21HBMBA) with a suitable protein downloaded from RSCPDB site; these proteins may be transferase, kinase, hydrolase, oxidoreductase, Hydrolase, lyase/dehydratase, or hydroxylase domains [20,21,22,23,24].
2. Material and Methods
2.1. Methods and Instrumentation
Infrared spectrum was recorded on Thermo scientific NICOLET model (iS50) spectrometer (KBr, disk, 400–4000 cm−1). 1H-NMR was recorded on a JEOL-ECX 500 FT (500 MHz) 13C (125 MHz) instrument in DMSO-d6 with Me4Si as the internal standard. Absorption measurements were performed on UV-1280 spectrophotometer.
2.2. Computational Details
The details of theoretical measurement have been provided in supporting information (See the Supplementary Materials).
To obtain a thorough understanding of optimized parameters, quantum chemical density functional calculations were carried out at the Becke3-Lee-Yang-parr (B3LYP) [25] level using 6-311++G(d,p) basis set using a Gaussian 09W [26] computer package, and the same method was applied in one of our article DFT studies on thiophene derivatives [27]. The Gaussian 09W program was used to calculate vibrational frequencies and IR intensities using the optimized molecular structure. The VEDA program was used to assign hypothetical vibrational assignments to the 21HBMBA molecule using potential energy distribution (PED) [28]. The 1H NMR chemical shifts were calculated using the Gauge-Independent Atomic Orbital (GIAO) technique using the B3LYP/6-311++G(d,p) basis set, since the geometry of the molecule containing Tetra Methyl Silane (TMS) was fully optimized. The title compound optimized geometry was then employed to conduct a natural bond orbital (NBO) study. Atoms in molecule (AIM) theory was used to calculate topological parameters and electron localization functions using Multiwfn software [29]. The Gauss View 6 program [30] was used to create an optimum geometry MEP diagram for the 21HBMBA molecule. The theoretical UV-vis spectra for DCM, DMSO, EtOH, MeOH and gas phase were explored using the TD-DFT and CPCM solvent model technique with the 6-311++G(d,p) basis set in order to better understand the electronic characteristics. Mulliken population analyses as well as condensed Fukui functions were presented. The same approach was used to determine the dipole moment (μ), linear polarizability (α) and first order hyperpolarizability (β) in the NLO investigation. The SwissADME Tool [31] was used to determine the drug-likeness and ADME features of the compound. Molecular docking investigation was carried out using the Autodock 4.2.6 software program [32].
3. Results and Discussion
3.1. Optimized Molecular Geometry
Optimization of molecular geometry was carried out considering the molecules in gas phase, as well as in different solvents, such as EtOH, DCM and DMSO, and Table 1 shows the optimized bond lengths and bond angles for the studied compounds in gas phase and Supplementary Materials Table S1 in different solvents. Optimization was performed by using the B3LYP technique with the 6-311++G(d,p) basis set, Figure 2a shows the atom numbering of the optimized structure. The titled compound 21HBMBA possesses a C1 point group. Due to the molecule being computed in solid state and gaseous phase, there is little difference between experimental and theoretical values. The molecular structure 21HBMBAconsists of 2-(1H-benzimidazol-1-ylmethyl)benzoic acid and forms a 1D periodic structure due to H-bonds in Figure 2b. Standard representation of H-bonded molecular structures resulted in the 2-c uninodal net of the 2C1 topological type with point symbol for net: {0} (Figure 2c).Applying the multilevel analysis for the standard representation of the Coulomb or vdW-bonded structure resulted in the 14-c nodal net of the tcg-x topological type with point symbol for net: {336.446.59} (Figure 2d).

Table 1.
Optimized geometrical parameters of 21HBMBA in gas phase: bond length (Å) and bond angles (°).
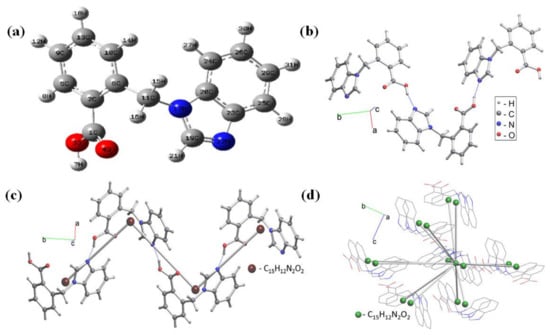
Figure 2.
(a) Optimized molecular geometrical structure with atomic label, (b) hydrogen bonded structural fragment, (c) 2-c uninodal net of the 2C1 topological type and (d) 14-c (green balls) net in standard representation of Coulomb or vdW-bonded molecular structure 21HBMBA with molecules that correspond to nodes.
The predicted C–N bond length ranges from 1.304 Å to 1.460 Å, while experimental measurements range from 1.313 Å to 1.468 Å. The maximum bond lengths for C11–C6 were computed and determined to be 1.523 Å (theoretical) and 1.509 Å (experimental). The estimated bond length values for C-O and O-H via B3LYP/6-311++G(d,p) basis set range from 1.210 Å–1.354 Å and 0.968 Å, respectively, and are in good agreement with experimental values (1.216 Å–1.318 Å and 0.879 Å). The bond angle C20–N17–C11= 127.64° in the title molecule is greater than the other C19–N17–C11 = 126.21° computed using DFT/B3LYP with the 6-311++G (d,p) basis set approach. The bond length RMSD value between calculated and experimental is 0.982 and R2 value is 0.965. Similarly for bond angle, RMSD is 0.958 and R2:0.919. These low values imply that experimental and theoretical structures are identical. The dihedral angle of planes in the middle of molecule C10–C6–C11–N17 is −105.61°, and C6–C11–N17–C20 is 64.64°, which shows high distortion, but some are planar, such as C24–C20–C23–C22 is −179.89°, and H21–C19–N22–C23 is −179.73°.
3.2. Vibrational Spectroscopic Analysis
Vibrational spectroscopy is widely used in organic chemistry for identifying functional groups in organic compounds, studying molecular confirmations, kinetics, and reaction mechanisms, etc. Supplementary Materials Table S2 shows the entire vibrational assignments of basic modes of 21HBMBA, along with the PED. Apart from three translational and three rotational degrees of freedom, the greatest number of theoretically active observable fundamentals in a non-linear molecule with N atoms is (3N-6). As a result, the 21HBMBA molecule comprises of 31 atoms and has 87 normal modes of vibration, including stretching, bending, torsion and a few mixed vibrations, and is symmetrical in the C1 point group. Experimental FTIR has been recorded in solid phase, and simulated ones in gas phase, which is why measured spectral peaks looks broad and simulated peaks looks sharp, Figure 3 shows the experimental FTIR, simulated IR spectrum. In the B3LYP basis set, a scaling factor of 0.961 is utilized to compare the theoretical and experimental values.
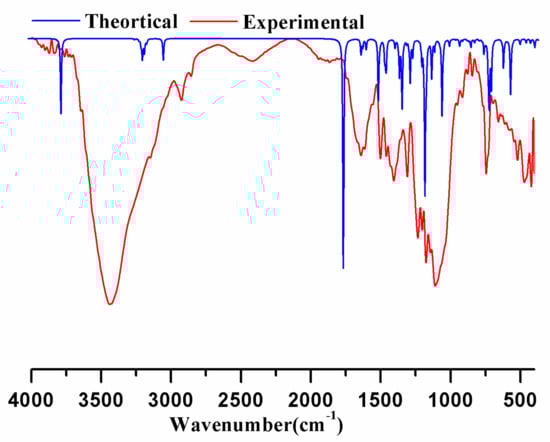
Figure 3.
Theoretically calculated FTIR spectrum blue line and experimental infrared spectrum of 21HBMBA.
3.2.1. C–H Stretching Modes
The presence of C–H stretching vibrations in the area 3100–3000 cm−1, which is the typical region for the quick detection of C–H stretching vibrations [33,34], can be seen in the hetero aromatic structure. The type of the substituent has little effect on the bands in this area. C–H stretching and bending areas are the hardest to understand in infrared spectra. Due to ring C–H stretching bands, most of the aromatic compounds contain almost four infrared peaks in the area 3080–3010 cm−1 [35]. In this present study, the C–H stretching vibrations are observed at 3123, 3089, 3077, 3068, 3067, 3055, 3054, 3042, 3039, 3009 and 2927 cm−1[mode nos 86–76] by the B3LYP/6-311++G(d,p) method show good agreements with experimental vibrations. The bands have been observed in the recorded FT-IR spectrum at 2919 and 2858 cm−1. The corresponding PEDs for the titled molecule are 25, 43, 49, 36, 47, 60, 24, 44, 57, 75 and 75%. C11–H15 and C11–H16 vibrations appear at 3131 and 3045 cm−1and could be assigned as asymmetric and symmetric modes, respectively.
3.2.2. C–C Vibrations
The C–C aromatic stretching vibrations produce distinct bands in both the IR and Raman spectra, spanning the spectral range 1600 to 1400 cm−1 [36]. In the benzene ring, the ring carbon–carbon stretching vibrations occur in the range 1625–1430 cm−1. Chithambarathau et al. [37] observed FT-IR bands in 1,3,5-triphenyl-4,5-dihydro pyrazole at 1574, 1498, and 1468 cm−1. Stretching vibrations of the C–C bond are seen in FT-IR at scaled values of 1588 and 1279 cm−1, with PED contributions of 34% and 36%, respectively. The mixed vibrations, stretching C–C, and bending vibrations HCC are observed in the title compound at 1576, 1555, 1553, 1453, 1421, 1310, 1306, 1164, 1155, 1148, 1110, 1090, 1030 and 819 cm−1, and 1576, 1462, 1453, 1428, 1421, 1417, 1358, 1335, 1255, 1238, 1164, 1148, 1110, 1090, 1030, 990 and 920 cm−1, respectively.
3.2.3. C–N Vibrations
The recognition of C–N vibration is a challenging process, because this region allows for the mixing of various bands. Silverstein et al. [38] assigned C–N stretching absorption in the region 1342–1266 cm−1 for aromatic amines. The theoretically scaled wave numbers at 1470, 1335, 1327, 1306, 1255, 1176, 1056, and 860 cm−1 by B3LYP/6-311++G(d,p) correspond to C–N stretching vibrations.
3.2.4. C=O and O–H Vibrations
Carbonyl C=O stretching vibrations are generally predicted in the range of 1740–1660 cm−1 [39]. Peak at 1776 cm−1 is correspond to pure C=O stretching. This double bond group has a significant infrared absorption band because it is highly polar. In this work, the bands observed at 1708, 1310, 1110 and 1039 cm−1are attributed to C=O stretching with mixed modes with other vibrations, such as C=C, C–H stretching. The broad band O–H stretching vibration is predicted to be observed between 3600 and 3400 cm−1 [40]. Hydrogen bonding tends to affect the O –H stretching vibrations [41]. The O–H stretching vibration estimated by B3LYP/6-311++G(d,p) is observed at 3619 cm−1 in this study. The PED contribution is 100%, indicating that the vibration is pure stretching. This demonstrates a high level of agreement with theoretical results.
3.3. Molecular Electrostatic Potential (MEP)
The most successful method for investigating electrophilic, nucleophilic, and radical attack is molecular electrostatic potential surface analysis. MEP was computed at the B3LYP/6-311++G(d,p) optimized geometry to anticipate reactive sites for electrophilic and nucleophilic assault on the title molecule. It is very useful to analyze the molecular reactivity in organic, inorganic and polymer materials, as well as determining the bimolecular nature [42].
The MEP surface of the 21HBMBA molecule is viewed using the Gauss View 5.0 tool in this investigation, as shown in Figure 4. The multiple electrostatic potential values at the MEP surface are shown by the distinct colors of red, blue, and green, which indicate the regions of most negative, most positive and zero electrostatic potential, respectively. Negatively electrophilic potential zones are primarily found around the N22 atom. The hydrogen atoms have a maximal positive area, indicating a potential nucleophilic attack site. The light green area of the MEP surface predominates, corresponding to a color potential halfway between red and dark blue. Negative potential sites are found on electro negative atoms, whereas positive potential sites are found around the hydrogen atom, according to the MEP map. These sites provide information on the area of the compound where non-covalent interactions can occur. The color coding for these 21HBMBA maps runs from −6.122 a.u (red) to +6.122 a.u (green) (deepest blue).
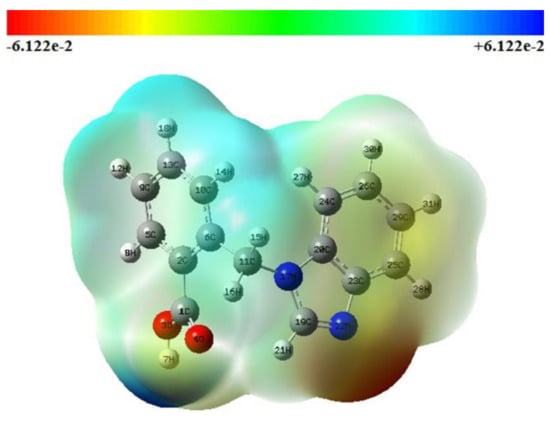
Figure 4.
Molecular electrostatic potential (MEP) map of 21HBMBA.
3.4. Electron Localization Function (ELF)
Electron delocalization is a key parameter for understanding molecular aromaticity, the nature of chemical bonding in transition metal complexes [43], and most importantly, it directly reveals the Pauli exchange repulsion effect by measuring the excess of local kinetic energy due to Pauli repulsion, which has a number of applications in VSEPR theory [44]. Electron localization function (ELF) with a color filled map and a shaded surface map with projections for the title chemical were utilized to achieve surface analysis dependent on the covalent bond (Figure 5a,b). The color indications span from blue to red, indicating the ELF scale range of 0.0 to 1.0. It tends to a value of 0.5 when the density distribution approaches homogeneity and approaches 1 in those parts of space where localization is prominent. The presence of bonding and nonbonding electrons is confirmed by the color shades of the ELF maps. The existence of bonding and nonbonding electrons is shown by the red color that surrounds the hydrogen atoms with the highest value. As seen in Figure 5a, the blue color cloud around the carbon atoms shows poor electron localization values. The little blue color circles surrounding carbon, nitrogen and sulfur atoms demonstrate electron depletion between the valence and inner shells.
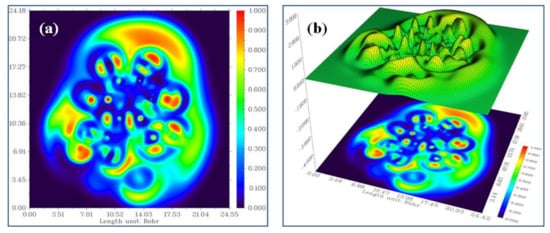
Figure 5.
(a) ELF color filled map. (b) Shaded surface map with projection effect of the hydrogen bonding region in 21HBMBA.
3.5. Non-Linear Optics
Optical properties and material structure are very critical in the realm of optoelectronics applications [45,46,47,48]. Through finite-field approaches, the main three parameters of polarizability (α), hyperpolarizability (β), and electric dipole moment (μ) are responsive in an applied electric field. The polar characteristics of the title compound were computed using the Gaussian 09W computer package at the DFT (B3LYP)/6-311++G(d,p) level. Urea is a model molecule utilized in the study of molecular systems’ Non-Linear Optical (NLO) characteristics. As a result, it is widely used as a threshold value for comparison reasons. Along x, the dipole moment reaches its maximum magnitude. The values are equal to −4.2843D in this direction. As indicated in Table 2, the values for direction Y and Z are 3.1238D and 0.3546D, respectively. From the B3LYP/6-311++G(d,p) basis set, the total molecular dipole moment of the title molecule is 5.3141D, which is higher than that of urea (μ(D) = 1.373D). According to Table 2, the title compound computed polarizability and hyperpolarizability values are −1.5945 × 10⁻²³ and 9.975 × 10⁻³¹, Which are higher than those produced using the B3LYP/6-311++G(d,p) technique for urea (α0, are 3.8312 × 10⁻²⁴ e.s.u. and β0 = 0.372 × 10⁻³⁰ e.s.u.). The computed values were converted to electrostatic units (α: 1 a.u. = 0.1482 × 10⁻²⁴ e.s.u., β: 1 a.u. = 8.6393 × 10⁻³³ e.s.u.) since the values of the polarizability and first hyperpolarizability tensors in the output file of Gaussian 09W are presented in atomic units (a.u.). As a result, this compound may be produced as a conventional NLO material with several industrial uses.
Table 2.
The calculated values of dipole moment μ(D), polarizability (α0), and first order hyperpolarizability, (βtot) components of 21HBMBA.
3.6. Donor Acceptor Interaction
A natural bond orbital or NBO, is a computed bonding orbital with maximal electron density in quantum chemistry. Natural bond orbital analysis [50,51,52] is a useful method for studying the interactions (inter and intra molecule interactions) between atom bonds. The donor–acceptor interactions, bonding type, electron density and stabilization energy of the 21HBMBA molecule were computed using the DFT/B3LYP technique using the 6-311++G(d,p) basis set and second-order perturbation theory, and the results are presented in Supplementary Materials Table S3. In the molecular system, greater stabilization energy (E2) is involved in the massive charge transfer of donor–acceptor contacts. Higher stabilization energy is computed in LP(2) of O3, LP(2) of O4 and LP(1) of N17 donors that interact with nearby antibonding acceptors π*(C1–O4), π*(C1–C2), π*(C1–O3) and π*(C19–N22), π*(C20–C23), with energies of 42.69, 16.74, 32.54 and 44.62, 32.25kcal/mol for 21HBMBA. This demonstrates that the lone pair orbital in the molecule participates in electron donation.
Supplementary Materials Table S3 shows how variations in NBO bond polarization and hybridization, as well as percentage changes in the examined molecule, are connected to complex formation data. It is possible to determine the most significant interaction between full (donor) Lewis type NBOs and empty (acceptor) non-Lewis type NBOs. For example, in Supplementary Materials Table S4, the σC1-O3 bond is produced by the sp2.71 hybrid of carbon, which is made up of s(26.89%), p(72.89%) and d(0.22%) atomic orbitals, and the sp1.99 hybrid of oxygen, which is made up of s(33.37%), p(66.54%), and d(0.09%) atomic orbitals. As a result, the link between σC1-O3 is formed by the overlapping of sp2.71 hybrid of C1 and sp1.99 hybrid of O3. The fact that oxygen has a higher polarization coefficient (0.8246) than carbon (0.5657) shows that oxygen is more electronegative. This may be expressed as follows:
σCO = 0.5657 (sp2.71)C1 + 0.8246 (sp1.99)O3
The vector specifying hybrid p-components, azimuthal (Φ) and polar (θ) angles are utilized to determine its orientation. The deviation angles of hybrid A and hybrid B orbitals describe the bending nature of the bonds. The geometrical alterations and bending nature of NHO are shown in Supplementary Materials Table S5. The NHO of σC1–C2, σC1–O3, σC1–O4 and σC2–C5 are bent by (1.9, 1.7), (3.9, 1.4), (85.4, 85.9) and (88.3, 88.7), respectively.
3.7. Population Analysis (Local Reactivity Descriptor: Fukui Function)
Mulliken population analysis is used to determine partial atomic charges using computational chemistry methods (MPA). The two statistics’ local softness and Fukui functions, which are based on the equation f(ȓ) = (∂p/∂N)v(ȓ) = (Δμ/Δv(ȓ))N [53,54], describe the reactive sites. Using density functional theory, the Fukui function predicts where the most electrophilic and nucleophilic sites are found [55,56]. In the Mulliken population analysis system, the atomic site is associated with three components: neutral (N), anionic (N+1) and cationic (N-1). The titled compound has a total of 31 atoms in its chemical structure, including 15 carbon atoms, 12 hydrogen atoms, 2 oxygen atoms and 2 nitrogen atoms. Carbon atoms with negative values predominate in C1, C5, C9, C10, C11, C23, C24, C25, C26, and C29 due to hydrogen and nitrogen atom coupling. The remaining carbon atoms C2, C6, C13, C19, and C20 are positive due to nitrogen and oxygen atoms. Table 3 shows the Fukui function and local softness values for all atoms. The nucleophilic and electrophilic sites of the molecule are investigated using the dual descriptor analysis. For nucleophilic attack, the estimated Fukui functions (fk+) values were anticipated in the order C6 > C2 > C13 > N17 > C20 > C19. The higher (fk−) values are C11 > C9 > C25 > C24 > C29 > C10 > C26 > O4 > C5 > C1 > O3 > C23 > N22 and are likely to represent electrophilic attack sites. The stability and reactivity characteristics serve as a prelude for molecular docking to confirm the biological activity of the titled compound. Figure 6 and Supplementary Materials Figure S1 displays the histogram of Mulliken atomic charges.
Table 3.
Mulliken Atomic Charge distribution, Fukui Functions and Local Softness equivalent to (0,1), (−1,2) and (1,2) charge and multiplicity of 21HBMBA.
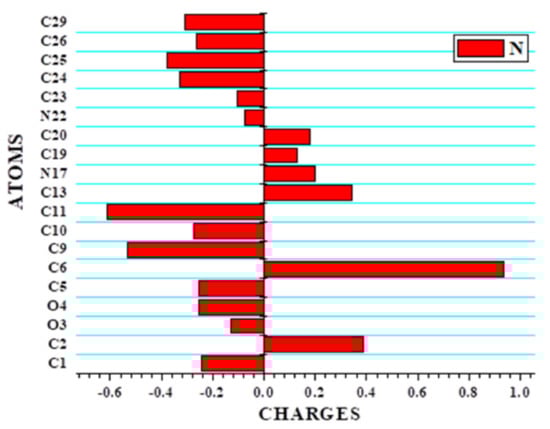
Figure 6.
The histogram of calculated Mulliken charge of 21HBMBA.
3.8. Frontier Molecular Orbital Analysis
The energies of electronic absorption from the highest filled orbital to the lowest unfilled orbital are referred to as Frontier Molecular Orbital (FMO) and were calculated using Gauss View5.0 for 21HBMBA at B3LYP/6-311++G(d,p). FMOs are important in a variety of optical and electric characteristics, as well as quantum chemistry and molecular UV-vis spectra. The capacity to supply an electron is represented by the HOMO as an electron donor, while the ability to receive an electron is represented by the LUMO as an electron gainer, and the energy gap between the two is responsible for the molecule stability [57]. The transition from the ground state to the first excited state causes electronic absorption, which is primarily performedby electron excitation from the HOMO to the LUMO. The HOMO, LUMO and band gap energies were discovered to be −6.201 eV, −2.147 eV and 4.054 eV, respectively (Figure 7). The intramolecular charge transfer (ICT) interaction is shown by the HOMO-LUMO energy gap, and this value was equivalent to the band gap energy value of bioactive compounds [58]. The ionization potential, the electron affinity of the molecule, is linked to the HOMO and LUMO values. The global molecular reactivity descriptors of a type of IP, EA, Global Hardness (η), Electronegativity (χ), Global Softness (S), Chemical Potential (μ), and Global Electrophilicity (ω) were calculated, and the results are reported in Table 4 Because of the chemical hardness (2.0270) and significant energy transition, the molecule is not extremely hard. Because of its low softness value, the title molecule has a low toxicity (0.2466). One of the most important Conceptual Density Functional Theory (CDFT)-based descriptors for studying bioactivities is the electrophilicity index. The suitably high value of the electrophilicity index (4.2987) serves as a prelude to examining the title molecule for its biological activity in terms of molecular docking, in which the title compound 21HBMBA serves as the ligand and is docked to a suitable protein. The title molecule experimental and theoretical UV-vis comparative spectrum is illustrated in Figure 8. The experimental ultraviolet-visible spectra of compound were recorded in DCM, DMSO, EtOH solvents, as well as theoretical calculations in gas phase, in DCM, DMSO and EtOH solvents. The UV-visible absorption maximum values in gas phase, DCM, DMSO, and EtOH solvents are (λmax) 357 nm, 315 nm, 310 nm, and 311 nm. The λmax value obtained experimentally is 352 nm in DCM, 396 nm in DMSO and 272 nm in EtOH as solvents (Table 5). It has been observed that the λmax as well as intensity changes the polarity of solvent. For carbonyl compounds, the n–π* transition of the keto group shifts towards shorter wavelength (blue-shift or hypsochromic shift) if solvent polarity is increased. The reason being, the non-bonding electrons on oxygen interact strongly (hydrogen bonding) with hydrogen of polar solvents, such as EtOH, MeOH, H2O, etc.
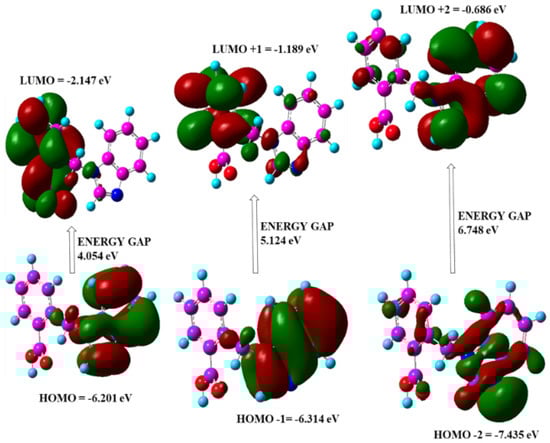
Figure 7.
HOMO and LUMO with band gap energy.
Table 4.
Calculated energy values of 21HBMBA by B3LYP/6-311++G(d,p) method.
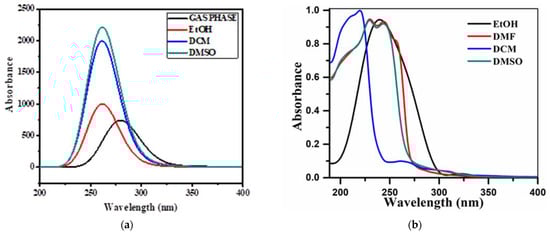
Figure 8.
(a) Theoretical and (b) experimental UV-vis spectra of 21HBMBA.
Table 5.
Comparison of electronic properties of 21HBMBA attained experimentally and calculated by TD-DFT/B3LYP method.
3.9. 1HNMR Spectral Analysis
One of the most essential tools for structural conformational research of organic molecules is 1H NMR spectroscopy. Table 6 lists the actual and theoretical results for the proton (1H) NMR of the title compound. In a DMSO solvent, the experimental 1H NMR was obtained and presented in Supplementary Materials Figure S2. The GIAO technique [49] is used to determine the theoretical 1H chemical shielding for the best optimal geometry. The DFT approach calculates chemical shift values that were compared with the experimental data. The peaks seen experimentally in the 1H NMR spectra of the title compound range from 5.82 ppm to 8.25 ppm. The single peak observed at 8.25 (1H) ppm and theoretically at 8.57 ppm is due to carboxylic acid protons. The peaks at 7.86 ppm–7.12 ppm and theoretically at 8.30 ppm–7.53 ppm are due to aromatic -CH protons. The peak for 1H at 7.88 ppm and calculated at 8.35 ppm is due to methylene protons.
Table 6.
Experimental and theoretical 1H chemical shift values of 21HBMBA (ppm).
3.10. EDD and HDD Profiles for Excited States of 21HBMBA
The delocalization of one electron from A to B, where A and B are real space functions, is referred to as a single-electron excitation process. The excitation of an electron from an occupied to a virtual MO is a commonly used model of an excited state (one electron model) [29]. Electron (ρele(r)) and hole (ρhole(r)) density distribution maps are typical regions of photoexcited states that are equivalent to ground state molecular orbitals. As indicated in Equations (1) and (2), the EDD and HDD can be defined in terms of the molecular orbital wavefunction (Φ) and the configuration coefficient (w), which correspond to the transition of an electron from an occupied MO(i) to a virtual MO(l) on electronic excitation:
i→l i→li→m≠l
i→l i→lj≠i→l
The above-mentioned method was used to calculate EDD and HDD maps for the titled compound 21HBMBA in the current investigation. Multiwfn 3.3.4, created by Tian Lu [59,60], was used to compute utilizing CPCM in different solvents, such as DCM, EtOH at the DFT- B3LYP/6-311++G(d,p) level. Electronic structure calculation for 21HBMBA at TD-DFT–B3LYP/6-311++G(d,p) level with CPCM in DCM predicted one major electronic transition depicted in Figure 9a; the intense absorption band at λmax = 261 nm (3.93 eV) corresponds to HOMO-2→LUMO, while the absorption at λmax = 261 nm (3.99 eV) corresponds to (HOMO-2→LUMO) for DMSO (Supplementary Materials Table S6): for EtOH the intense absorption band at λmax = 261 nm (3.99 eV) corresponds to HOMO-2→LUMO. While the absorption at λmax = 261 nm (3.98 eV) corresponds to (HOMO-2→LUMO) for DCM involving a single molecular orbital pair excitation from the occupied to the unoccupied orbital. The computed EDD map (Figure 9a) shows a much denser isosurface localized on one of the rings and associated oxygen atoms, while the HDD map shows a denser isosurface on ring and nitrogen atoms. Similarly, in Figure 9b, the EDD map shows a denser isosurface on ring and oxygen atoms, whereas the HDD map shows a much denser isosurface localized on ring and nitrogen atoms. Table 7 lists the estimated configuration coefficients for permitted electrical excitations, as well as the EDD and HDD Centroid coordinates for 21HBMBA.
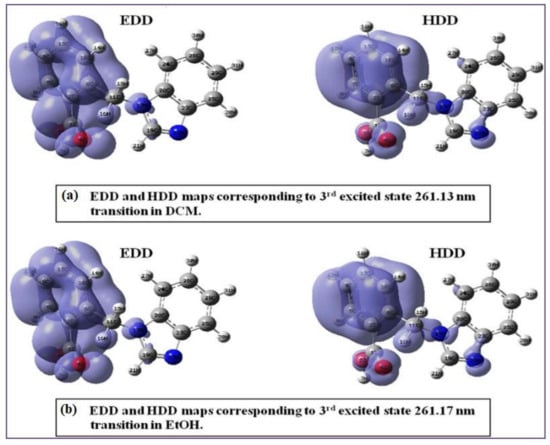
Figure 9.
EDD and HDD maps of the 3rd excited state of 21HBMBA in (a) DCM and (b) EtOH.
Table 7.
Calculated EDD and HDD centroid coordinates and distances for 21HBMBA allowed excited state transitions in DMSO and MeOH.
3.11. Druglikeness
To validate the potentially active drug nature, drug similarity analysis is performed based on several pharmacophoric features of the sample, such as bioavailability, reactivity, and metabolic stability. The conventional idea for a drug-like attribute is drug similarity, which is defined as a complex equilibrium of multiple chemical properties and structural traits that determines if a molecule is comparable to recognized medications. The amount of hydrogen bond acceptors (HBA), hydrogen bond donors (HBD), rotatable bonds, AlogP, PSA (polar surface area) and molar refractivity are all key characteristics in determining the drug similarity properties of a compound. The drug similarity test is made up of all of these criteria, and the values for titled compound 21HBMBA are listed in Table 8. Lipinski’s rule of five was used to calculate the bioavailability of bulk materials in order to assess drug similarity qualities; this rule is crucial in drug development. The titled compound 21HBMBA has one hydrogen bond donor and three hydrogen bond acceptors, respectively. According to this study, HBD should be less than 5 and HBA should be less than 10, according to Lipinski’s rule of five, which is satisfied in the current pharmacological analysis. The measured polar surface area is 55.12 (Å2), which is less than the allowed range of 140 (Å2). The current medication of 21HBMBA has a molar refractivity of 72.44, which falls between the threshold ranges of 40 and 130. All of the data indicate that the current sample 21HBMBA is a drug with active potential and drug qualities. A figure illustrating the drug similarity characteristics of 21HBMBA and one of its derivatives was presented in Supplementary Materials Figures S3 and S4.
Table 8.
ADME characteristics of 21HBMBA and its derivatives.
3.12. Molecular Docking Studies
A molecular docking analysis was performed on the molecule using AutoDock [32] to anticipate the possibilities of protein ligand binding, and 21HBMBA was chosen to dock into the active sites of the protein 3H4G, 4A7Y, 6M7X (removing chain A or B), which belongs to the class of proteins with antimicrobial and antiparasitic properties. Protein was chosen from Swiss target prediction on the basis of if a ligand already docked in it resembles the 21HBMBA, the protein which contain similar ligand was chosen and downloaded in the form of pdb from the RSCPDB website, these protein were of oxidoreductase, hydrolase, lyase/dehydratase, hydroxylase domain. These proteins are taken from a protein data source and checked for bound residue, bond distance, binding energy, and other properties. Before preparing the protein for docking, co-crystallized ligands, fluids, and co-factors were removed. The minimal energy value of the 21HBMBA molecule (ligand) bound into the active region of the proteins was investigated. To analyze the method of binding, the lowest binding energy from the docked conformation was used. The inhibition constants (μm) and molecular docking binding energies (Kcal/mol) were also obtained and presented in Table 9. Figure 10 depicts the ligand preferred orientation with respect to the target protein. The docked ligand title compound forms a stable complex with 3H4G with a binding affinity of −9.2 kcal/mol, according to our findings. In this study, it was discovered that the 21HBMBA molecule is a promising antimicrobial symptomatic aspirant.
Table 9.
Hydrogen bonding and molecular docking with Centromere associated protein inhibitor protein targets.
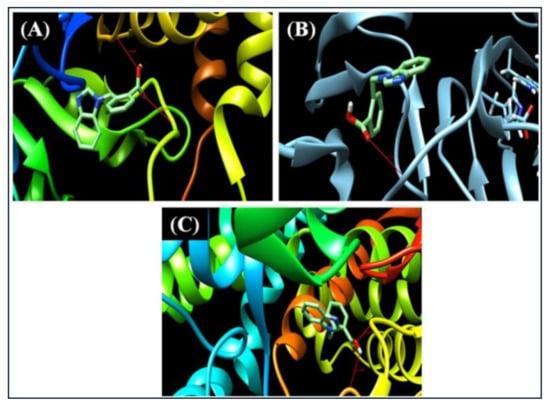
Figure 10.
Molecule21HBMBA embedded in the active sites of (A) 3H4G (B) 4A7Y (C) 6M7X proteins.
4. Conclusions
In current investigation spectroscopy (FT-IR, FT Raman studies, UV-vis and 1H NMR), NLO, NBO, ELF, EDD and HDD, and docking experiments were carried out. DFT theory was used to calculate the optimal geometric parameters (bond lengths and angles), which were then compared to the experimental results. The electronic transitions were also estimated and compared to the UV-vis spectra obtained experimentally. The TD-DFT approach was also used to calculate the energies of significant MOs and λmax of the compound. The MEP map shows that the negative potential site was found around N22, while positive potential sites are found on hydrogen atoms. These sources may include information regarding the title structure likely reaction areas. The degree of electron localization was also represented by ELF. The dipole moment, polarizability and initial hyperpolarizability of the title molecule were used to explore its NLO behavior. Fukui calculations were also performed with variable charge and multiplicity, and the electrophilic and nucleophilic sites were investigated. DCM and EtOH were used to construct EDD and HDD maps for the 3rd excited state. The HOMO-LUMO energy gap was discovered to be 4.054 eV, indicating that the molecule exhibited considerable charge transfer and was also bioactive. The FMO research provided a comprehensive understanding of the molecule toxicity and biological functions. The lowest binding energy for the 3H4G receptor was −9.2 kcal/mol, indicating that the title compound can be further explored in terms of its medical use. The above investigation provides sufficient information for the designing of various new carbonyl and anhydride derivatives, which are of great importance prior to their synthesis and structural characterization.
Supplementary Materials
The following are available online at https://www.mdpi.com/article/10.3390/cryst12030337/s1. Figure S1: The histogram of calculated Mulliken charge of 21HBMBA, Figure S2: (a) Experimental 1H NMR (b) Theoretical 1H of 21HBMBA, Figure S3: Drug similarity qualities of 21HBMBA, Figure S4: Drug similarity qualities of 21HBMBA derivative. Table S1: Optimized bond parameters of 21HBMBA in different solvents, Table S2: Calculated vibrational frequencies (cm−1) assignments of 21HBMBA based on B3LYP/6311++G(d.p) basis set, Table S3: Second order perturbation theory of the Fock matrix NBO analysis of 21HBMBA, Table S4: Hybrid, Polarization coefficient and Atomic Orbital contribution in selected Natural Bond Orbitals of 21HBMBA, Table S5: Natural Hybrid Orbital directionality and bond bending (deviations from line of nuclear centers) of 21HBMBA. Table S6: Comparison of electronic properties of 21HBMBA optimized in different solvents calculated by TD-DFT/B3LYP method, Table S7. Energy of 21HBMBA in different solvents.
Author Contributions
All authors authorize that they have contributed reasonably and take full liability for the work. Validation, preparation, creation of the published work, specifically writing the initial draft, G.K., A.A. and N.A.; validation, formal analysis, M.A. and N.S.; data curation, M.A. and S.J.; methodology/software, formal analysis, N.S., A.F. and S.J.; resources, S.J., N.A. and N.S.; funding acquisition, N.A.; supervision, M.A., S.J. and N.S.; calculation and visualization, A.F. and M.G.; experiment and visualization, A.A., A.F., S.S. and Y.F. All authors have read and agreed to the published version of the manuscript.
Funding
The work was funded by Princess Nourah bint Abdulrahman University Researchers Supporting Project number (PNURSP2022R19), Princess Nourah bint Abdulrahman University, Riyadh, Saudi Arabia and UGC Start-up grant, India.
Institutional Review Board Statement
Not applicable.
Informed Consent Statement
Not applicable.
Data Availability Statement
Not applicable.
Acknowledgments
We acknowledge Dr. B. R. Ambedkar University, Agra and Department of Applied Chemistry, AMU, Aligarh India for their necessary infrastructures and facilities. The work was funded by Princess Nourah bint Abdulrahman University Researchers Supporting Project number (PNURSP2022R19), Princess Nourah bint Abdulrahman University, Riyadh, Saudi Arabia and UGC Start-up grant, India.
Conflicts of Interest
There are no conflicts of interest to declare.
References
- Sivakumar, R.; Pradeepchandran, R.; Jayaveera, K.N.; Kumarnallasivan, P.; Vijaianand, P.R.; Venkatnarayanan, R. Benzimidazole: An attractive pharmacophore in medicinal chemistry. Int. J. Pharm. Res. 2011, 3, 19–31. [Google Scholar]
- Hobrecker, F. Reduction-products of nitracetamide compounds. Deut. Chem. Ges. Ber. 1872, 5, 920–924. [Google Scholar] [CrossRef] [Green Version]
- Ramanatham, V.; Sanjay, D.V.; Kumar, B.V.S.; Umesh, N.B.; Shekar, B.B.; Mashelkar, U.C. Synthesis, anti-bacterial, anti-asthmatic and anti-diabetic activities of novel N-substituted 2-(4-styrylphenyl)-1H-benzimidazole and N- substituted-3[4-(1H-benzimidazole-2-yl)-phenyl]-acrylic acid tert-butyl ester. ARKIVOC 2008, 10, 37–49. [Google Scholar]
- Valdez, J.; Cedillo, R.; Hernandez-Campos, A.; Yepez, L.; Hernandez-Luis, F.; Navarrete-Vazquez, G.; Tapia, A.; Cortes, R.; Hernandezc, M.; Castilloa, R. Synthesis and antiparasitic activity of 1H-benzimidazole derivatives. Bioorg. Med. Chem. Lett. 2002, 12, 2221–2224. [Google Scholar] [CrossRef]
- Fonseca, T.; Gigante, B.; Gilchrist, T.L. A short synthesis of phenanthro[2,3-d]imidazoles from dehydroabietic acid, Application of the methodology as a convenient route to benzimidazoles. Tetrahedron 2001, 57, 1793–1799. [Google Scholar] [CrossRef]
- Pabba, C.; Wang, H.J.; Mulligan, S.R.; Chen, Z.J.; Stark, T.M.; Gregg, B.T. Microwave- assisted synthesis of 1-aryl-1H-indazolesvia one-pot two-step Cu-catalyzed intramolecular N-arylation of arylhydrazones. Tetrahedron Lett. 2005, 46, 7553–7557. [Google Scholar] [CrossRef]
- Denny, W.A.; Rewcastle, G.W.; Baguley, B.C. Potential antitumor agents. 59. structure-activity relationships for 2-phenylbenzimidazole-4-carboxamidesa, new class of “minimal” DNA-Intercalating agents which may not actvia topoisomerase II. J. Med. Chem. 1990, 33, 814–819. [Google Scholar] [CrossRef]
- Gomez, H.T.; Nunez, E.H.; Rivera, I.L.; Alvarez, J.G.; Rivera, R.C.; Puc, R.M.; Ramos, R.A.; Gutierrez, M.C.R.; Bacab, M.J.C.; Vazquez, G.N. Design, synthesis andin vitro antiprotozoal activity of benzimidazolepentamidine hybrids, Bioorg. Med. Chem. Lett. 2008, 18, 3147–3151. [Google Scholar] [CrossRef]
- Porcari, A.R.; Devivar, R.V.; Kucera, L.S.; Drach, J.C.; Townsend, L.B. Design, synthesis, and antiviral evaluations of 1-(substituted benzyl)-2-substituted-5,6-dichlorobenzimidazoles as nonnucleoside analogues of 2,5,6-trichloro-1-(β-Dribofuranosyl)benzimidazole. J. Med. Chem. 1998, 41, 1252–1262. [Google Scholar] [CrossRef]
- Tamm, I.; Sehgal, P.B. Halobenzimidazoleribosides and RNA synthesis of cells and viruses. Adv. Virus Res. 1978, 22, 187–258. [Google Scholar]
- Roth, M.; Morningstar, M.L.; Boyer, P.L.; Hughes, S.H.; Buckheit, R.W., Jr.; Michejda, C.J. Synthesis and biological activity of novel nonnucleoside inhibitors of HIV-1 reverse transcriptase 2-aryl-substituted benzimidazoles. J. Med. Chem. 1997, 40, 4199–4207. [Google Scholar] [CrossRef] [PubMed]
- Cho, H.S.; Lopes, P.F. Injectable Formulation of a Macrocyclic Lactone and Levamisole. US Patent No. 20130090296, 23 June 2011. [Google Scholar]
- Stefanska, J.Z.; Gralewska, R.; Starosciak, B.J.; Kazimierczuk, Z. Antimicrobial activity of substituted azoles and their nucleosides. Pharmazie 1999, 54, 879–884. [Google Scholar]
- Boiani, M.; Gonzalez, M. Imidazole and benzimidazole derivatives as chemotherapeutic agents. Mini Rev. Med. Chem. 2005, 5, 409–424. [Google Scholar] [CrossRef]
- Warren, M.J. Finding the final pieces of the vitamin B12 biosynthetic jigsaw. Proc. Natl. Acad. Sci. USA 2006, 103, 4799–4800. [Google Scholar] [CrossRef] [PubMed] [Green Version]
- Bino, A.; Baldisserotto, A.; Scalambra, E.; Dissette, V.; Vedaldi, D.E.; Salvador, A.; Durini, E.; Manfredini, S.; Vertuani, S. Design, synthesis and biological evaluation of novel hydroxy-phenyl-1H-benzimidazoles as radical scavengers and UV-protective agents. J. Enzyme Inhib. Med. Chem. 2017, 32, 527–537. [Google Scholar] [CrossRef] [PubMed]
- Dikshit, D.V.; Deval, S.D.; Deodhar, K.D. Synthesis of benzimidazole substituted pyridone azo disperse dyes. Dyes Pigments 1985, 6, 39–46. [Google Scholar] [CrossRef]
- Rangappa, S.K.; Hiremathad, A.; Budagumpi, S.; Nagaraja, B.M. Comprehensive Review in Current Developments of Benzimidazole—Based Medicinal Chemistry. Chem. Biol. Drug Des. 2015, 86, 19–65. [Google Scholar]
- Ali, A.; Muslim, M.; Kamaal, S.; Ahmed, A.; Ahmad, M.; Shahid, M.; Khan, J.A.; Dege, N.; Javed, S.; Mashrai, A. Crystal structure, Hirshfeld and electronic transition analysis of 2-[(1H-benzimidazol-1-yl)-methyl]benzoic acid. Acta Crystallogr. Sect. E 2021, 77, 755–758. [Google Scholar] [CrossRef]
- Fatima, A.; Khanum, G.; Savita, S.; Pooja, K.; Verma, I.; Siddiqui, N.; Javed, S. Quantum computational, spectroscopic, Hirshfeld surface, electronic state and molecular docking studies on sulfanilic acid: An anti-bacterial drug. J. Mol. Liq. 2021, 346, 117150. [Google Scholar] [CrossRef]
- Siddiqui, N.; Javed, S. Quantum computational, spectroscopic investigations on ampyra (4-aminopyridine) by dft/td-dft with different solvents and molecular docking studies. J. Mol. Struct. 2021, 1224, 129021. [Google Scholar] [CrossRef]
- Fatima, A.; Bhadoria, J.; Srivastava, S.K.; Verma, I.; Siddiqui, N.; Javed, S. Exploration of experimental and theoretical proper- ties of 5,5-dimethyl 3-amino-cyclohex-2-en1-one (AMINE DIMEDONE) by DFT/TD-DFT with ethanol and DMSO as solvents and molecular docking studies. J. Mol. Liq. 2021, 338, 116551. [Google Scholar] [CrossRef]
- Fatima, A.; Khanum, G.; Sharma, A.; Garima, K.; Savita, S.; Verma, I.; Siddiqui, N.; Javed, S. Computational, spectroscopic, Hirshfeld surface, electronic state and molecular docking studies on phthalic anhydride. J. Mol. Struct. 2022, 1249, 131571. [Google Scholar] [CrossRef]
- Becke, A.D. Density-functional thermochemistry. III. The role of exact exchange. J. Chem. Phys. 1993, 98, 5648–5652. [Google Scholar] [CrossRef] [Green Version]
- Frisch, M.J.; Trucks, G.W.; Schlegel, H.B.; Scuseria, G.E.; Robb, M.A.; Cheeseman, J.R.; Scalmani, G.; Barone, V.; Petersson, G.A.; Nakatsuji, H.; et al. Gaussian 16, Revision C.01; Gaussian, Inc.: Wallingford, CT, USA, 2016.
- Frau, J.; Munoz, F.; Glossman-Mitnik, D. A conceptual DFT study of the chemical reactivity of magnesium octaethylporphyrin (MgOEP) as predicted by the Minnesota family of density functionals. Quím. Nova 2017, 40, 402–406. [Google Scholar] [CrossRef]
- Fatima, A.; Khanum, G.; Srivastava, S.K.; Verma, I.; Siddiqui, N.; Javed, S. Synthesis, computational, spectroscopic, hirshfeld surface, electronic state and molecular docking studies on diethyl-5-amino-3-methylthiophene-2,4-dicarboxylate. Chem. Phy. Lett. 2021, 784, 139103. [Google Scholar] [CrossRef]
- Jomroz, M.H. Vibrational Energy Distribution Analysis, VEDA4; ScienceOpen, Inc.: Warsaw, Poland, 2004. [Google Scholar]
- Lu, T.; Chen, F. Multiwfn: A Multifunctional Wavefunction AnalyzerChem. J. Comput. Chem. 2012, 33, 580–592. [Google Scholar] [CrossRef]
- Daina, A.; Michielin, O.; Zoete, V. SwissADME: A free web tool to evaluate pharmacokinetics, drug-likeness and medicinal chemistry friendliness of small molecules. Sci. Rep. 2017, 7, 417–427. [Google Scholar] [CrossRef] [Green Version]
- Dennington, R.; Keith, T.; Millam, J. GaussView, Version 5; Semichem Inc.: Shawnee Mission, KS, USA, 2009.
- Morris, G.M.; Huey, R.; Lindstrom, W.; Sanner, M.F.; Belew, R.K.; Goodsell, D.S.; Olson, A.J. Autodock4 Autodock tools4: Automated docking with selective receptor flexibility. J. Comput. Chem. 2009, 16, 2785–2791. [Google Scholar] [CrossRef] [Green Version]
- Varsanyi, G. Assignments for Vibrational Spectra of Seven Hundred Benzene Derivatives; Academic Kiado: Budapset, Hungary, 1973; Volume ½. [Google Scholar]
- Muthu, S.; Ramachandran, G.; Maheswari, J.U. Vibrational spectroscopic investigation on the structure of 2-ethylpyridine-4-carbothioamide. Spectrochim. Acta Part A 2012, 93, 214–222. [Google Scholar] [CrossRef]
- Wade, L.G. (Ed.) Advanced Organic Chemistry, 4th ed.; Wiley: New York, NY, USA, 1992; pp. 723–729. [Google Scholar]
- Jeyavijayan, S.; Arivazhagan, M. Study of density functional theory and vibrational spectra of hypoxanthine. Indian J. Pure Appl. Phys. 2010, 48, 869–874. [Google Scholar]
- Chithambarathanu, T.; Umayourbaghan, V.; Krishnakumar, V. Vibrational analysis of some pyrazole derivatives. Indian J. Pure Appl. Phys. 2003, 41, 844–848. [Google Scholar]
- Silverstein, M.; Bassler, G.C.; Morril, C. Spectroscopic Identification of Organic Compounds; John Wiley: New York, NY, USA, 1981. [Google Scholar]
- Edwin, B.; Joe, I.H. Vibrational spectra analysis of analyeuro degenerative drug Levodopa, A DFT study. J. Mol. Struct. 2013, 1034, 119–127. [Google Scholar] [CrossRef]
- Bhavani, K.; Renuga, S.; Muthu, S.; Narayanan, K.S. Quantum mechanical study and spectroscopic (FT-IR, FT-Raman, 13C, 1H) study, first order hyperpolarizability, NBO analysis, HOMO and LUMO analysis of 2-acetoxybenzoic acid by density functional methods spectrochim. Acta Part A Mol. Biomol. Spectrosc. 2015, 136, 1260–1268. [Google Scholar] [CrossRef]
- Ghalla, H.; Issaoui, N.; Bardak, F.; Atac, A. Intermolecular interactions and molecular docking investigations on 4-methoxybenzaldehyde. Comput. Mater. Sci. 2018, 149, 291–300. [Google Scholar] [CrossRef]
- Luque, F.J.; Lopez, J.M.; Orozco, M. Perspective on Electrostatic Interactions of a Solute with a Continuum. A Direct Utilization of AB initio Molecular Potentials for the Prevision of Solvent Effects. Theor. Chem. Acc. 2000, 103, 343–345. [Google Scholar] [CrossRef]
- Matito, E.; Sola, M. The role of electronic delocalization in transition metal complexes from the electron localization function and the quantum theory of atoms in molecules viewpoints. Coord. Chem. Rev. 2009, 253, 647–665. [Google Scholar] [CrossRef]
- Gillespie, R.J. The valence–shell electron pair repulsion (VSEPR) Theory of directed valency. J. Chem. Educ. 1963, 40, 295. [Google Scholar] [CrossRef]
- Labidi, N.S.; Djebaili, A.; Rouina, I. Substitution effects on the polarizability (α) and first hyperpolarizability (β) of all-trans hexatriene. J. Saudi Chem. Soc. 2011, 15, 29–37. [Google Scholar] [CrossRef] [Green Version]
- Subramanian, N.; Sundaraganesan, N.; Jayabharathi, J. Molecular structure, Spectroscopic (FT-IR, FT-Raman, NMR, UV) studies and first-order molecular hyperpolarizabilities of 1,2-bis(3-methoxy-4-hydroxybenzylidene)hydrazine by density functional method. Spectrochim. Acta Part A 2010, 76, 259–269. [Google Scholar] [CrossRef]
- Sarojini, K.; Krishnan, H.; Kanakam, C.C.; Muthu, S. Synthesis, structural, spectroscopic studies, NBO analysis, NLO and HOMO-LUMO of 4-methyl-N-(3-nitrophenyl)benzene sulfonamide with experimental and theoretical approaches. Spectrochim. Acta Part A 2013, 108, 159–170. [Google Scholar] [CrossRef]
- Kleinman, D.A. Non-linear Dielectric Polarization in Optical Media. Phys. Rev. 1962, 126, 1977–1979. [Google Scholar] [CrossRef]
- Khanum, G.; Fatima, A.; Siddiqui, N.; Agarwal, D.D.; Butcher, R.J.; Srivastava, S.K.; Javed, S. Synthesis, single crystal, characterization and computational study of 2-amino-N-cyclopropyl-5-ethyl-thiophene-3-carboxamide. J. Mol. Struct. 2021, 1250, 131890. [Google Scholar] [CrossRef]
- Raja, M.; Muhamed, R.R.; Muthu, S.; Suresh, M. Synthesis, spectroscopic (FT-IR, FTRaman, NMR, UV–Visible), NLO, NBO, HOMO-LUMO, Fukui function and molecular docking study of (E)-1-(5-bromo-2-hydroxybenzylidene)semicarbazide. J. Mol. Struct. 2017, 1141, 284–298. [Google Scholar] [CrossRef]
- Muthu, S.; Maheswari, J.U. Quantum mechanical study and spectroscopic (FT-IR, FT-Raman, 13C, 1H, UV) study, first order hyperpolarizability, NBO analysis, HOMO and LUMO analysis of 4-[(4-aminobenzene) sulfonyl] aniline by ab initio HF and density functional method. Spectrochim. Acta Part A 2012, 92, 154–163. [Google Scholar] [CrossRef] [PubMed]
- Swarnalatha, N.; Gunasekaran, S.; Muthu, S.; Nagarajan, M. Molecular structure analysis and spectroscopic characterization of 9-methoxy-2H-furo[3,2-g]chromen-2-one with experimental (FT-IR and FT-Raman) techniques and quantum chemical calculations. Spectrochim. Acta Part A 2015, 137, 721–729. [Google Scholar] [CrossRef]
- Scrocco, E.; Tomasi, J. Electronic molecular structure, reactivity and intermolecular forces: Aneuristic interpretation by means of electrostatic molecular potentials. Adv. Quantum Chem. 1978, 1, 115–193. [Google Scholar]
- Raja, M.; Muhamed, R.R.; Muthu, S.; Suresh, M.; Muthu, K. Synthesis, spectroscopic (FT-IR, FT-Raman, NMR, UV–Visible), Fukui function, antimicrobial and molecular docking study of (E)-1-(3-bromobenzylidene)semicarbazide by DFT method. J. Mol. Struct. 2017, 1130, 374–384. [Google Scholar] [CrossRef]
- Vijayakumar, T.; Hubert, I.J.; Nair, C.P.R.; Jayakumar, V.S. Efficient π electrons delocalization in prospective push-pull non-linear optical chromophore 4-[N,N-dimethylamino]-4-nitrostilbene (DANS): A vibrational spectroscopic study. Chem. Phys. 2008, 343, 83–99. [Google Scholar] [CrossRef]
- Palafox, M.A. Scaling factors for the prediction of vibrational spectra of Benzene molecule. Int. J. Quantum Chem. 2000, 77, 661–684. [Google Scholar] [CrossRef]
- Lee, C.; Yang, W.; Parr, R.G. Development of the Colle-Salvetti correlation-energy formula into a functional of the electron density. Phys. Rev. B 1988, 37, 785–789. [Google Scholar] [CrossRef] [Green Version]
- Rastogi, V.K.; Palafox, M.A.; Mittal, L.; Peica, N.; Keifer, W.; Lang, K.; Ojha, S.P. FTIR and FT-Raman spectra and density functional computations of the vibrational spectra, molecular geometry and atomic charges of the biomolecule:5-bromouracil. J. Raman Spectrosc. 2007, 38, 1227–1241. [Google Scholar] [CrossRef]
- Tian, L.U.; Feiwu, C. Calculation of Molecular Orbital Composition. Acta Chim. Sin. 2011, 69, 2393–2406. [Google Scholar]
- Abraham, C.S.; Muthu, S.; Prasana, J.C.; Armakovic, S.; Armakovic, S.J.; Rizwana, B.F.; Geoffrry, B.; David, A.H. Computational evaluation of the reactivity and pharmaceutical potential of an organic amine: A DFT, molecular dynamics simulations and molecular docking approach. Spectrochim. Acta Part A Mol. Biomol. Spectrosc. 2019, 222, 117–188. [Google Scholar] [CrossRef] [PubMed]
Publisher’s Note: MDPI stays neutral with regard to jurisdictional claims in published maps and institutional affiliations. |
© 2022 by the authors. Licensee MDPI, Basel, Switzerland. This article is an open access article distributed under the terms and conditions of the Creative Commons Attribution (CC BY) license (https://creativecommons.org/licenses/by/4.0/).