
Analysis of the Radiation Attenuation Parameters of Cu2HgI4, Ag2HgI4, and (Cu/Ag/Hg I) Semiconductor Compounds

 , ,
, ,  ,
,
Abstract
1. Introduction
2. Materials and Methods
2.1. The Phy-X/PSD Online Software
2.2. Theoretical Basis
3. Results and Discussions
3.1. Radiation Attenuation Parameters
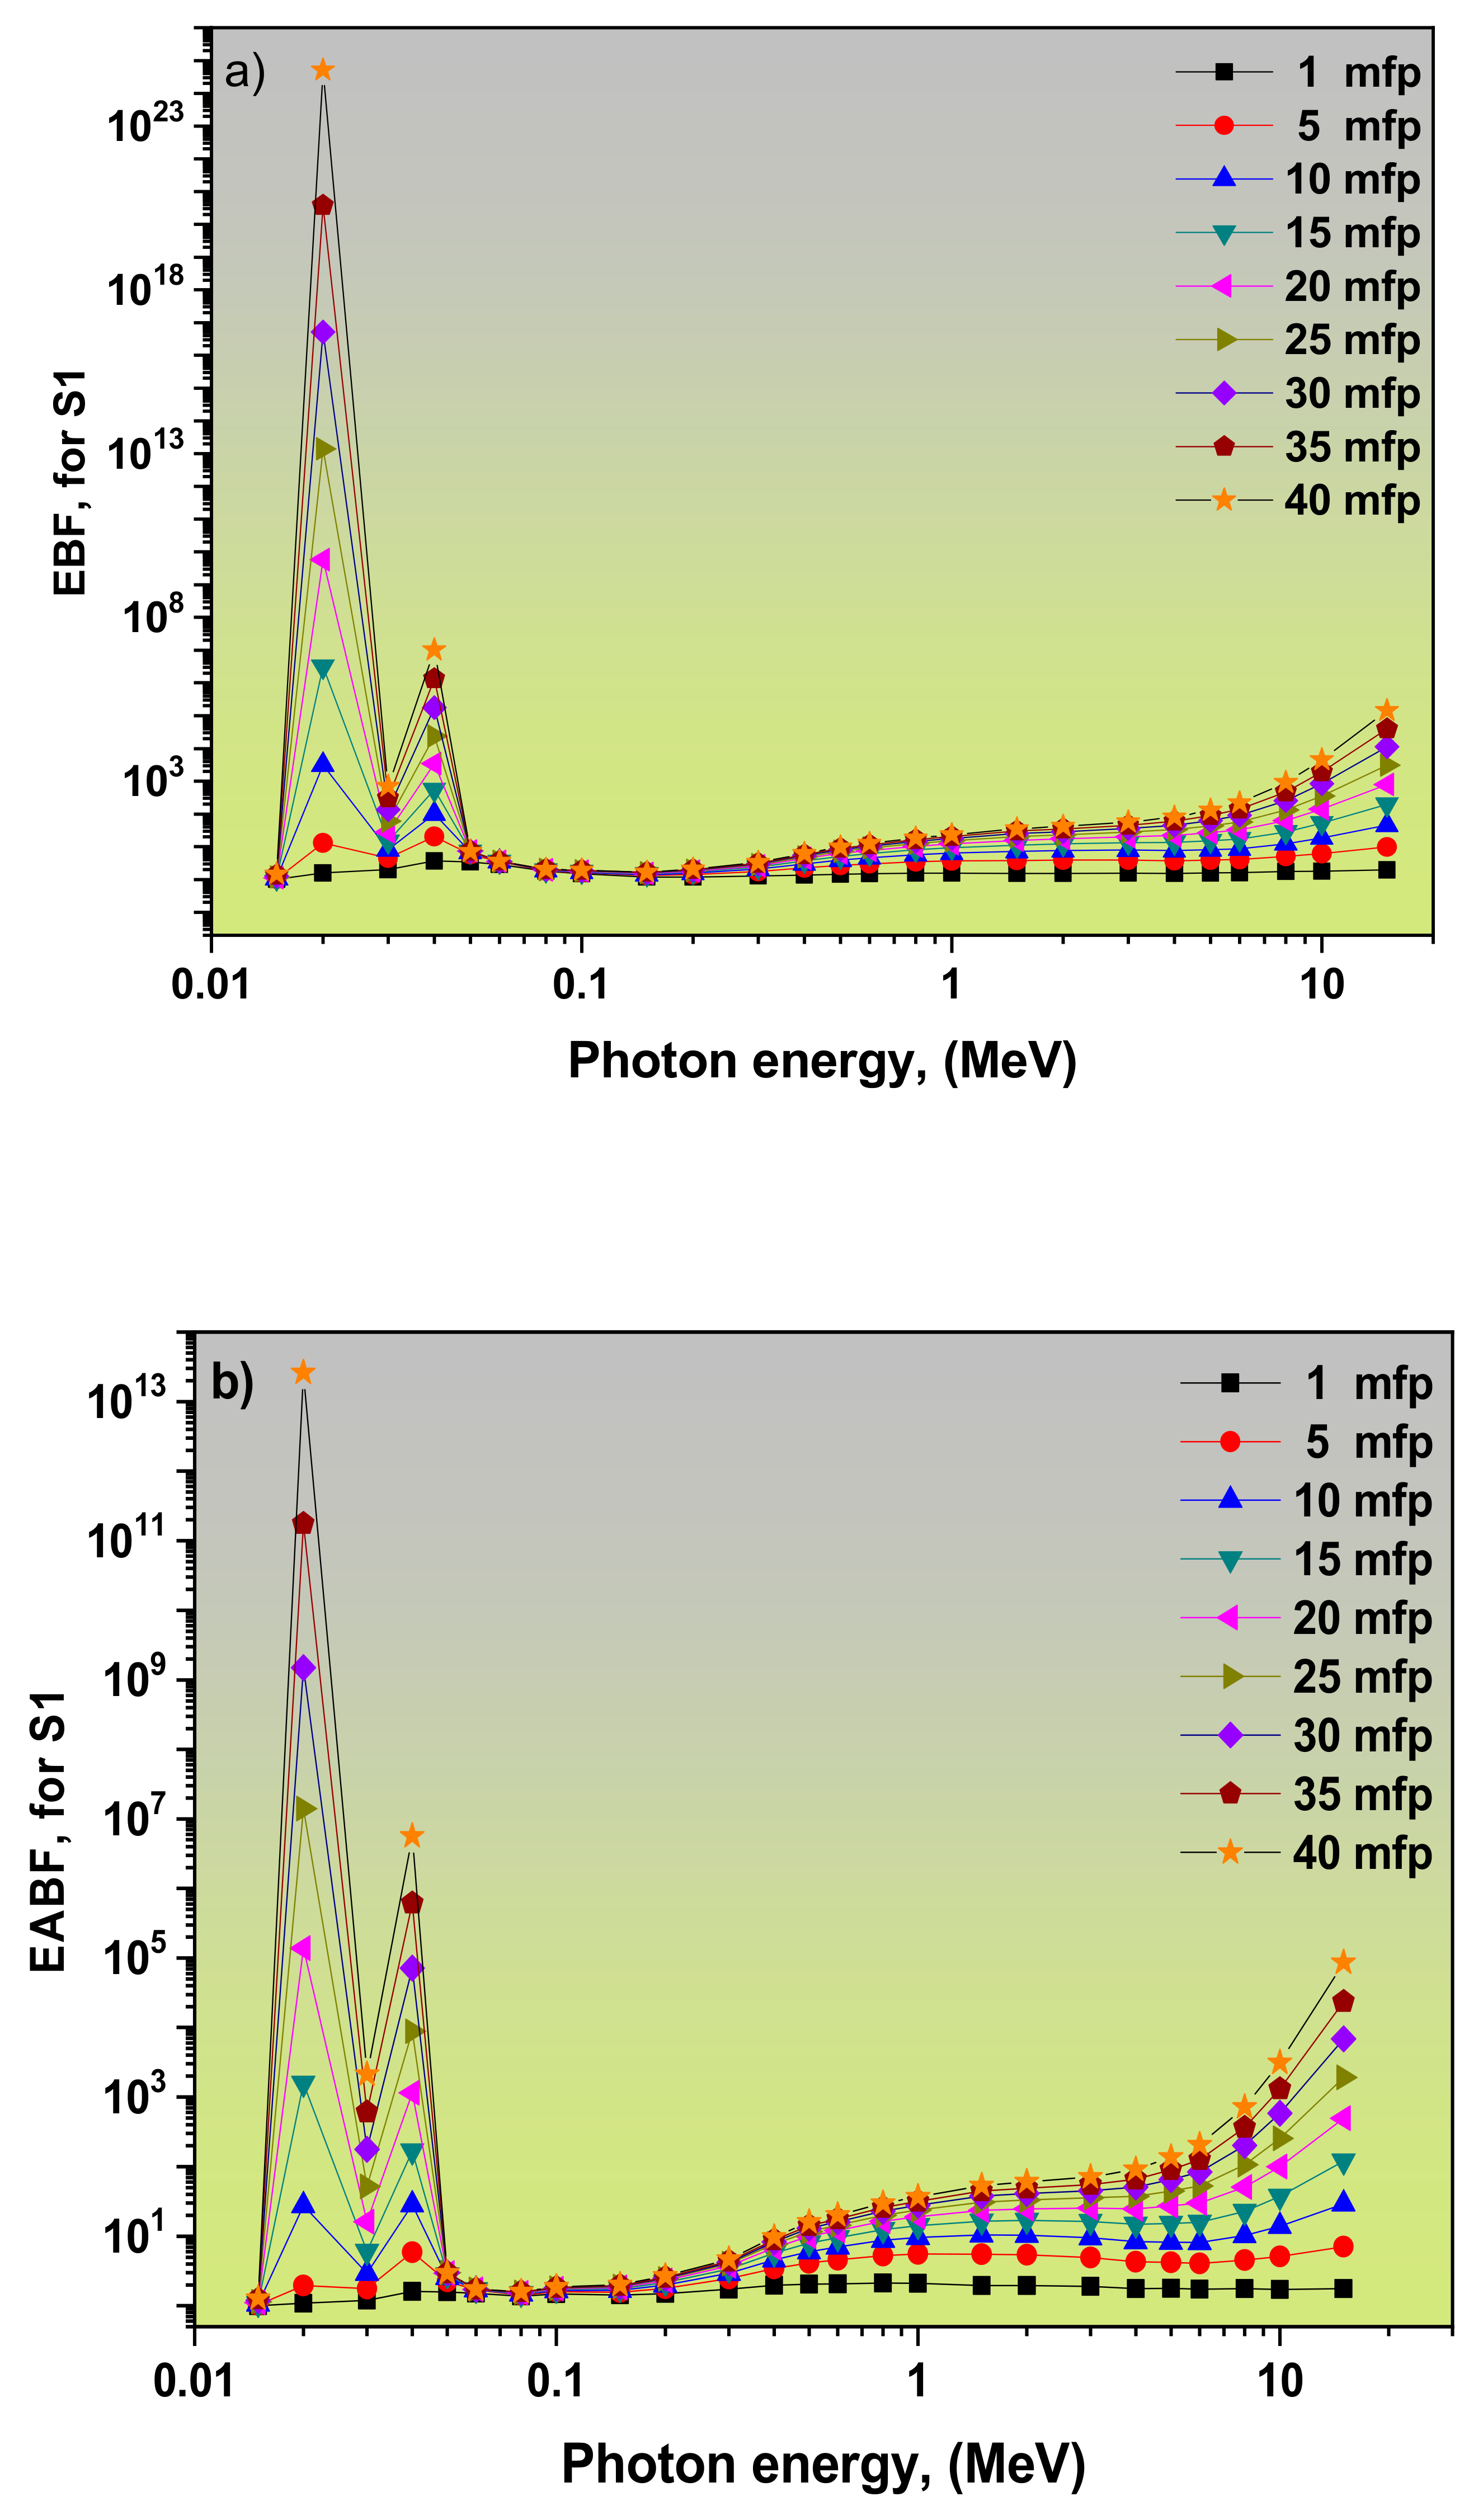
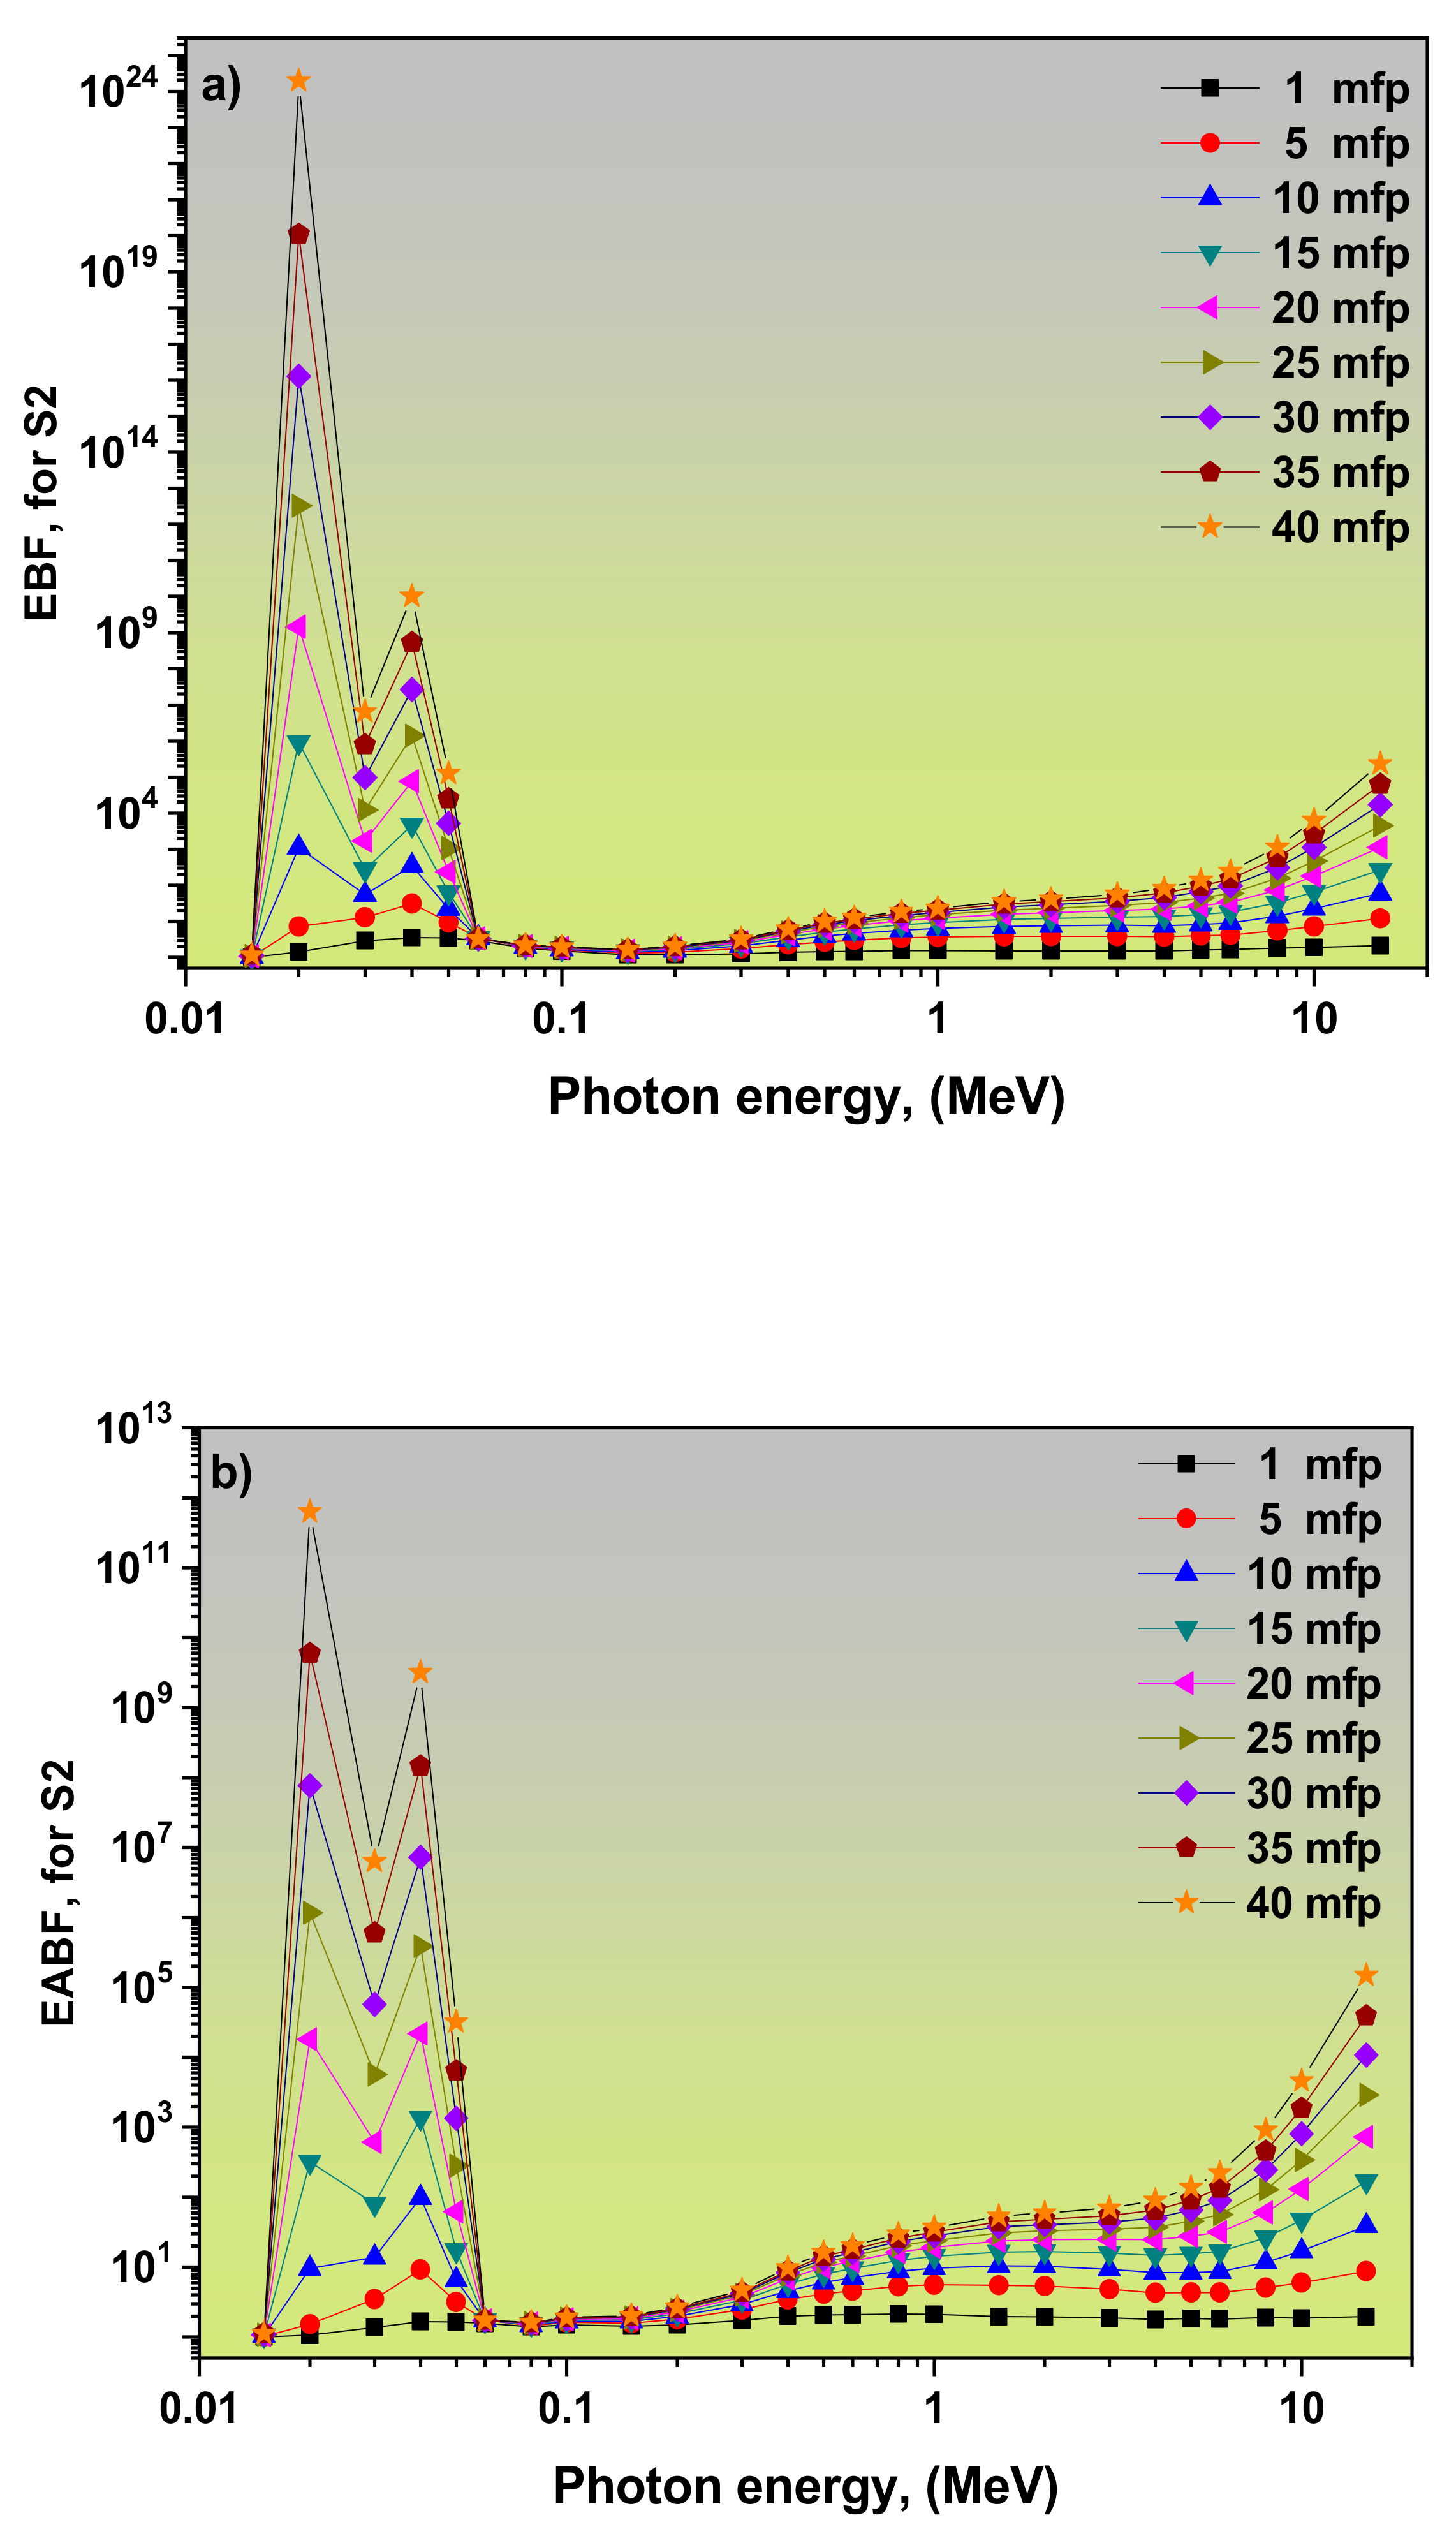
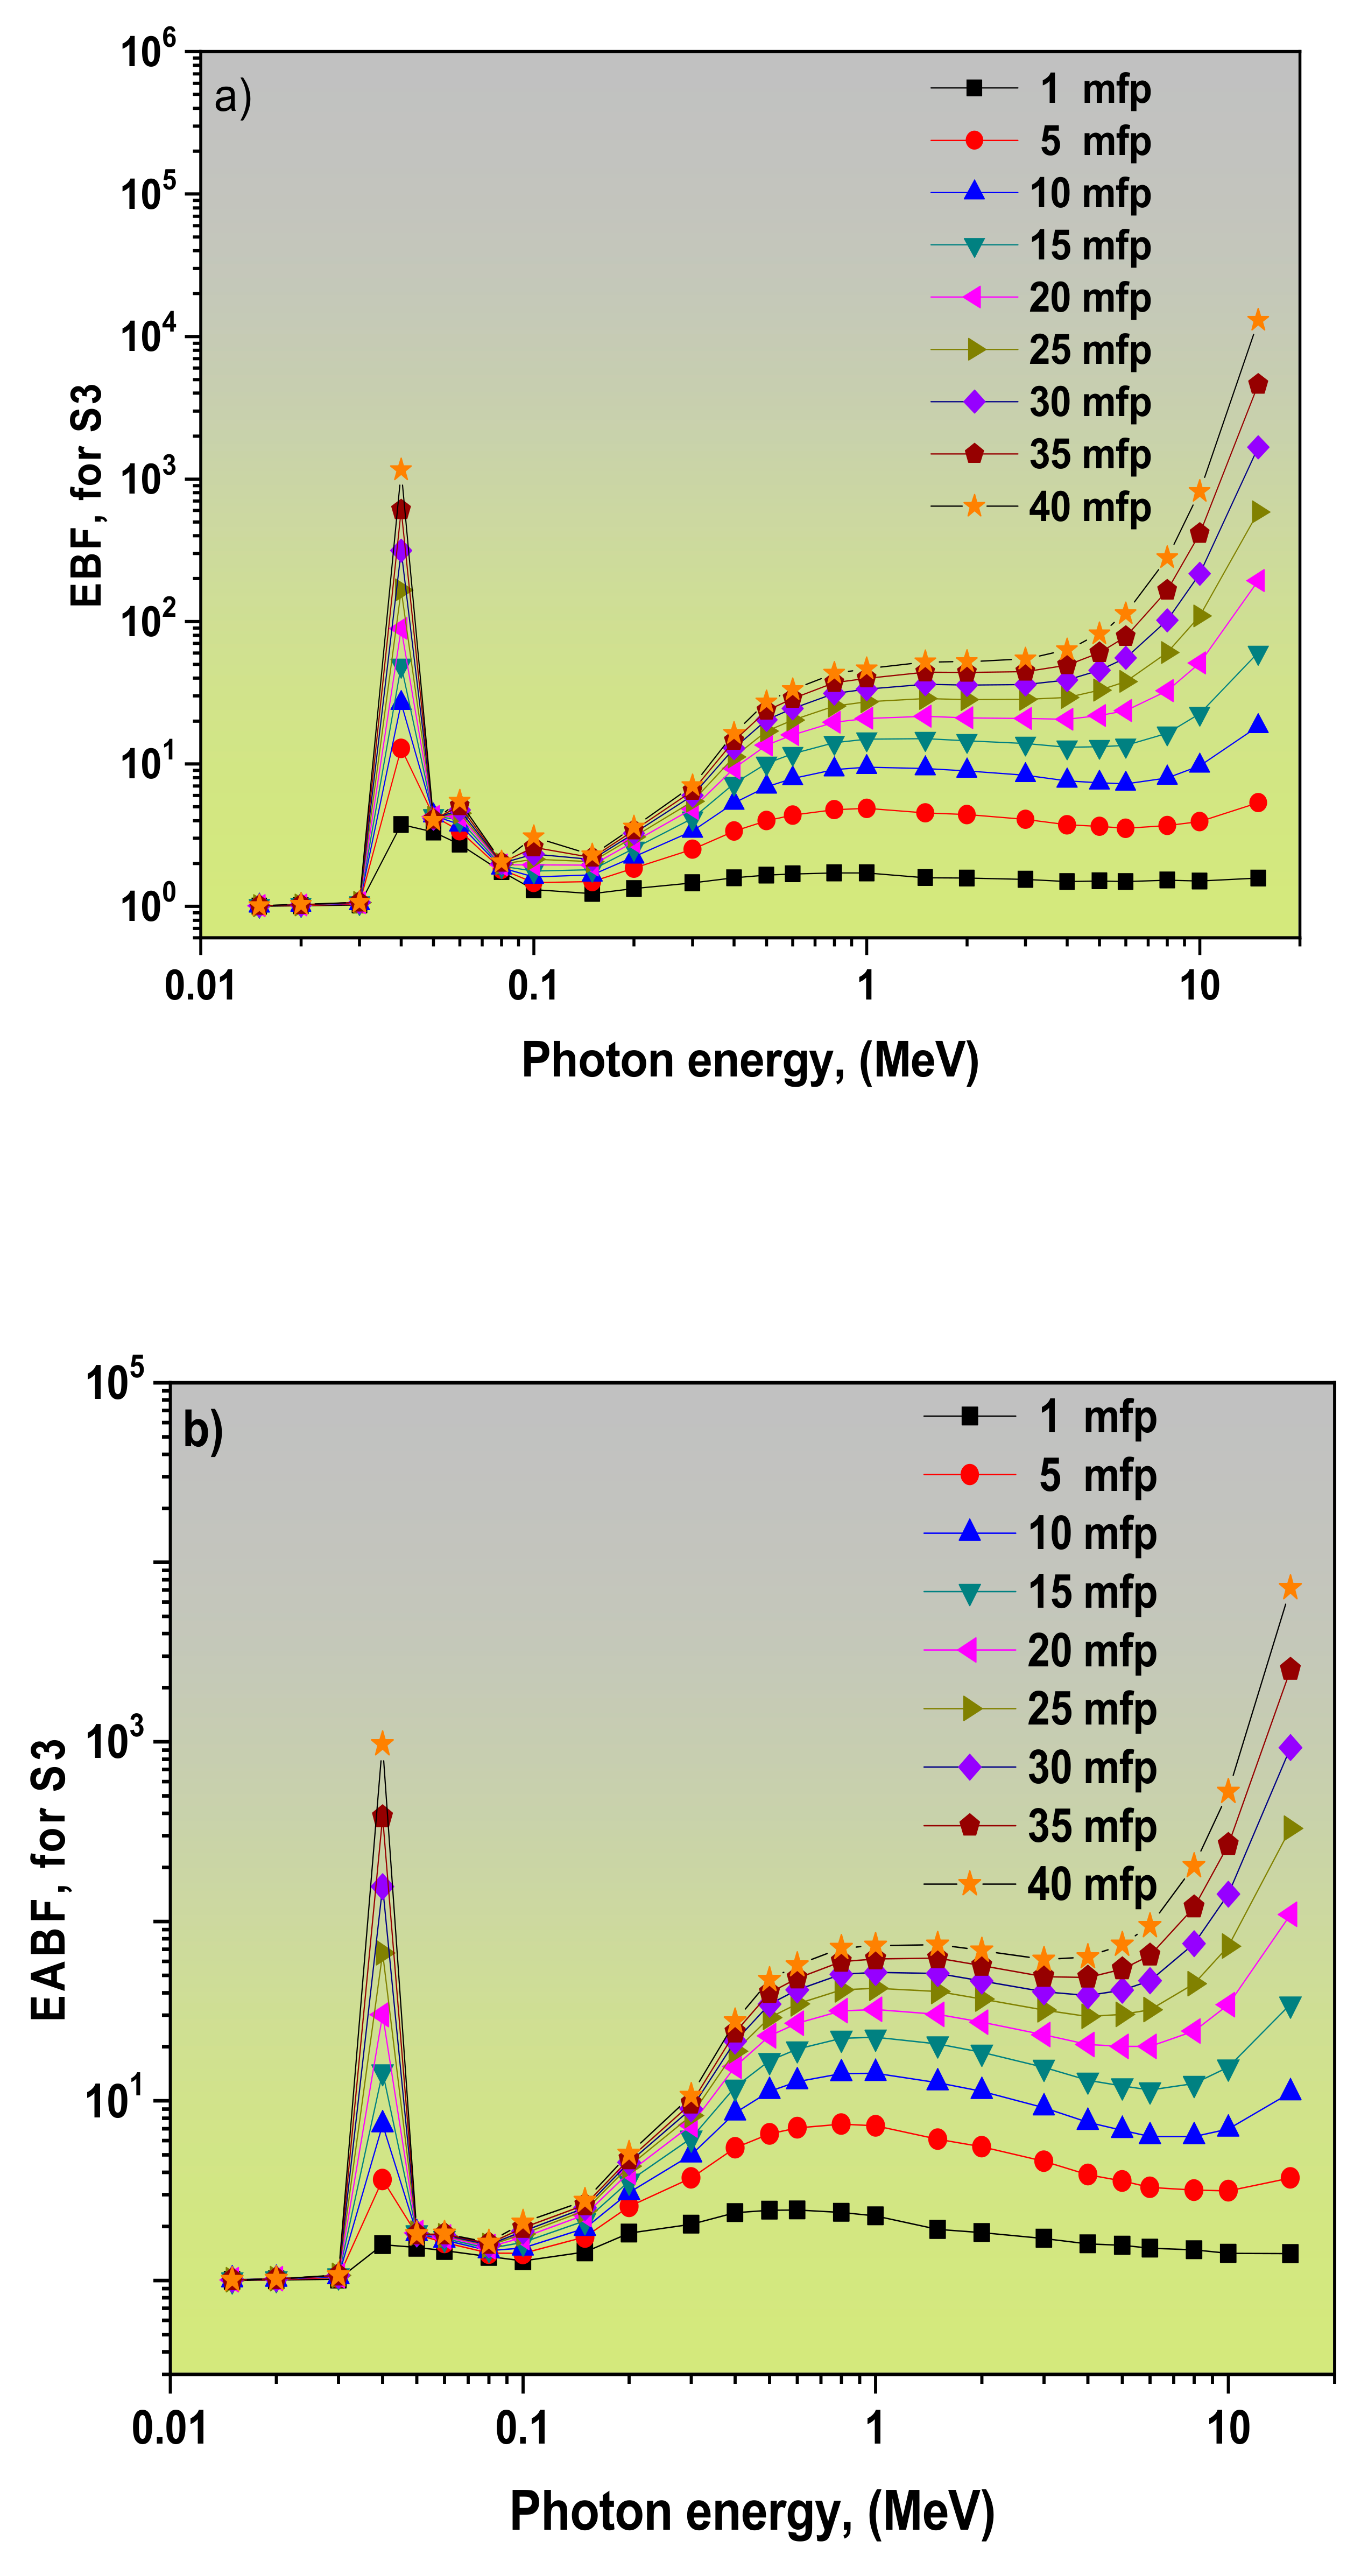
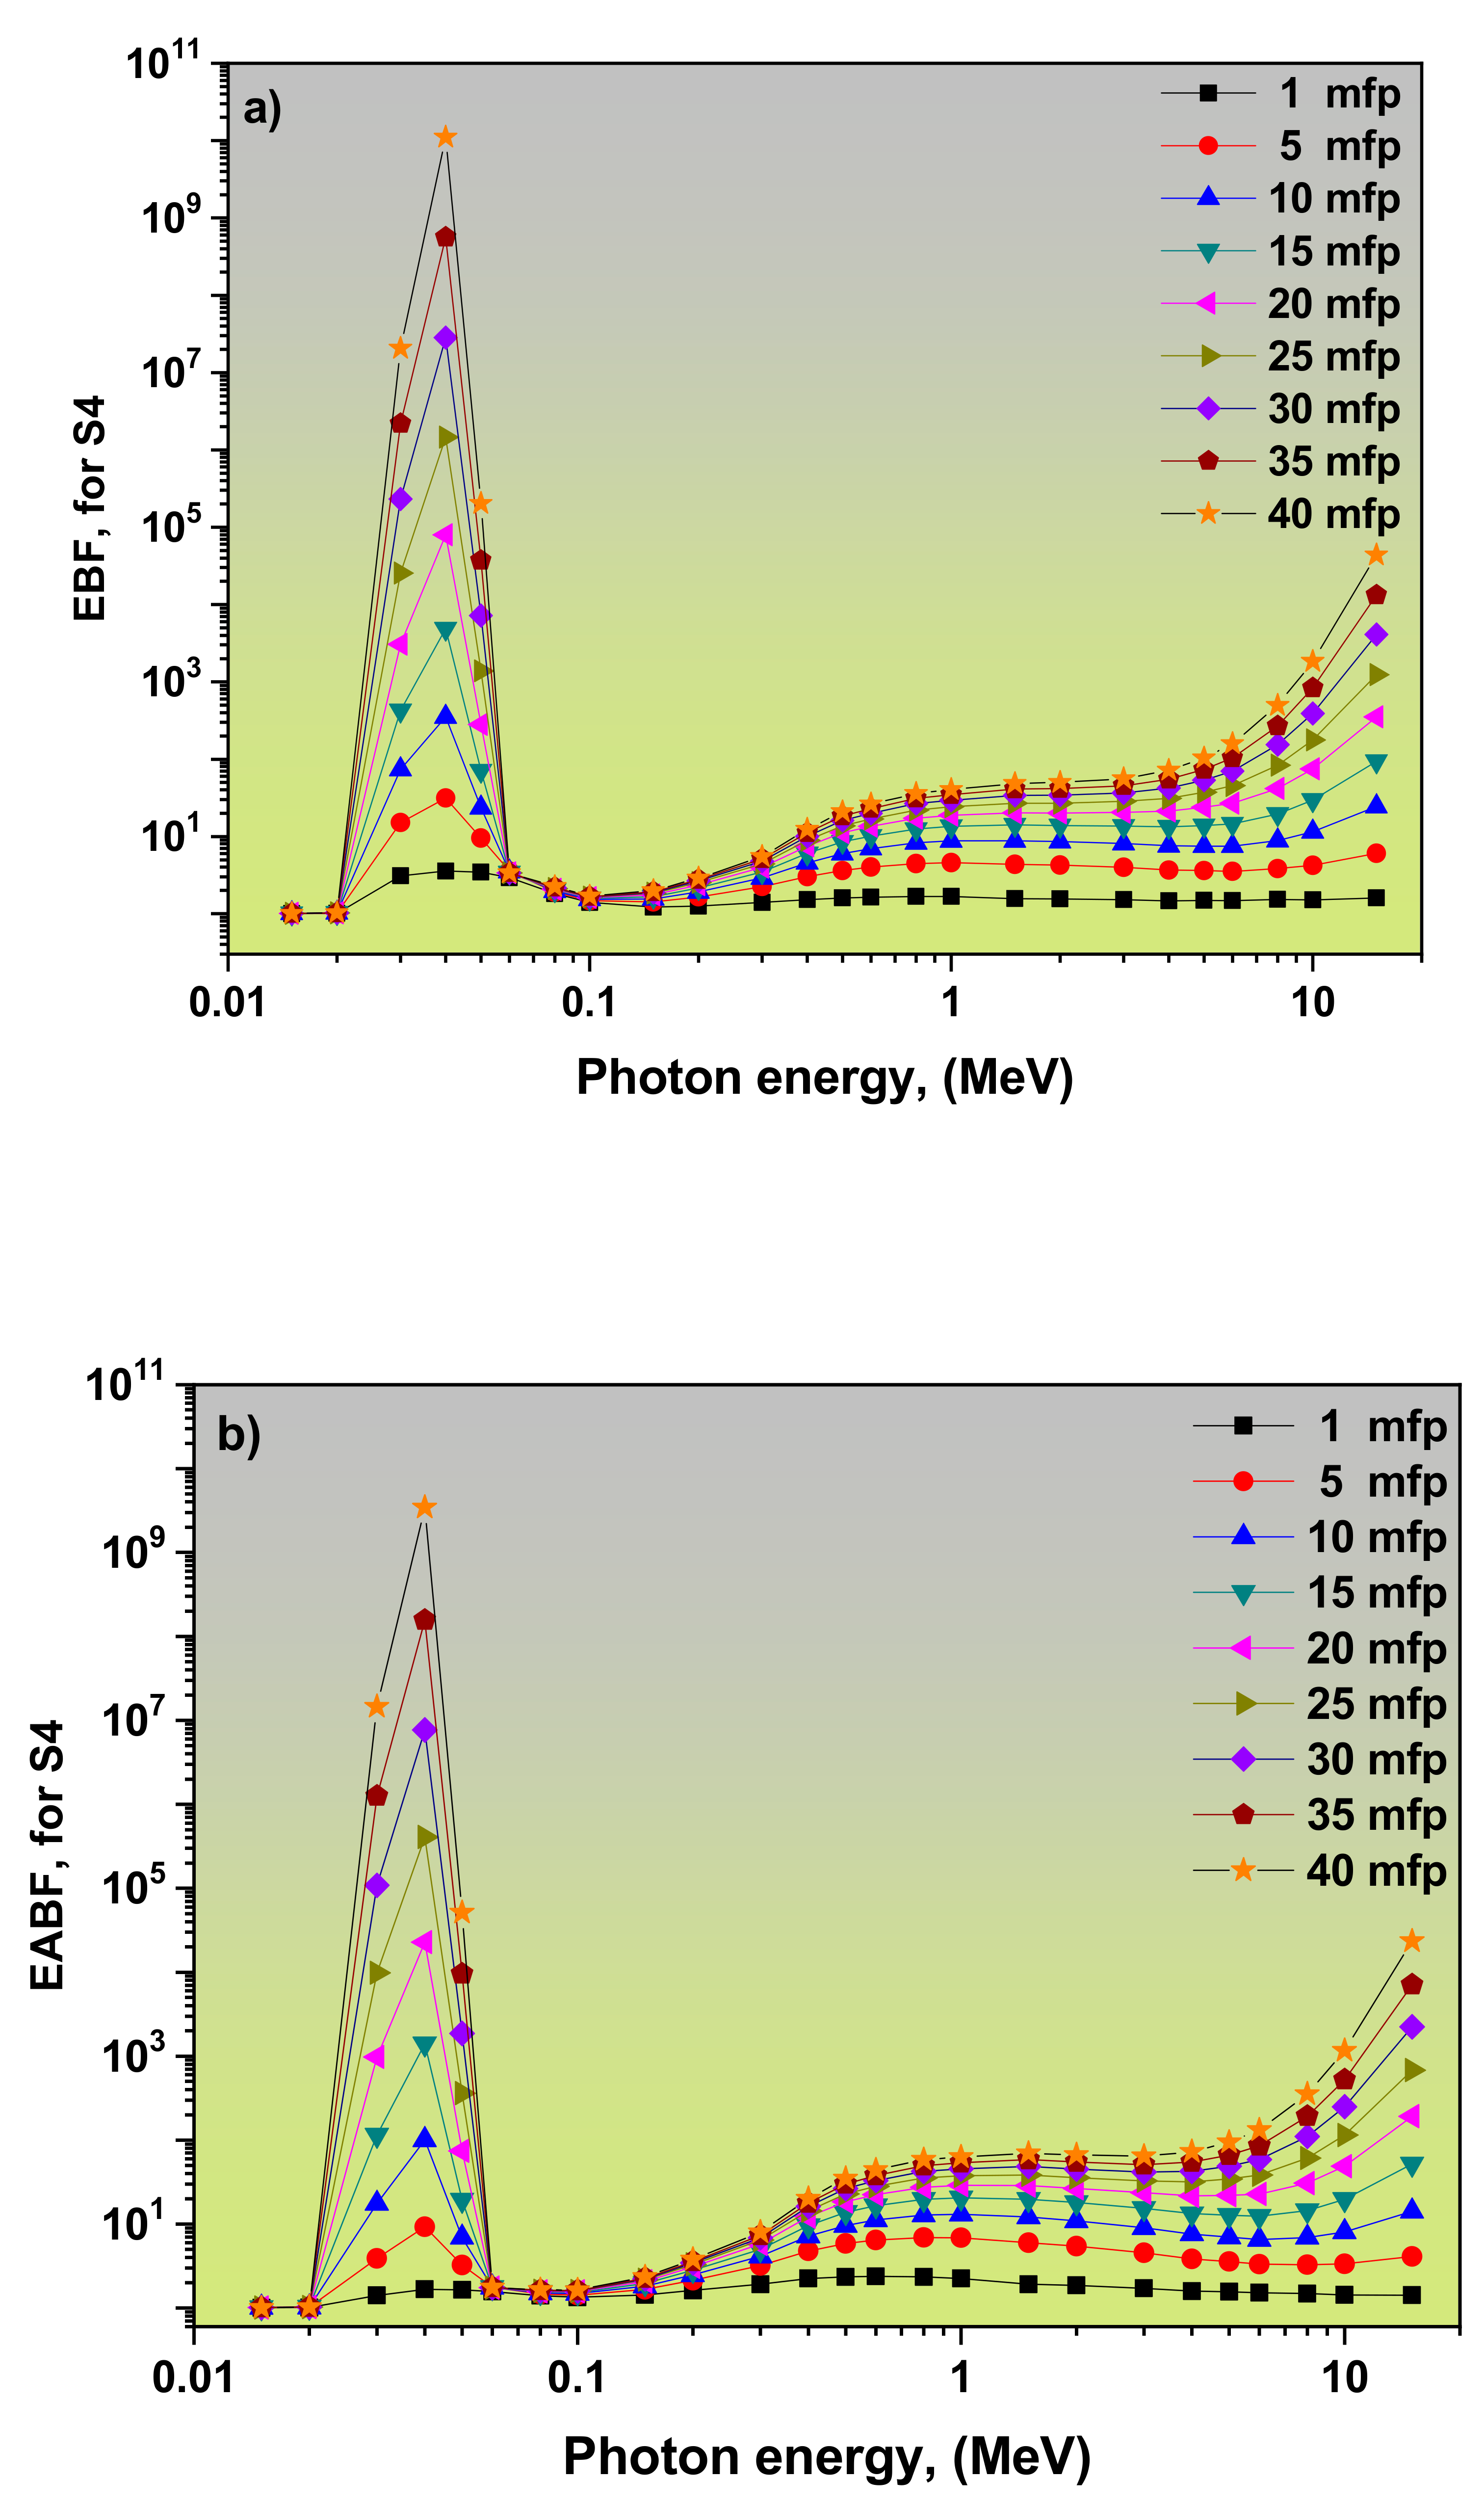
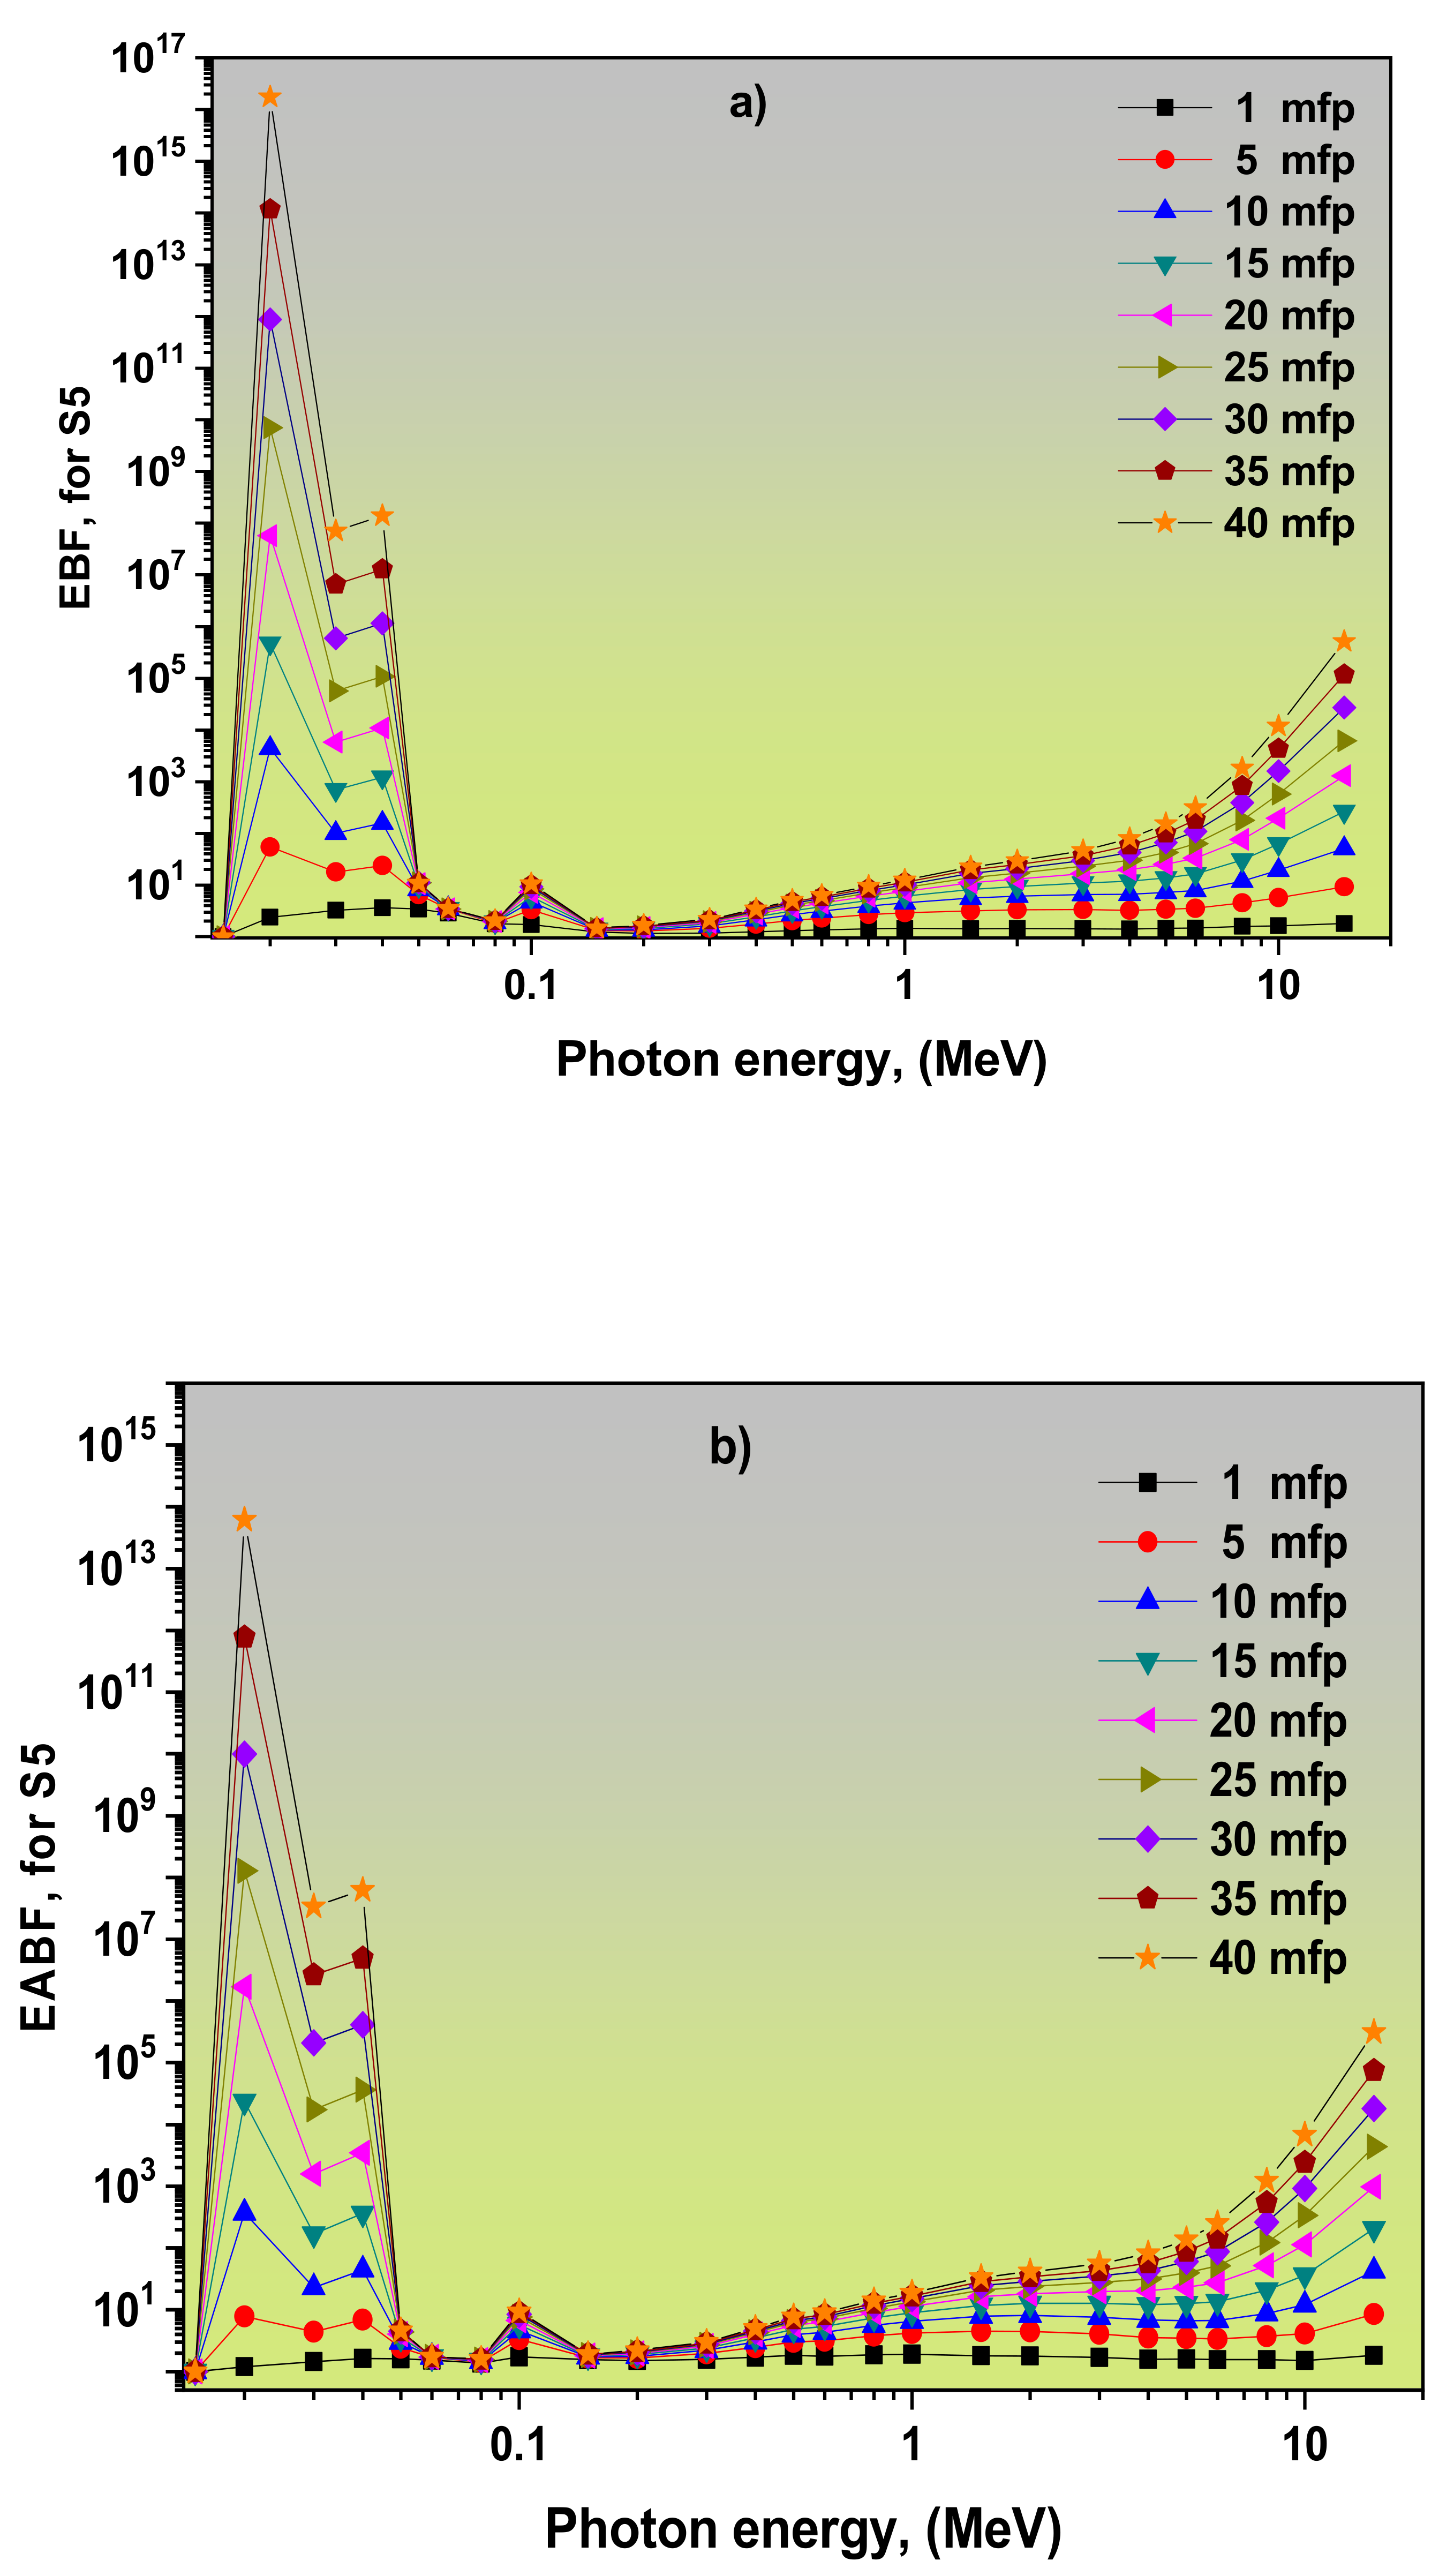
3.2. Dependence of EBF and EABF Values on the Photon Energy
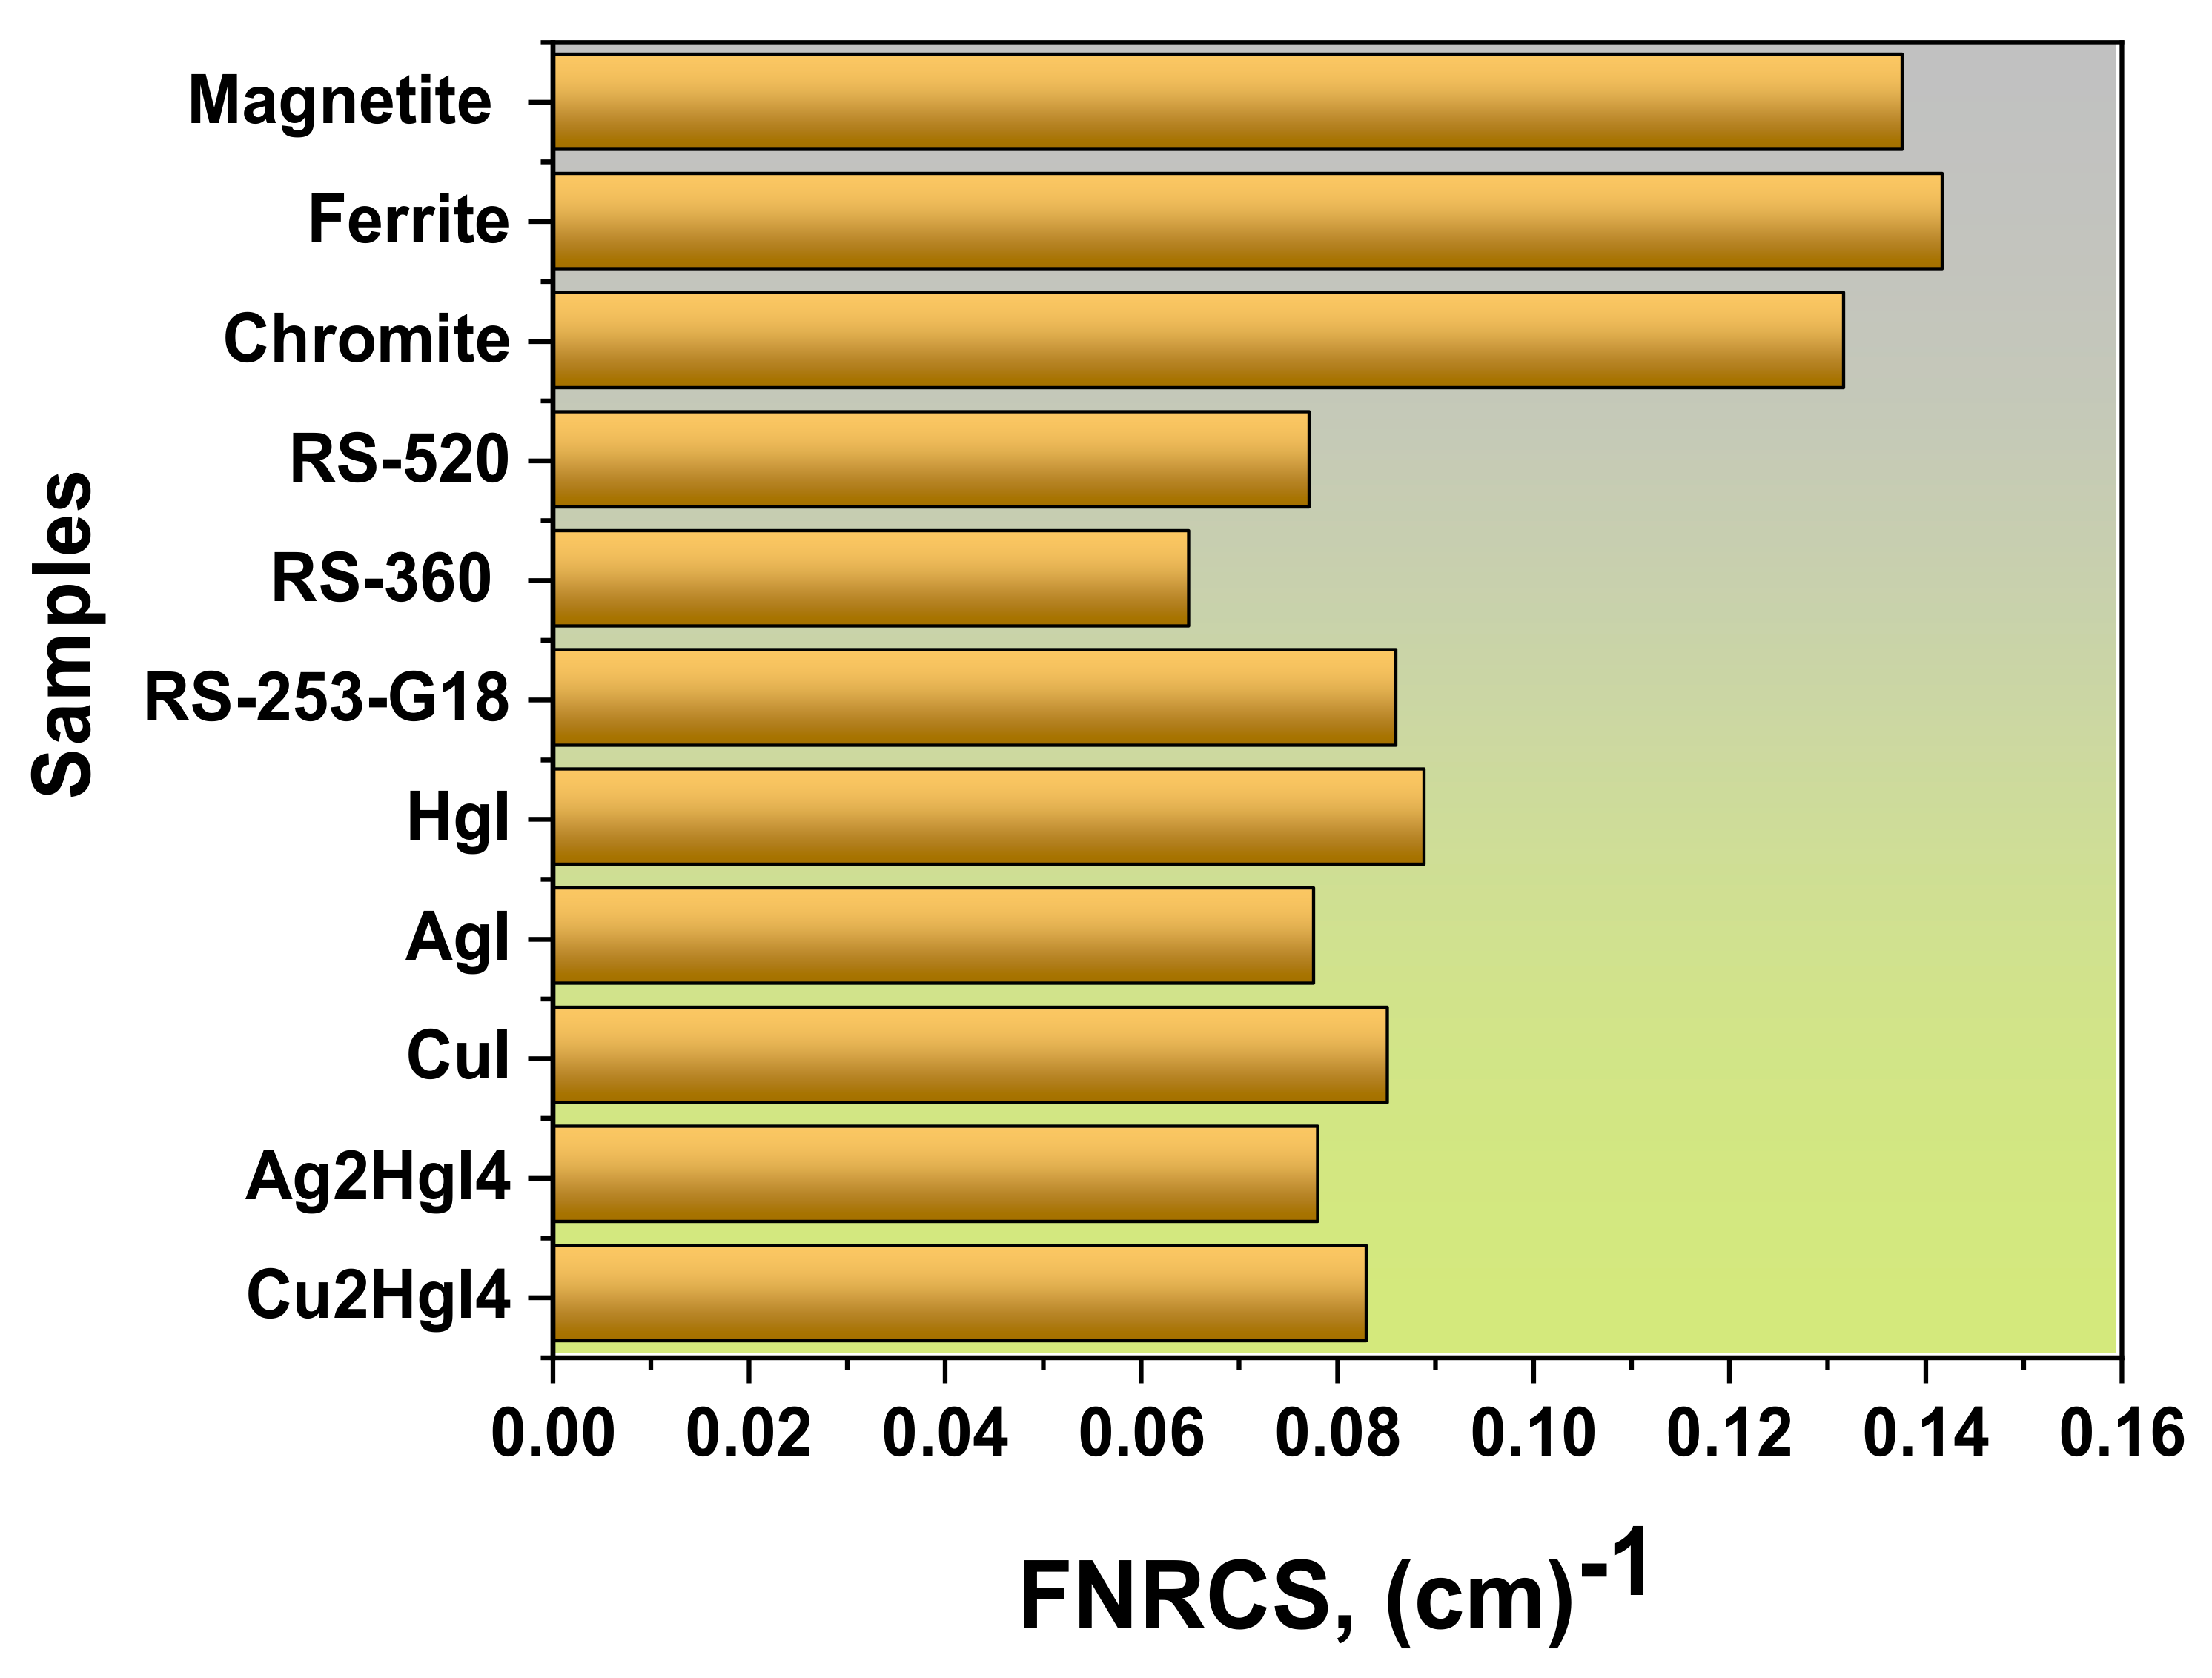
3.3. Fast Neutron Removal Cross-Section (FNRCS)
4. Conclusions
Author Contributions
Funding
Institutional Review Board Statement
Informed Consent Statement
Data Availability Statement
Acknowledgments
Conflicts of Interest
References
- Abdel-Rahman, W.; Podgorsak, E. Energy transfer and energy absorption in photon interactions with matter revisited: A step-by-step illustrated approach. Radiat. Phys. Chem. 2010, 79, 552–566. [Google Scholar] [CrossRef]
- Alım, B. A comprehensive study on radiation shielding characteristics of Tin-Silver, Manganin-R, Hastelloy-B, Hastelloy-X and Dilver-P alloys. Appl. Phys. A 2020, 126, 1–19. [Google Scholar] [CrossRef]
- Demir, D.; Turşucu, A. Studies on mass attenuation coefficient, mass energy absorption coefficient and kerma of some vitamins. Ann. Nucl. Energy 2012, 48, 17–20. [Google Scholar] [CrossRef]
- Lakshminarayana, G.; Elmahroug, Y.; Kumar, A.; Dong, M.G.; Lee, D.-E.; Yoon, J.; Park, T. Li2O–B2O3–Bi2O3 glasses: Gamma-rays and neutrons attenuation study using ParShield/WinXCOM program and Geant4 and Penelope codes. Appl. Phys. A 2020, 126, 1–16. [Google Scholar] [CrossRef]
- White, G.R. The Penetration and Diffusion ofCo60Gamma-Rays in Water Using Spherical Geometry. Phys. Rev. 1950, 80, 154. [Google Scholar] [CrossRef]
- Harima, Y. An historical review and current status of buildup factor calculations and applications. Radiat. Phys. Chem. 1993, 41, 631. [Google Scholar] [CrossRef]
- American National Standard Institute. Gamma-Ray Attenuation Coefficients and Buildup Factors for Engineering Materials; Report ANSI/ANS-6.4.3-1991; American Nuclear Society: La Grange Park, IL, USA, 1991. [Google Scholar]
- Abd-Allah, W.M.; Saudi, H.A.; Shaaban, K.S.; Farroh, H.A. Investigation of structural and radiation shielding properties of 40B2O3–30PbO–(30-x) BaO-x ZnO glass system. Appl. Phys. A 2019, 125, 275. [Google Scholar] [CrossRef]
- Kurudirek, M.; Chutithanapanon, N.; Laopaiboon, R.; Yenchai, C.; Bootjomchai, C. Effect of Bi2O3 on gamma ray shielding and structural properties of borosilicate glasses recycled from high pressure sodium lamp glass. J. Alloy. Compd. 2018, 745, 355–364. [Google Scholar] [CrossRef]
- Lee, C.-M.; Lee, Y.H.; Lee, K.J. Cracking effect on gamma-ray shielding performance in concrete structure. Prog. Nucl. Energy 2007, 49, 303–312. [Google Scholar] [CrossRef]
- Gerward, L.; Guilbert, N.; Jensen, K.; Levring, H. WinXCom—A program for calculating X-ray attenuation coefficients. Radiat. Phys. Chem. 2004, 71, 653–654. [Google Scholar] [CrossRef]
- Battistoni, G.; Broggi, F.; Brugger, M.; Campanella, M.; Carboni, M.; Empl, A.; Fassò, A.; Gadioli, E.; Cerutti, F.; Ferrari, A.; et al. Applications of FLUKA Monte Carlo code for nuclear and accelerator physics. Nucl. Instrum. Methods Phys. Res. Sect. B Beam Interact. Mater. Atoms 2011, 269, 2850–2856. [Google Scholar] [CrossRef]
- PENELOPE2014, A Code System for Monte-Carlo Simulation of Electron and Photon Transport. In Proceedings of the Workshop NEA-1525 PENELOPE2014, Barcelona, Spain, 29 June–3 July 2015.
- Waters, L.S.; McKinney, G.W.; Durkee, J.W.; Fensin, M.; Hendricks, J.S.; James, M.R.; Johns, R.C.; Pelowitz, D.B. The MCNPX Monte Carlo Radiation Transport Code. In AIP Conference Proceedings; American Institute of Physics: College Park, MD, USA, 2007; Volume 896, pp. 81–90. [Google Scholar] [CrossRef]
- Şakar, E.; Özpolat, Ö.F.; Alım, B.; Sayyed, M.; Kurudirek, M. Phy-X/PSD: Development of a user friendly online software for calculation of parameters relevant to radiation shielding and dosimetry. Radiat. Phys. Chem. 2020, 166, 108496. [Google Scholar] [CrossRef]
- Kebaili, I.; Boukhris, I.; Sayyed, M. Gamma-ray shielding properties of lead borovanadate glasses. Ceram. Int. 2020, 46, 19624–19628. [Google Scholar] [CrossRef]
- Abdullah, M.S.; Alhuthali, A.; Kumar, M.; Sayyed, I.; Al-Hadeethi, Y. Investigations of Gamma Ray Shielding Properties of MoO3 Modified P2O5-SiO2-K2O-MgO-CaO GLASSES. Dig. J. Nanomater. Biostruct. 2021, 16, 183–189. [Google Scholar]
- Akkurt, I.; Tekin, H.O. Radiological Parameters for Bismuth Oxide Glasses Using Phy-X/PSD Software. Emerg. Mater. Res. 2020, 9, 1020–1027. [Google Scholar] [CrossRef]
- Madelung, O.; Rössler, U.; Schulz, M. (Eds.) II-VI and I-VII Compounds; Semimagnetic Compounds of Volume B41 ‘Semiconductors’ of Landolt-Börnstein—Group III Condensed Matter; Springer: Berlin/Heidelberg, Germany, 1999. [Google Scholar]
- Martins, J.F.T.; Dos Santos, R.A.; Ferraz, C.D.M.; Oliveira, R.R.; Fiederle, M.; Amadeu, R.D.A.; Dos Santos, R.S.; Da Silva, T.L.B.; Hamada, M.M. Optimization of the HgI2 Crystal Preparation for Application as a Radiation Semiconductor Detector. Stud. Eng. Technol. 2017, 5, 76–88. [Google Scholar] [CrossRef][Green Version]
- Agar, O. Study on gamma ray shielding performance of concretes doped with natural sepiolite mineral. Radiochim. Acta 2018, 106, 1009–1016. [Google Scholar] [CrossRef]
- Tekin, H.O.; Kavaz, E.; Papachristodoulou, A.; Kamislioglu, M.; Agar, O.; Altunsoy Guclu, E.E.; Kilicoglu, O.; Sayyed, M.I. Characterization of SiO2–PbO–CdO–Ga2O3 glasses forcomprehensive nuclear shielding performance: Alpha, proton, gamma, neutron radiation. Ceram. Int. 2019, 45, 19206–19222. [Google Scholar] [CrossRef]
- Sayyed, M.; Kumar, A.; Tekin, H.; Kaur, R.; Singh, M.; Agar, O.; Khandaker, M.U. Evaluation of gamma-ray and neutron shielding features of heavy metals doped Bi2O3-BaO-Na2O-MgO-B2O3 glass systems. Prog. Nucl. Energy 2020, 118, 103118. [Google Scholar] [CrossRef]
- Al-Hadeethi, Y.; Sayyed, M. Radiation attenuation properties of Bi2O3–Na2O–V2O5–TiO2–TeO2 glass system using Phy-X/PSD software. Ceram. Int. 2020, 46, 4795–4800. [Google Scholar] [CrossRef]
- Kumar, A.; Gaikwad, D.; Obaid, S.S.; Tekin, H.; Agar, O.; Sayyed, M. Experimental studies and Monte Carlo simulations on gamma ray shielding competence of (30+x)PbO 10WO3 10Na2O−10MgO–(40−x)B2O3 glasses. Prog. Nucl. Energy 2020, 119, 103047. [Google Scholar] [CrossRef]
- Prabhu, N.; Hegde, V.; Sayyed, M.; Agar, O.; Kamath, S.D. Investigations on structural and radiation shielding properties of Er3+ doped zinc bismuth borate glasses. Mater. Chem. Phys. 2019, 230, 267–276. [Google Scholar] [CrossRef]
- Obaid, S.S.; Sayyed, M.; Gaikwad, D.; Pawar, P. Attenuation coefficients and exposure buildup factor of some rocks for gamma ray shielding applications. Radiat. Phys. Chem. 2018, 148, 86–94. [Google Scholar] [CrossRef]
- Tekin, H.; Kavaz, E.; Altunsoy, E.; Kilicoglu, O.; Agar, O.; Erguzel, T.; Sayyed, M. An extensive investigation on gamma-ray and neutron attenuation parameters of cobalt oxide and nickel oxide substituted bioactive glasses. Ceram. Int. 2019, 45, 9934–9949. [Google Scholar] [CrossRef]
- Kavaz, E.; Tekin, H.; Agar, O.; Altunsoy, E.; Kilicoglu, O.; Kamislioglu, M.; Abuzaid, M.; Sayyed, M. The Mass stopping power/projected range and nuclear shielding behaviors of barium bismuth borate glasses and influence of cerium oxide. Ceram. Int. 2019, 45, 15348–15357. [Google Scholar] [CrossRef]
- Manjunatha, H. A study of gamma attenuation parameters in poly methyl methacrylate and Kapton. Radiat. Phys. Chem. 2017, 137, 254–259. [Google Scholar] [CrossRef]
- Devillers, M. Lifetime of electrons in metals at room temperature. Solid State Commun. 1984, 49, 1019–1022. [Google Scholar] [CrossRef]
- Çelik, A.; Çevik, U.; Bacaksiz, E.; Çelik, N. Effective atomic numbers and electron densities of CuGaSe2 semiconductor in the energy range 6–511 keV. X-Ray Spectrom. 2008, 37, 490–494. [Google Scholar] [CrossRef]
- Turner, J.E. Atoms, Radiation and Radiation Protection, 2nd ed.; John Wiley & Sons: New York, NY, USA, 1995. [Google Scholar]
- Cember, H.; Turner, J.E. Introduction to Health Physics. Second Edition. Phys. Today 1984, 37, 78. [Google Scholar] [CrossRef]
- Partridge, M.; Donovan, E.; Fenton, N.; Reise, S.; Blane, S. Clinical implementation of a computer controlled milling machine for compensating filter production. Br. J. Radiol. 1999, 72, 1099–1103. [Google Scholar] [CrossRef]
- Sayyed, M.; Kaky, K.M.; Şakar, E.; Akbaba, U.; Taki, M.M.; Agar, O. Gamma radiation shielding investigations for selected germanate glasses. J. Non-Cryst. Solids 2019, 512, 33–40. [Google Scholar] [CrossRef]
- Kurudirek, M. Heavy metal borate glasses: Potential use for radiation shielding. J. Alloys Compd. 2017, 727, 1227. [Google Scholar] [CrossRef]
- Al-Hadeethi, Y.; Sayyed, M.; Agar, O. Ionizing photons attenuation characterization of quaternary tellurite–zinc–niobium–gadolinium glasses using Phy-X/PSD software. J. Non-Cryst. Solids 2020, 538, 120044. [Google Scholar] [CrossRef]
- Bashter, I.I. Calculation of radiation attenuation coefficients for shielding concretes. Ann. Nucl. Energy 1997, 24, 1389–1401. [Google Scholar] [CrossRef]
- Sabry, N.; Zahran, H.; Yousef, E.S.; Algarni, H.; Umar, A.; Albargi, H.B.; Yahia, I. Gamma-ray attenuation, fast neutron removal cross-section and build up factor of Cu2MnGe[S, Se, Te]4 semiconductor compounds: Novel approach. Radiat. Phys. Chem. 2021, 179, 109248. [Google Scholar] [CrossRef]
- Cevik, U.; Balta, H.; Çelik, A.; Bacaksız, E. Determination of attenuation coefficients, thicknesses and effective atomic numbers for CuInSe2 semiconductor. Nucl. Instrum. Methods B 2006, 247, 173–179. [Google Scholar] [CrossRef]
- Elbashir, B.; Sayyed, M.; Dong, M.; Elmahroug, Y.; Lakshminarayana, G.; Kityk, I. Characterization of Bi2O3ZnO B2O3 and TeO2ZnO CdO Li2O V2O5 glass systems for shielding gamma radiation using MCNP5 and Geant4 codes. J. Phys. Chem. Solids 2019, 126, 112–123. [Google Scholar] [CrossRef]
- Cevik, U.; Bacaksiz, E.; Damla, N.; Çelik, A. Effective atomic numbers and electron densities for CdSe and CdTe semiconductors. Radiat. Meas. 2008, 43, 1437–1442. [Google Scholar] [CrossRef]
- Al-Buriahi, M.S.; Tonguc, B.T. Study on gamma-ray buildup factors of bismuth borate glasses. Appl. Phys. A 2019, 125, 482. [Google Scholar] [CrossRef]
- Manohara, S.; Hanagodimath, S.; Gerward, L. Energy absorption buildup factors for thermoluminescent dosimetric materials and their tissue equivalence. Radiat. Phys. Chem. 2010, 79, 575. [Google Scholar] [CrossRef]
- Sorenso James, A. Absorption-Edge Transmission Technique Using Ce-139 for Measurement of Stable Iodine Concentration. J. Nucl. Med. 1979, 20, 1286–1293. [Google Scholar]
- Itami, T.; Mizuno, A. The Variation of Absorption Edges of X-Rays for Liquid Hg-Rb Alloys. Mater. Trans. 2008, 49, 2254–2258. [Google Scholar] [CrossRef]
- Lakshminarayana, G.; Dong, M.G.; Al-Buriahi, M.S.; Kumar, A.; Lee, D.-E.; Yoon, J.; Park, T. B2O3–Bi2O3–TeO2–BaO and TeO2–Bi2O3–BaO glass systems: A comparative assessment of gamma-ray and fast and thermal neutron attenuation aspects. Appl. Phys. A 2020, 126, 1–18. [Google Scholar] [CrossRef]


| Refs. | LAC, (cm−1) | MAC, (cm2/g) | Density r, (g/cm3) | Samples | ||
|---|---|---|---|---|---|---|
| 5 MeV | 1 MeV | 5 MeV | 1 MeV | |||
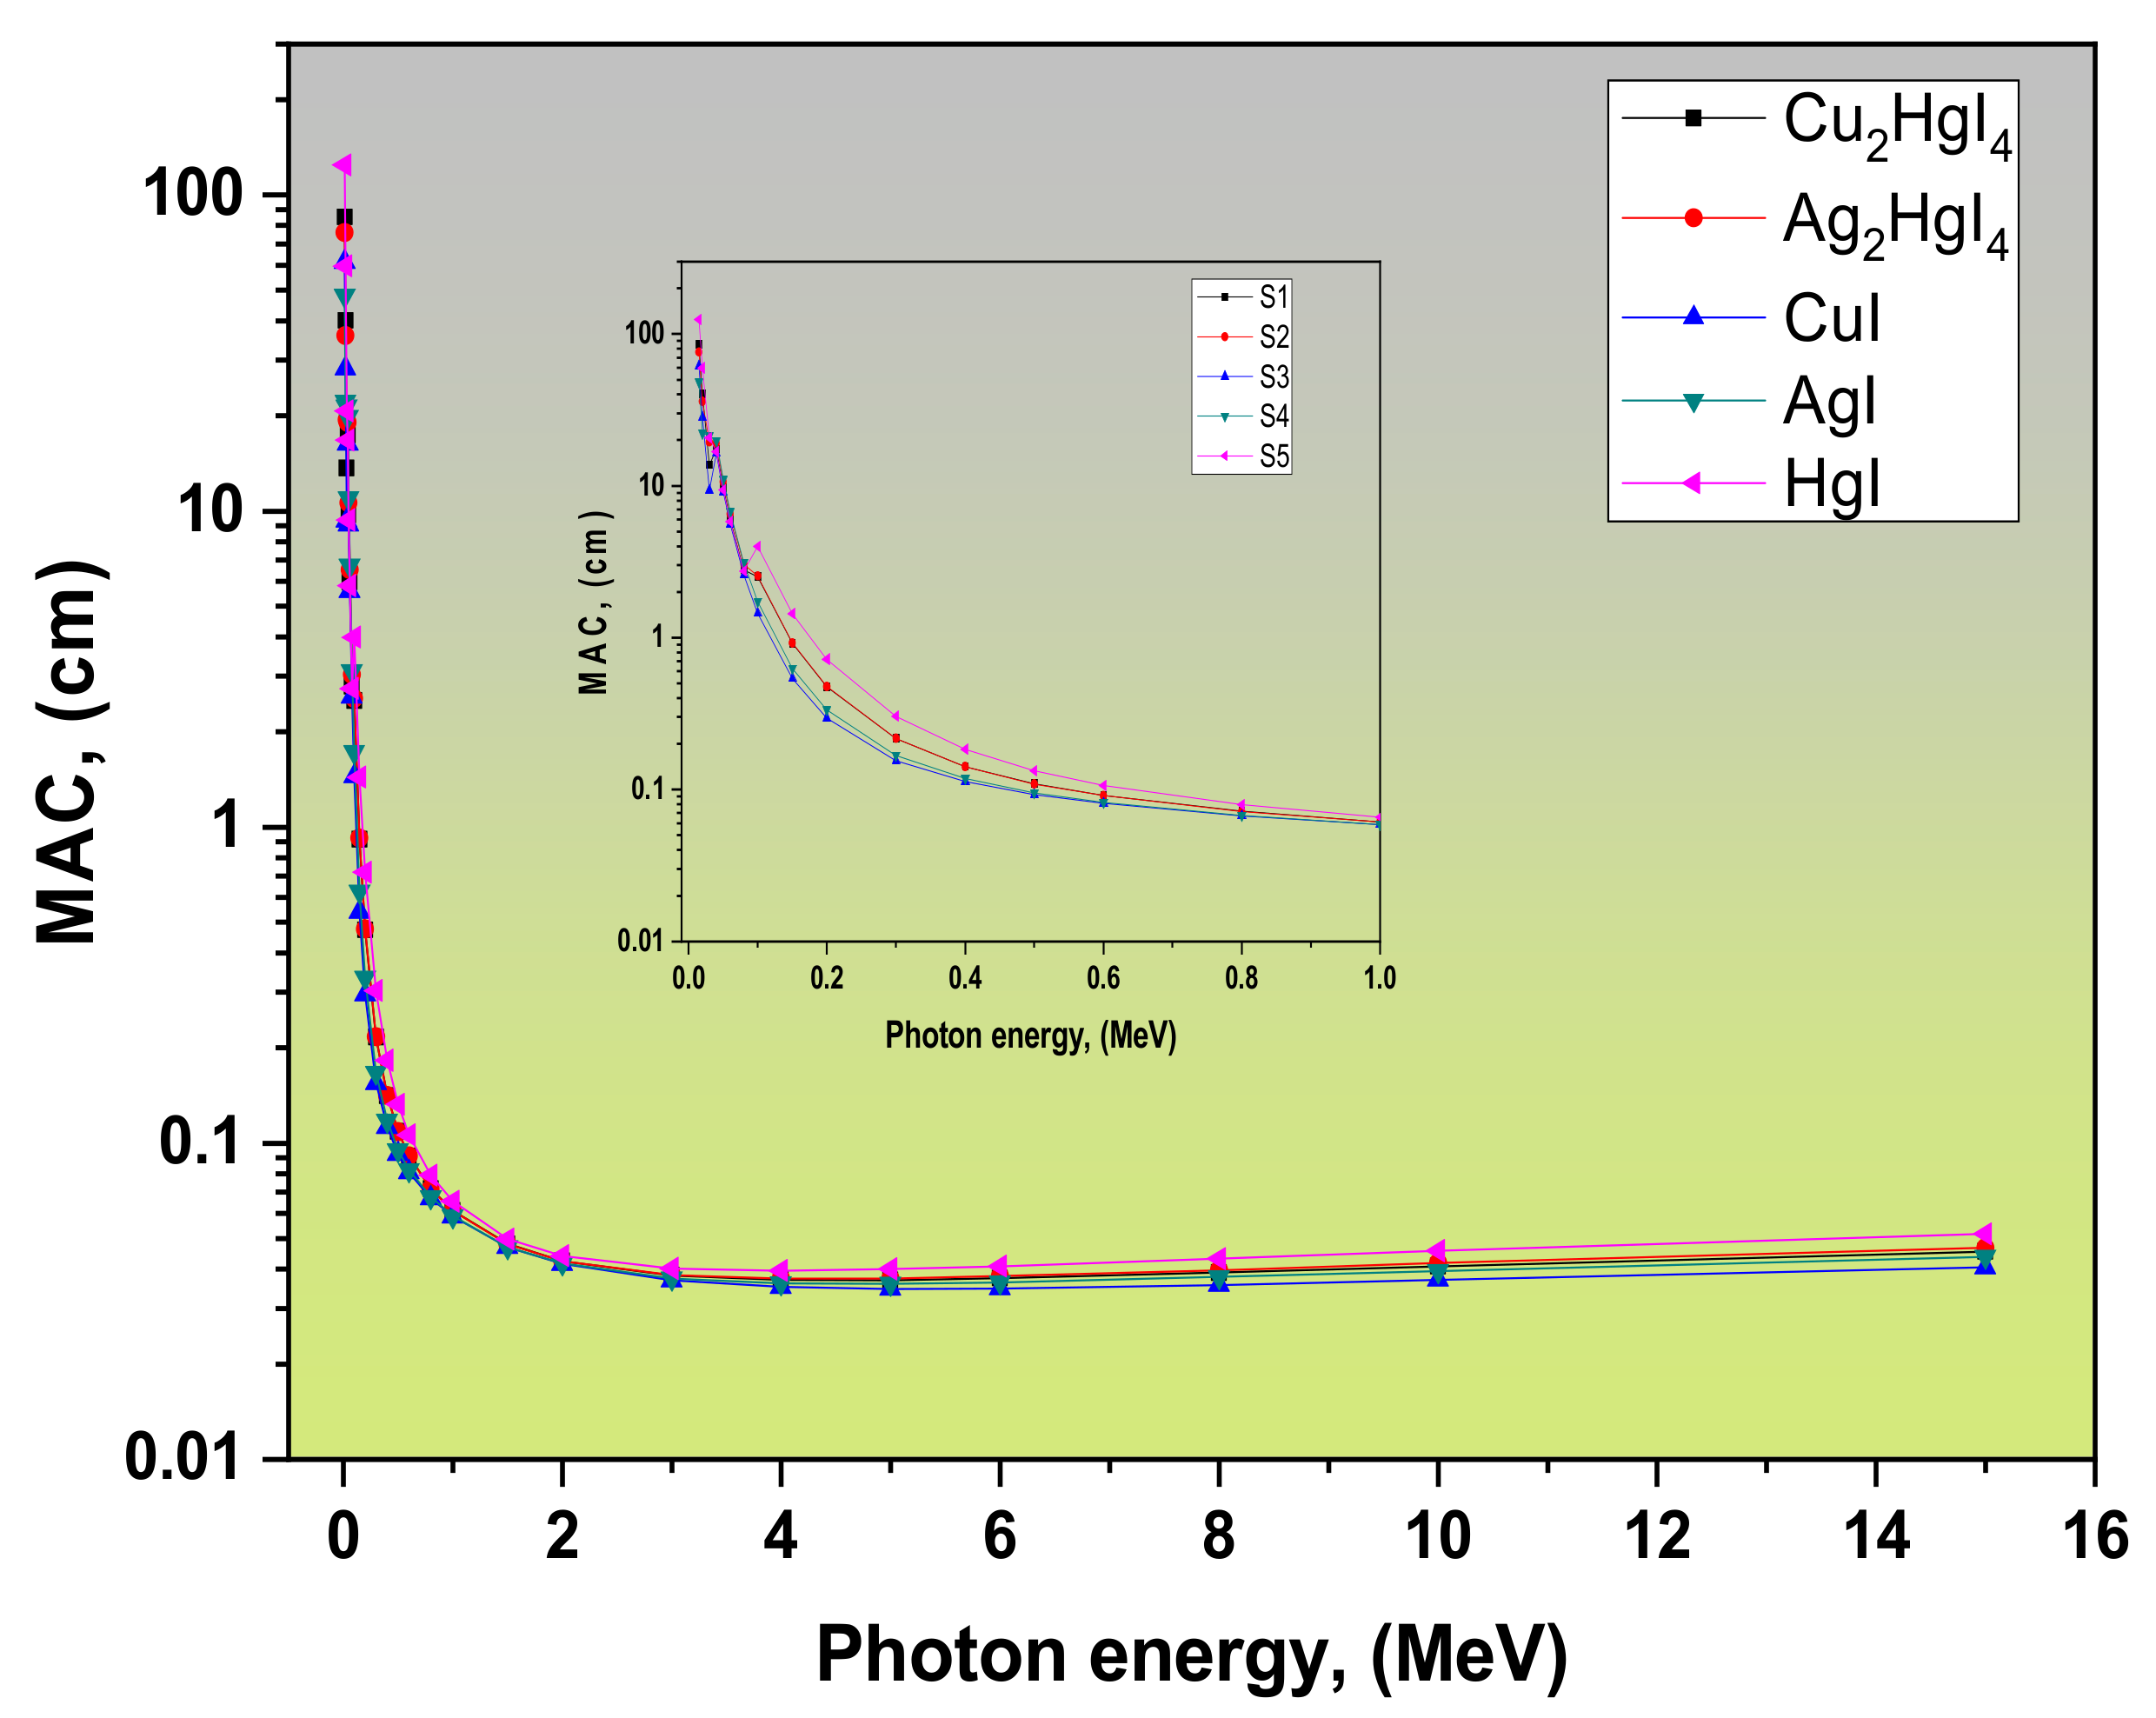
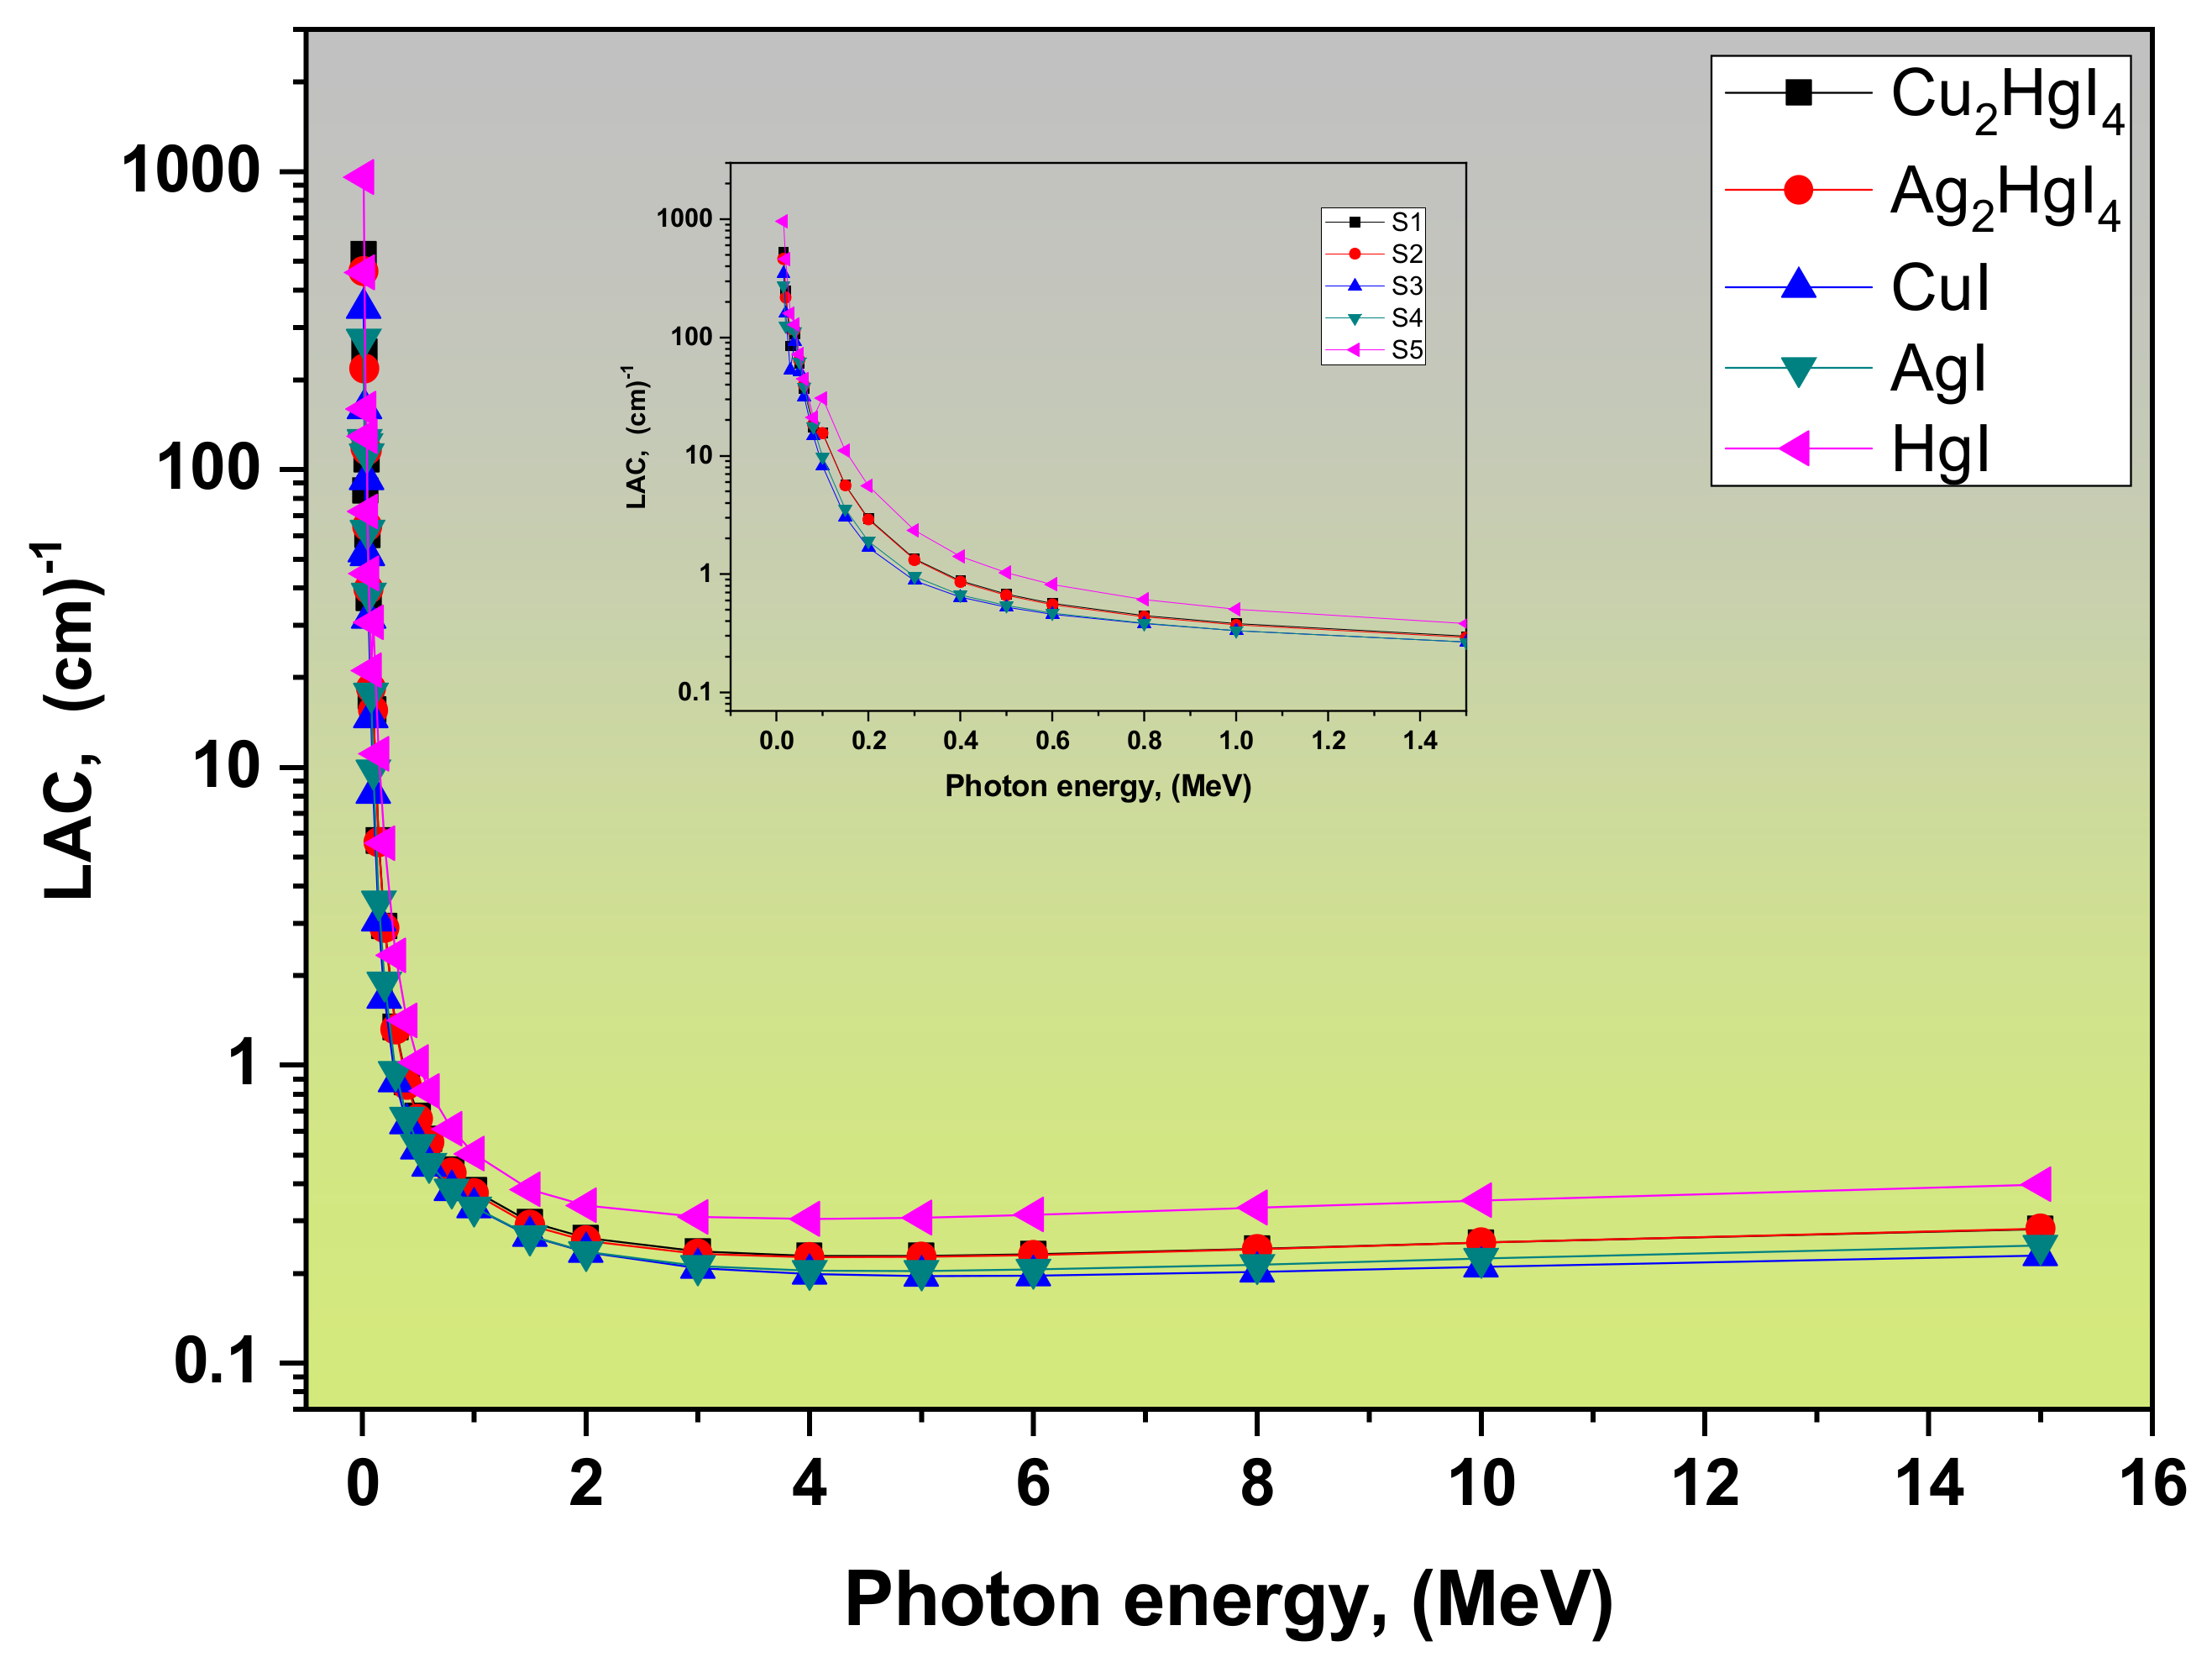
| This work | 0.229 | 0.38 | 0.037 | 0.061 | 6.2 | Cu2HgI4 (S1) |
| 0.227 | 0.371 | 0.037 | 0.061 | 6.07 | Ag2HgI4 (S2) | |
| 0.196 | 0.332 | 0.035 | 0.059 | 5.67 | CuI (S3) | |
| 0.204 | 0.334 | 0.036 | 0.059 | 5.68 | AgI (S4) | |
| 0.308 | 0.504 | 0.04 | 0.065 | 7.7 | HgI (S5) | |
| [39] | 0.0665 | 0.148 | 0.0289 | 0.064 | 2.3 | Ordinary concrete |
| 0.0742 | 0.158 | 0.0297 | 0.063 | 2.5 | Hematite-serpentine concrete | |
| 0.0867 | 0.18 | 0.0299 | 0.062 | 2.9 | Ilmenite-limonite concrete | |
| 0.0894 | 0.192 | 0.0293 | 0.063 | 3.05 | Basalt-magnetite concrete | |
| 0.1036 | 0.215 | 0.0296 | 0.061 | 3.5 | Ilmenite concrete | |
| 0.1263 | 0.255 | 0.0316 | 0.064 | 4 | Steel-scrap concrete | |
| 0.1567 | 0.313 | 0.0307 | 0.061 | 5.11 | Steel-magnetite concrete | |
| Samples | Zeff | Neff | Ceff | Refs. |
|---|---|---|---|---|
| Cu2HgI4 (S1) | 55.82 | 2.82 × 10²³ | 1.26 × 10⁹ | This work |
| Ag2HgI4 (S2) | 62.07 | 2.83 × 10²³ | 1.24 × 10⁹ | |
| CuI (S3) | 39.76 | 2.51 × 10²³ | 1.03 × 10⁹ | |
| AgI (S4) | 50.54 | 2.59 × 10²³ | 1.06 × 10⁹ | |
| HgI (S5) | 73.56 | 2.71 × 10²³ | 1.50 × 10⁹ | |
| CdTe | 50.4 | 2.5 × 10²³ | - | [43] |
| CdSe | 39.2 | |||
| Cu2MnGeS4 | 27.13 | 3.41 × 10²³ | 1.01 × 10⁹ | [40] |
| Cu2MnGeSe4 | 32.11 | 2.71 × 10²³ | 1.04 × 10⁹ | |
| Cu2MnGeTe4 | 39.21 | 2.47 × 10²³ | 1.05 × 10⁹ |
Publisher’s Note: MDPI stays neutral with regard to jurisdictional claims in published maps and institutional affiliations. |
© 2022 by the authors. Licensee MDPI, Basel, Switzerland. This article is an open access article distributed under the terms and conditions of the Creative Commons Attribution (CC BY) license (https://creativecommons.org/licenses/by/4.0/).
Share and Cite
Zahran, H.Y.; Yousef, E.S.; Alqahtani, M.S.; Reben, M.; Algarni, H.; Umar, A.; Albargi, H.B.; Yahia, I.S.; Sabry, N. Analysis of the Radiation Attenuation Parameters of Cu2HgI4, Ag2HgI4, and (Cu/Ag/Hg I) Semiconductor Compounds. Crystals 2022, 12, 276. https://doi.org/10.3390/cryst12020276
Zahran HY, Yousef ES, Alqahtani MS, Reben M, Algarni H, Umar A, Albargi HB, Yahia IS, Sabry N. Analysis of the Radiation Attenuation Parameters of Cu2HgI4, Ag2HgI4, and (Cu/Ag/Hg I) Semiconductor Compounds. Crystals. 2022; 12(2):276. https://doi.org/10.3390/cryst12020276
Chicago/Turabian StyleZahran, Heba Y., El Sayed Yousef, Mohammed S. Alqahtani, Manuela Reben, Hamed Algarni, Ahmad Umar, Hasan B. Albargi, Ibrahim S. Yahia, and Nehal Sabry. 2022. "Analysis of the Radiation Attenuation Parameters of Cu2HgI4, Ag2HgI4, and (Cu/Ag/Hg I) Semiconductor Compounds" Crystals 12, no. 2: 276. https://doi.org/10.3390/cryst12020276
APA StyleZahran, H. Y., Yousef, E. S., Alqahtani, M. S., Reben, M., Algarni, H., Umar, A., Albargi, H. B., Yahia, I. S., & Sabry, N. (2022). Analysis of the Radiation Attenuation Parameters of Cu2HgI4, Ag2HgI4, and (Cu/Ag/Hg I) Semiconductor Compounds. Crystals, 12(2), 276. https://doi.org/10.3390/cryst12020276