Abstract
The electro-optical features of the PDLC films applied with a low-frequency square wave voltage were investigated. The transmittance curves indicated the double frequency of the applied voltage at 0–50 Hz, which resulted from the relaxation of an internal electric field polarized by ions in LC droplets. When the local electric field was reversed, the internal polarization electric field could be maintained and superimposed on the local electric field. The relaxation of the internal polarized electric field resulted in the relaxation of the transmittance. Furthermore, the transmittance curves changed with the frequency of the applied voltage.
1. Introduction
Polymer-dispersed liquid crystal (PDLC) is a composite material consisting of LC droplets randomly dispersed into an isotropic polymer matrix and represents a significant new class of electro-optical materials [1,2,3,4]. The electro-optical properties of PDLCs are dependent on the electrically controlled light scattering from the dispersed LC droplets. An alternating current (AC) voltage (frequency range of 101–103 Hz) is typically used to prevent conductivity effects and typically applied to voltages from 20 to 100 Vrms to keep the devices transparent [5,6]. LC droplets in PDLCs can respond to an applied electrical field, aligning to maximize the dielectric constant. For LC with positive dielectric anisotropy, LC droplets can be in the direction of the applied electric field so that PDLC films can be switched from an opaque off-state to a highly transparent on-state [7,8]. The competition between the applied electric field and LC elastic and viscous torques governs the response time and switching voltage of PDLCs [9]. The response time of LC droplets is in the order of 10−3 s. Compared with conventional LCs and other heterogeneous systems, PDLCs have a new operating principle and dynamic characteristics [10].
In general, uncontrolled ions may occur in the LC during production [11,12,13], and almost all LCs contain free ions. For example, the ion concentration in LC E7 was estimated to be 1015/cm3 [14,15]. The free ions could decrease the dielectric constant and refractive index in LC droplets [16] and induce an internal polarization electric field (Eint) to affect the hysteresis and memory state in the PDLC films [8,17,18]. The voltage drop across the LC droplets is just a fraction of the voltage applied in a PDLC film because of a high voltage drop through the polymer matrix [17,19,20]. The electric field applied to LC droplets can be called the local electric field (Eloc) [20]. With a local electric field, the redistributed ions can accumulate on the surface of LC droplets to form Eint, which opposes Eloc [12,21]. Eint could play an essential role in the electro-optical response for PDLC devices. For example, Eint can screen the applied electric field (the charge screening effect) [12,14]. The PDLC films can be switched from transparent to scattering at a low frequency [14]. For frequencies below 100 Hz, the total electric field, i.e., the effective electric field (Eeff) in LC droplets, could be severely affected by the accumulated charge at the droplet/polymer interface [22]. Eint was investigated by observing the electro-optical response of a PDLC film to direct current (DC) and low-frequency sinusoidal wave-driving voltages [23]. It was revealed that Eint could align the LC droplets to produce electro-optical effects [23].
When investigating and applying the electro-optical effect of PDLCs, the AC square-wave voltage is usually used. In a period, the applied voltage changes polarity rather than amplitude, while it can be regarded as the voltage in a half-period as a DC voltage. However, the relationship between Eint and the frequency of the square wave voltage has not been investigated. In the work represented, we investigated the evolving curve of transmittance with time (T-t) with a square-wave voltage of 0–50 Hz. Moreover, depending on the characteristics of the T-t curves in different frequency ranges, the dynamic behavior and the electro-optical effect based on Eint were investigated. It was revealed that Eint can increase Eeff when the polarity of the AC square wave voltage is reversed.
2. Experiment and Method
2.1. Materials and Preparation
The LC used in our experiments was nematic LC E7 (Shijiazhuang Slichen Display Materials Co. Ltd., Shijiazhuang, China). The prepolymer in our experiments was composed of an adhesive (NOA65, Norland Products Inc., Cranbury, NJ, USA) and a photoinitiator (Irgacure 907, Shanghai Aladdin Biochemical Technology Co., Ltd., Shanghai, China) with a weight ratio of 98 to 2. The length, width, and gap of the LC cells (Hebei Yiya Electronics Co. Ltd., Shijiazhuang, China) were 3.0 cm, 2.0 cm, and 20 μm, respectively.
The γ-Fe2O3 nanoparticles coated with oleic acid (called MNPs, the same as below) were prepared by a chemically induced transition method, and MNPs were about spherical with an average size of about 10 nm [24]. The LC colloids containing MNPs were prepared as follows. First, the MNPs were added in hexane to form the pre-colloid. Then, the pre-colloid was added to the LC to form a mixture. Second, the mixture was heated to 60 °C to volatilize the hexane. Finally, the LC colloid was obtained with the MNPs’ mass fractions ϕm = 0.11%.
The PDLC films were prepared as follows. First, the LC E7 and LC colloids were mixed separately with the prepolymer at a weight ratio of 1 to 1 to form the PDLC mixtures. Second, the mixtures were heated to 85 °C, cooled to room temperature. Then, they were left for 24 h to form the two homogenous mixtures. Third, the heated mixtures (85 °C) were filled separately in LC cells by capillarity and cured with ultraviolet light (36.2 mW/cm2 @ 325 nm) for 10 min at a 30-cm exposure distance. Consequently, the PDLC films undoped and doped MNPs were obtained, designated as the PDLC and M-PDLC samples, respectively.
2.2. Characterization and Measurement
The surface morphologies of the two samples were characterized by a scanning electron microscope (SEM, JSM-7100F, JEOL Ltd., Tokyo, Japan). Before the SEM analysis, the PDLC cells were punctured linearly and soaked in hexane for 48 h to extract the LC droplets. Then, the films were dried in a drying oven at 70 °C and plated with Au. The change in resistance with the frequency was measured using the precision LCR (E4980A, Agilent Technologies Inc., Beijing, China) (see Appendix A).
Figure 1 shows the schematic diagram of the electro-optical measurement. A light beam emitted from a He-Ne laser (1) (λ = 632.8 nm, Melles Griot Inc., Carlsbad, CA, USA) passed through an attenuator (2) (Zolix Inc., Beijing, China), a polarizer (3) (Thorlabs Inc., Newton, NJ, USA), a λ/4 wave plate (4) (λ = 633 nm, Thorlabs, Newton, NJ, USA), another polarizer (5) (Thorlabs Inc., Newton, NJ, USA), and a diaphragm (6) (Zolix Inc., Beijing, China), in turn, which provided a normal incident on a sample (7). The voltage applied to the sample (7) was a square-wave voltage with an adjustable frequency (0–50 Hz) controlled by a voltage amplifier (9) (Nantong Long Yi Electronic Technology Co., Ltd., Nantong, China). The distance between the sample (7) and a detector (8) (7ID230, SOFN Instruments Co., Ltd., Beijing, China) was 20 cm. The converted digital signals from a data acquisition card (10) (DAC, 6216, NI) were connected to the detector (8) and processed by a computer (11) in the LabVIEW environment. The applied square-wave voltage was 30 Vrms. Transmittance is defined as , where and are the incident light and transmitted light intensities, respectively.
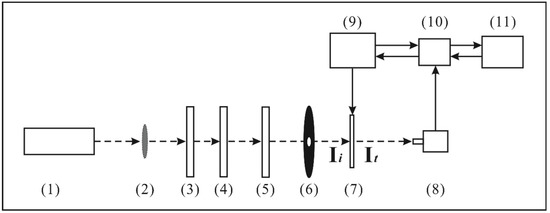
Figure 1.
The schematic diagram of the electro-optical measurement. (1) He-Ne laser, (2) attenuator, (3) polarizer, (4) λ/4 wave plate, (5) polarizer, (6) diaphragm, (7) sample, (8) detector, (9) voltage amplifier.
3. Results and Discussion
3.1. PDLC Sample with DC Applied Voltage
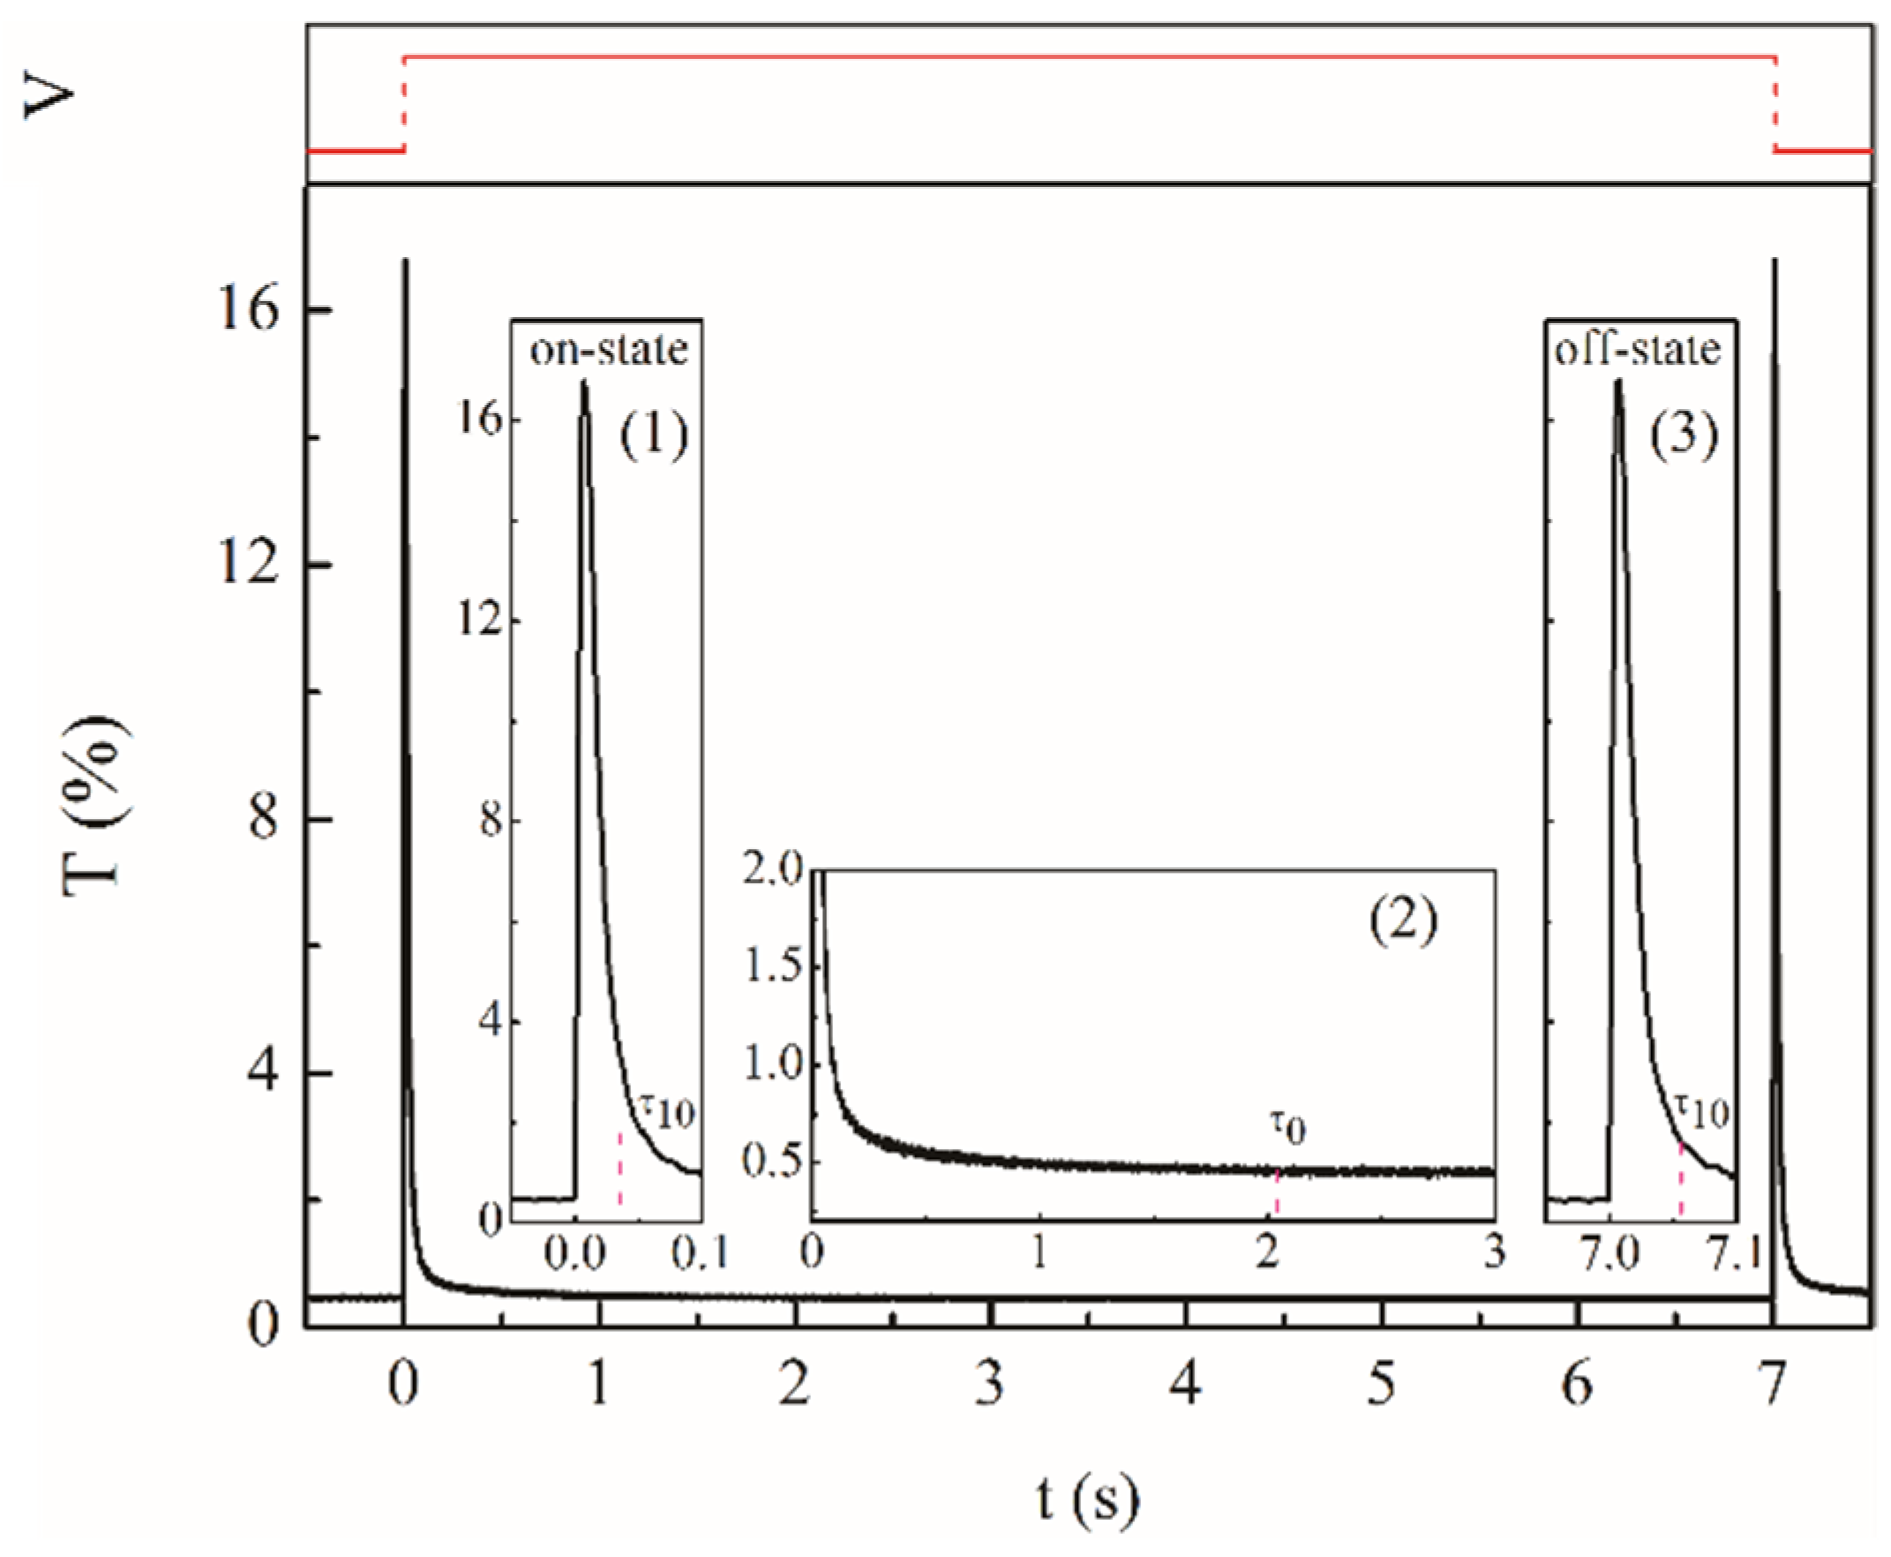
The evolution curve T-t of the PDLC sample with a 30-V DC voltage is shown in Figure 2. When the DC voltage was switched on and off, the transmittance increased rapidly to the maximum transmittance Tmax and then gradually decreased to the off-state transmittance T0, as illustrated in detail in insets (1), (2), and (3). This physical process was analyzed as follows.
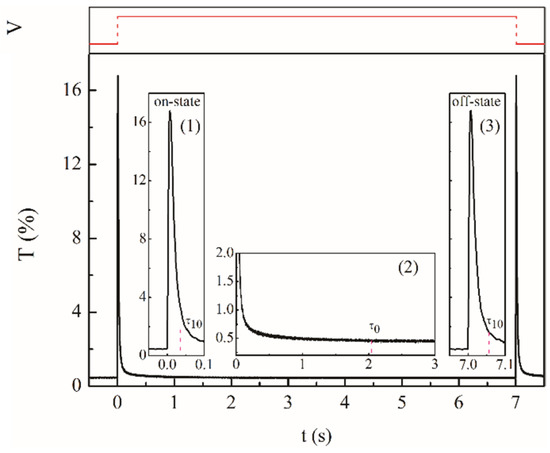
Figure 2.
The T-t curves of the PDLC film under DC applied voltage. In insets (1) and (2), the transmittance rose rapidly to the maximum and gradually decreased to the off-state transmittance T0 when the DC voltage was switched on. In inset (3), when the DC voltage was switched off, the transmittance rose rapidly to the maximum and gradually decreased to T0.
When the DC voltage was off, LC droplets were randomly dispersed in the polymer matrix and the refractive index difference between the polymer and liquid crystal droplets (Δn) was the maximum value, with the off-state transmittance T0. The local electric field relative to the applied voltage V and the film thickness d are expressed as [19,20]:
where and are the polymer and LC resistivities, respectively. Bold E and italic E refer, respectively, to the vector and scalar of the electric field, the same as below.
When the DC voltage was switched on, the LC droplets could reorient towards the effective electric field . It is more appropriate to discuss the reorientation as orientation force on LC droplets by field and not by voltage [19]. Therefore, the transmittance T changed with the effective electric field and can be expressed as
In the effective electric field Eeff, the director of LC droplets tends to the direction of Eeff. If Eeff is high enough, the transmittance T can increase rapidly from T0 to Tmax; at the same time, Eint can be ignored because of the short time. Then, the maximum transmittance Tmax corresponding to the maximum of the effective electric field can be obtained:
When Eloc is constant, Eint, which is formed by ions and is opposite to Eloc, will increase and Eeff will decrease gradually. As a result, the transmittance T decreases from Tmax to Tmin, i.e.,
when the maximum of internal polarization electric field, and = 0. Consequently, .
As shown in Figure 2, when the DC voltage was switched on, the transmittance T decreased rapidly, then gradually. The time from Tmax to T0, τ0, was 2.046 s, and the time from Tmax to 10% of Tmax, τ10, was 0.056 s, which is called the fast-response process, as shown in inset (1). The process corresponding to the time τ10-0 (=τ0 − τ10 = 1.996 s) from 10% of Tmax to Tmin, as shown in inset (2), is called the slow-response process. When the time is more significant than τ0, the corresponding process can be called the over-response process, the LC droplets return to their initial state, and T no longer changes with time.
When the DC voltage was switched off, the T-t curve was similar to what happened when the DC voltage was switched on, as shown in inset (3). These results show that Eint can reorient LC droplets [21]; when Eloc is off, the Tmax can be expressed as:
When the DC voltage was switched on and off, the decreased processes from Tmax to Tmin corresponded to the Eint formation and depolarization [21]. The transmittance curves were consistent when the DC voltage was switched on and off, indicating that the Eint formation and depolarization times are the same.
3.2. PDLC Sample Applied with an AC Square Wave Voltage
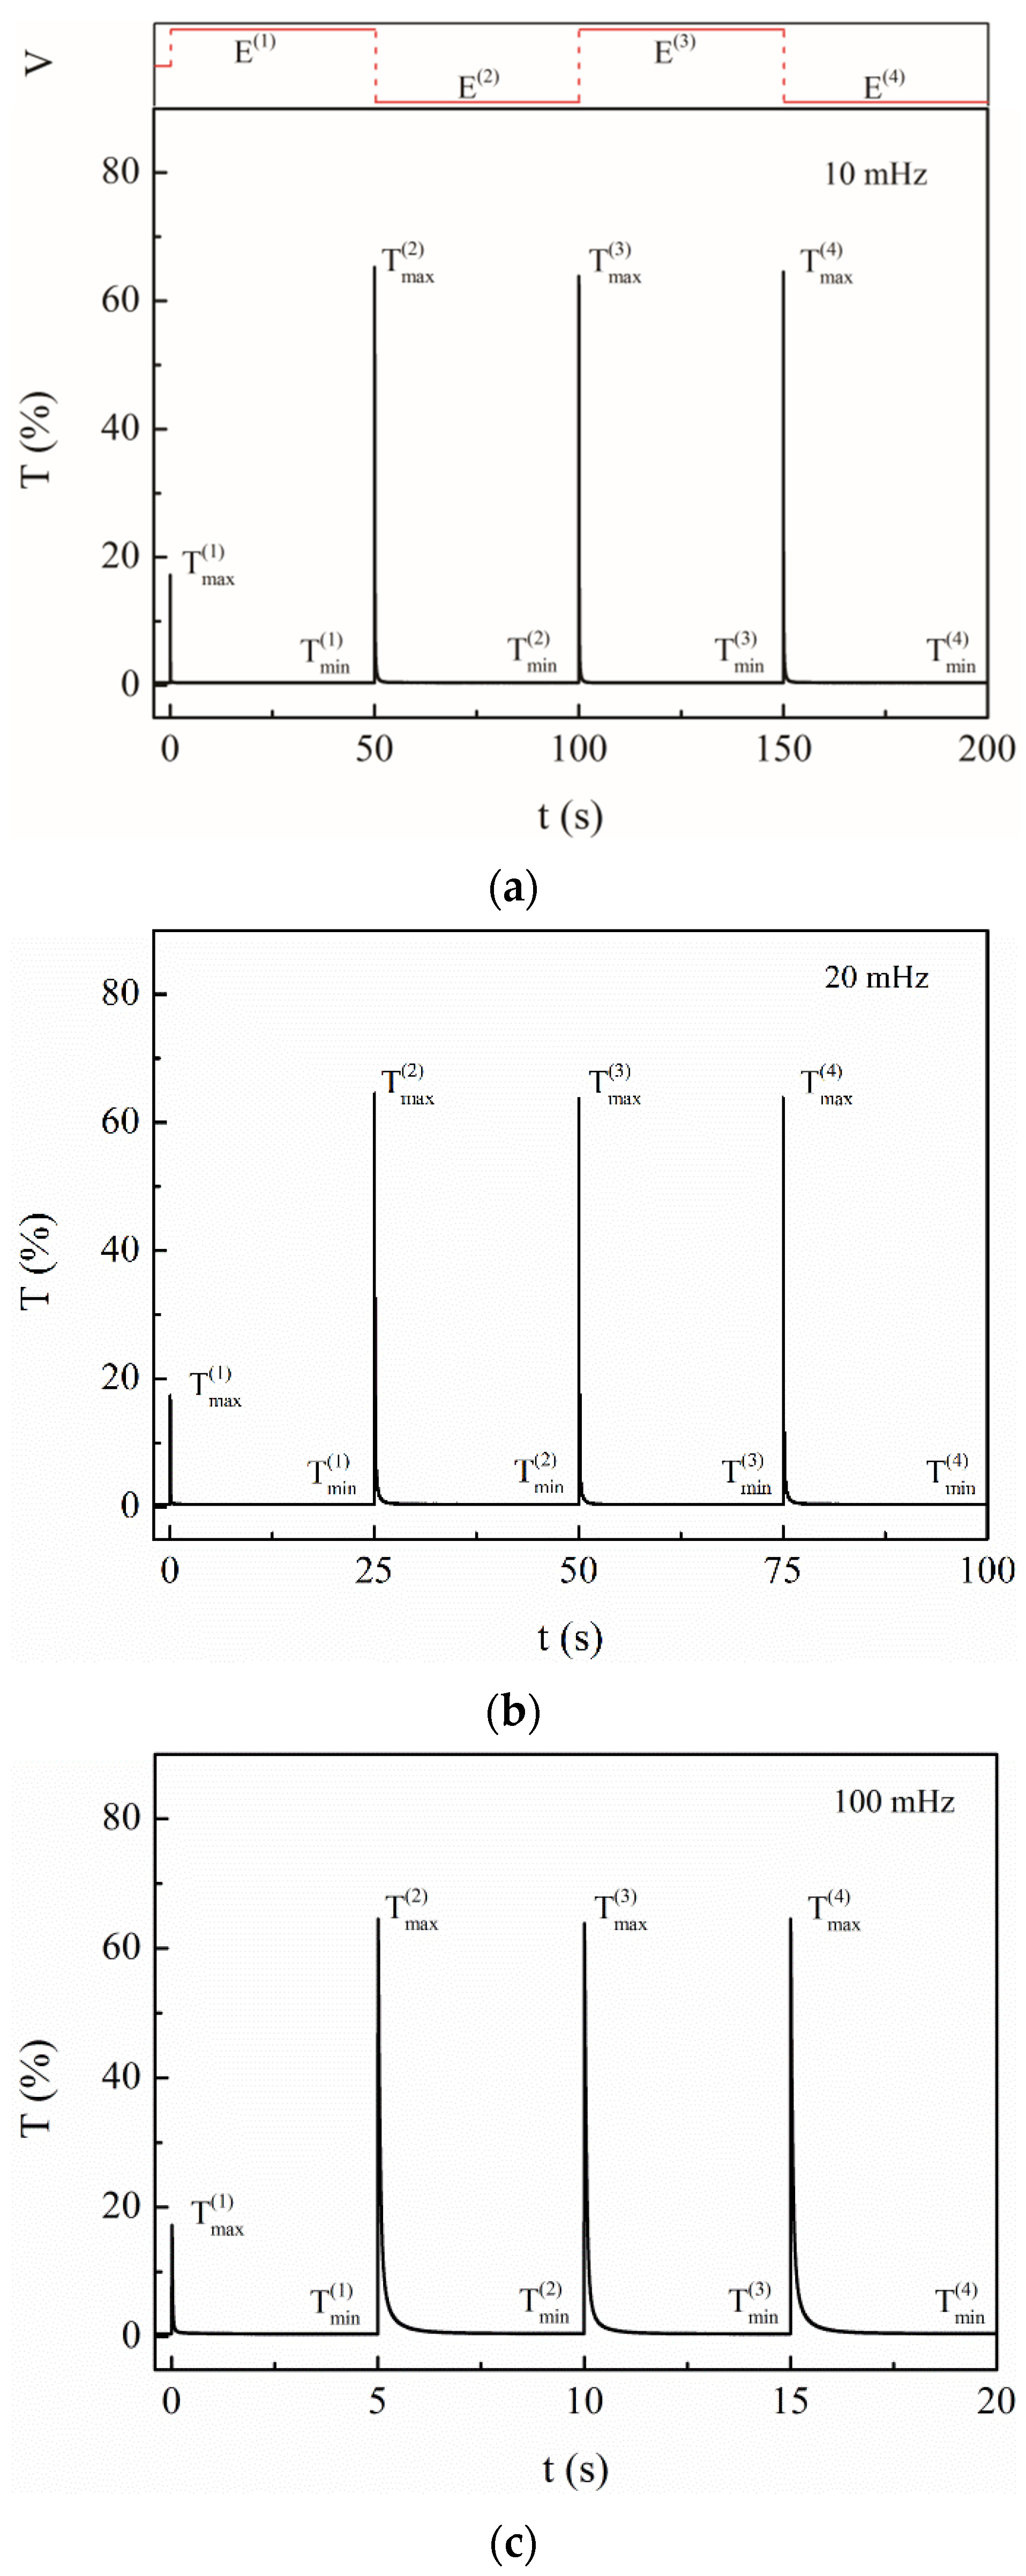
When the applied AC square wave voltage frequency was 0.01–50 Hz, the LC droplets can reorient within the half-period (0.01–50 s). As shown in Figure 3, the transmittance period (T-period) corresponded to the half-period of the applied AC square wave voltage, i.e., the phenomenon of frequency doubling. From now on, the half-period of the applied voltage is expressed as T-period. The three frequency ranges of the T-period are addressed as follows.
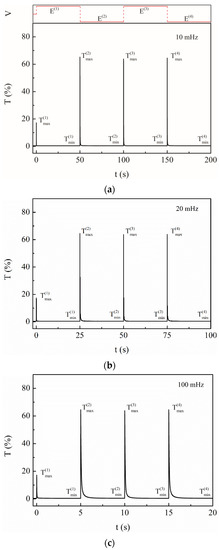
Figure 3.
The transmittance changed with time by applying the PDLC sample with the AC square wave voltage at the frequencies of 10 mHz, 20 mHz, and 100 mHz, respectively. , , , and correspond to the applied electric fields in four T-periods, respectively. and correspond, respectively, to the minimum and maximum transmittances in the four T-periods: (a) 10 mHz, (b) 20 mHz, (c) 50 mHz.
3.2.1. Frequency Range 10–100 mHz
Within this frequency range, the T-period of the square wave voltage was 5 to 50 s and more than τ0. As shown in Figure 3a–c, from 10 mHz to 100 mHz, the minimum transmittances , , , and reached T0, i.e., the LC droplets returned to the initial reorientation and the superscripts (1), (2), and (3), etc. indicate the numbers of the T-period. In addition, and ; does not change with frequency; and . The measured data are listed in Table 1, and the experimental results are discussed as follows:

Table 1.
The data of the T-t curves of the PDLC film applied with the DC voltage and the AC.
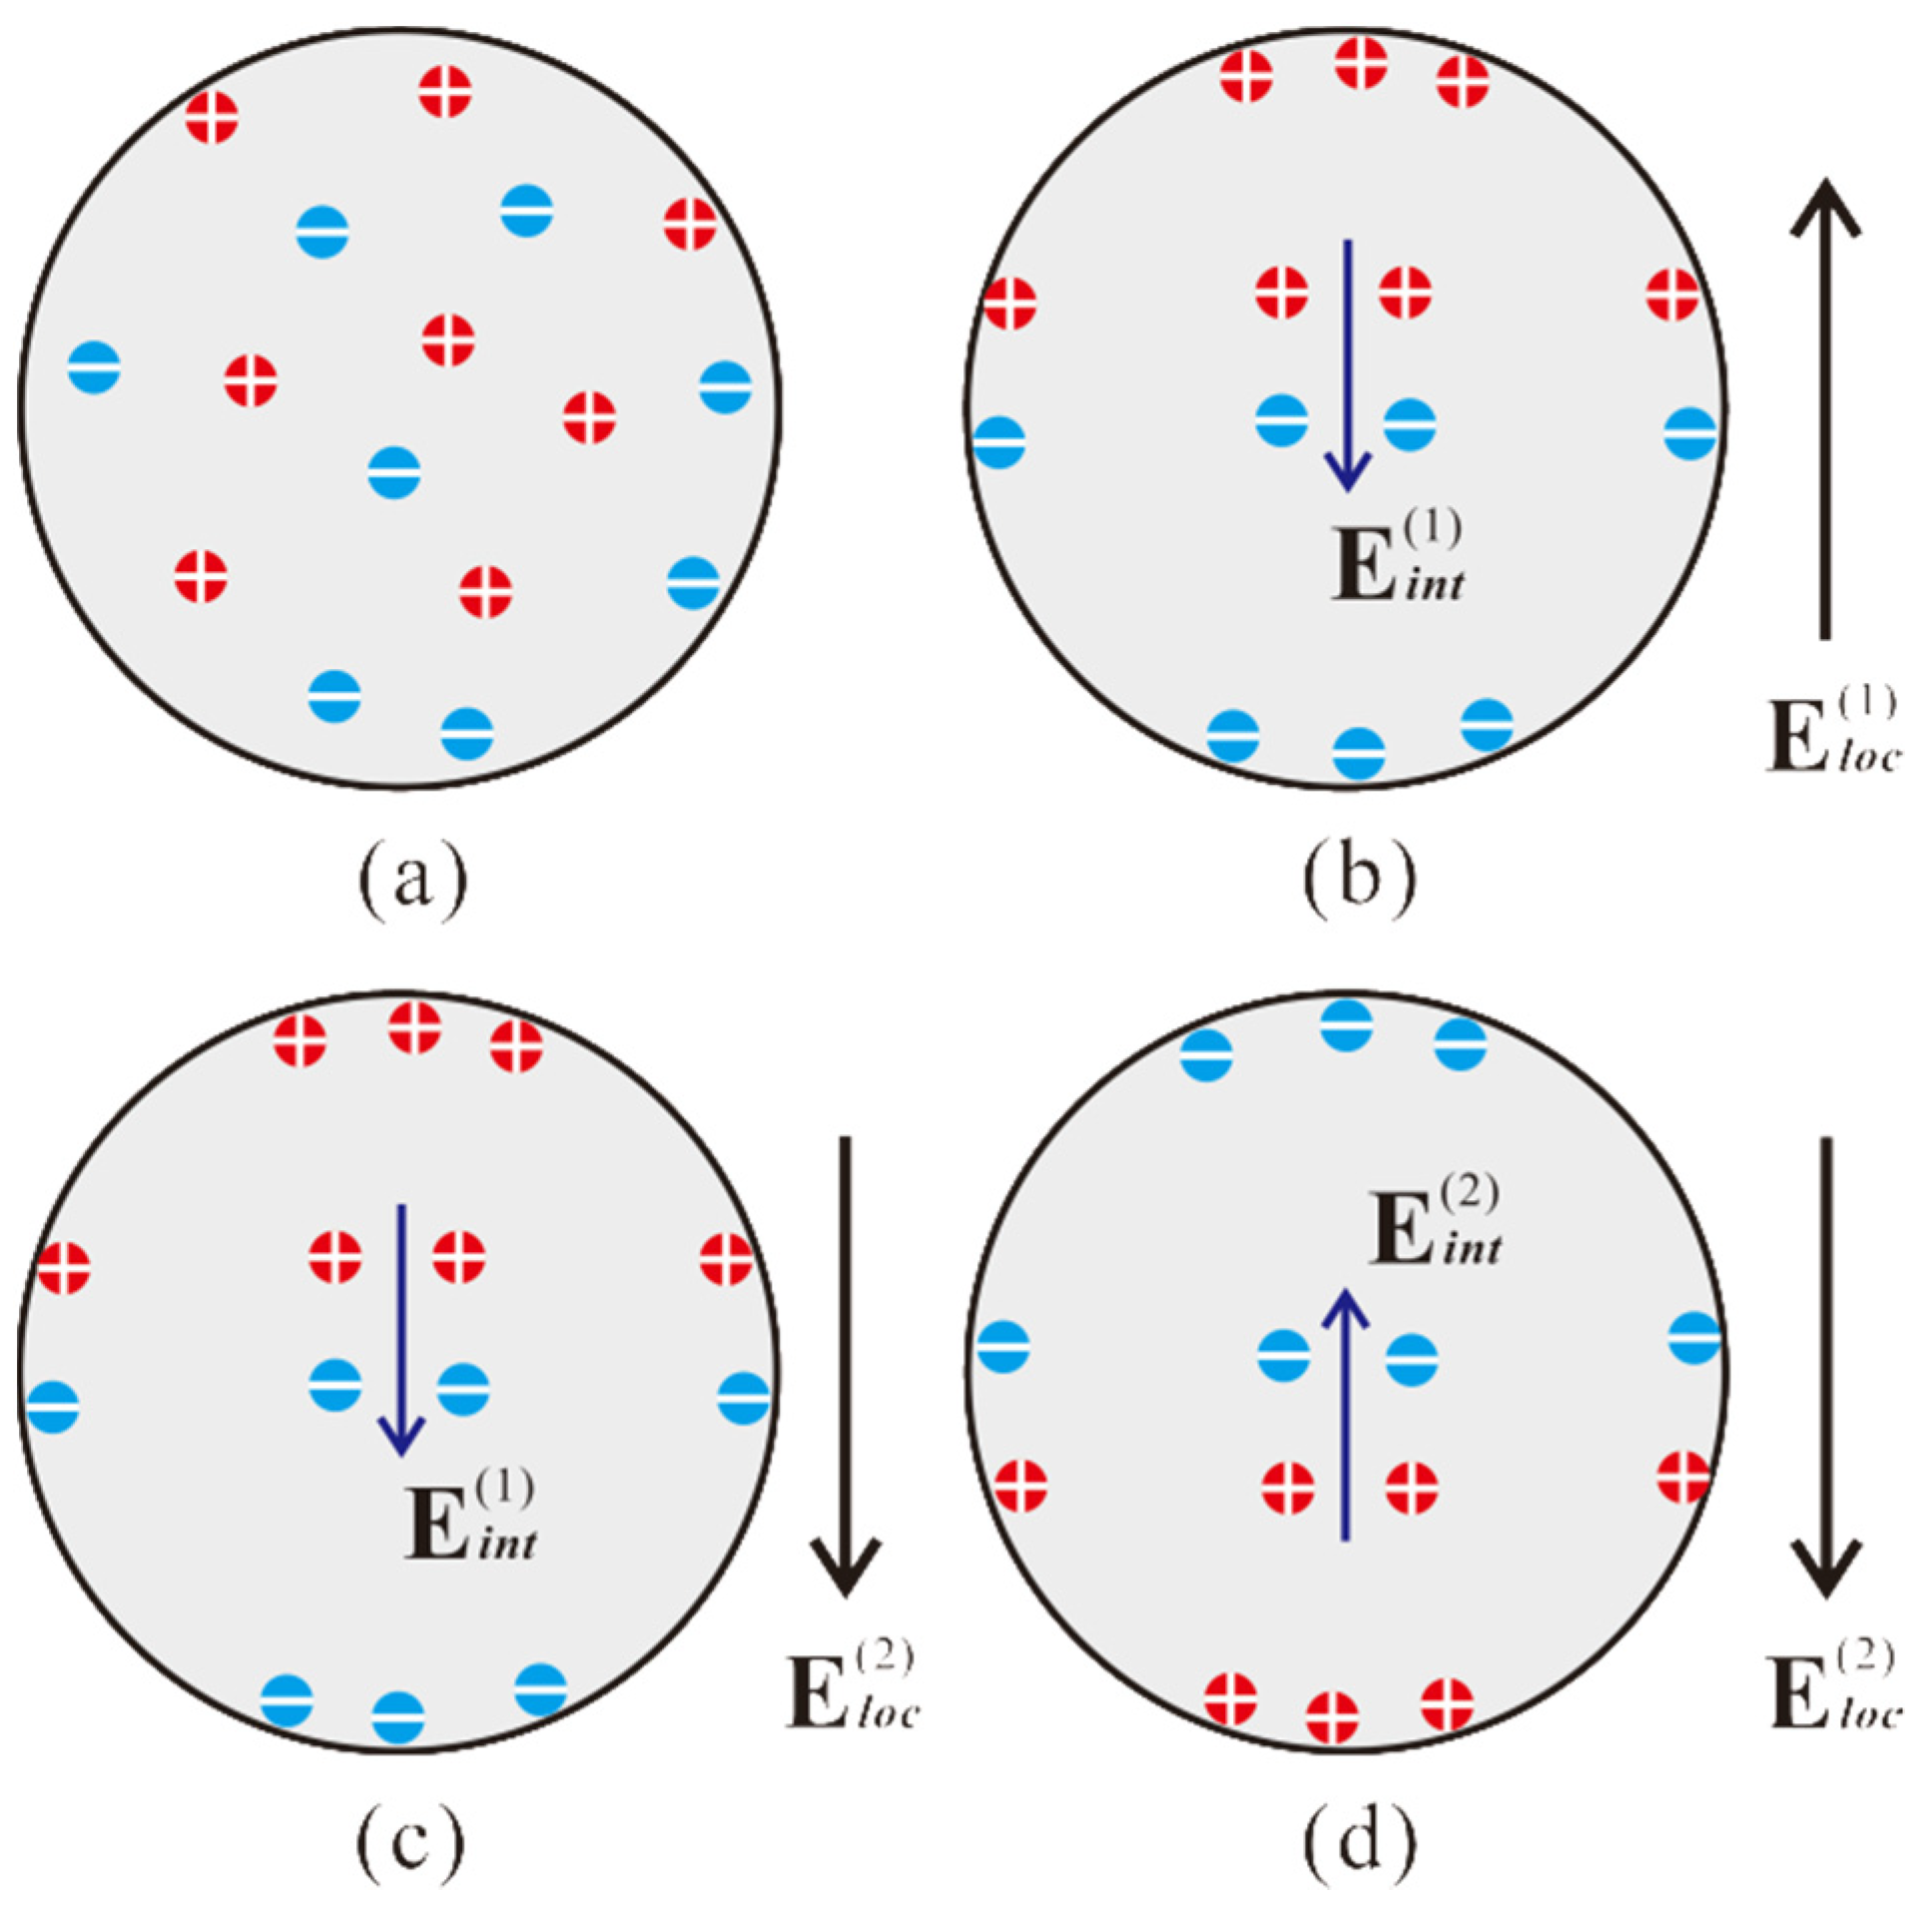
As shown in Figure 4a, the ion was uniformly distributed before applying . Figure 4b shows that can be formed entirely by applying because the time of the T-period was long enough. By the end of the first T-period, the internal depolarization electric field was maximized, and
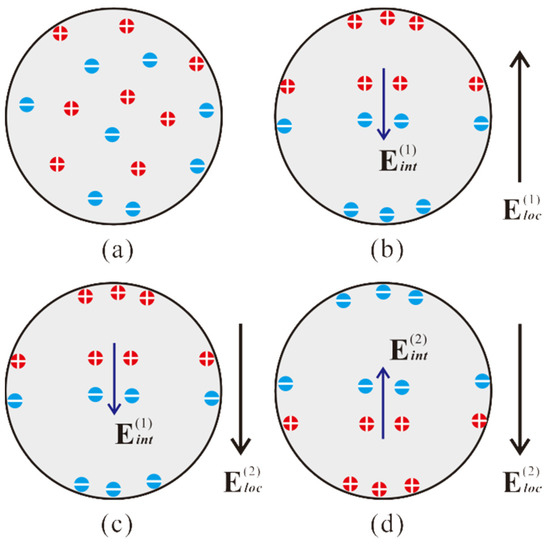
Figure 4.
Schematic diagram of the relation between the internal polarization field and the local electric field of the LC droplets. (a) The uniform distribution of ions before applying ; (b) was entirely formed by applying . (c) was retained as instant when applying and (d) was formed completely after applying for long enough.
. Therefore, , according to Equation (4).
At the beginning of the second T-period, disappeared and was applied. In the meanwhile, can be retained a moment because of relaxation and, as shown in Figure 4c, the effective electric field was maximized:
According to Equation (3), . Hence, was higher than . When continued, started depolarization until it was utterly depolarized. After was inexistent, began to form, as shown in Figure 4d. Then, the effective electric field in the second T-period can be expressed as:
When , 0, with . With the maximum of the internal polarization electric field,
Because , from Equations (6) and (9), . Similar to , can be retained a moment in the third T-period. After applying with , was depolarized gradually; then, began to form, similar to Figure 4b. Consequently, the curves T(3)-t and T(2)-t were the same. There is the extra depolarization time of in the second T-period; as a result, . In addition, = = , = = , and for the different frequencies, as shown in Figure 3a–c.
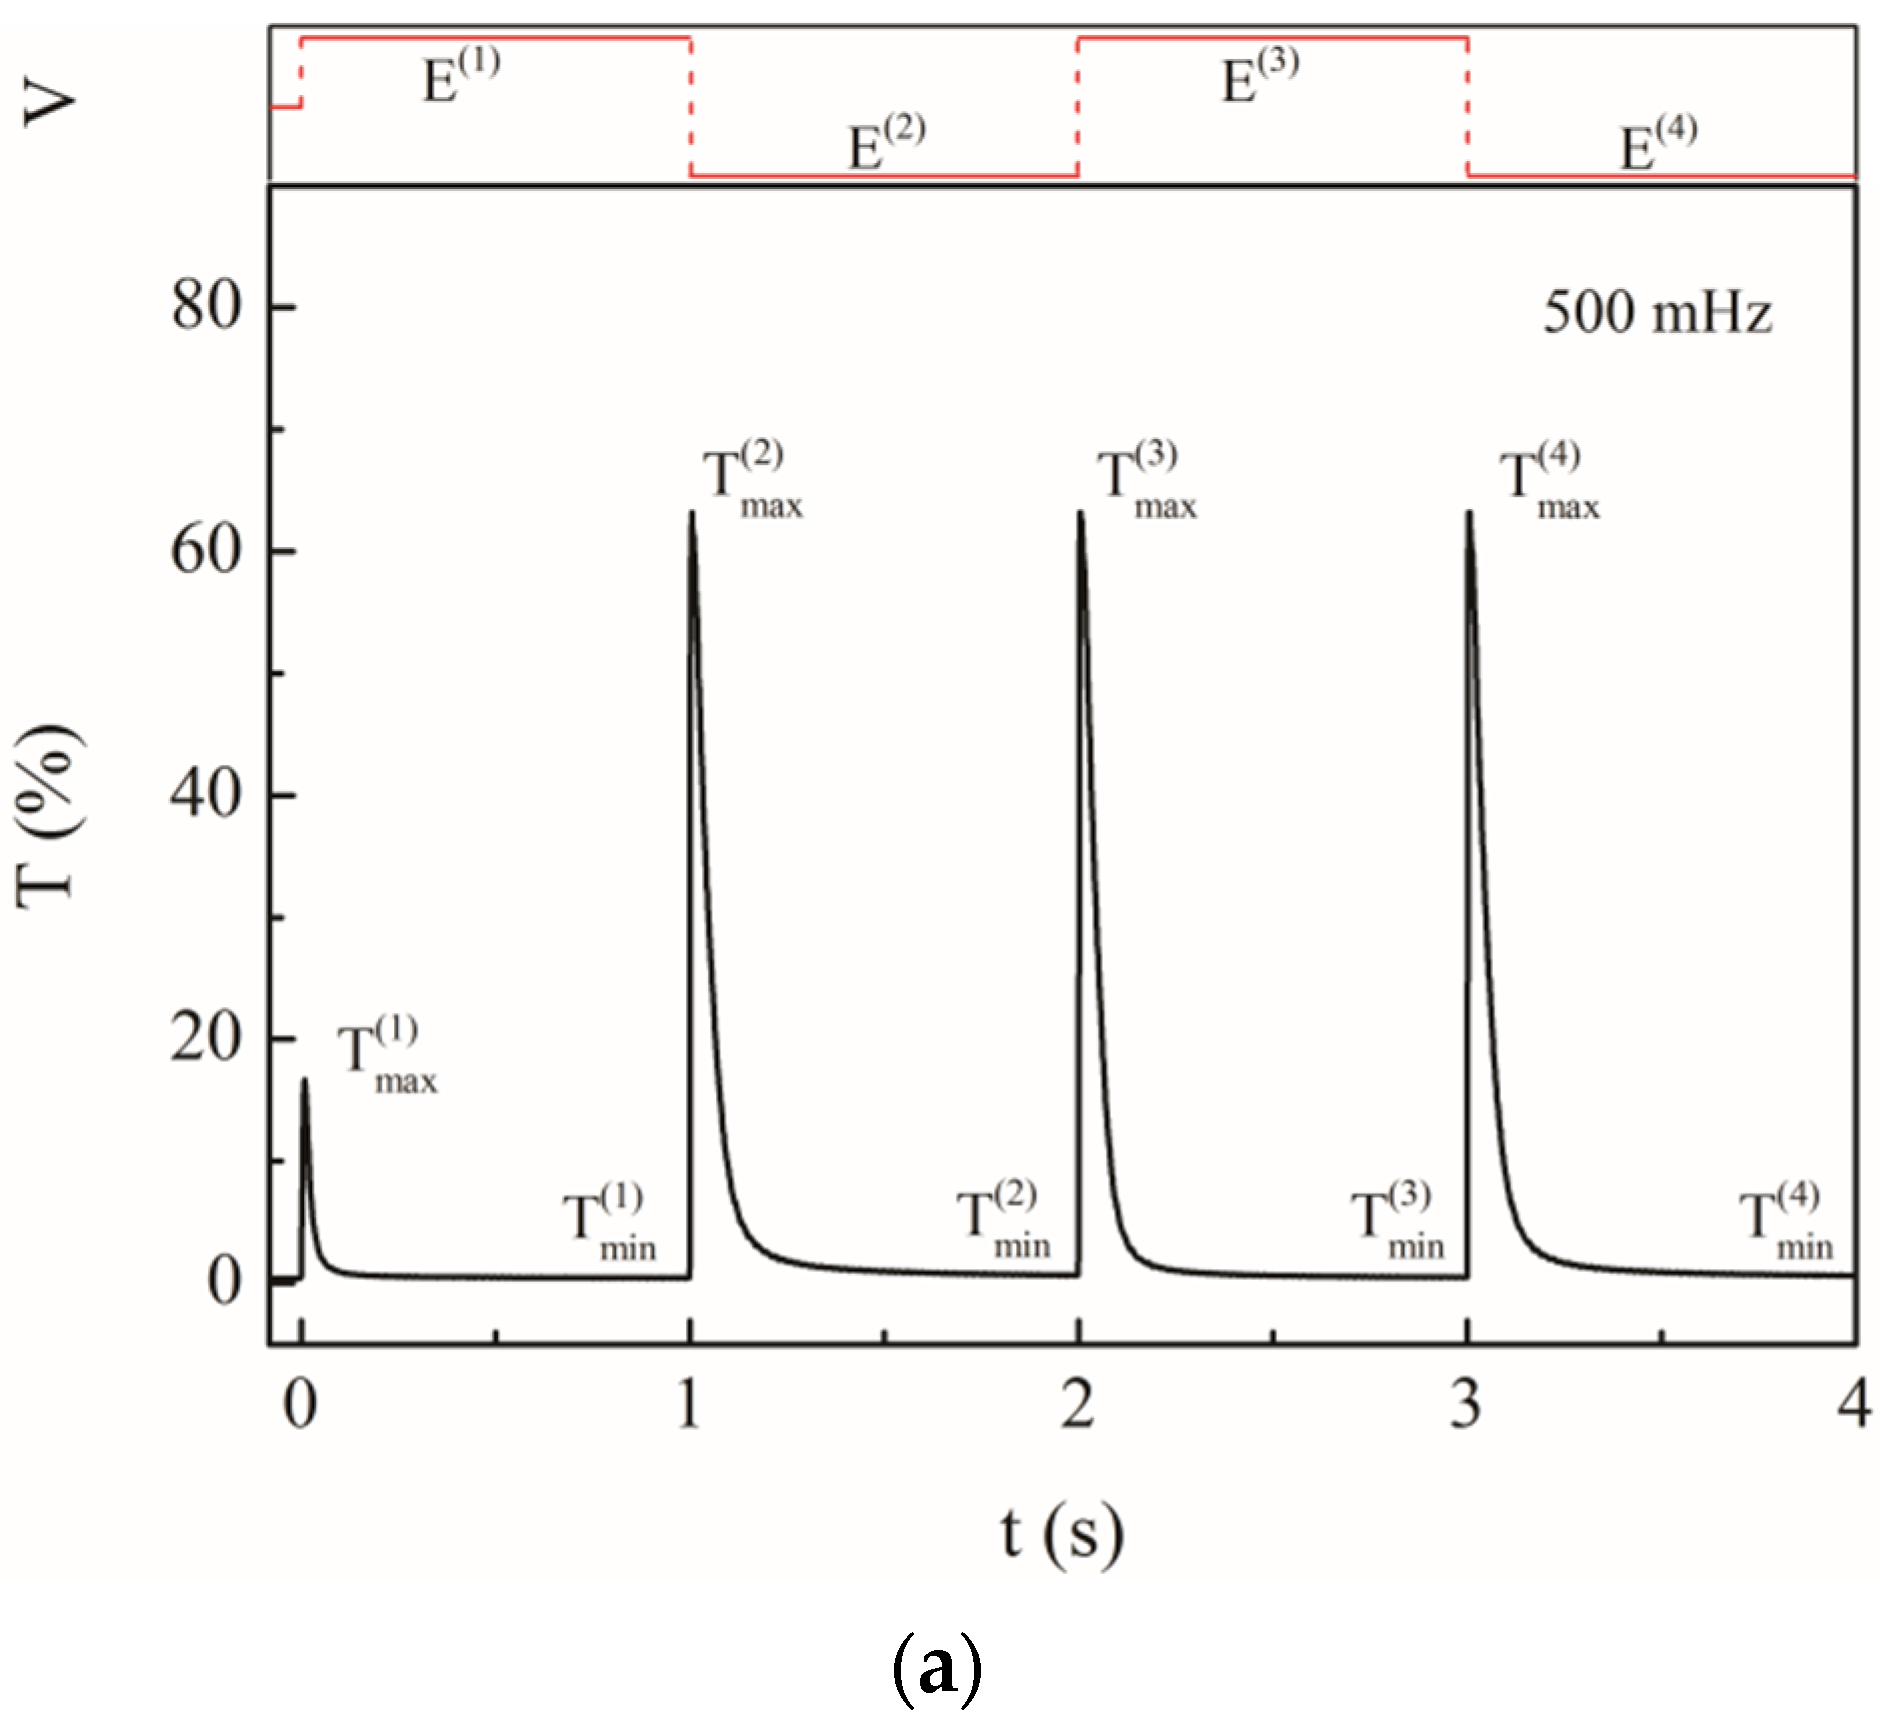
3.2.2. Frequency Range 0.5–2 Hz
Within this frequency range, the T-period was from 0.25 to 1 s and between τ10 and τ0, as shown in Figure 5a–c. The T-t curves within this frequency range were similar to 10–100 mHz. Moreover, , , and increased slightly with frequency. The characteristics can be explained as follows:

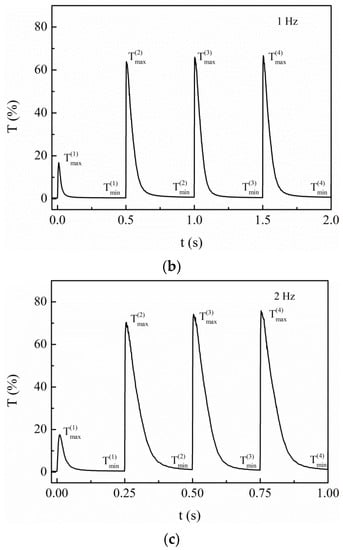
Figure 5.
The T-t curves of the PDLC film by applying an AC square wave voltage at the frequencies of 500 mHz, 1 Hz, and 2 Hz, respectively. and corresponded, respectively, to the minimum and maximum transmittances in the four T-periods: (a) 500 mHz, (b) 1 Hz, (c) 2 Hz.
The fast-response was performed entirely in the first T-period, but the slow-response was not performed, i.e., was not formed entirely due to the relatively short T-period. Therefore, was slightly less than , so that and was slightly higher than T0. The maximum effective electric field of the second T-period was:
The increases of and (N denotes the number of the T-period) with frequency can be related to the fact that the LC droplets could not entirely return to the initial random state. As with the frequency of 10–100 mHz, these T-t curves changed periodically from the second T-period and the frequency doubling remained.
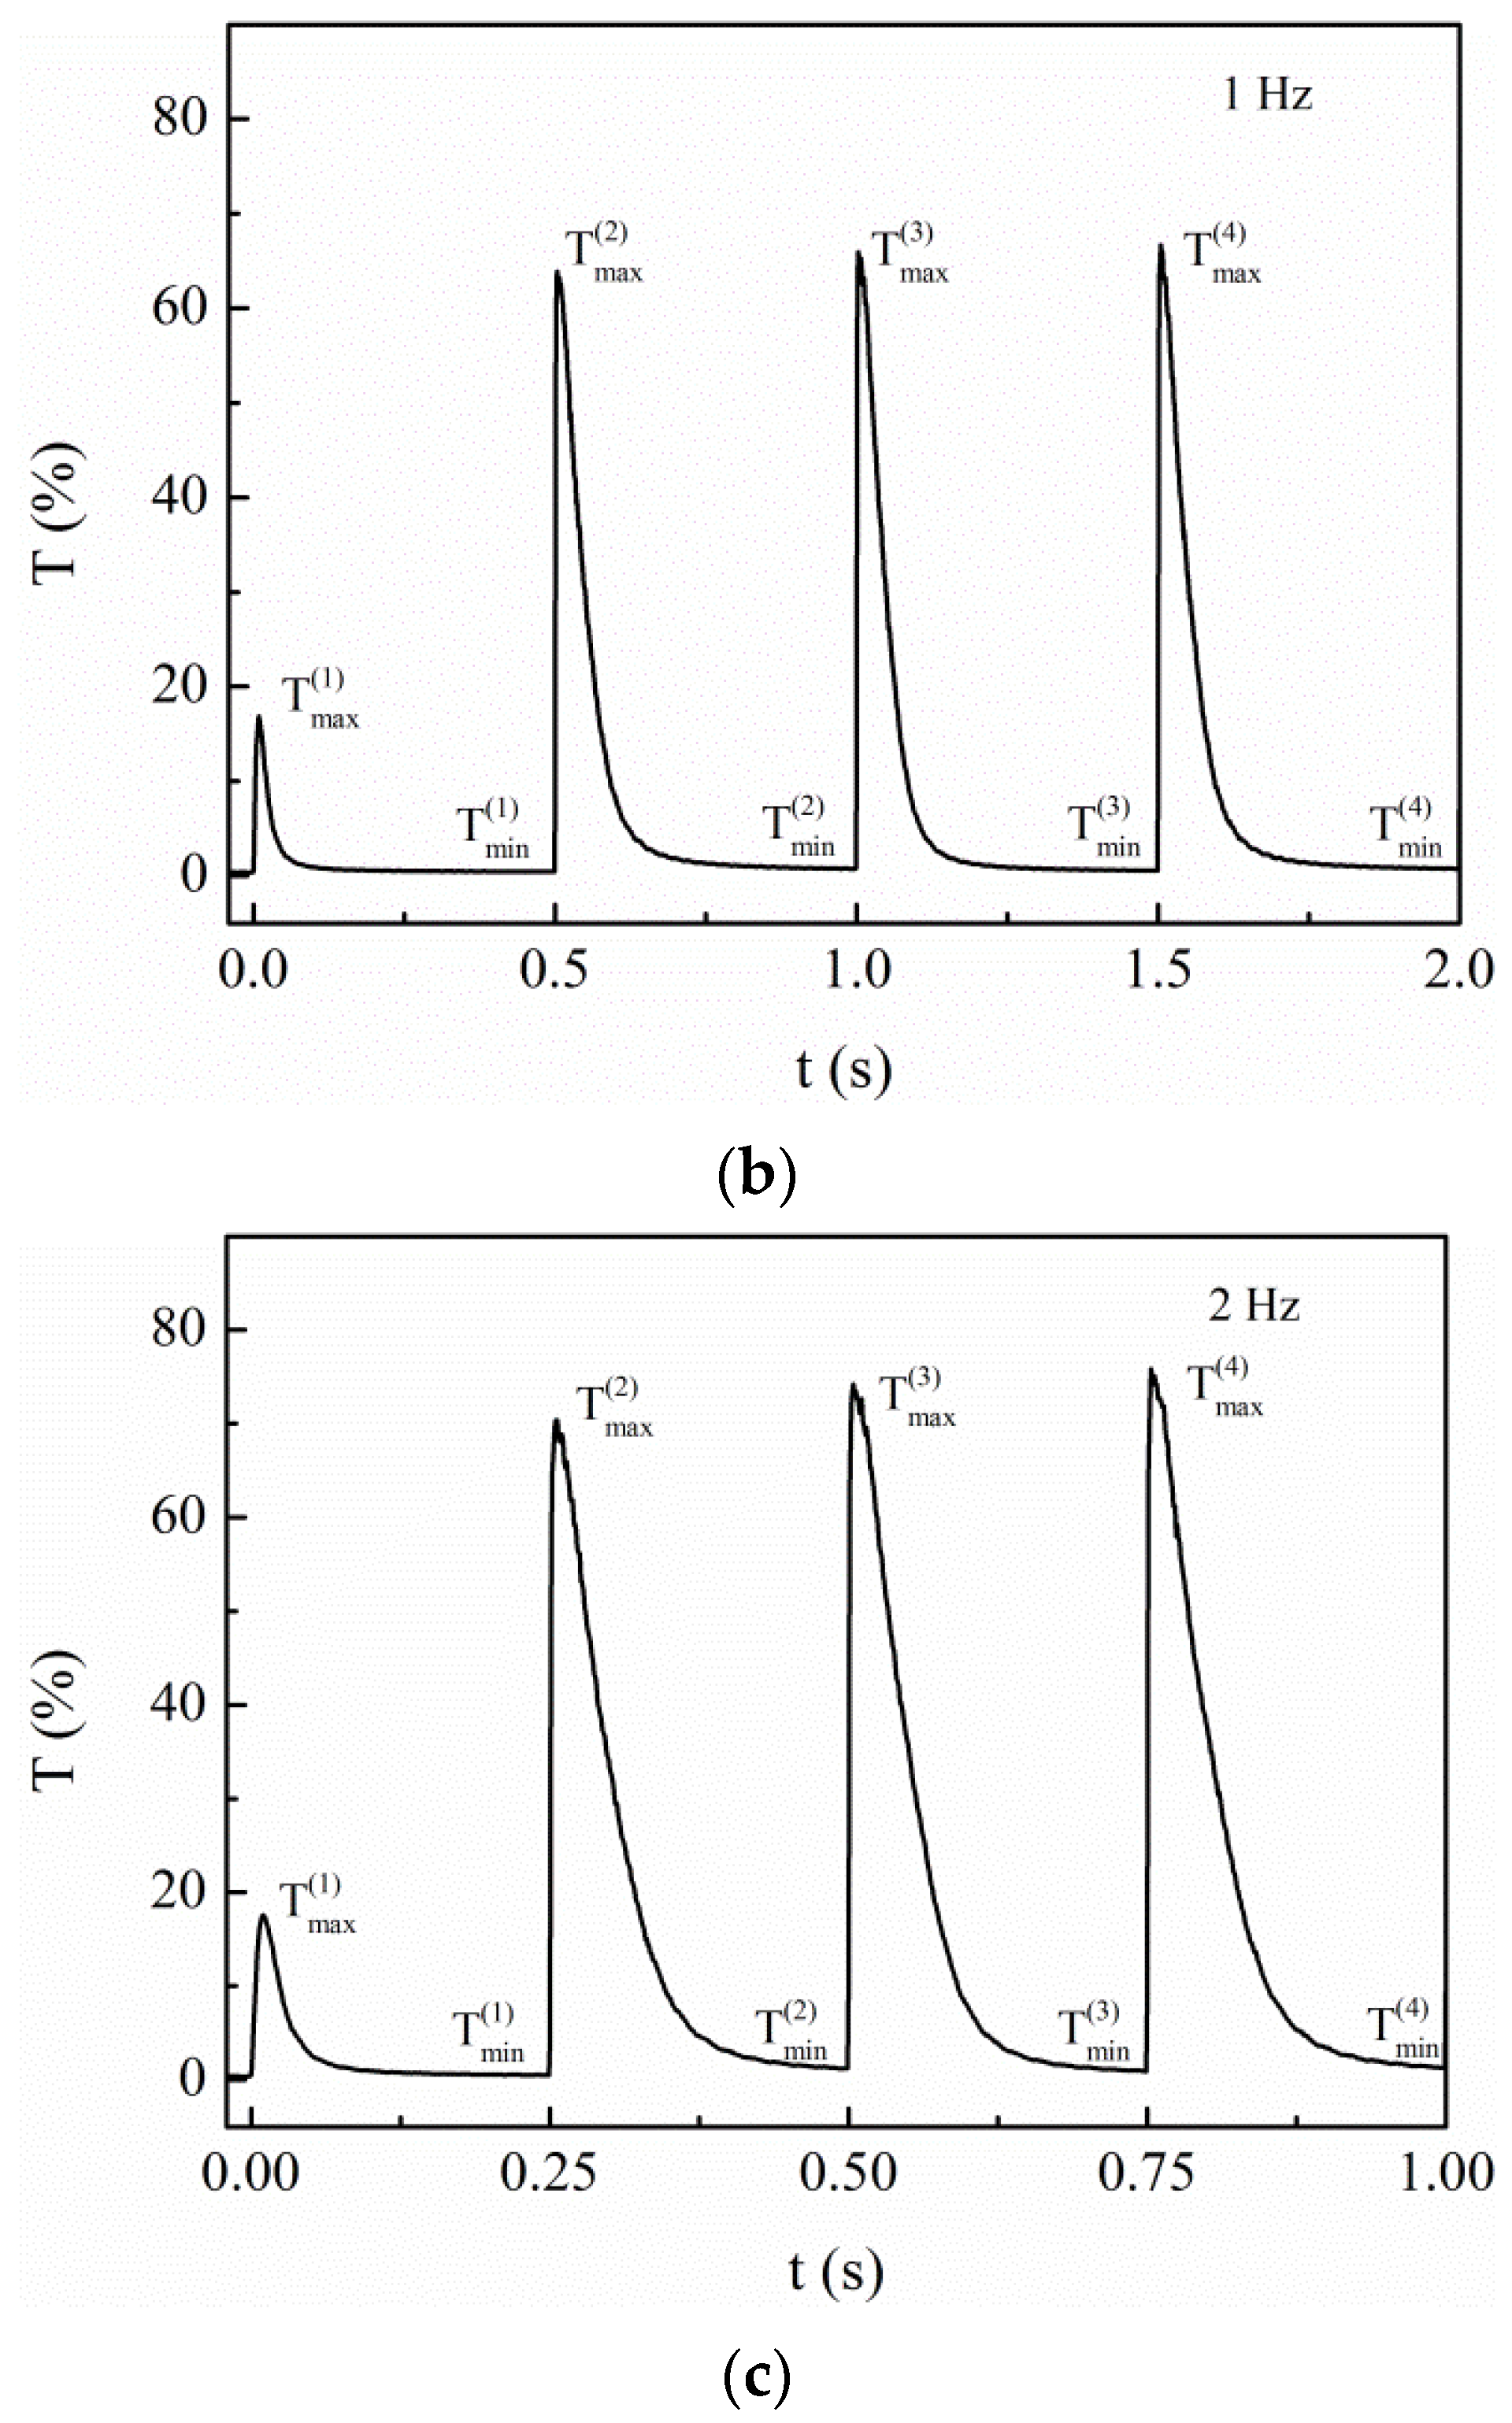
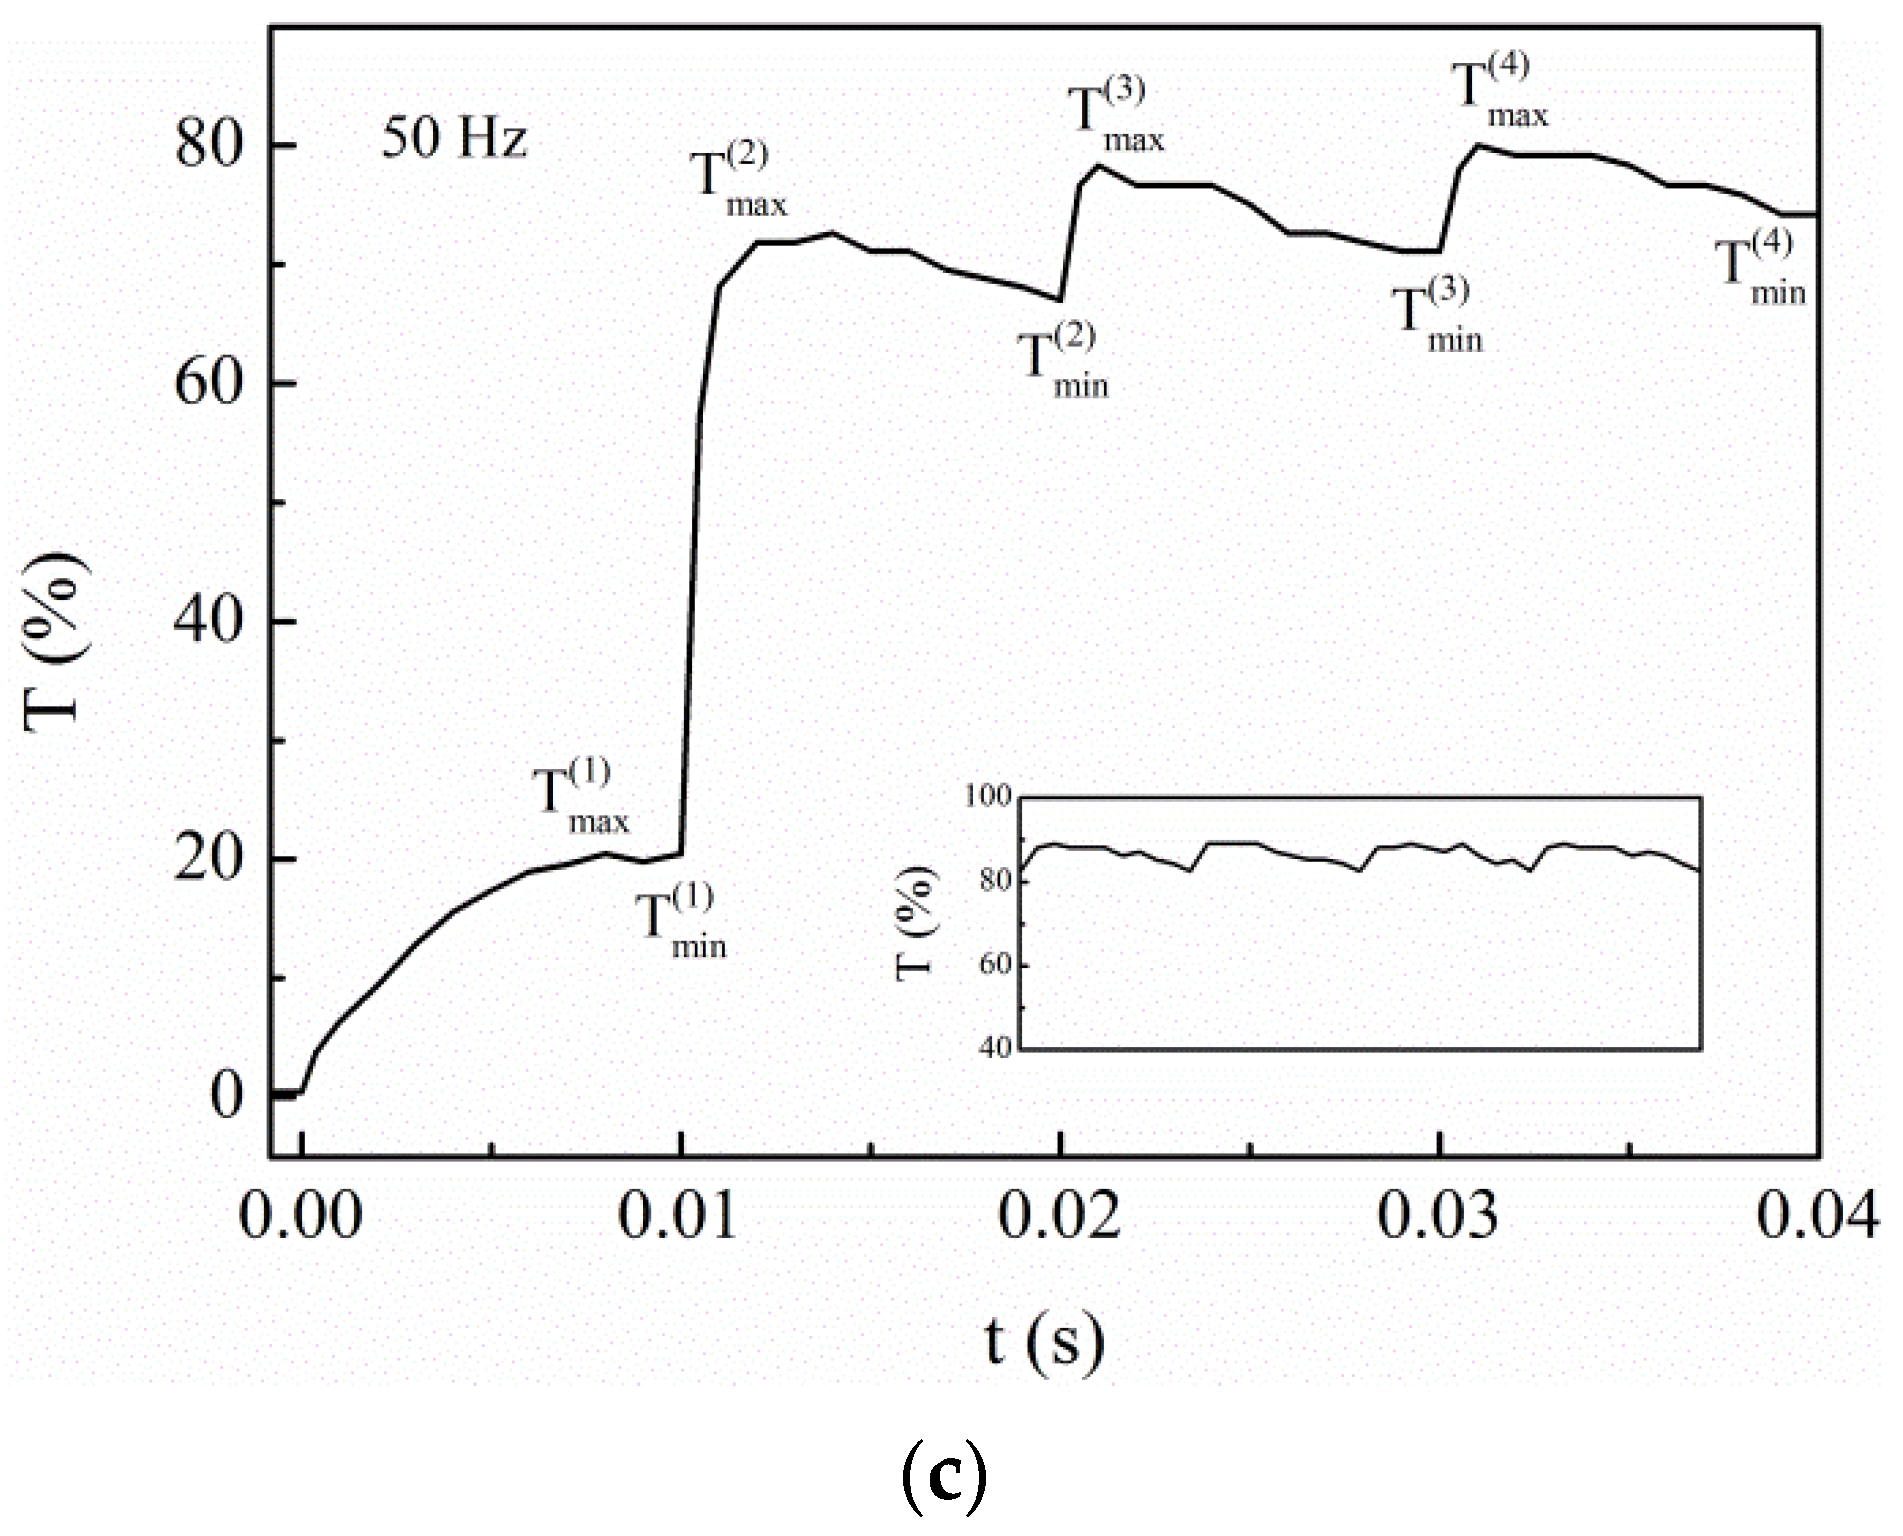
3.2.3. Frequency Range 10–50 Hz
Within this frequency range, the T-period was from 0.01 to 0.05 s, less than τ10. (N = 1, 2, 3, 4) was more than T0, i.e., the LC droplets could not return to the initial random orientation at the end of each T-period, as shown in Figure 6. The T-t curves corresponded only to the fast response because the T-period was below τ10, different from the over-response. Furthermore, increased with frequency and was more than 10% of for the three frequencies, i.e., T0. Besides, with the increase of frequency, decreased and increased. The measured data are listed in Table 2. The experimental results are discussed as follows.
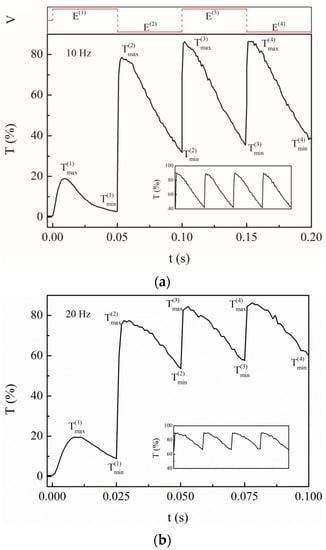
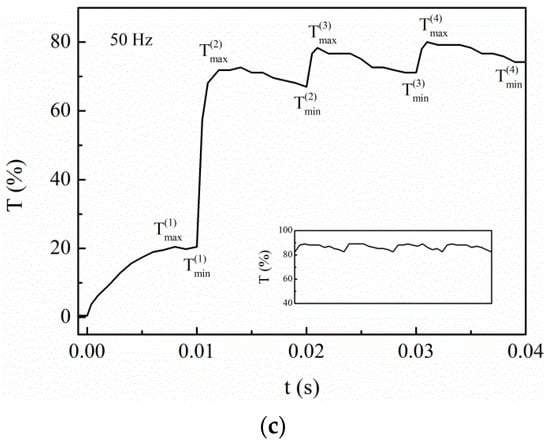
Figure 6.
The T-t curves of the PDLC film by applying an AC square wave voltage at the frequencies of 10 Hz, 20 Hz, and 50 Hz, respectively. and correspond, respectively, to the minimum and maximum transmittances in the four T-periods: (a) 10 Hz, (b) 20 Hz, (c) 50 Hz.
Table 2.
The data of the T-t curves of the PDLC film applied with an AC applied square voltage at 10 Hz, 20 Hz, and 50 Hz, respectively.
The resistance of the PDLC sample in this frequency range decreased with frequency (see Appendix A). Due to Equation (1), it can be assumed that may decrease with frequency so that and increase slightly with frequency. The T-periods were less than τ10, so that the curves T-t can only be characterized by the fast-response and the maximum internal depolarized electric field of the first T-period:
Thus, when applying , the maximum effective electric field was:
Because increased with frequency, in this frequency range was still more than that of 0.5–2 Hz. Different from the curves T-t in the frequency of 0.5–2 Hz, , , and (N = 1, 2, 3, …) increased with the number of the T-period. The process of this phenomenon is discussed for four cases, as follows.
- (a)
- In the first T-period
At the beginning of the first T-period, the ions were uniform; after applying , the effective electric field was maximized. correspond to . At the end of the first T-period, was formed and opposite to and the effective electric field was minimized. corresponded to , i.e., , and
Equation (13) shows that the LC droplets could not return to the initial random orientation and maintained a specific orientation at the end of the first T-period. This reserved orientation can be equivalent to being applied with an additional effective electric field, , which reoriented the LC droplets and did not change with the local electric field. Thus, did not change with the reversal of the polarity of the local electric field and was inversely proportional to . As the T-period got shorter, was close to 0 and > 1. was greater than the threshold electric field, a minimum electric field required to switch LC droplets, governed by the competition of electric and elastic torque in LC droplets [8,9].
- (b)
- In the second T-period
At the beginning of the second T-period, the remained was not depolarized and in the same direction of . As a result, the effective electric field was maximized, corresponded to , and
Because , .
At the end of the second T-period, was depolarized and was formed and opposite to ; consequently, the effective electric field was minimized, corresponded to , and
Because the T-period was less than τ0, it was composed of the time depolarizing and the time forming . In the first period, τ0 consisted only of the time forming ; hence, and and, as a result,
Because , , i.e., ; a new equivalent electric field was regarded as and the total effective electric field was
Equation (17) means that the equivalent electric field had a transitive property.
- (c)
- In the third T-period
At the beginning of the third T-period, the remained was not depolarized, was in the same direction of , and the effective electric field was maximized, corresponding to
Because and , as a result, and > .
At the end of the third T-period, was depolarized and was formed and opposite to ; consequently, the effective electric field was minimized, correspond to , and
In this T-period, was depolarized, then was formed, and . Because , ; as a result, increased and then .
- (d)
- In the fourth T-period
Similar to the third T-period, the effective electric field corresponding to was
, the effective electric field corresponding to was
and .
Consequently, the effective electric fields corresponding to and (N > 1) could be expressed, respectively, as
can be expressed as
From the results above, at the same frequency, was constant, decreased, and increased with the number of the T-period. Therefore, and increased with the number of the T-period. As was higher than the electric field threshold, the response time to the local electric field decreased. Therefore, the increase will be more significant than the decrease with the number of the T-period. and increased with the number of the T-period. However, the increase of was greater than ; as a result, increased with the number of the T-period.
Because increased with the number of the T-period, increased with the number of the T-period. did not change with the polarity reversal of the local electric field and was inversely proportional to . As the T-period got short, tended to 0 and > 1. and tended to their maximums, i.e., in the mth period, corresponded to . In the nth period (n > m), and , i.e., and were constant, as shown in the insets in Figure 6a–c.
In a word, the frequency doubling remained when the applied square wave voltage frequency was 0.01–50 Hz. However, the transmittance curves changed with the different frequency range. As the frequency was 10–100 mHz, from the second T-period, and were nearly identical, respectively. As the frequency was 0.5–2 Hz, and increased with frequency. As the frequency was 10–50 Hz, and increased with frequency and the number of the T-period.
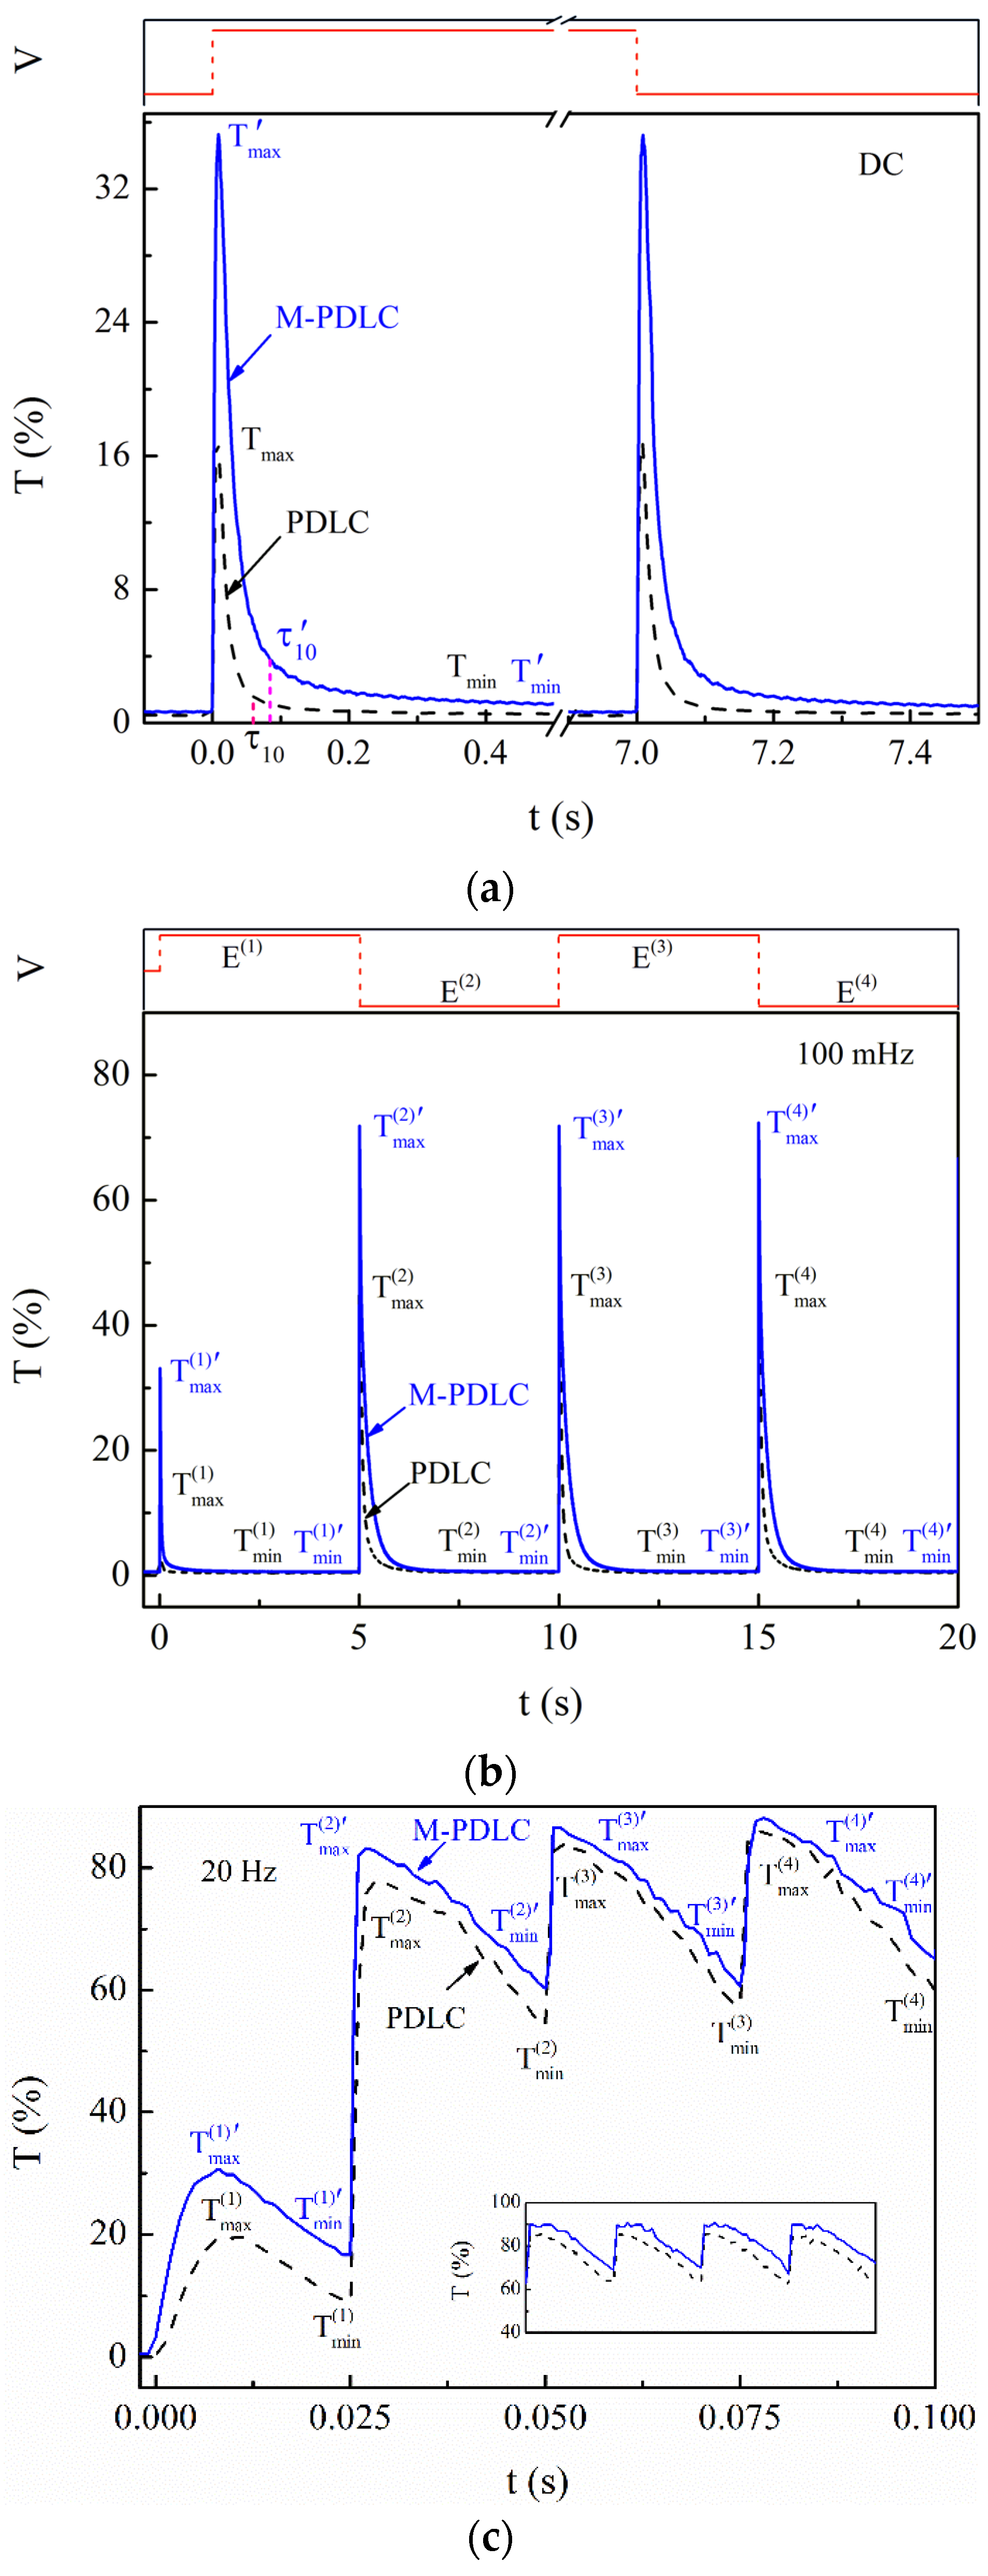
3.3. MNPs’ Modulation in the M-PDLC Film
The experimental results showed that the curve T-t of the M-PDLC sample was similar to that of the PDLC sample, i.e., the frequency doubling was still available but the T-t curve was shifted, indicating the modulating effect of NMPs. The typical T-t curves are shown in Figure 7.
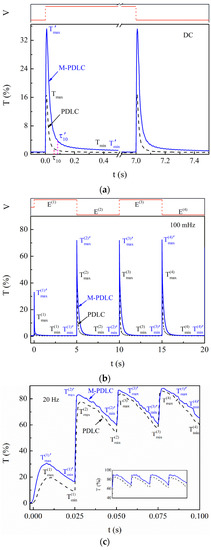
Figure 7.
The T-t curves of the PDLC film and M-PDLC film applied with a DC voltage and an AC square wave voltage at 100 mHz and 20 Hz, respectively. and are the minimum and maximum transmittances in the four T-periods for the PDLC sample, respectively. and correspond to the M-PDLC sample. (a) DC voltage, (b) 0.1 Hz (AC voltage), and (c) 20 Hz (AC voltage).
Observation of SEM (see Appendix B) shows that the microstructures of both samples, including the size and the distribution of the LC droplets, were almost identical. Consequently, the modulating effect of MNPs arose from the ionic adsorption effect of MNPs, instead of the microstructure [16]. The experimental results are explained as follows.
Figure 7a shows that the maximum transmittance of the M-PDLC sample, , and the time from to 10% of , τ10, the minimum transmittance of the M-PDLC sample . was identical when the DC voltage was switched on and off, indicating that the instantaneous maximum internal polarization electric field . The superscript denotes the corresponding parameters of the M-PDLC sample, the same as below.
As shown in Figure 7b, at 100 mHz, , , and . can be attributed to the ionic adsorption by MNPs, which causes the to increase and the to decrease. Consequently, the local electric field of the M-PDLC sample was , according to Equation (1). Because of the maximum transmittance corresponding to the maximum effective electric field and Equation (7), . The concentration of free ions in the LC droplets decreased after MNPs’ doping. The formation time of the internal polarization electric field was longer than . As a result, . Furthermore, , indicating that within this T-period (2.5 s), can reach its maximum . Therefore, will keep constant from the second T-period.
Figure 7c shows that at 20 Hz. That was still caused by the increase in . In addition, , which can be attributed to that the formation time of being longer than . Consequently, the maximum effective electric field . In addition, starting from the second T-period, and . Thus and . These experimental results may be related to the equivalent electric field being dependent on the LC droplet orientation. According to Equations (23) and (24), , so that > and ; as a result, and .
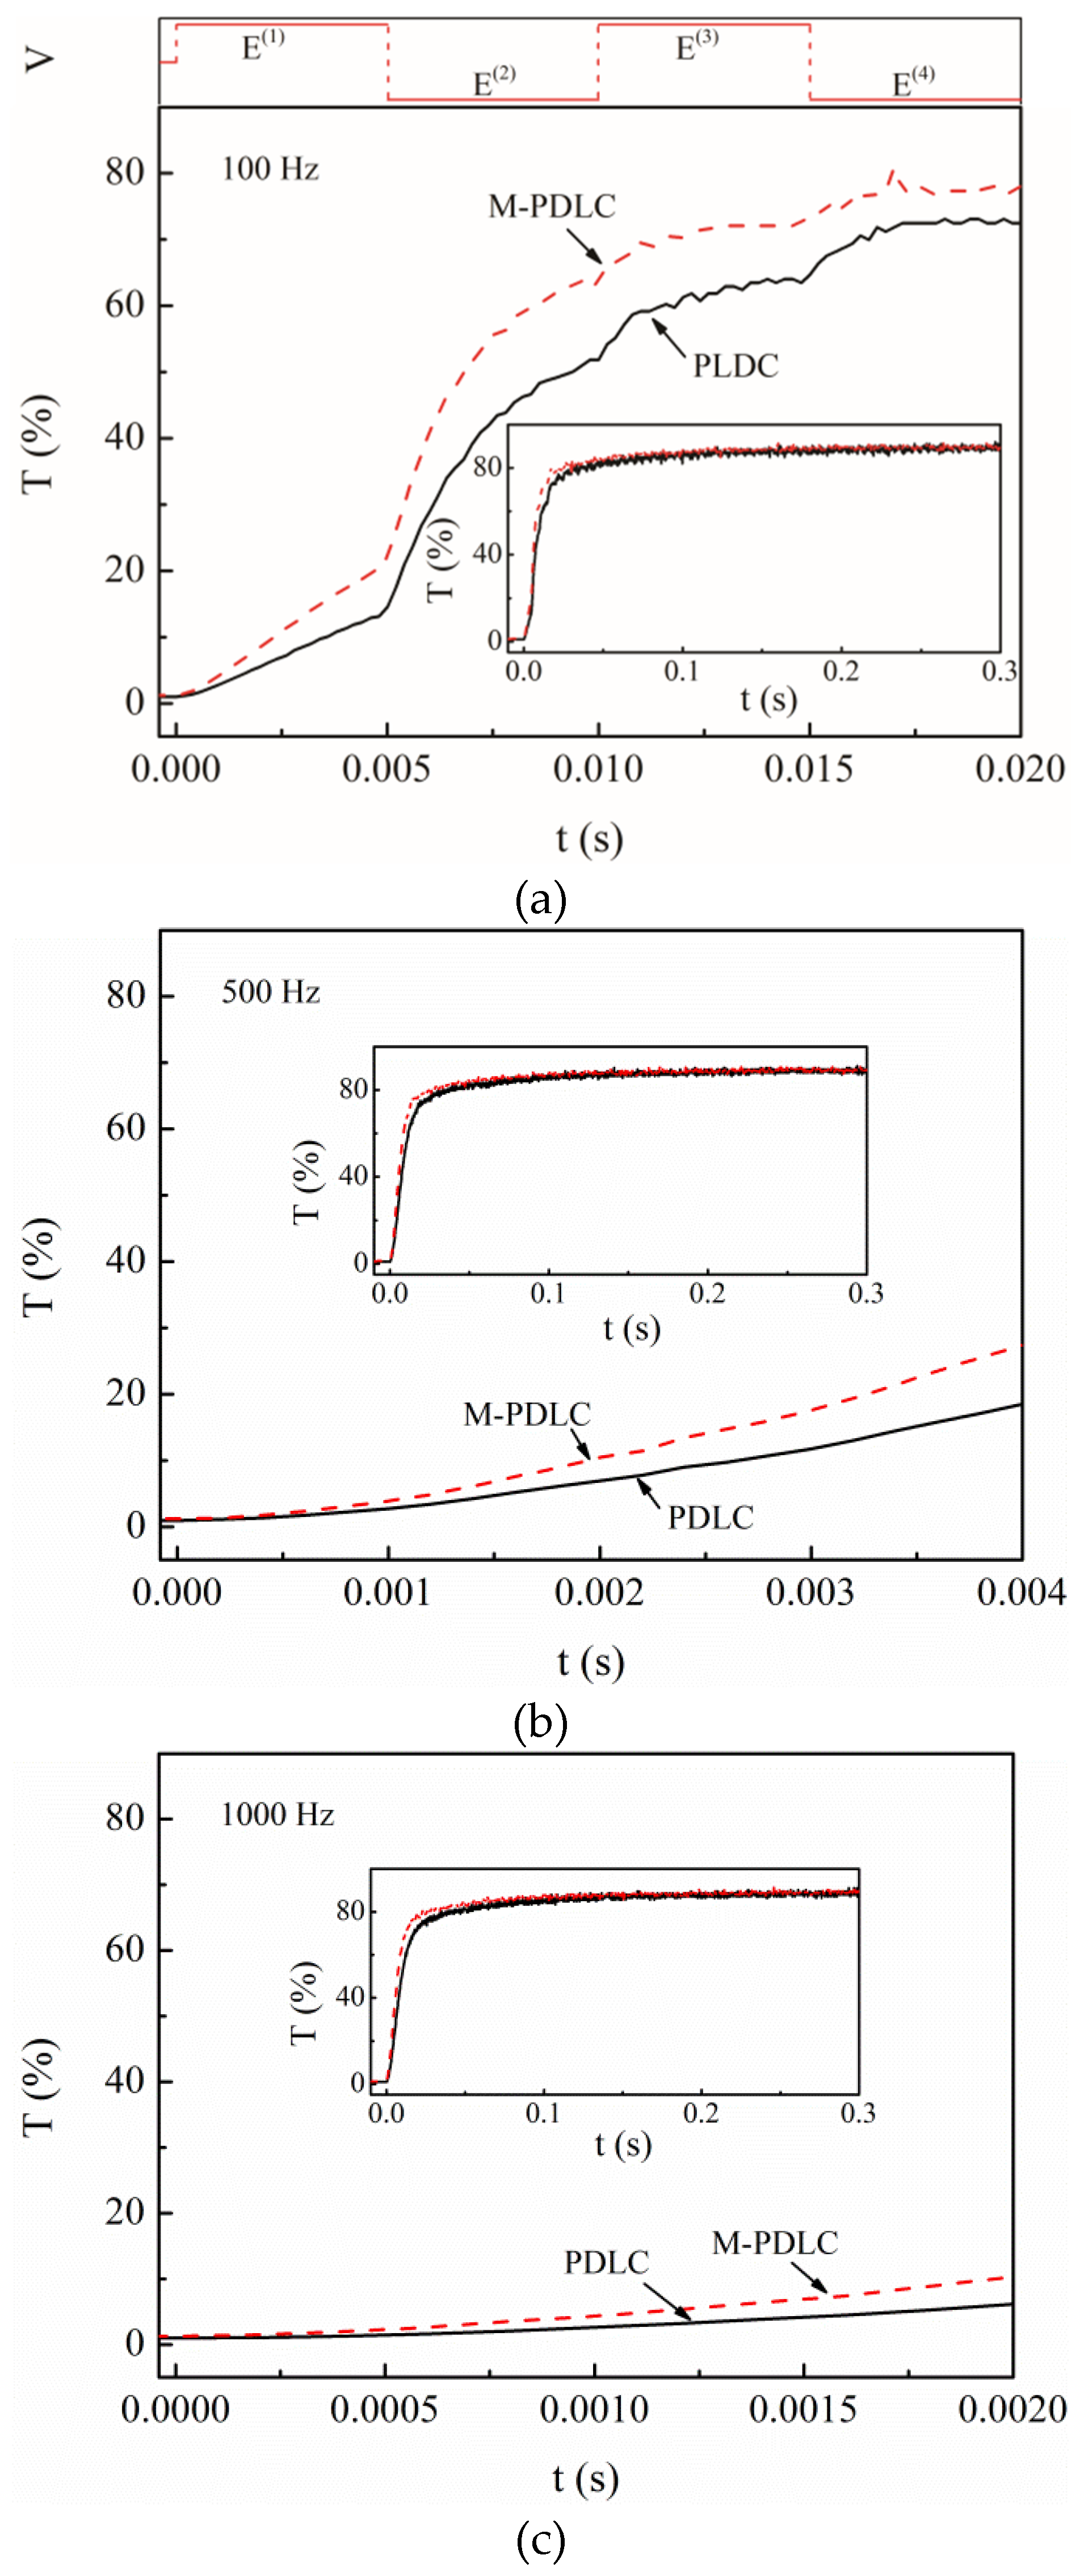
The experiment results showed that the periodic change in transmittance tended to disappear when the frequency was above 100 Hz, but the transmittance increased to the maximum with time (see Appendix C). In addition, these results indicated that the internal polarized field was barely periodically changed due to the reduced T-period. However, the equivalent effective electric field can still increase with the number of T-period so that the LC droplets tended to the local field direction.
4. Conclusions
The electro-optic feature of the PDLC can be affected by an internal polarized electric field at 0–50 Hz, and the transmittance curves change with the different frequency ranges. When the local electric field was inverted, the relaxation of the internal polarized electric field resulted in the relaxation of the transmittance. As a result, the transmittance curves indicated the double frequency of the applied voltage. The internal depolarized electric field could offset the local electric field when the T-period was longer than the slow-response process. However, when the T-period time is only within the fast-response, the internal depolarized electric field cannot entirely form. Simultaneously, the LC droplets retained a specific orientation, equivalent to being applied with an additional effective electric field. The modulating effect of the PDLC doped with MNPs can prove the role of ions in the electro-optical response of PDLC.
Author Contributions
Conceptualization, J.L. and X.M.; methodology, Y.L., X.L. and J.Z.; validation, D.L. and Z.H.; writing—original draft preparation, J.L. and X.M.; writing—review and editing, Z.H.; supervision, D.L.; project administration, D.L. All authors have read and agreed to the published version of the manuscript.
Funding
This research was funded by Fundamental Research Funds for the Central Universities (grant number 2021YJS143), Doctoral Foundation of Southwest University (grant number SWU115010), National Natural Science Foundation of China (grant number 51735006, U1837206, 51927810), Natural Science Foundation of Chongqing, China (cstc2021jcyj-msxmX1136), and Beijing Municipal Natural Science Foundation (grant number 3182013).
Institutional Review Board Statement
Not applicable.
Informed Consent Statement
Not applicable.
Data Availability Statement
Not applicable.
Acknowledgments
The authors would like to thank Wenjiang Ye of the School of Sciences of Hebei University of Technology (Tianjin, China) for helpful discussions on topics related to this work.
Conflicts of Interest
The authors declare no conflict of interest.
Appendix A
Figure A1.
The change in resistance of the PDLC depends on the frequency of the voltage applied.
Figure A1.
The change in resistance of the PDLC depends on the frequency of the voltage applied.
Appendix B
Figure A2.
The SEM images of the PDLC and M-PDLC. (a) PDLC, (b) M-PDLC.
Figure A2.
The SEM images of the PDLC and M-PDLC. (a) PDLC, (b) M-PDLC.
Appendix C
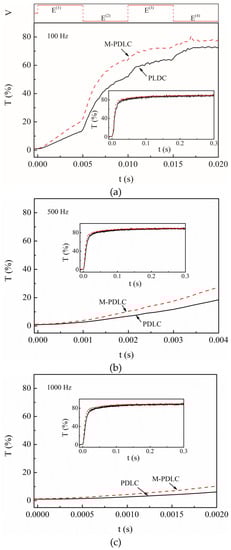
Figure A3.
The T-t curves of the un-doped and doped PDLCs under AC applied voltage. (a) 100 Hz, (b) 500 Hz, (c) 1000 Hz.
Figure A3.
The T-t curves of the un-doped and doped PDLCs under AC applied voltage. (a) 100 Hz, (b) 500 Hz, (c) 1000 Hz.
References
- Bouteiller, L.; Barny, P.L. Polymer-dispersed liquid crystals: Preparation, operation and application. Liq. Cryst. 1996, 21, 157–174. [Google Scholar] [CrossRef]
- Singh, S.; Srivastava, J.K.; Singh, R.K. Polymer Dispersed Liquid Crystals. In Liquid Crystalline Polymers; Thakur, V.K., Kessler, M.R., Eds.; Springer International Pubishing: Cham, Switzerland, 2016; pp. 195–250. [Google Scholar]
- Doane, J.W. Polymer Dispersed Liquid Crystal Displays. In Liquid Crystal Application and Uses; Bahadur, B., Ed.; World Scientific: Singapore, 1990; pp. 362–395. [Google Scholar]
- Rumi, M.; Bunning, T.J.; Sio, L.D. Polymer Dispersed Liquid Crystals. In Polymer-Modified Liquid Crystals; Dierjing, I., Ed.; Soft Matter Series; No. 8; The Royal Society of Chemistry: London, UK, 2019; pp. 61–104. [Google Scholar]
- Bloisi, F.; Vicari, L. Polymer-dispersed liquid crystals. In Optical Application of Liquid Crystals; Vicari, L., Ed.; IOP Pubishing Ltd.: Bristol, UK, 2003. [Google Scholar]
- Gardiner, D.J.; Morris, S.M.; Coles, H.J. High-efficiency multistable switchable glazing using smectic A liquid crystals. Sol. Energy Mater. Sol. Cells 2009, 93, 301–306. [Google Scholar] [CrossRef]
- Vaz, N.A.; Smith, G.W.; Montgomery, G.P., Jr. A Light Control Film Composed of Liquid Crystal Droplets Dispersed in a UV-Curable Polymer. Liq. Cryst. 1987, 146, 1–15. [Google Scholar]
- Hassanein, G.N.; Kattan, N.; Ellabban, M.A. Electro-optic properties of aligned and non-aligned polymer dispersed liquid crystals driven by an amplitude-modulated electric signal. Optik 2019, 186, 137–146. [Google Scholar] [CrossRef]
- Wu, B.G.; Erdmann, J.H.; Doane, J.W. Response times and voltages for PDLC light shutters. Liq. Cryst. 1989, 5, 1453–1465. [Google Scholar] [CrossRef]
- Kovalchuk, O.V.; Reshetnyak, V.Y.; Yarmolenko, V.V.; Yaroshchuk, O.V. Low frequency relaxation processes in a PDLC film. Mol. Cryst. Liq. Cryst. 1999, 331, 627–634. [Google Scholar] [CrossRef]
- Liu, H.H.; Lee, W. Time-varying ionic properties of a liquid-crystal cell. Appl. Phys. Lett. 2010, 97, 023510. [Google Scholar] [CrossRef]
- Garbovskiy, Y.; Gluschenko, I. Nano-Objects and Ions in Liquid Crystals: Ion Trapping Effect and Related Phenomena. Crystals 2015, 5, 501–533. [Google Scholar] [CrossRef]
- Garbovskiy, Y. Nanoparticles in Liquid Crystals as Ion-Generating and Ion-Capturing Objects. Crystals 2018, 8, 264. [Google Scholar] [CrossRef] [Green Version]
- Marinov, Y.G.; Hadhichristov, G.B.; Petrov, A.G.; Marino, S.; Versace, C.; Scaramuzza, N. Selective amplitude-frequency electro-optical modulation by polymer-dispersed liquid crystal films aligned by teflon nanolayers. C. R. Acad. Bulg. Sci. 2013, 66, 819–826. [Google Scholar] [CrossRef]
- Costa, M.R.; Altafim, R.A.C.; Mammana, A.P. Ionic impurities in nematic liquid crystal displays. Liq. Cryst. 2001, 28, 1779–1783. [Google Scholar] [CrossRef]
- Meng, X.S.; Li, J.; Lin, Y.Q.; Liu, X.D.; Liu, N.N.; Ye, W.J.; Li, D.C.; He, Z.H. Polymer dispersed liquid crystals doped with low concentration γ-Fe2O3 nanoparticles. Liq. Cryst. 2021, 48, 1791–1805. [Google Scholar] [CrossRef]
- Jain, S.C.; Rout, D.K. Electro-optic response of polymer dispersed liquid crystal films. J. Appl. Phys. 1991, 70, 6988–6992. [Google Scholar] [CrossRef]
- Cupelli, D.; Macchione, M.; Nicoletta, F.P.; de Filpo, G.; Chidichimo, G. Surface anchoring, polarization fields and memory states in polymer dispersed liquid crystals. Liq. Cryst. 2001, 28, 287–290. [Google Scholar] [CrossRef]
- Drzai, P.S. Liquid Crystal Dispersions; World Scientific: Singapore, 1995; pp. 236–291. [Google Scholar]
- Maschke, U.; Coqueret, X.; Benmouna, M. Electro-optical properties of Polymer-Dispersed Liquid Crystals. Macromol. Rapid Commun. 2002, 23, 159–170. [Google Scholar] [CrossRef]
- Cupelli, D.; Nicoletta, F.P.; de Filpo, G.; Cassano, R.; Puoci, F.; Chidichimo, G. The electro-optical properties of ‘charged’ PDLCs. Liq. Cryst. 2005, 32, 395–400. [Google Scholar] [CrossRef]
- Kelly, J.R.; Seekola, D.L. Dielectric losses in a polymer-dispersed liquid crystal film. SPIE 1990, 1257, 17–28. [Google Scholar]
- de Filpo, G.; Huang, Z.; Chidichimo, G.; Imbardelli, D. Measurement of the polarization field in PDLC with memory state. Mol. Cryst. Liq. Cryst. 1997, 304, 71–79. [Google Scholar] [CrossRef]
- Meng, X.S.; He, Z.H.; Zhao, J.W.; Lin, Y.Q.; Liu, X.D.; Li, D.C.; Li, J.; Qiu, X.Y. Oleic acid surface modification in the preparation of magnetic nanoparticles by a chemically induced transition. IEEE Tran. Magn. 2018, 54, 2300107. [Google Scholar] [CrossRef]

Publisher’s Note: MDPI stays neutral with regard to jurisdictional claims in published maps and institutional affiliations. |
© 2022 by the authors. Licensee MDPI, Basel, Switzerland. This article is an open access article distributed under the terms and conditions of the Creative Commons Attribution (CC BY) license (https://creativecommons.org/licenses/by/4.0/).