Article

Electrical Conductivity and Dielectric Relaxation in Ag1−xLixNbO3

1
Faculty of Physics, Vilnius University, Sauletekio Av. 9, LT-10222 Vilnius, Lithuania
2
Institute of Physics, Faculty of Mathematics, Physics and Chemistry, University of Silesia in Katowice, UL 75 Pulku Piechoty 1, PL-41-500 Chorzow, Poland
*
Author to whom correspondence should be addressed.
Crystals 2022, 12(2), 158; https://doi.org/10.3390/cryst12020158
Submission received: 17 December 2021 / Revised: 14 January 2022 / Accepted: 19 January 2022 / Published: 21 January 2022
(This article belongs to the Special Issue Research and Development of Ferroelectric Material)

Abstract

:
The broadband electrical properties of Ag1−xLixNbO3 (ALNx) ceramics (x ≤ 0.1) together with AgNbO3 (AN) crystals were studied over a wide temperature interval of 20–800 K. For ALNx with x ≤ 0.05, a very diffused ferroelectric phase transition was observed. The position of the dielectric permittivity maximum in this phase transition is strongly frequency-dependent and is described well by the Vogel–Fulcher law. The freezing temperature decreases when the lithium concentration increases. Below the ferroelectric phase transition temperature, the dielectric dispersion is mainly caused by ferroelectric domain dynamics. Moreover, for ALN3 and ALN5 ceramics at very low temperatures (below 100 K), behavior typical of dipolar glasses is observed. At higher temperatures (above 650 K for ALN5), electrical conductivity effects become important. The DC conductivity increases with temperature according to the Arhenius law and the activation energy is highest in the antiferroelectric phase. Moreover, the activation energy is strongly dependent on the lithium concentration and it is greatest when x = 0.02.

1. Introduction

Nowadays, perovskite materials are widely investigated for applications in electronic, acoustic, and renewable energy systems [1]. Outstanding materials for such applications are niobate-based perovskite ceramics [2]. For example, in silver niobate (AgNbO3, AN) the ferrielectric phase transition is observed slightly above room temperature and this material has the piezoelectric factor d33 = 0.24 pC/N and the polarization 52 μC/cm2 in ambient conditions [3,4,5]. It is interesting that AN has several phase transitions above room temperature, including paraelectric–antiferroelectric, antiferroelectric–antiferroelectric, and antiferroelectric–ferroelectric ones [6,7,8]. Polar phase transitions are associated with niobium and silver ion displacement, while phase transitions in paraelectric phases are associated with gradual transformations in oxygen octahedron geometry [6]. Materials based on AN are attractive for ferroelectric energy depository applications due to their huge polarization in the electric field and small remanent polarization [9,10,11]. AN-based materials also exhibit relatively large dielectric permittivity values and small dielectric losses over broad frequency ranges, including microwaves [12].
Mixed Ag1−xLixNbO3 (ALNx) compounds have enhanced ferroelectric and piezoelectric properties in comparison with AN, for example outstanding piezoelectric properties are reported for ALN when x = 0.065 [13]. Low-frequency (below 1 MHz) dielectric, structural, and polarization investigations show that when x ≤ 0.05 the ferroelectric phase transition is observed at lower temperatures with higher lithium content and is less expressed [14,15,16,17,18,19]. At the same time, the transition among antiferroelectric states is prevalent [14,15,16,17,18,19]. The orthorhombic–rhombohedral morphotropic boundary (MPB) is observed close to x = 0.05. At higher lithium content (i.e., x > 0.05), four transition sequences between paraelectric cubic Pm–3m, tetragonal P4/mbn and orthorhombic Cmcm, antiferroelectric orthorhombic Pbnm, and ferroelectric rhombohedral R3c is observed [16,19,20]. Above MPB, the ferroelectric anomaly becomes more pronounced and is observed at higher temperatures with higher lithium content. The dielectric data of ALN ceramics in the X-band (8–12 GHz) and Ka-band (27–40 GHz) are presented in [21,22,23] and it is commonly thought that these ceramics are suitable for various microwave applications.
Raman and Infrared spectroscopic investigations of ALN showed the crucial importance of Nb, Ag, and O ion dynamics in terms of phase transition dynamics [17,18,22,23]. Moreover, the complex dielectric permittivity depends on the frequency in the AN and the related materials, which are primarily in the frequency range between 100 GHz and several THz. The dielectric dispersion in this frequency range is related to niobium and/or tantalum ion motions [19,21,24,25,26]. However, X-ray investigations showed that Ag and O ion displacement is also very important [8,26,27]. However, dielectric investigations of ALN over a wide frequency range with detailed analysis have not been performed and the electrical conductivity has only been investigated for x = 0.08 [22]. These problems have once again become very attractive after recent investigations into AN and propositions of AN-based materials for use in renewable energy [28,29,30,31,32].
The purpose of this work is to investigate dielectric properties and the phase diagram of ALN (x ≤ 0.1) ceramics and AN crystals via broadband analysis over a wide temperature range of 20–800 K.

2. Materials and Methods

ALN ceramics were synthesized using a traditional chemical reaction [14]. Firstly, Ag2O (99.99%), Nb2O5 (99.9%), and Li2CO3 (99.99%) (purchased from Sigma-Aldrich (Poznan, Poland)) chemical agents weighted in molar equal portions were carefully stirred, pressed and heated in inert atmosphere at 820 °C for 3 h. The obtained material was milled, pressed, and sintered at 960 °C for 3 h. The obtained material was once more crushed, milled, pressed into pellets under 250 MPa pressure, and finally sintered for 4 h at a temperature that decreased linearly, with Li concentration increasing from 1080 °C for AgNbO3 to 1040 °C for Ag0.9Li0.1NbO3. Excellent, yellowish ceramics exhibiting a specific mass of 95% of the theoretically calculated value were prepared.
A single crystal of AgNbO3 was grown by the flux approach with 8Ag2O ∗ 5V2O5 being utilized as a flux [33].
Dielectric investigations were conducted over a broad frequency range of 20 Hz–1 GHz. Investigations were performed using various experimental methods and techniques. At low frequencies (20 Hz–1 MHz), measurements were conducted using a LCR meter HP4284 A. Investigations into the 1 MHz–3 GHz frequency range were performed with a vector network analyzer Agilient 8714 ET [34]. For temperature-dependent measurements, home-made furnaces and various cryostats (closed cycle helium cryostat for measurements in the low frequency range 20 Hz–1 MHz and liquid nitrogen cryostat for measurements in the 1 MHz–3 GHz frequency range) were used. Cylindrically shaped samples (height 1–3 mm, diameter 1–5 mm) were used for measurements. Silver paint was utilized for electrical contacts.

3. Results

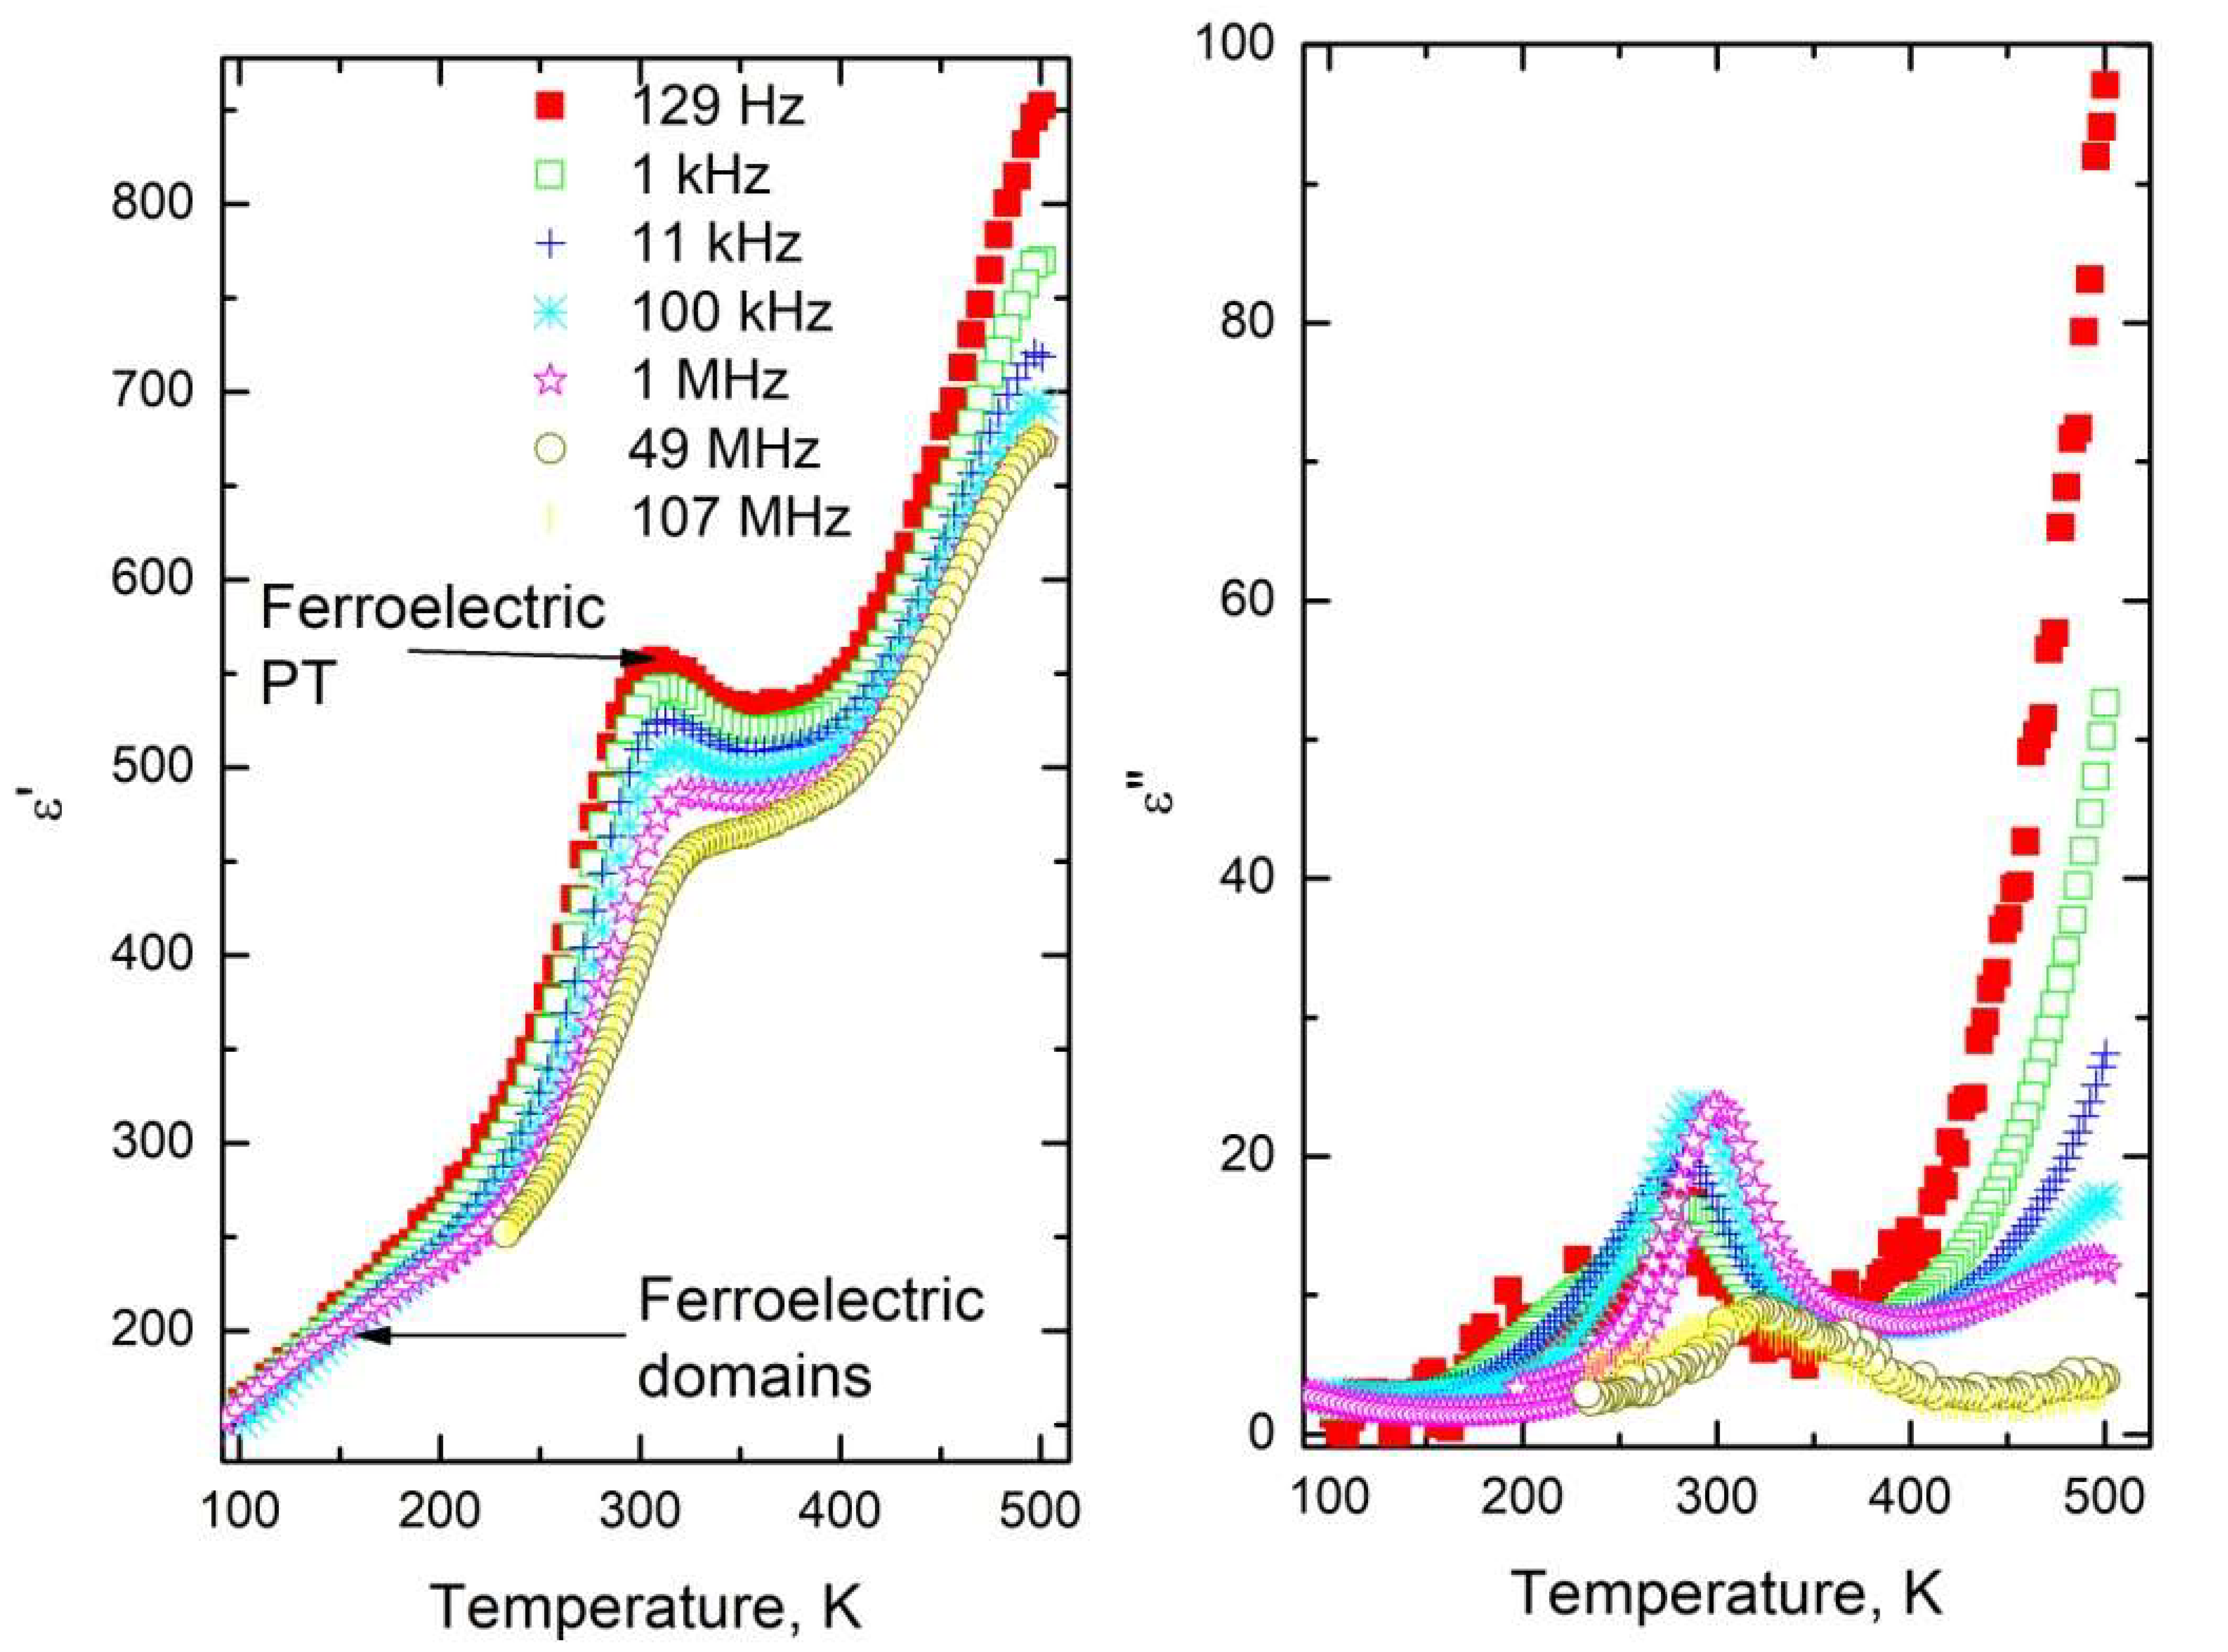
3.1. Phase Transitions in ALN Ceramics

The complex dielectric permittivity as a function of temperature for ALN5 ceramics at different frequencies is presented in Figure 1. The local peak of the dielectric permittivity at 129 Hz is observed close to 303 K. The position of the dielectric permittivity peak occurs at higher temperatures when frequency increases. At higher frequencies, the dielectric permittivity anomaly becomes more diffused. Therefore, the dielectric dispersion is related to the dynamics of the dipoles and the dipoles fail to follow the electromagnetic field at higher frequencies due their finite relaxation time. Such behavior is not typical for classic ferroelectrics, for which the position of dielectric anomalies is frequency independent at low frequencies at least [34]. The position of dielectric losses’ maximum is also strongly frequency-dependent.
The complex dielectric permittivity increases on heating above 350 K due to the onset of the antiferroelectric phase transition [14]. The small kink close to 150 K is not related to the phase transition [20]. Such dielectric peculiarities in the ferroelectric phase are usually related to the impact of ferroelectric domain dynamics [35].
In Figure 2 we can see the temperature dependences of the dielectric properties of ALN materials at different lithium concentrations and a frequency of 1 MHz. The local peaks of the complex dielectric permittivity related to O1–O2 (close to 651 K for AN), M3–O1 (close to 610 K for AN), M2–M3 (close to 533 K for AN), and M2–M1 (close to 334 K) phase transitions are clearly observed in the temperature dependencies of ALN ceramics’ dielectric properties in good agreement with X-ray investigations of ALN [17,20]. Moreover, similarly to ALN5, the maximum complex dielectric permittivity below 200 K is connected with the ferroelectric domain’s dynamics. The dielectric anomaly close to 445 K, related to freezing temperature Tf [8], is observed only for AN. Dielectric anomalies related to O1–O2 and M3–O1 strongly shift to higher temperatures with higher lithium content, whereas the maximum of the complex dielectric permittivity connected to the M2–M3 phase transition shifts towards lower temperatures and becomes predominant. Moreover, the behavior of M2–M1 is complex, and for x ≤ 0.05 the anomaly shifts to lower temperatures, while for x = 0.06 the anomaly is observed at substantially higher temperatures, close to 380 K. At higher lithium concentrations, this anomaly is not observed. The dielectric losses at 1 MHz are quite low at all temperatures (lower than 55) and the increase in dielectric losses with temperature is observed only above 700 K and is related to the onset of electrical conductivity. Below 200 K the biggest dielectric losses are seen for samples with x = 0.05 and x = 0.03, as they are related to dielectric relaxation.
The position of dielectric permittivity maximum related to the M1–M2 anomaly is frequency-dependent for materials with x ≤ 0.05. These T–f dependences are plotted in Figure 3. The anomaly related to the M1–M2 transition in AN crystals is almost invisible and the temperature dependence of the dielectric permittivity is in good agreement with previous investigations of AN crystals [7]. Therefore, T–f dependences were not obtained for AN crystals and are not plotted in Figure 3. These functions were fitted with the Fogel–Vulcher formula:
ν = ν 0 exp ( E A k ( T m T 0 ) )
where Tm is the temperature of the dielectric permittivity maximum, ν0 is the frequency for Tm→∞; EA is the activation energy, T0 is the freezing temperature, and k is the Bolzmann constant. The calculated values of the parameters are enumerated in Table 1. The freezing temperature decreases when lithium concentration increases, while the dependence of EA and T0 is less expressed. The freezing temperature is related to the rms variance of the coupling of ferroelectric active dipoles [35]. Therefore, the disorder in interactions between ferroelectric active dipoles also decreases with lithium concentration. Moreover, the position of the dielectric permittivity maximum is frequency-independent for AN ceramics, indicating that the lithium ions cause the diffusivity of the ferroelectric phase transition.

3.2. Electrical Conductivity in ALN Ceramics

Above 600 K, electrical conductivity effects become important. The frequency dependences of the electrical conductivity for ALN5 ceramics at various temperatures can be seen in Figure 4. The direct current (DC) electrical conductivity σDC (which is related to the frequency-independent plateau) can clearly be observed above 600 K. Moreover, on heating the specific frequency (the frequency at which electrical conductivity begins to deviate from the DC conductivity value) also increases with temperature so that the DC conductivity coincides with the conductivity measured at different frequencies over a broad frequency range. These spectra were fitted with the Jonsher universal dielectric response law [36]:
σ = σDC + Aωs
where Aωs is the alternate current conductivity.
The temperature function of DC conductivity is presented in Figure 5. This quantity strongly increases with temperature for all ALN ceramics. However, it shows a slope change at 620 K, close to the M3–O1 anomaly temperature. Therefore, it was fitted separately below and above this temperature according to Arrhenius’ law:
σ = σ 0 exp ( E B k T )
where σ0 is the pre-exponential coefficient and EB is the conductivity activation energy.
The obtained parameters, namely activation energy EB and pre-exponential coefficient σ0, are presented in Figure 6. The activation energy in the M3 phase is higher than in the O1 phase. Moreover, the activation energy is largest when x = 0.02. The values of activation energy are conventional for oxygen diffusion [37]. The M3–O1 phase transition is related to niobium and silver ion displacement [20], therefore these displacements increase the potential barrier for oxygen diffusion. Moreover, it has been claimed that the Nb5+ ion displacement arrangement is structurally disordered for AN [7]. Therefore, the disorder increase in the Nb sublattice can also increase the potential barrier for oxygen diffusion.

3.3. Dielectric Anomaly at Low Temperaures in ALN Ceramics

It is interesting that the dielectric anomaly for some ALN ceramics (ALN3 and ALN5) is seen at very low temperatures (below 100 K). For example, the temperature dependence of the dielectric permittivity of ALN5 at various frequencies in the low temperature region (at temperatures less than 150 K) is presented in Figure 7. The dielectric losses as a function of temperature show a clearly expressed maximum, which moves to higher temperatures with increasing frequency. A kink is expressed in the temperature dependence of dielectric permittivity, which is also frequency-dependent. What is the origin of this additional dielectric anomaly? It could be related to the dipolar glass behavior or ferroelectric domain dynamics [38]. These different behaviors can be separated by plotting the measurement frequency versus the temperature of the value of the greatest dielectric losses (Figure 8) [38].
For these dependencthe es, the Vogel–Fulcher relationship is also valid (1) with fitted parameters ν0 = 1.4 GHz, EA = 424 K, T0 = 18 K for ALN3 and ν0 = 2.8 GHz, EA = 444 K, T0 = 15 K for ALN5. The non-zero freezing temperature indicates that the dielectric dispersion is related to the dipolar glass behavior rather than the ferroelectric domain dynamics [39]. Additionally, the Vogel–Fulcher behavior (Equation (1)) is typical of ferroelectric relaxors [40]. However, in our case the dielectric anomaly was observed at relatively low temperatures and the values of the freezing temperature were also very low, which is not typical for ferroelectric relaxors [36]. Therefore, the dielectric behavior of ALN3 and ALN5 at low temperatures is more likely related to the dipolar glass behavior. The dipolar glass behavior in the system is related to disorder in the Nb sublattice [7] due to the competing interactions (ferroelectric and antiferroelectric) in the Nb and Ag subsystems [14].

4. Conclusions

The dielectric properties of Ag1−xLixNbO3 (ALNx) ceramics (x ≤ 0.1) and AN crystals were investigated over a broad frequency range (20 Hz–1 GHz). For ALNx with x ≤ 0.05, a very diffused ferroelectric phase transition is observed, with the dielectric permittivity maximum being strongly frequency-dependent and following the Vogel–Fulcher law. The freezing temperature decreases with an increase in the lithium concentration, which indicates that disorder in the system decreases with lithium concentration. In the ferroelectric phase, the frequency dependence of the dielectric permittivity is mainly caused by ferroelectric domain dynamics. Moreover, for ALN3 and ALN5 ceramics, the additional dielectric dispersion is seen at temperatures lower than 100 K, which can be explained by the dipolar glass behavior, which is related to the competing interactions (ferroelectric and antiferroelectric) in the Nb and Ag subsystems. The electrical conductivity of ALN materials was also investigated and the DC conductivity was determined from broadband conductivity spectra. The DC electrical conductivity versus temperature follows Arhenius’ law but with different activation energies in the antiferroelectric and paraelectric phases. The electrical conductivity is caused mainly by oxygen transport vacancies. The greatest activation energy is observed when x = 0.02.

Author Contributions

Conceptualization, A.K. and J.M.; methodology, J.M.; software, J.B.; validation, J.M. and A.K.; formal analysis, J.M.; investigation, J.M. and A.K.; resources, A.K.; data curation, J.M.; writing—original draft preparation, J.M.; writing—review and editing, J.M. and A.K.; visualization, J.M.; supervision, A.K.; project administration, J.M.; funding acquisition, J.B. All authors have read and agreed to the published version of the manuscript.

Funding

This research received no external funding.

Institutional Review Board Statement

Not applicable.

Informed Consent Statement

Not applicable.

Data Availability Statement

The data presented in this study are available upon request from the corresponding author.

Conflicts of Interest

The authors declare no conflict of interest.

References

  1. Burschka, J.; Pellet, N.; Moon, S.J.; Humphry-Baker, R.; Gao, P.; Nazeeruddin, M.K.; Gratzel, M. Sequential deposition as a route to high-performance perovskite-sensitized solar cells. Nature 2013, 499, 7548. [Google Scholar] [CrossRef] [PubMed]
  2. Ma, H.S.; Lee, M.K.; Kim, B.H.; Park, K.H.; Park, J.J.; Lee, S.H.; Jeong, Y.G.; Park, K.; Jeong, C.K.; Lee, G.J. Role of oxygen vacancy defects in piezoelectric thermal stability characteristics of Mn-doped (K, Na, Li)NbO3 piezoceramics. Ceram. Int. 2021, 47, 27803. [Google Scholar] [CrossRef]
  3. Kania, A.; Roleder, K.; Lukaszewki, M. The ferroelectric phase in AgNbO3. Ferroelectrics 1984, 265, 52. [Google Scholar] [CrossRef]
  4. Fu, D.; Endo, M.; Taniguchi, H.; Tanijama, T.; Itoh, M. AgNbO3: A lead-free material with large polarization and electromechanical response. Appl. Phys. Lett. 2007, 90, 252907. [Google Scholar] [CrossRef]
  5. Wada, S.; Saito, A.; Hoshina, T.; Kakemoto, H.; Tsurumi, T.; Moriyoshi, C.; Kuroiwa, Y. Growth of Silver Lithium Niobate Single Crystals and Their Piezoelectric Properties. Ferroelectrics 2007, 346, 64. [Google Scholar] [CrossRef]
  6. Sciau, P.; Kania, A.; Dkhil, B.; Suard, E.; Ratuszna, A. Structural investigation of AgNbO3 phases using x-ray and neutron diffraction. J. Phys. Condens. Mater 2004, 16, 2795–2810. [Google Scholar] [CrossRef]
  7. Miga, S.; Kania, A.; Dec, J. Freezing of Nb5+ ions dynamics in AgNbO3 studied by linear and nonlinear dielectric response. J. Phys. Condens. Matter 2011, 23, 155901. [Google Scholar] [CrossRef]
  8. Levin, I.; Krayzman, V.; Woicik, J.C.; Karapetrova, J.; Proffen, T.; Tucker, M.G.; Reaney, I.M. Structural changes underlying the diffuse dielectric response in AgNbO3. Phys. Rev. B 2009, 79, 104113. [Google Scholar] [CrossRef] [Green Version]
  9. Li, S.; Hu, T.F.; Nie, H.C.; Fu, Z.Q.; Xu, C.H.; Xu, F.F.; Wang, G.S.; Dong, X.L. Giant energy density and high efficiency achieved in silver niobate-based lead-free antiferroelectric ceramic capacitors via domain engineering. Energy Storage Mater. 2021, 34, 417–426. [Google Scholar] [CrossRef]
  10. Han, K.; Lu, N.N.; Mao, S.F.; Zhuo, F.P.; Chen, X.Y.; Liu, L.J.; Hu, C.Z.; Wang, X.P.; Wei, Y.Z. Realizing high low-electric-field energy storage performance in AgNbO3 ceramics by introducing relaxor behaviour. J. Mater. 2019, 5, 597–605. [Google Scholar] [CrossRef]
  11. Liu, Z.L.; Bao, W.C.; Wang, G.; Sun, S.K.; Li, L.H.; Li, J.L.; Jang, H.J.; Ji, H.F.; Feteira, A.; Li, D.J.; et al. Mechanism of enhanced energy storage density in AgNbO3-based lead-free antiferroelectrics. Nano Energy 2021, 79, 105423. [Google Scholar] [CrossRef]
  12. Valant, M.; Axelsson, A.K.; Alford, N. Review of Ag(Nb, Ta)O3 as a functional material. J. Eur. Ceram. Soc. 2007, 27, 2549–2560. [Google Scholar] [CrossRef]
  13. Fu, D.; Endo, M.; Taniguchi, H.; Taniyama, T.; Koshihara, S.; Itoh, M. Piezoelectric properties of lithium modified silver niobate perovskite single crystals. Appl. Phys. Lett. 2008, 92, 172905. [Google Scholar] [CrossRef]
  14. Kania, A.; Miga, S. Preparation and dielectric properties of Ag1−xLixNbO3 (ALN) solid solutions ceramics. Mat. Sci. Eng. B-Adv. 2001, 86, 128. [Google Scholar] [CrossRef]
  15. Niewiadomski, A.; Kania, A.; Kugel, G.E.; Hafid, M.; Ditko, D. Raman spectroscopy, dielectric properties and phase transitions of Ag0.96Li0.04NbO3 ceramics. Mater. Res. Bull. 2015, 65, 123. [Google Scholar] [CrossRef]
  16. Fu, D.; Endo, M.; Taniguchi, H.; Taniyama, T.; Itoh, M.; Koshihara, S. Ferroelectricity of Li-doped silver niobate (Ag, Li)NbO3. J. Phys. Condens. Matter 2011, 23, 075901. [Google Scholar] [CrossRef] [PubMed] [Green Version]
  17. Newiadomski, A.; Kajewski, D.; Kania, A.; Balin, K.; Miga, S.; Pawlik, M.; Koperski, S. Microstructure and characterization of Ag1−xLixNbO3 ceramics. Ceram. Int. 2016, 42, 4445. [Google Scholar] [CrossRef]
  18. Khan, H.U.; Sterianou, I.; Miao, J.; Pokorny, J.; Reaney, I.M. The effect of Li-substitution on the M-phases of AgNbO3. J. Appl. Phys. 2012, 111, 024107. [Google Scholar] [CrossRef]
  19. Sakabe, Y.; Takeda, T.; Ogiso, Y.; Wada, N. Ferroelectric properties of (Ag, Li)(Nb, Ta)O-3 ceramics. Japan. J. Appl. Phys. 2001, 42, 5675. [Google Scholar] [CrossRef]
  20. Farid, U.; Gibbs, A.S.; Kennedy, B.J. Impact of Li doping on the struture and phase stability in AgNbO3. Inorg. Chem. 2020, 59, 12595–12607. [Google Scholar] [CrossRef]
  21. Porokhonskyy, V.; Bovtun, V.; Kamba, S.; Buixaderas, E.; Petzelt, J.; Kania, A.; Miga, S.; Yakimenko, Y. Microwave dielectric properties of the Ag1−xLixNbO3 (x=0 divided by 0.06) ceramics. Ferroelectrics 2000, 238, 137. [Google Scholar] [CrossRef]
  22. Palaimiene, E.; Macutkevic, J.; Kezionis, A.; Banys, J.; Gruszka, I.; Koperski, J.; Kania, A. Dielectric properties and infrared spectra of Ag0.92Li0.08NbO3 ceramics. Solid State Commun. 2021, 32, 114338. [Google Scholar] [CrossRef]
  23. Palaimiene, E.; Macutkevic, J.; Banys, J.; Gruszka, I.; Kania, A. Broadband and infrared spectroscopy of Ag0.98Li0.02NbO3 ceramics. Lith. J. Phys. 2020, 60, 247–252. [Google Scholar] [CrossRef]
  24. Kania, A.; Roleder, K.; Kugel, G.E.; Fontana, M.D. Raman scattering, central peak and phase transitions in AgNbO3. J. Phys. C Solid State Phys. 1986, 19, 9. [Google Scholar] [CrossRef]
  25. Volkov, A.A.; Gorshunov, B.P.; Komandin, G.; Fortin, W.; Kugel, G.E.; Kania, A.; Grigas, J. High-frequency dielectric spectra of AgTaO3-AgNbO3 mixed ceramics. J. Phys. Condens. Matter 1995, 7, 785. [Google Scholar] [CrossRef]
  26. Fortin, W.; Kugel, G.E.; Grigas, J.; Kania, A. Manifestation of Nb dynamics in Raman, microwave, and infrared spectra of the AgTaO3-AgNbO3 mixed system. J. Appl. Phys. 1996, 79, 4273. [Google Scholar] [CrossRef]
  27. Ratuszna, A.; Pawluk, J.; Kania, A. Temperature Evolution of the Crystal Structure of AgNbO3. Phase Transit. 2003, 76, 611. [Google Scholar] [CrossRef]
  28. Tian, Y.; Li, J.; Hu, Q.; Jin, L.; Yu, K.; Li, J.; Politova, E.D.; Yu, S.; Stefanovich, S.Y.; Xu, Z.; et al. Ferroelectric transitions in silver niobate ceramics. J. Mater. Chem. C 2019, 7, 1028. [Google Scholar] [CrossRef]
  29. Tian, Y.; Jin, L.; Zhang, H.F.; Xu, Z.; Wei, X.Y.; Politova, E.D.; Stefanovich, S.Y.; Tarakina, N.V.; Abrahams, I.; Yan, H.X. High energy density in silver niobate ceramics. J. Mater. Chem. A 2016, 4, 17279. [Google Scholar] [CrossRef]
  30. He, X.; Chen, C.; Li, C.B.; Zhen, H.R.; Yi, Z.G. Ferroelectric, photoelectric, and photovolataic performance of silver niobate ceramics. Adv. Funct. Mater. 2019, 29, 1900918. [Google Scholar] [CrossRef]
  31. Yan, Z.N.; Zhang, D.; Zhou, X.F.; Qi, H.; Luo, H.; Zhou, K.C. Silver niobate based lead-free ceramics with high energy storage density. J. Mater. Chem. A 2019, 7, 10702. [Google Scholar] [CrossRef]
  32. Liu, Z.; Lu, T.; Ye, J.M.; Wang, G.S.; Dang, X.L.; Whithers, E.; Liu, Y. Antiferroelectrics for Energy Storage Applications: A Review. Adv. Mater. Technol. 2018, 3, 10800111. [Google Scholar] [CrossRef]
  33. Kania, A. Flux growth of AgTaxNb1−xO3 (ATN) solid-solutions single-crystals. J. Cryst. Growth 1989, 96, 703–704. [Google Scholar] [CrossRef]
  34. Grigas, J. Microwave Dielectric Spectroscopy of Ferroelectrics. Ferroelectrics 2009, 380, 37–41. [Google Scholar] [CrossRef]
  35. Macutkevic, J.; Banys, J.; Vysochanskii, Y. Broadband dielectric spectroscopy of CuInP2Se6 crystals. Phys. Stat. Sol. A 2009, 206, 167–172. [Google Scholar] [CrossRef] [Green Version]
  36. Macutkevic, J.; Banys, J.; Grigalaitis, R.; Vysochanskii, Y. Asymmetric phase diagram of mixed CuInP2(SxSe1-x)6 crystals. Phys. Rev. B 2008, 78, 064101. [Google Scholar] [CrossRef] [Green Version]
  37. Jonscher, A.K. The “universal” dielectric response. Nature 1977, 267, 673–679. [Google Scholar] [CrossRef]
  38. Dziaugys, A.; Banys, J.; Macutkevic, J.; Vysochanskii, Y.; Pritz, I.; Gurzan, M. Phase transitions in CuBiP2Se6 crystals. Phase Transit. 2011, 84, 147–156. [Google Scholar] [CrossRef]
  39. Raymond, M.V.; Smith, D.M. Defects and charge transport in perovskite ferroelectrics. J. Phys. Chem. Solid. 1996, 57, 1507. [Google Scholar] [CrossRef]
  40. Levstik, A.; Kutnjak, Z.; Filipic, C.; Pirc, R. Glassy freezing in relaxor ferroelectric lead magnesium niobate. Phys. Rev. B 1998, 57, 11204–11211. [Google Scholar] [CrossRef]
Figure 1. Complex dielectric permittivity as a function of temperature for ALN5 ceramics at various frequencies (500–100 K temperature region).
Crystals 12 00158 g001
Figure 2. Temperature dependence of the complex dielectric permittivity of ALN ceramics and AN crystal at 1 MHz.
Crystals 12 00158 g002
Figure 3. Frequency versus the dielectric permittivity maximum temperature for ALN ceramics (300–370 K temperature region).
Crystals 12 00158 g003
Figure 4. Electrical conductivity spectra for ALN5 ceramics at various temperatures.
Crystals 12 00158 g004
Figure 5. DC electrical conductivity as a function of temperature for AN crystals and ALNx ceramics for x ≤ 0.03 (a) and x ≥ 0.05 (b).
Crystals 12 00158 g005
Figure 6. Pre-exponential coefficient and activation energy at different lithium concentrations for ALN ceramics and AN crystals.
Crystals 12 00158 g006
Figure 7. Temperature dependence of the complex dielectric permittivity of ALN5 ceramics at various frequencies (150–25 K temperature region).
Crystals 12 00158 g007
Figure 8. Measurement frequency versus the maximum of dielectric loss temperature of ALN ceramics (50–80 K temperature region).
Crystals 12 00158 g008
Table 1. The Vogel–Fulcher fit parameters for the M1–M2 dielectric anomaly.
Ceramicsν0EA/k, KT0, K
Ag0.99Li0.01NbO310.7 GHz221313
Ag0.98Li0.02NbO3154 THz193313
Ag0.97Li0.03NbO32.1 THz299303
Ag0.95Li0.05NbO32.2 GHz240293
Publisher’s Note: MDPI stays neutral with regard to jurisdictional claims in published maps and institutional affiliations.

