Article

Effects of Hydrothermal Reaction Time on the Structure and Optical Properties of ZnO/Graphene Oxide Nanocomposites

by
Tran Van Khai
1,2,*,
Le Ngoc Long
1,2,
Nguyen Hoang Thien Khoi
1,2 and
Nguyen Hoc Thang
3,*
1
Faculty of Materials Technology, Ho Chi Minh City University of Technology (HCMUT), 268 Ly Thuong Kiet Street, District 10, Ho Chi Minh City 700000, Vietnam
2
Vietnam National University—Ho Chi Minh City (VNU-HCM), Linh Trung Ward, Thu Duc District, Ho Chi Minh City 700000, Vietnam
3
Department of Materials Technology, Faculty of Chemical Technology, Ho Chi Minh City University of Food Industry, 140 Le Trong Tan Street, Tan Phu District, Ho Chi Minh City 700000, Vietnam
*
Authors to whom correspondence should be addressed.
Crystals 2022, 12(12), 1825; https://doi.org/10.3390/cryst12121825
Submission received: 7 November 2022 / Revised: 9 December 2022 / Accepted: 12 December 2022 / Published: 14 December 2022
(This article belongs to the Topic Preparation and Antibacterial Properties of Metal Nanoparticles)
(This article belongs to the Section Inorganic Crystalline Materials)

Abstract

:
In this research, ZnO/GO nanocomposites were successfully synthesized by a simple hydrothermal method using graphene oxide (GO) and zinc acetate dihydrate (Zn(CH3COO)2.2H2O) as the reactants. The effect of the hydrothermal reaction time on the structure and optical property of the ZnO/GO was systematically investigated. The structure, morphology and chemical composition of the samples were measured by X-ray diffraction (XRD), field emission scanning electron microscopy (FESEM), transmission electron microscopy (TEM), energy-dispersive X-ray spectroscopy (EDS) and Raman and Fourier transform infrared (FTIR) spectroscopy, while the optical properties were measured using photoluminescence spectroscopy. The synthesized products consisted of large quantities of one-dimensional (1D) ZnO nanorods (NRs), which were dispersed uniformly on the GO surface. The XRD and Raman results reveal that the ZnO NRs in the fabricated samples had a hexagonal wurtzite structure with high crystalline quality. The FESEM and TEM images reveal that ZnO NRs with an average diameter in the range of ~85–270 nm and length in the range of ~0.3–6 μm were covered with GO sheets. Additionally, it was found that the crystallographic orientation of ZnO NRs was dependent not only on the hydrothermal reaction time but also on the presence of GO in the nanocomposites. However, the addition of GO did not affect the stoichiometric ratio and the crystal structure of ZnO NRs. The room-temperature PL results indicated that, compared to those of pure ZnO, the luminescence of the GO/ZnO nanocomposites was suppressed and shifted towards a higher wavelength (red shift), which was attributed to the incorporation of ZnO NRs within the GO matrix and the formation of a C-O-Zn chemical bond in the nanocomposites. The hydrothermal technique is considered one of the best routes due to its low cost, high growth rates, low-temperature synthesis, controllable crystallographic orientation, particle size, as well as morphology.

1. Introduction

Zinc oxide (ZnO) is a multifunctional semiconducting metal oxide and one of the most promising materials for emerging electronic and optoelectronic devices [1,2], mainly due to its wide direct band gap (3.37 eV) with large exciton binding energy (60 meV) and high electron mobility (100–200 cm2 V−1 s−1) [3,4]. Moreover, ZnO is an inexpensive material with low toxicity, chemical and thermal stability and high abundance, which can be fabricated into various nanostructures such as nanoneedles, nanowires, nanorods, nanobelts and nanoflowers [5,6], and therefore, it is one of the most attractive semiconductor materials for many optoelectronic applications in the ultra-violet (UV) region [7,8]. Among various nanostructures, one-dimensional (1D) ZnO nanorods (NRs) have gained considerable interest due to their high surface-to-volume ratio, tunable electron transport properties and fabrication technique, which is simple, low-cost and easily scalable [9]. Furthermore, ZnO NR is especially suitable for integration into devices such as gas sensors [10], field emission [11] and field effect transistors [12] due to the unique electron transport properties of its 1D nanostructures. Even though pure ZnO possesses interesting physical and chemical properties, there has been a growing interest in the combination of nanostructured ZnO with other nanomaterials to give it new properties that can be applied to a variety of new fields. Another material, graphene, a single layer of sp2 carbon atoms arranged in a two-dimensional (2D) hexagonal lattice, has attracted a great deal of interest due to its potential applications in various fields. Owing to its fascinating properties, including extremely high intrinsic carrier mobility (35,000 cm2 V−1 s−1) [13], excellent thermal conductivity (~5300 W m−1 K−1) [14], zero band gap, high theoretical specific surface area and superior mechanical strength, graphene has been considered promising for many applications, such as sensors, supercapacitors, catalysis, field emission and photovoltaic devices.
Recently, the combination of 1D ZnO nanostructures with 2D graphene-based species (graphene, graphene oxide (GO), reduced graphene oxide (rGO) and others) to synthesize novel materials has gained considerable interest, especially for 1D NRs and 2D GO nanosheets (containing various types of oxygen functional groups on its surface). Using ZnO, graphene or GO as raw materials to synthesize nanocomposites is becoming common with high effectivity, and it is easy to manipulate their morphology and band gap, as well as their surface defect states [15]. The graphene-modified materials may possess important properties that would be advantageous for their application in the fields of technology, such as supercapacitors [16], biosensors [17], photocatalysts [18], batteries [19] and others. In particular, many properties of GO-based materials, such as the mechanical, thermal, electrical and optical properties, can be tuned by modifying the surface chemistry or their components and/or the synthesis conditions [20,21]. For example, a high-performance device can readily be achieved by controlling the incorporation of rGO sheets within the ZnO matrix [22]. There have been a lot of investigations using ZnO-NRs with GO for the production of photonic and optoelectronic materials in recent years. Vessali et al. [23] used a chemical bath deposition method (CBD) to improve the layers of ZnO-NR/GO aiming to detect volatile organic compounds. In a study by Chung et al. [24], a nanocomposite based on ZnO-GO was used to fabricate polysulfone nanohybrid membranes with high performance and a good permeability rate. ZnO-NR/GO films were investigated for photocatalytic activity, which was improved by irradiating UV in the work of Rokhsat et al. [25]. Alamdari et al. [26] prepared a ZnO-GO nanomaterial with an economically effective method for the application of UV detection. Qi et al. [27] used ZnO-GO hybrids in lithium-ion batteries as an anode with high performance. Khorramshahi et al. [28] synthesized a nanocomposite of ZnO-GO-doped Mg, which can be used as a sensor material to realize acetic acid. Currently, various methods have been developed to synthesize ZnO/GO nanocomposites, such as ultrasonic spray pyrolysis [29], microwave-assisted reduction [30], metal organic vapor-phase epitaxy [31], solvothermal [32] and hydrothermal methods [33,34]. Among all these methods, the hydrothermal process is widely used due to its easy operation, low-temperature synthesis, potential for scale-up, effectivity and low-cost [35]. It also provides an opportunity to control the diameter, length and density of NRs by adjusting synthesis parameters, such as reaction time, temperature, pH and the type of material used in the synthesis [36,37,38,39]. However, to our knowledge, there have been no previous studies on the effects of hydrothermal reaction time on the crystallographic orientation of ZnO NRs in ZnO/GO nanocomposites. Therefore, the main purpose of this study is to investigate the reaction time on the crystallographic orientation, the change in aspect ratios (length/diameter ratios) and the optical properties of ZnO NRs in the nanocomposites. The present study uses Zn(CH3COO)2.2H2O and GO as the starting materials to synthesize the nanocomposites by a simple hydrothermal process. The synthesis process is carried out at a temperature of 120 °C with different reaction times at 4, 7, 10 and 13 h, respectively. The synthesized products are characterized for structural, surface morphological and optical properties using different techniques, such as X-ray diffraction (XRD), transmission electron microscopy (TEM), field emission scanning electron microscopy (FESEM), Raman and Fourier transform infrared (FTIR), as well as photoluminescence (PL) spectroscopy. This study aims to supply more information on the optical properties of nanocomposites, promoting the development of devices modified with GO layers.

2. Materials and Methods

2.1. Materials

The raw materials used in this work were purchased from Sigma Aldrich (St. Louis, MO, USA) and used without further treatment, including sulfuric acid (H2SO4, 98%), phosphoric acid (H3PO4, 85%), potassium permanganate (KMnO4, 98%), graphite flakes (~2–5 μm, 99.8%), hydrogen peroxide (H2O2, 30 wt.%), zinc acetate dihydrate (Zn(CH3COO)2.2H2O, 98%) and Sodium hydroxide (NaOH, 99%).

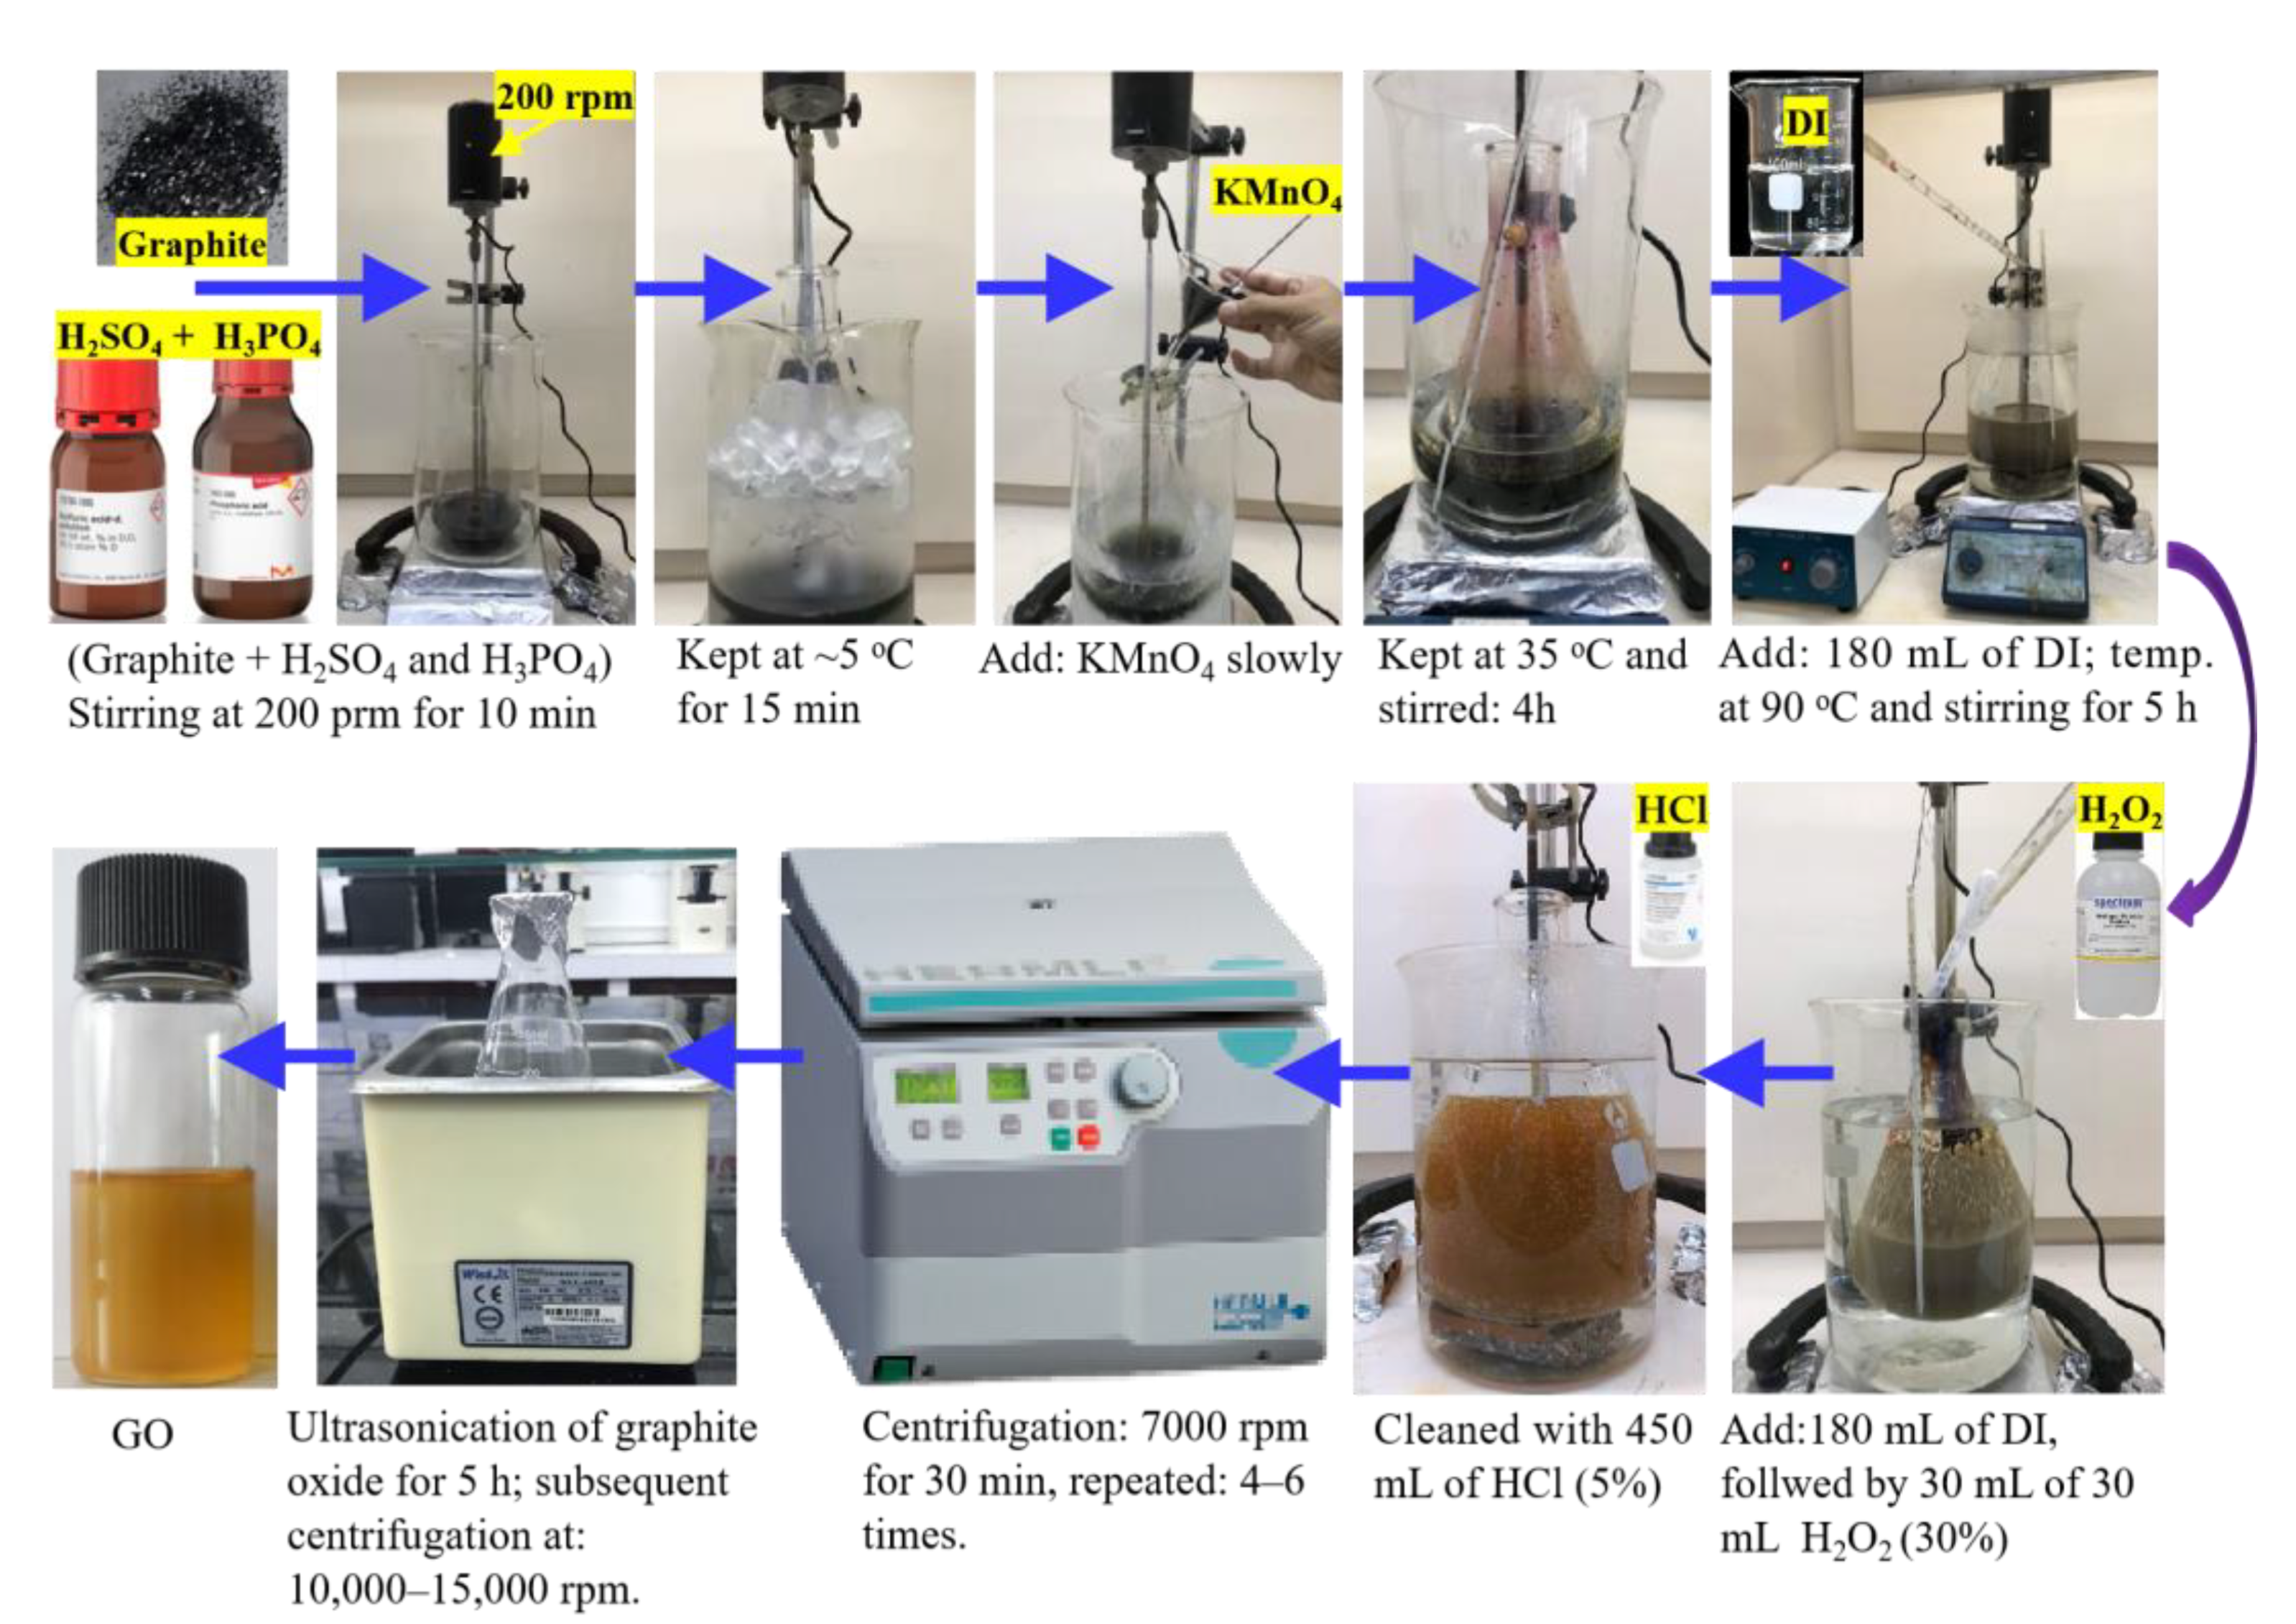
2.2. Preparation of Graphene Oxide (GO)

Figure 1 shows the experimental processes for GO preparation. GO nanosheets were synthesized from graphite flakes by using the modified Hummers’ method, as described in previous works [40,41]. In the typical reaction, 24 mL of H3PO4, 72 mL of H2SO4 and 2 gr of graphite flakes were stirred in an ice bath and kept at ~5 °C for 15 min, and afterward, 24 gr of KMnO4 was slowly added to the previous mixture with continuous stirring. The resultant mixture was transferred to a water bath (kept at ~35 °C) and stirred for 4 h, producing a thick paste. Next, 180 mL of deionized (DI) water was gradually dropped into the resulting paste to dilute the mixture, and then, the obtained solution was stirred for 5 h while the temperature was increased to ~90 °C. Subsequently, 180 mL of DI water was added, followed by the slow addition of 30 mL of H2O2 (30%), and a solution with bright-yellow color was created, showing a high degree of oxidation. The oxidized graphite was collected by using centrifugation at 7000 rpm for 30 min, then cleaned with 450 mL of HCl (5%) solution and cleaned with DI water several times until pH ~ 6 ÷ 7. Then, the resultant product was redispersed in 500 mL of DI water with mild sonication for 5 h, resulting in a solution of exfoliated GO nanosheets. In order to obtain ultra-thin GO sheets, a centrifugation at 10,000 rpm (for 3 ÷ 5 min) was first used to eliminate thick multilayer GO sheets until all the visible particles were eliminated. Finally, water-soluble byproduct was removed by centrifuging the collected supernatant at a high speed of 15,000 rpm for 45 min.

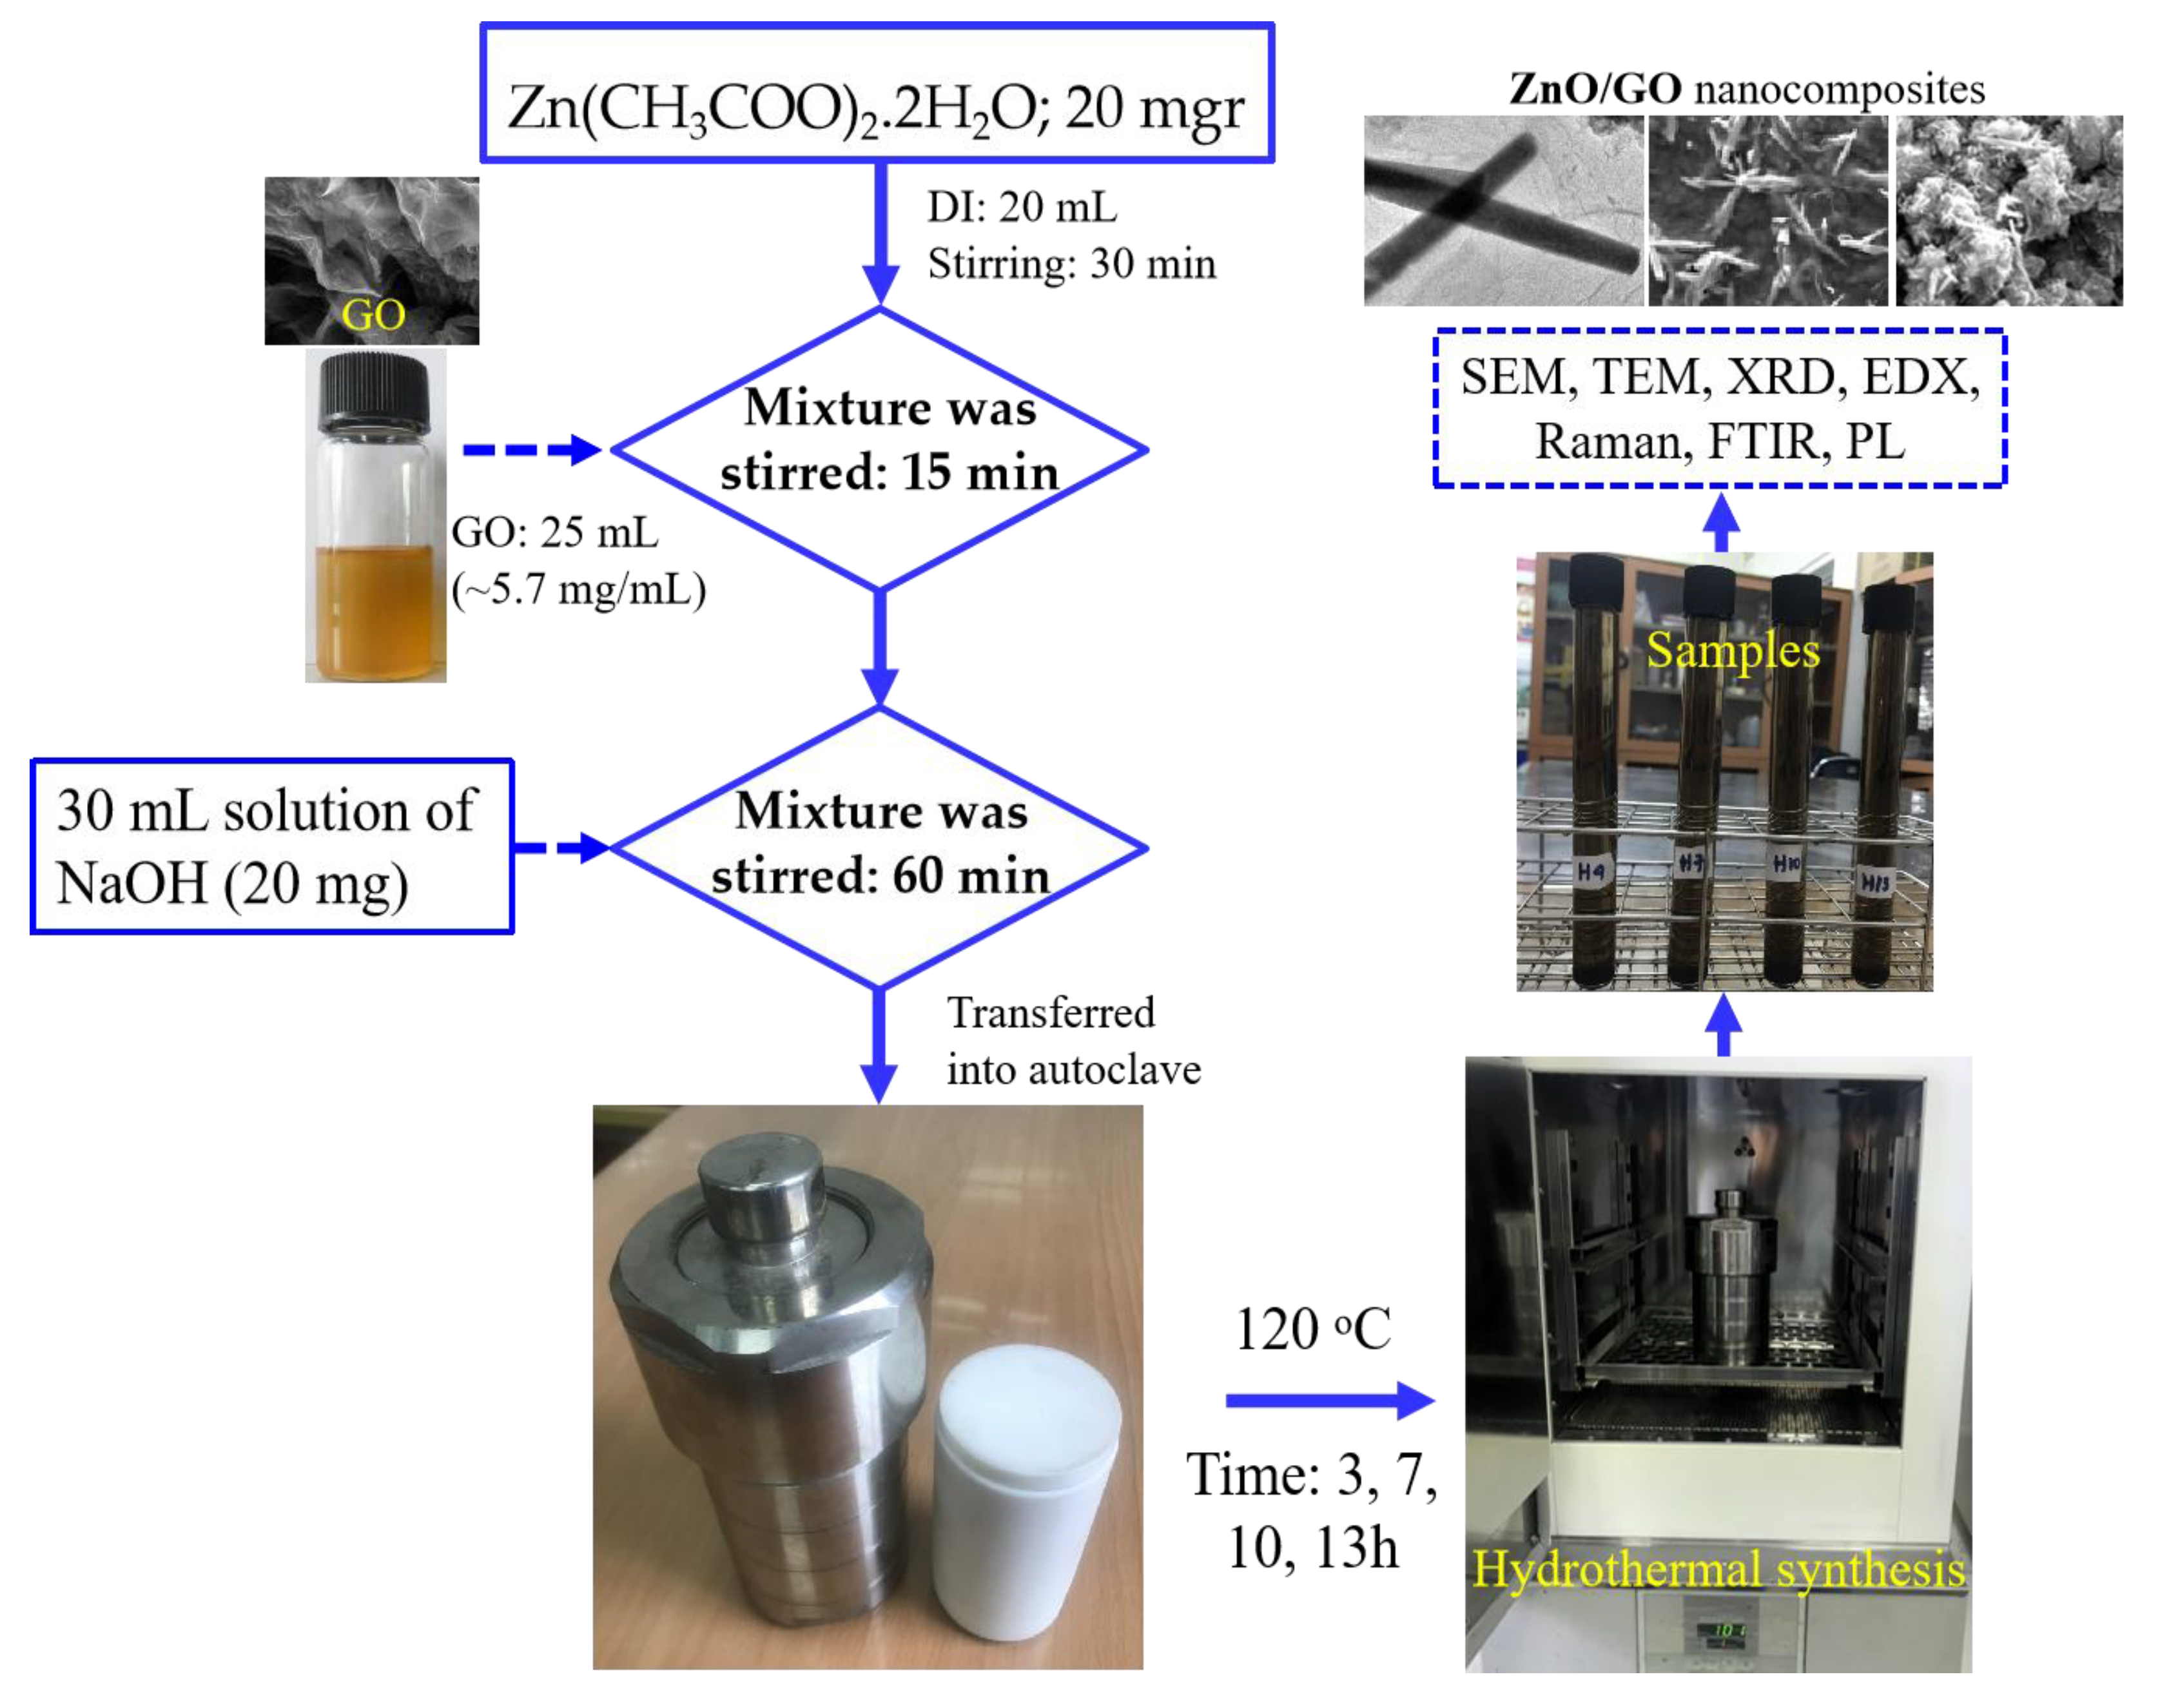
2.3. Fabrication of ZnO/GO Nanocomposites

In this study, ZnO/GO nanocomposite were prepared by a simple hydrothermal routine. In this experiment, an amount of ~20 mgr of Zn(CH3COO)2.2H2O was dissolved in 30 mL of DI water; then, the solution was added to 25 mL of GO (~5.7 mg/mL) and was stirred for ~15 min to form a homogeneous suspension. Next, this mixture was added to a volume of 30 mL solution of NaOH (20 mg) and was stirred for ~60 min. Then, the resulting mixture was transferred into a 200 mL Teflon-lined stainless-steel autoclave and sealed. Subsequently, the autoclave was placed in an oven and kept at 120 °C for 4, 7, 10 and 13 h and were marked as H4, H7, H10 and H14, respectively. The samples were cooled naturally in an oven, creating black ZnO/GO nanocomposites. These black precipitates were separated from the solution by centrifugation. Finally, the obtained material was dried at 80 °C and stored for 24 h before analysis. For comparison purposes, a pristine ZnO was also synthesized under the same conditions with H10 (i.e., at 120 °C, 10 h) except for the addition of GO. The fabrication of the ZnO/GO nanocomposites was carried out with the steps shown in Figure 2.

2.4. Material Characterization

The crystal structure and phase identification of the synthesized samples were performed by X-ray diffraction using a Bruker D8 Advanced diffractometer (Rigaku, Tokyo, Japan) with CuKα radiation at λ = 1.54178 Å, operating at 40 kV voltage and 200 mA current. The morphologies and dimensions of the ZnO/GO nanocomposites were obtained on a JEOL JEM-2010 transmission electron microscope (JEOL Ltd., Tokyo, Japan) with an accelerating voltage of 200 kV. Field emission scanning electron microscopy (FESEM, Hitachi S-4800, Japan) was used to study the morphology of the ZnO/GO nanocomposite samples. Raman spectra were measured by Micro Raman Horiba XploRA One instrument using a green Argon laser (λ = 532 nm) as the excitation source. The chemical bonding configuration of the samples was studied by Fourier transform infrared spectroscopy (FTIR, Shimadzu, model 8400S, using the KBr disk technique) from 400 to 4000 cm−1. The photoluminescence (PL) measurements were carried out with a laser Raman spectrometer (iHR320; HORIBA Jobin Yvon Co. Ltd.; Kyoto, Japan) at room temperature using a He:Cd laser with a wavelength of 325 nm at a power density of 42 W/cm2.

3. Results and Discussion

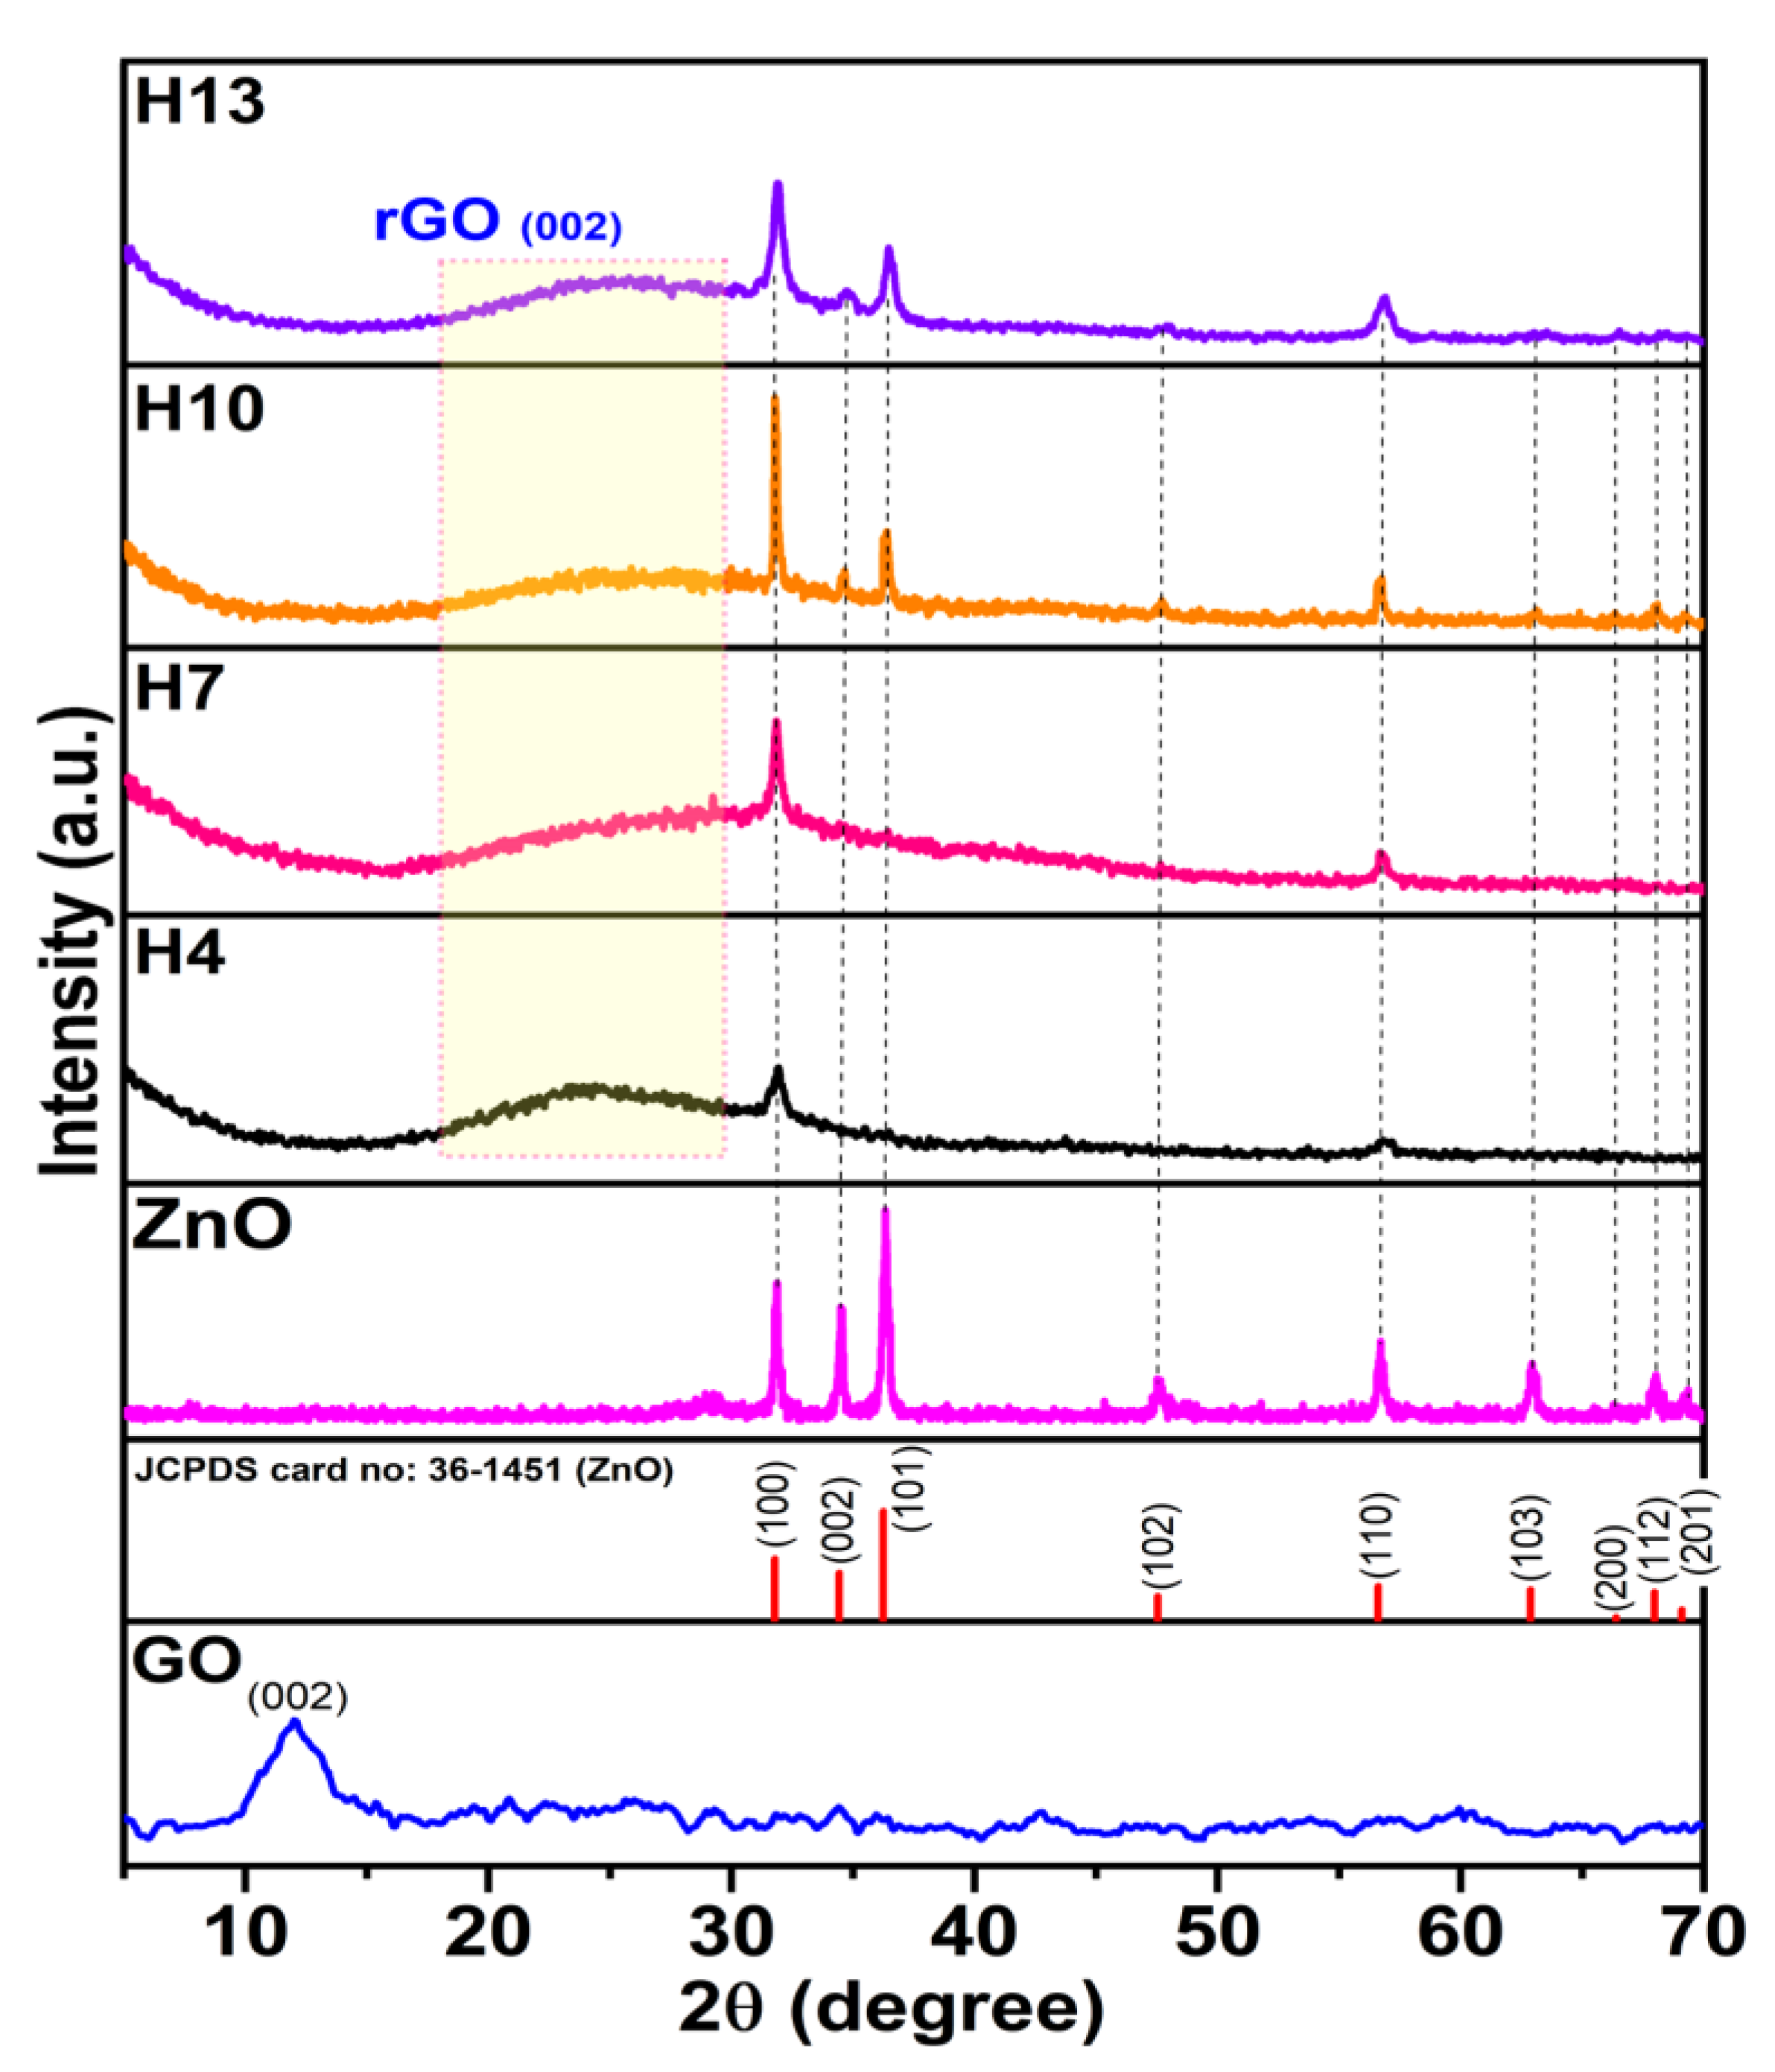
3.1. Structural Characterization of ZnO/GO Nanocomposites

Figure 3 indicates the XRD patterns of GO, pure ZnO, the ZnO/GO nanocomposite samples along with JCPDS data. In the XRD pattern of GO prepared via the improved Hummers’ method, a broad peak located at 2θ = ~12° corresponds to the (002) planes of GO. The d-interlayer spacing of the GO is calculated from Bragg’s law, and it is estimated to be ~0.883 nm; this value is much larger compared to that of the starting graphite flakes (~0.336 nm), suggesting that the graphite flakes are oxidized and exfoliated into few-layered GO sheets. Early research suggested that the increase in d-spacing is primarily due to the introduction of functional groups containing oxygen on each layer, which increased the distance between layers. The XRD pattern of bare ZnO showed characteristic diffraction peaks at 2θ = 31.8, 34.5, 36.3, 47.6, 56.7, 62.9, 66,4, 68.0 and 69.4, which correspond well with crystalline lattice planes of (100), (002), (101), (102), (110), (103), (200), (112) and (201), respectively, for the hexagonal wurtzite structure of ZnO (JCPDS card number: 36-1451), belonging to the C6v4 (P63mc) space group [42,43]. In the case of the ZnO/GO nanocomposites, their XRD patterns exhibited a similar pattern to that of ZnO alone. However, from Figure 3, it can be seen that the intensities of different diffraction peaks are different. This shows that the growth rate is different in different directions. Early research reported that the higher the growth rate, the faster the disappearance of the plane, resulting in a decrease in intensity [44,45]. The degree of orientation, which is a parameter used to describe the growth anisotropy, was expressed in terms of texture coefficients (TChkl) [46]:
TC hkl = I hkl I 0 hkl 1 N i N I hkl I 0 hkl  
where TChkl is the texture coefficient of the plane (hkl), I is the measured intensity of each (hkl) peak, I0 is the theoretical relative intensity provided by the JCPDS-ICDD card, and N is the number of reflections considered. In our case, N = 3, as we selected the three most intense reflections, i.e., the (100), (002) and (101) peaks. The calculated TC values of the three major diffraction planes of ZnO is presented in Table 1. From Table 1, it can be seen that the TC100 values for the ZnO/GO nanocomposite (~1.54–2.40) are larger than that of pure ZnO (~1.02). This observation suggests that degree of orientation of the (100) plane of ZnO in the nanocomposite is higher than that of pure ZnO. Thus, the presence of GO could alter the polar faces of ZnO during the hydrothermal synthesis. In this case, the polar faces of ZnO in the nanocomposite are higher compared to that of pure ZnO. Additionally, it should be noticed that the intensity of the (100) diffraction peak is significantly higher than the intensities of the other diffraction peaks, which reveals that ZnO NRs have a strong (100) preferential growth orientation. A similar behavior was already observed by Boukhoubza et al. [47]. On the other hand, it was found that the texture coefficient of the (100) crystallographic orientation increased from ~2.40 to ~2.92 as the hydrothermal time increased from 4 to 7 h, then dropped slightly as the hydrothermal time extended to 10 h. This result suggests that the hydrothermal time also significantly affected the crystallographic orientation of ZnO in the nanocomposite. In the case of the ZnO/GO nanocomposites, the characteristic diffraction (002) peak of GO shifted towards a higher angle (2θ ~23–28°), suggesting that GO is converted to reduced-GO during hydrothermal treatment. Furthermore, the intensity of the diffraction (002) peak of GO in all the composites was dramatically reduced as compared to GO only; this implies that the insertion of ZnO into the GO layers might cause damage to the regular sheets of GO and/or is due to the successful exfoliation of GO sheets during the synthesis of nanocomposites. No peaks related to other phases were detected in the spectra, which confirms that the synthesized products are of high purity. The XRD results showed that the synthesized ZnO/GO nanocomposite was composed of GO nanosheets and pure ZnO NRs. Debye–Scherrer Equation (2) was used to determine the average crystallite size (D) of ZnO for the diffraction planes [48]:
D = K λ β   cos θ
in which K is a dimensionless shape factor and has a value of ~0.9; λ is the X-ray wavelength (~1.54178 Å); β is the full width at half maximum height (FWHM) expressed in radians; and θ is the Bragg angle.
On the basis of the full width at half maximum of the diffraction plane, the crystalline size of ZnO NRs in nanocomposites was calculated, and the result is presented in Table 1.

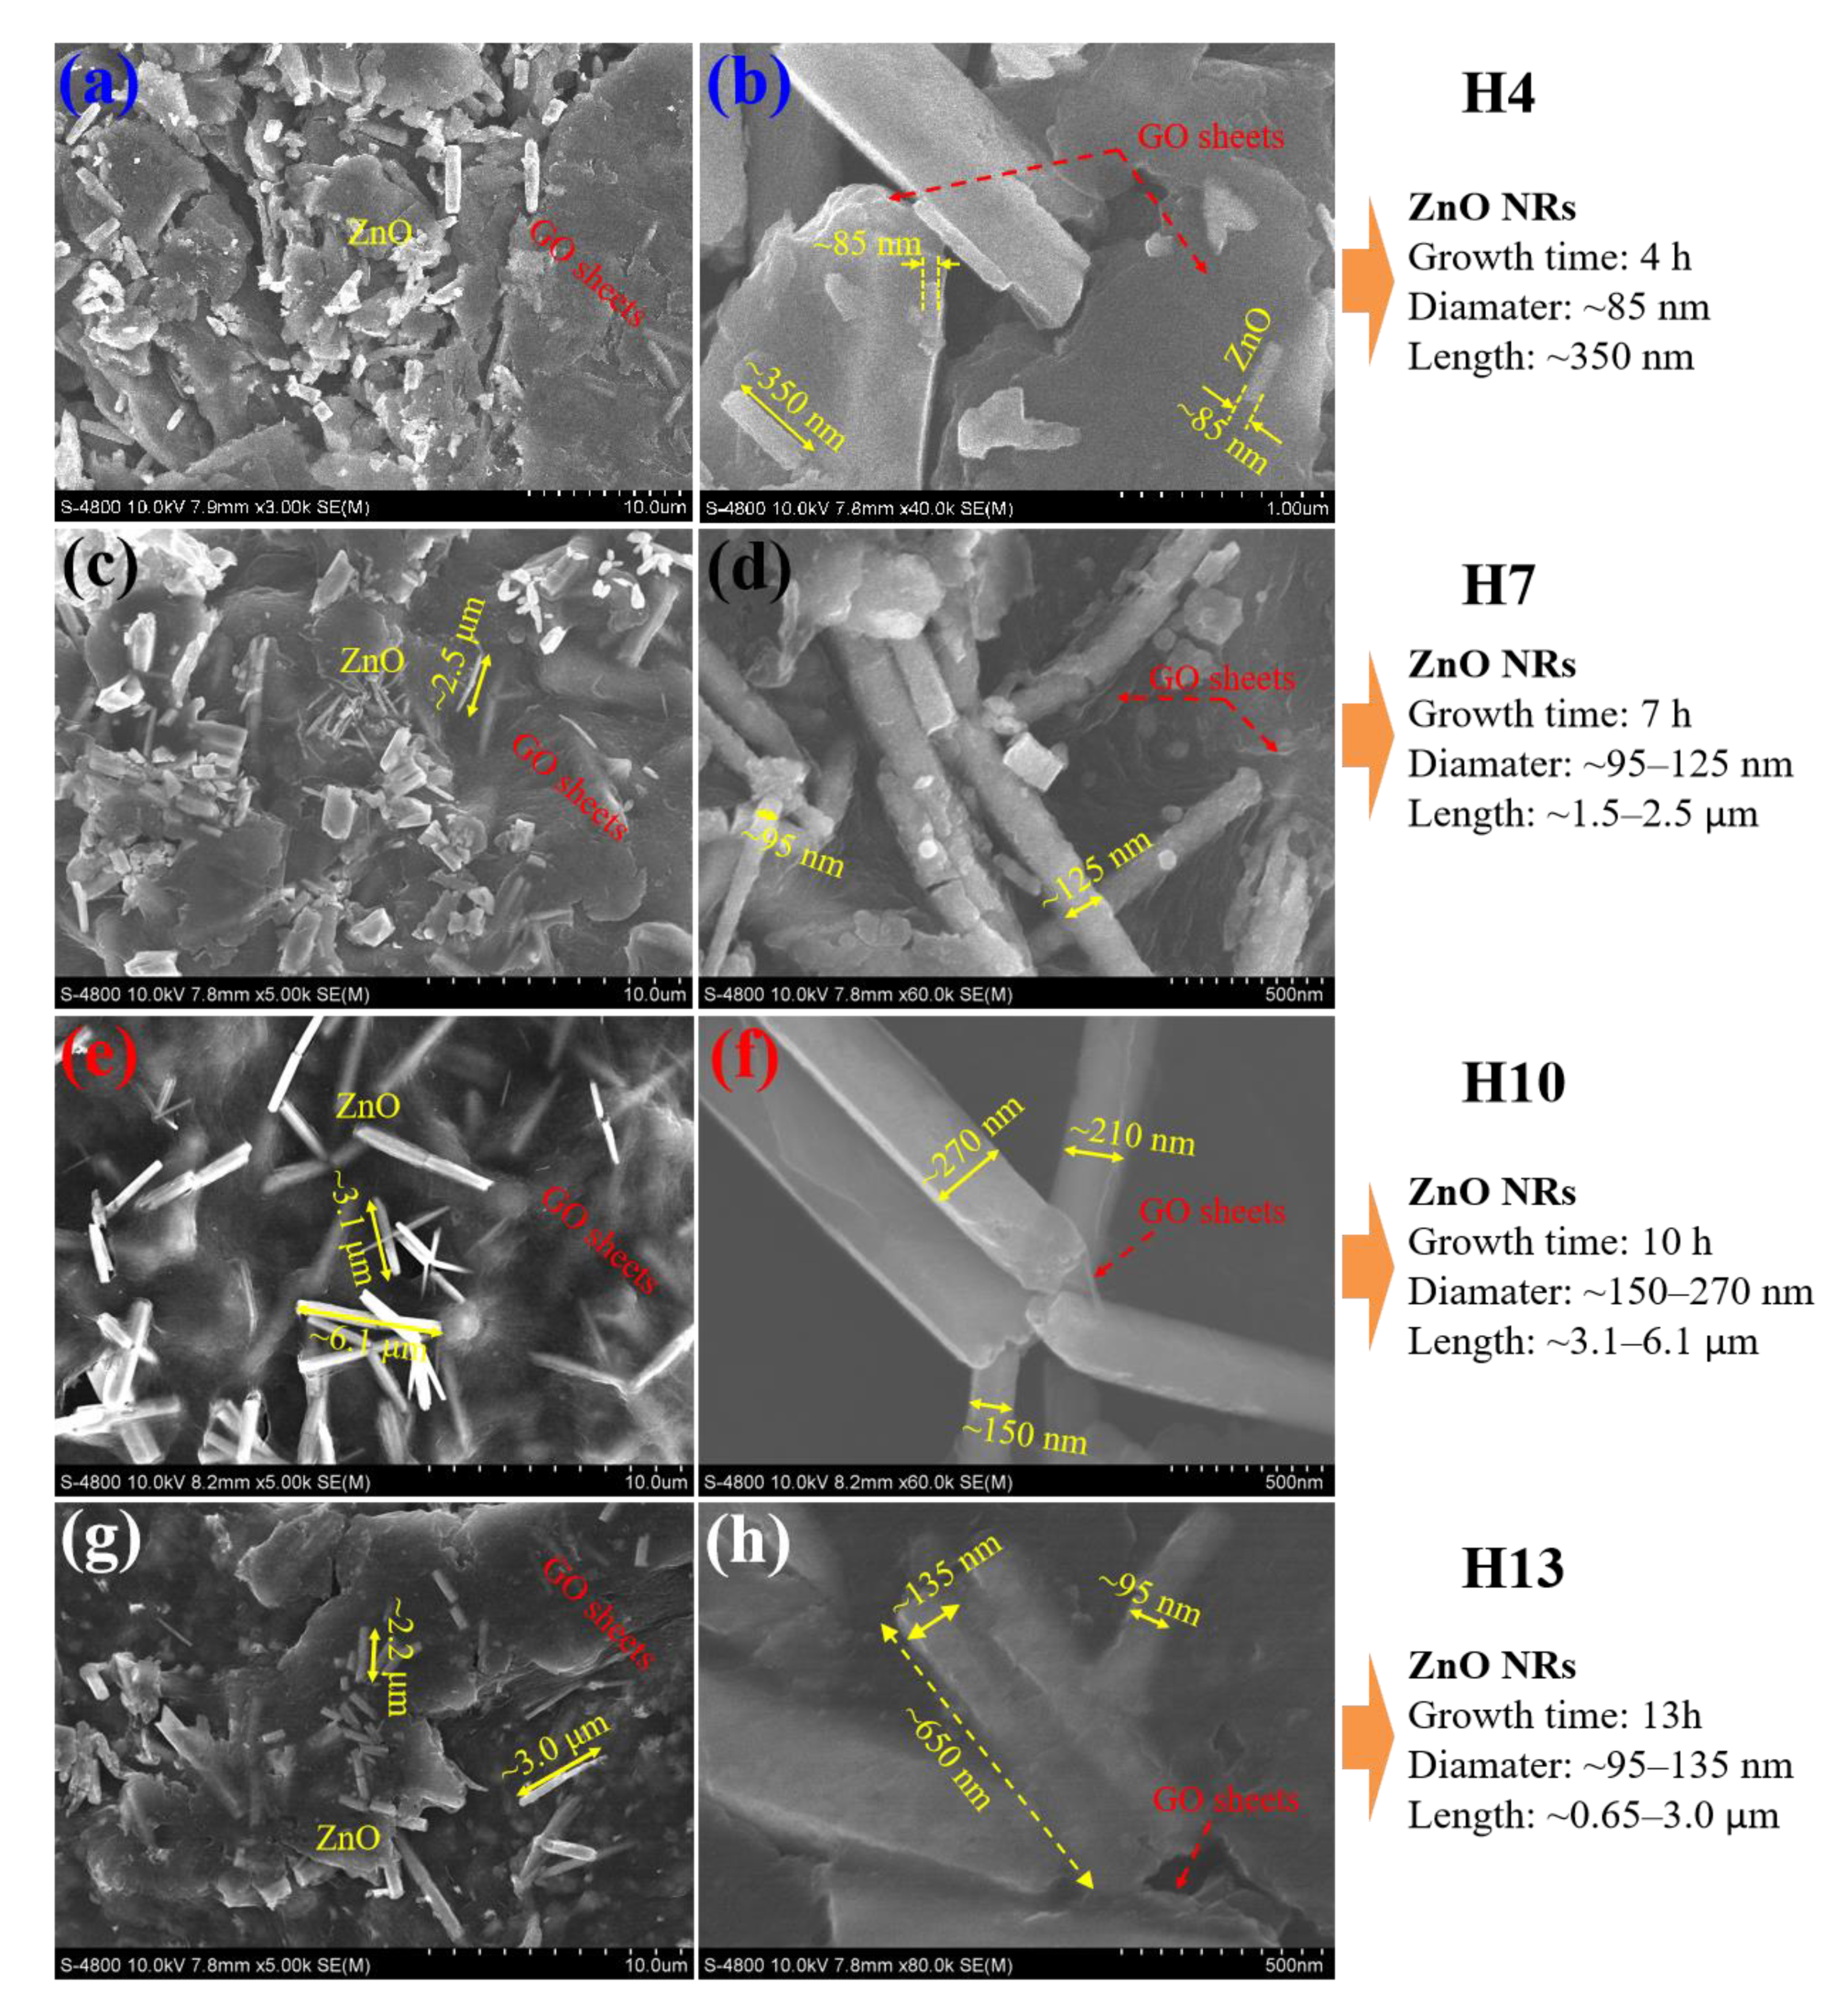
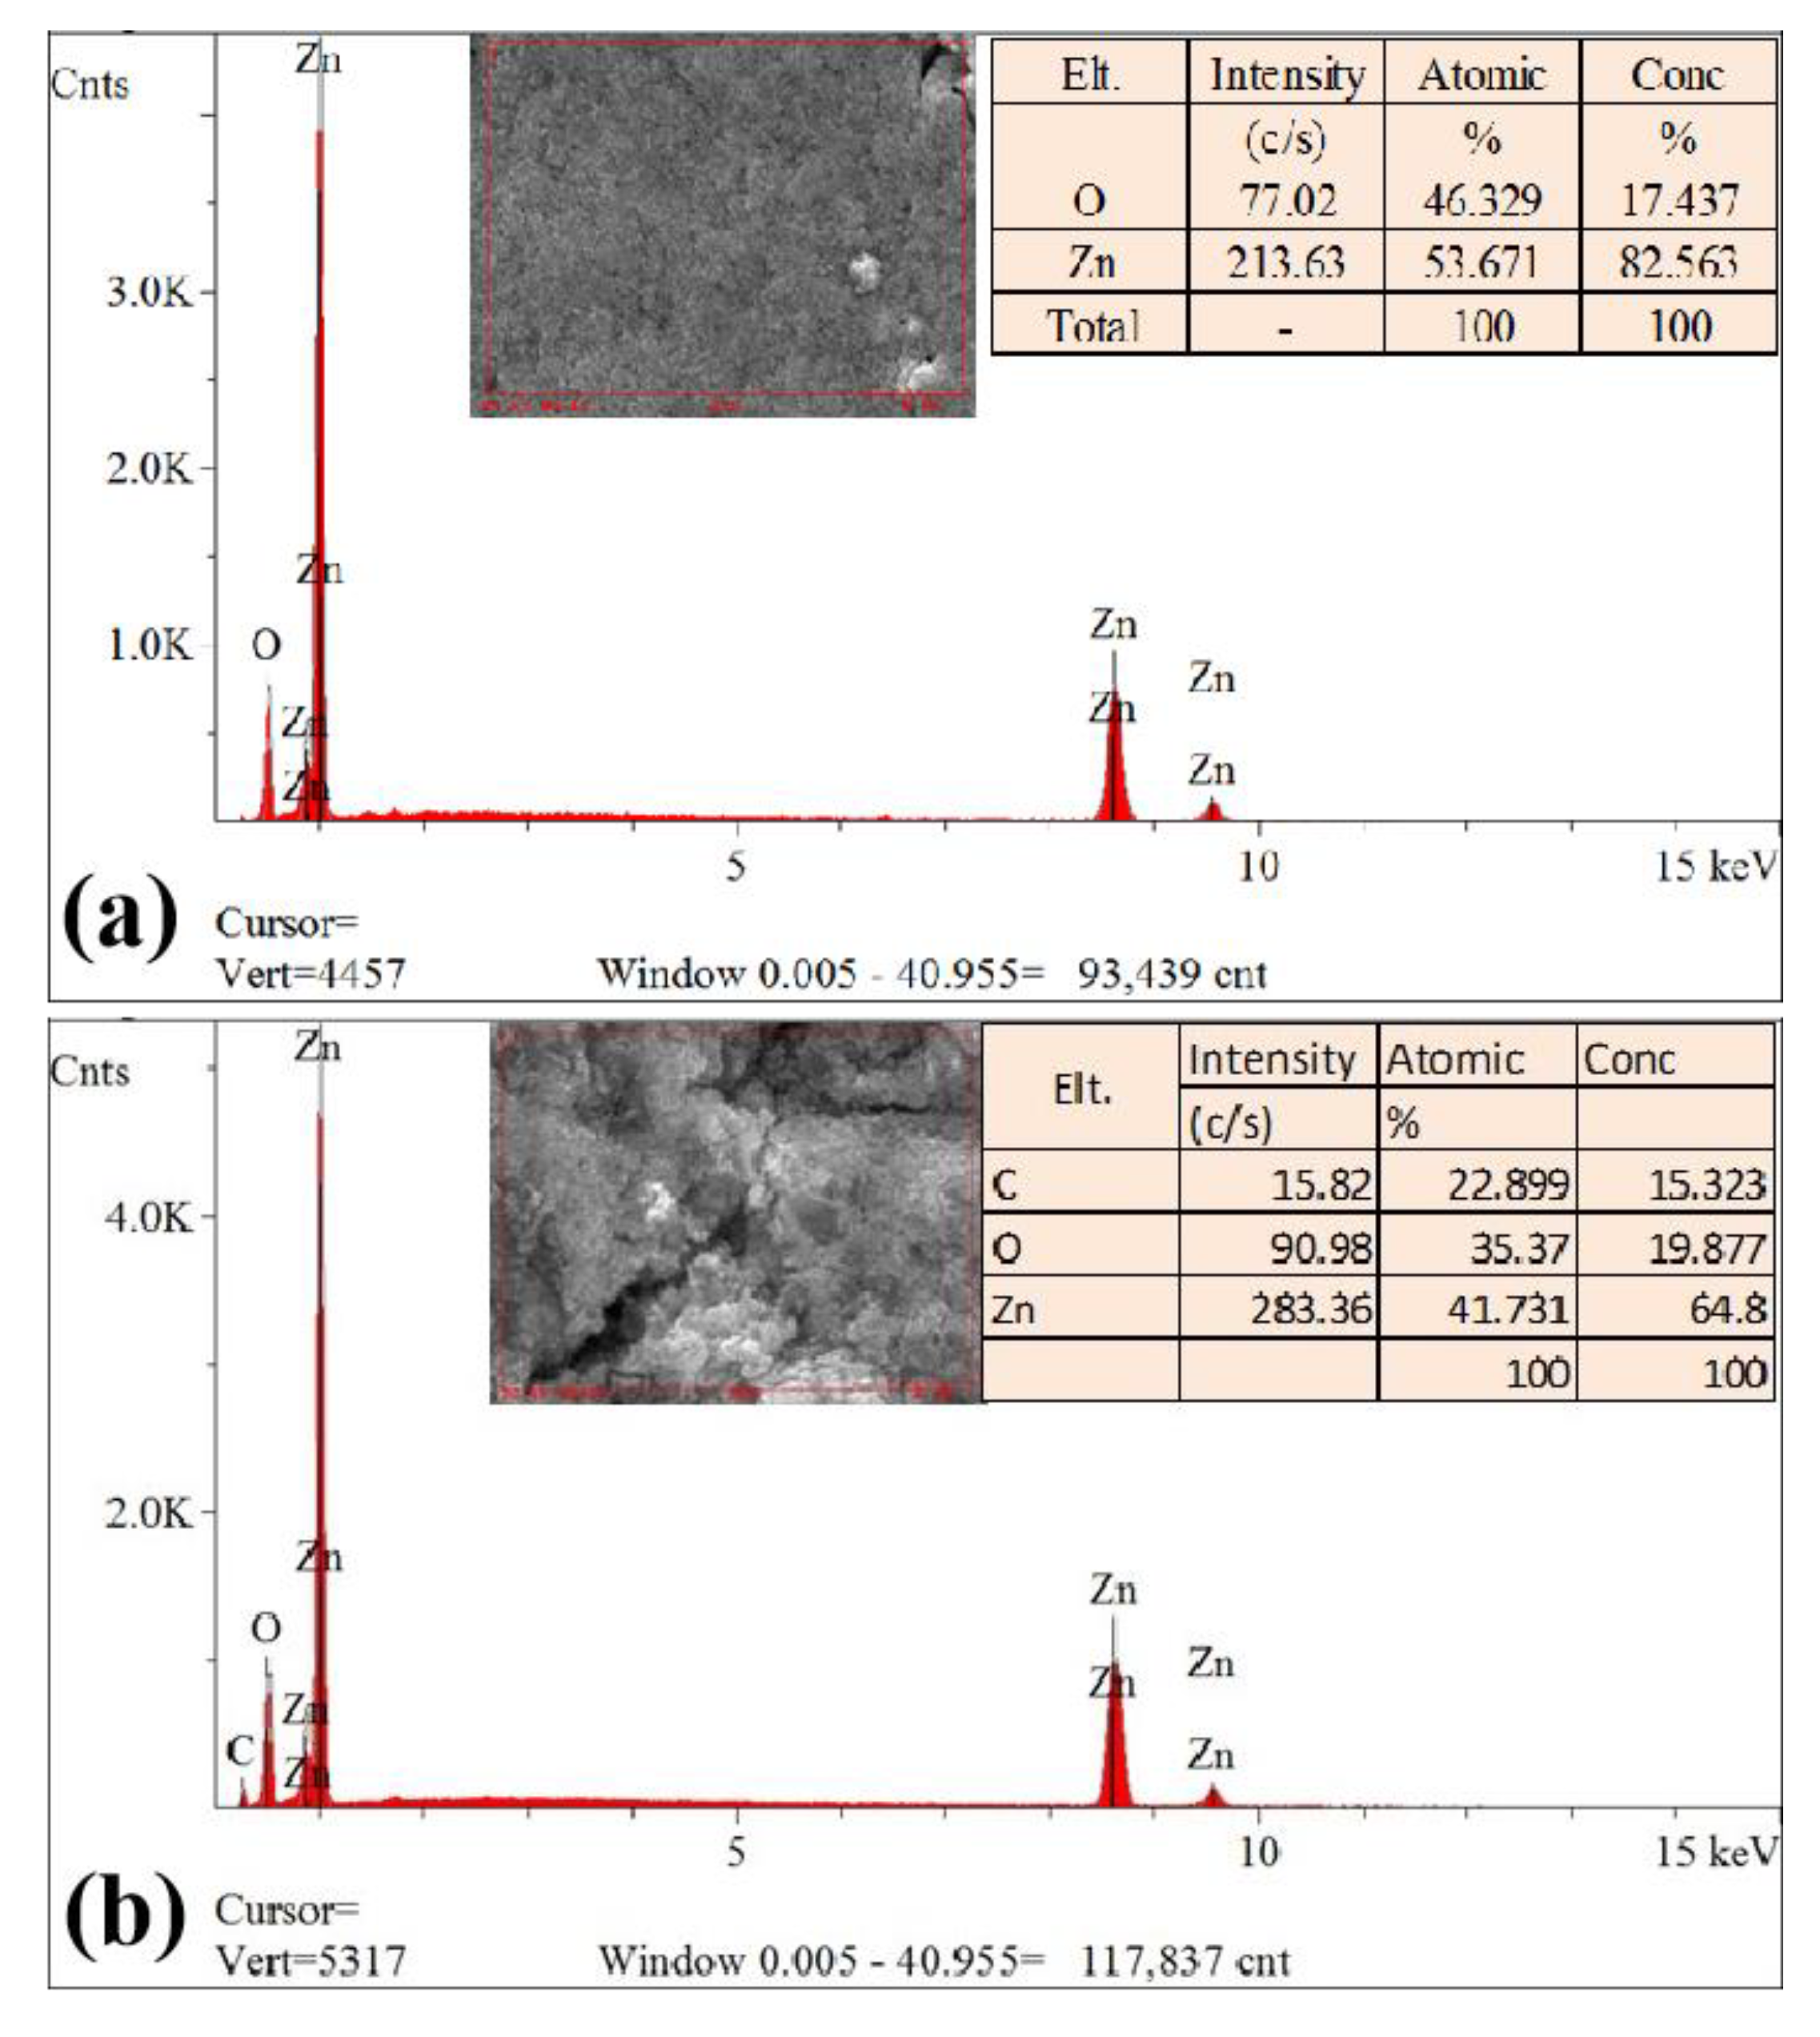
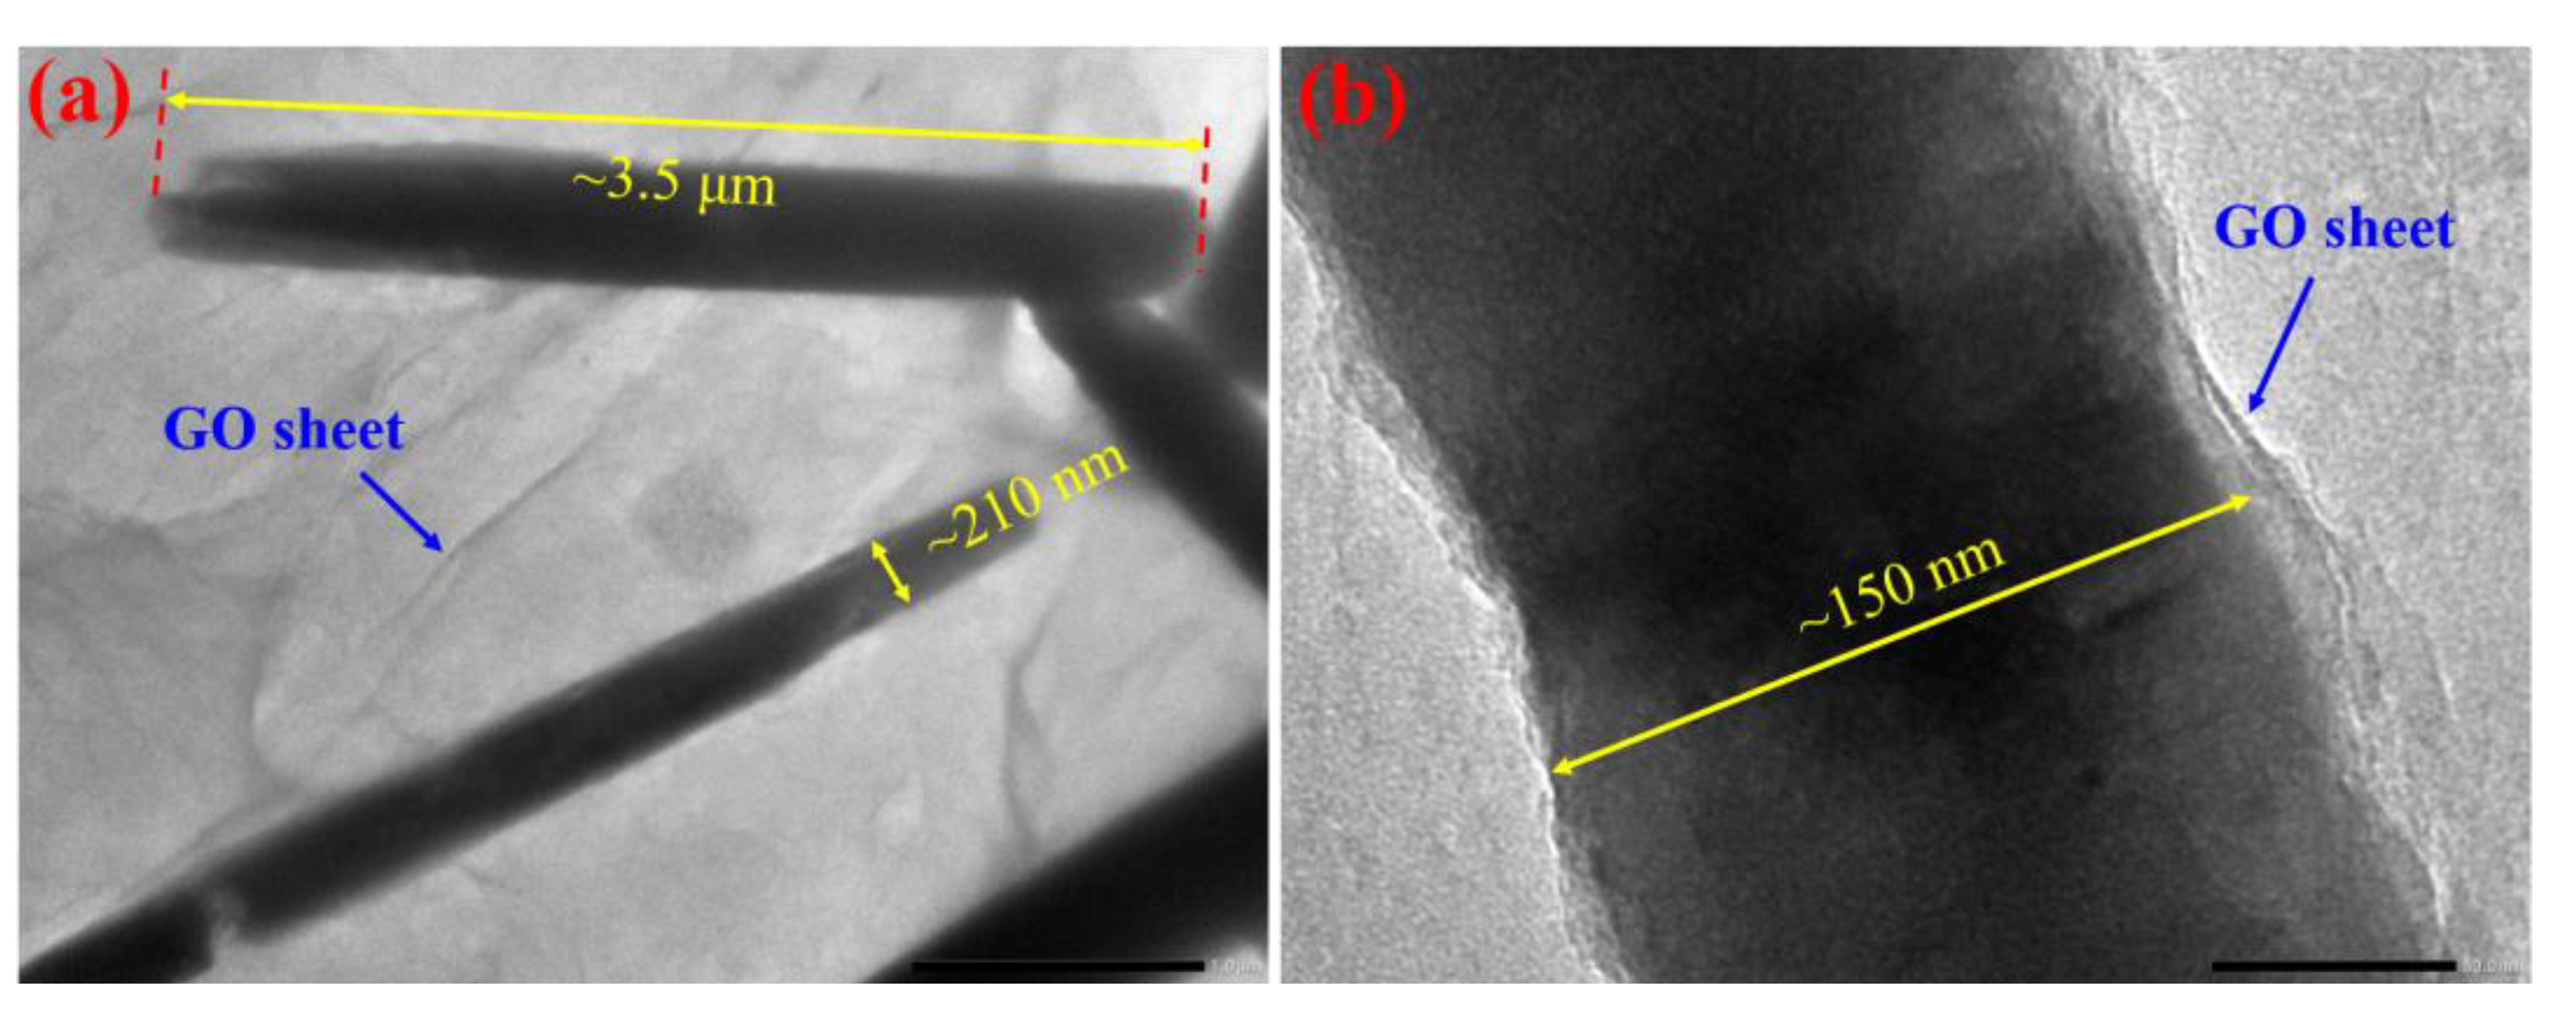
3.2. Morphology, Microstructure and Chemical Composition of ZnO/GO Nanocomposites

The surface morphology of the ZnO/GO nanocomposites obtained at different growth times (4, 7, 10 and 13 h) were examined by using FESEM, and the results are shown in Figure 4a–g. It can be clearly observed that all of the nanocomposites are composed of ZnO and GO components; simultaneously, ZnO with the morphology of NRs are anchored on the surface of the GO sheets and/or between the GO layers. During the hydrothermal process, the ZnO NRs could be formed via self-assembly and were randomly distributed on the GO sheets with a relatively high surface density. With the progress of time, the morphology of ZnO NRs was quite similar but a change in the aspect ratios (i.e., length/diameter of NRs) was observed. The average aspect ratio of short ZnO NRs in the sample H4 was found to be ~4.1 with a diameter of ~85 nm and a length of ~1.41 µm. In this sample, the surface of ZnO NRs was rough with an uneven size without being covered by GO. Simultaneously, the functional groups were reduced from the GO surfaces, and its films formed a thick array. As the synthesis time was increased to 7 h (H7), a significant increase in the aspect ratio ~15.1–20.0 was achieved. The average diameter and length of the NRs, in this case, were ~95–125 nm and ~1.5–2.5 µm, respectively. In this sample, the ZnO NRs surface was rough with uneven size and partially covered by GO; meanwhile, GO was partially covered and prevented among the bondings of the membranes by ZnO crystals. Whereas after a hydrothermal time of 10 h (H10), the aspect ratio slightly increased to ~20.6–22.2 (diameter ~150–270 nm and length ~3.1–6.1 μm). In this case, the ZnO NRs surface was smooth, uniform, and completely covered by GO. From Figure 4e–f, it is evident that ZnO NRs are fully covered by the semi-transparent few-layered GO sheets, which affirms the formation of a sandwich-like nanocomposite structure by integrating the ZnO NRs between the interlayer of GO sheets, which can prevent the agglomeration of ZnO NRs and avoid the stacking of GO sheets effectively, resulting in the protection of their high surface area. Furthermore, the NRs obtained with 13 h of growth (H13) became shorter and thinner with an aspect ratio of ~6.8–22.2 (length ~0.65–3.0 μm and diameter ~95–135 nm). This result is quite compatible with the trend of crystalline size change obtained from XRD (Table 1). From the above results, it was confirmed that the ZnO/GO nanocomposites were successfully synthesized by a facile hydrothermal method with controllable ZnO NRs size by changing the hydrothermal times.
EDX spectra were used to study the elemental composition of the synthesized pure ZnO and ZnO/GO nanocomposite samples. Figure 5a,b show the EDX spectra of the prepared ZnO and ZnO/GO nanocomposite (H10), respectively. As shown in Figure 5a, it can be clearly seen that pure ZnO contained only Zn and O elements. The calculated elemental composition is shown in the insert of Figure 5a. The EDX results revealed that the atomic ratio of Zn to O in the ZnO sample was about ~1:0.86, which was quite consistent with stoichiometric ratio of ZnO. In the case of the ZnO/GO nanocomposite, in addition to Zn and O elemental peaks, the presence of C was also detected, as shown in Figure 5b. In this sample, the atomic ratio of Zn to O was calculated to be about ~1:0.85; this value is the same as that of the ZnO sample, indicating that the presence of GO sheets did not influence the chemical composition and the structural integrity of the ZnO phase.
The surface morphology of the ZnO/GO nanocomposites (H10) were further examined by using TEM, and the results are shown in Figure 6. As seen in Figure 6, ZnO exhibited a uniform structure of rod-like morphology with an average diameter of ~150–210 nm and a length of ~3.5–6.1 μm. The ZnO NRs were enwrapped by GO with a typical morphology of wrinkled texture; as a result, GO and ZnO NRs made excellent interfacial contact, which is advantageous for the charge transfer from the ZnO NRs to the GO nanosheets.

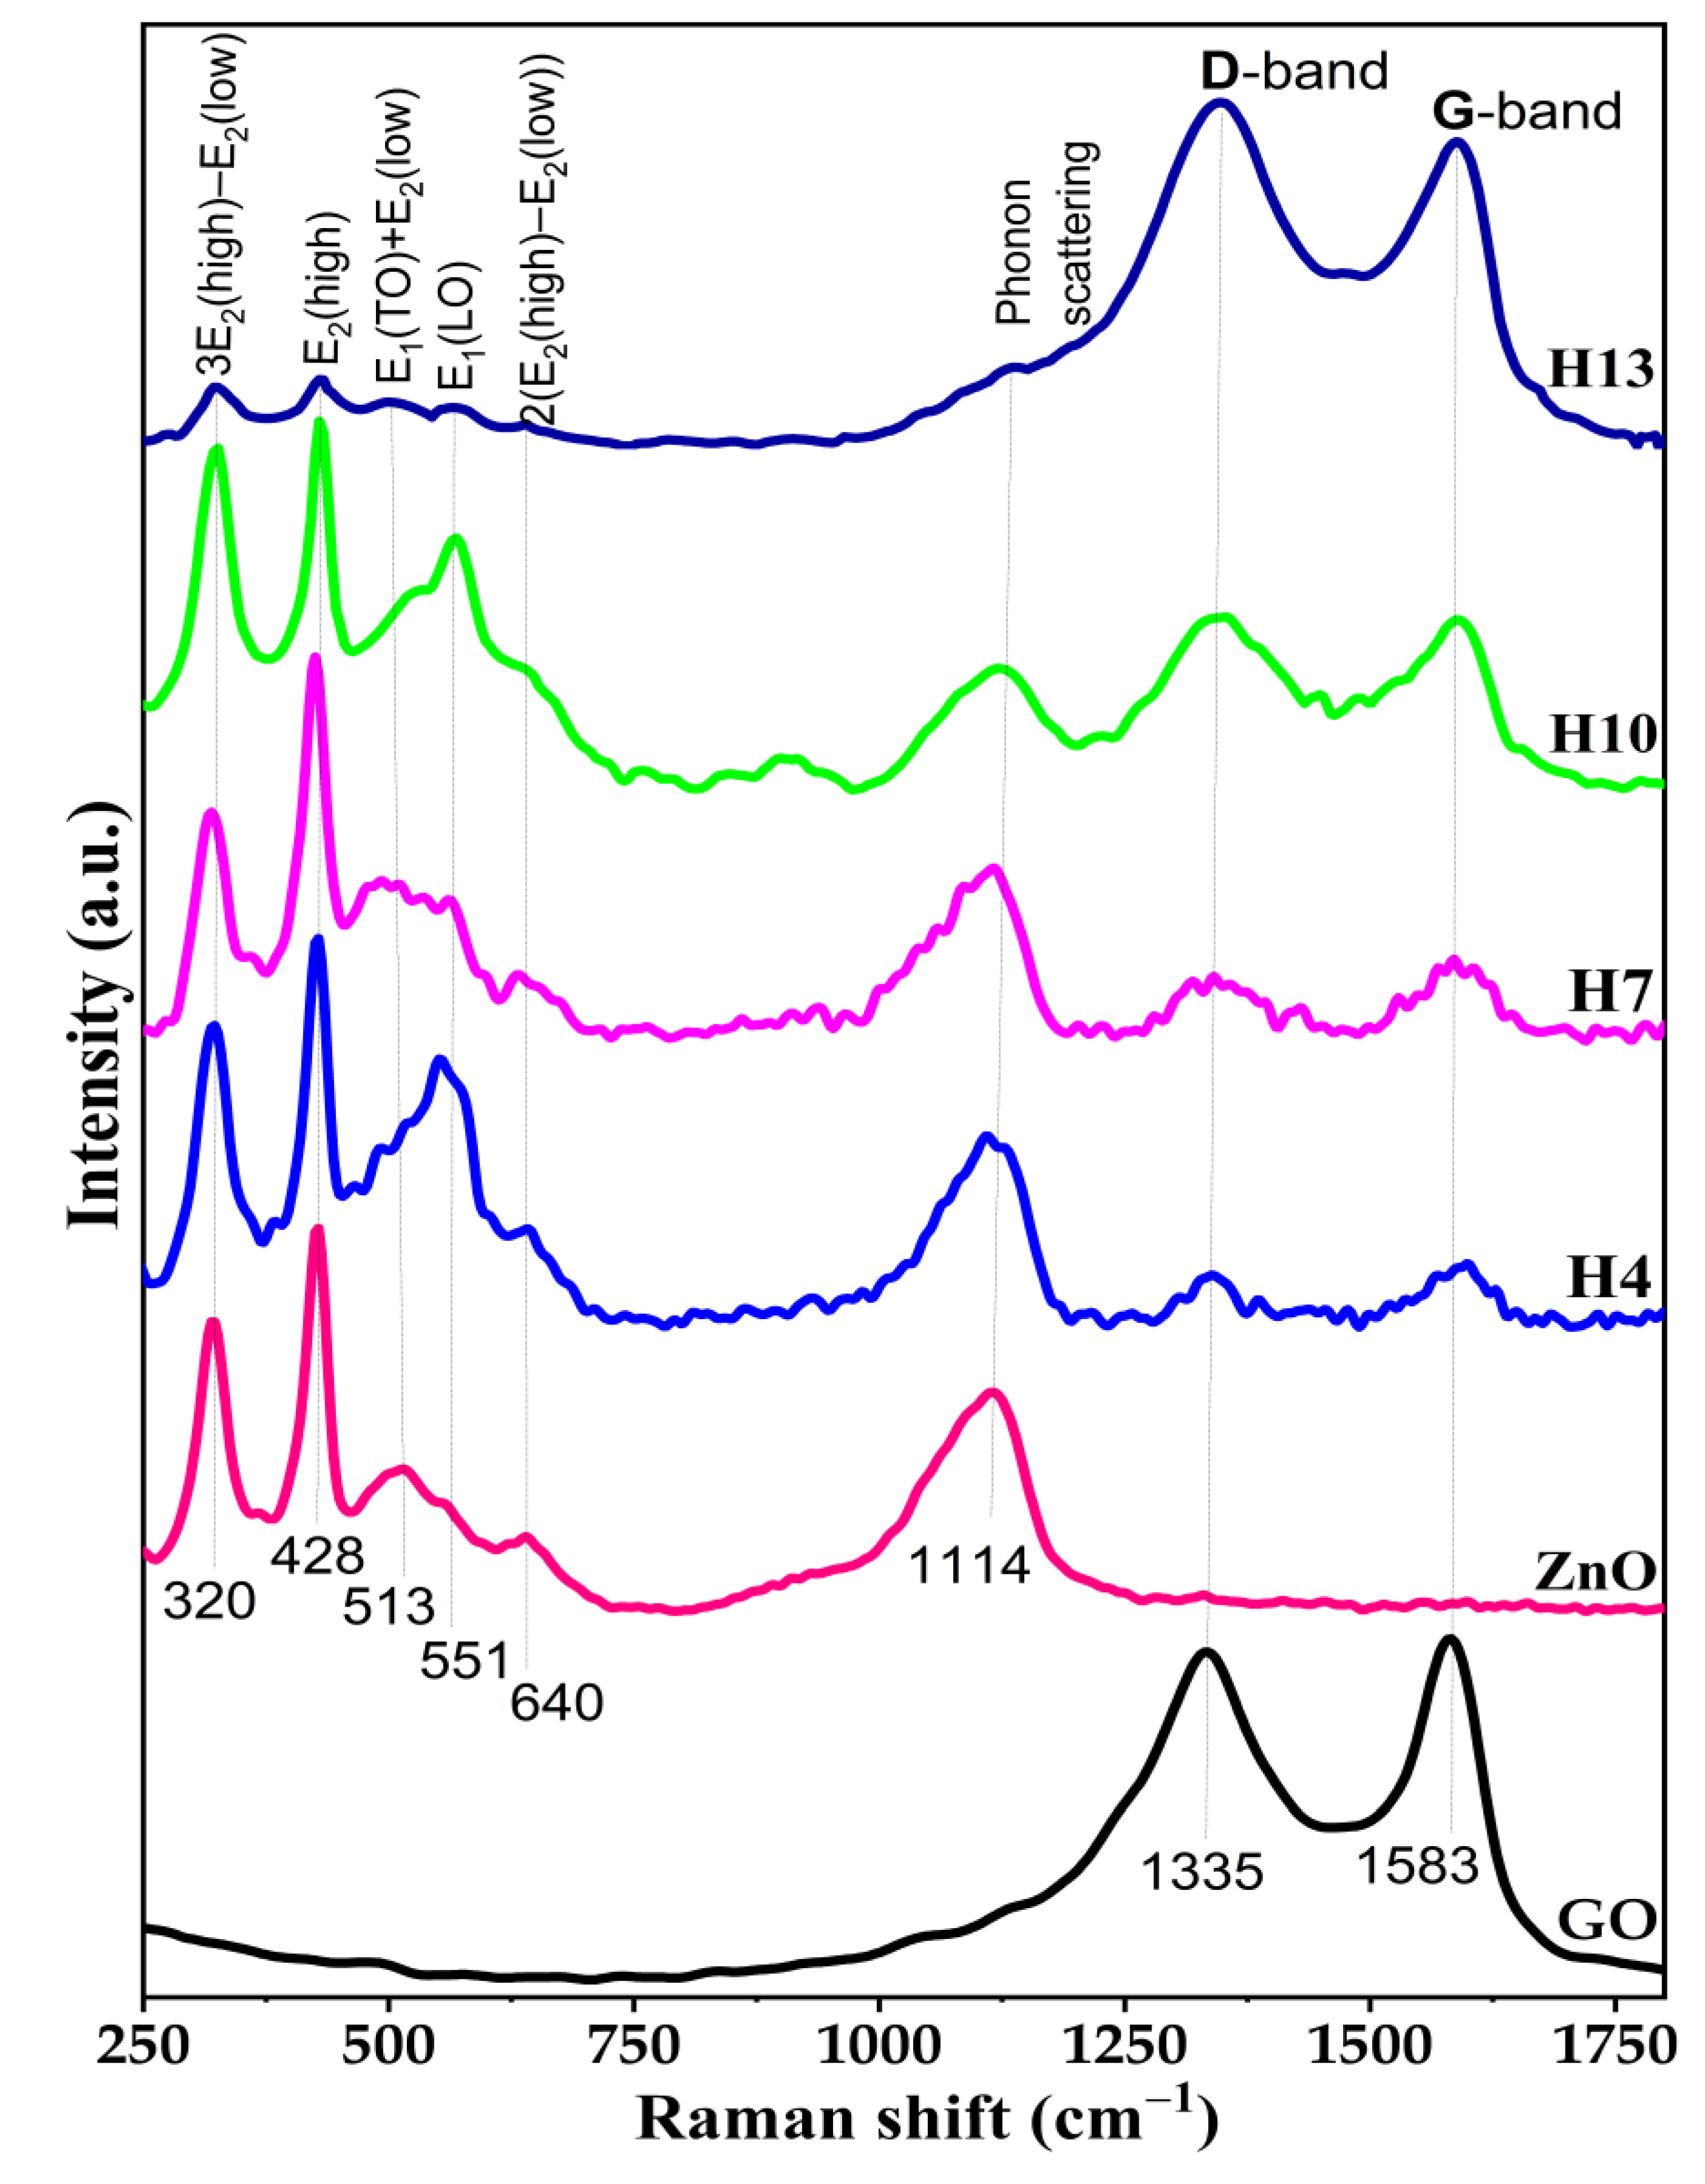
3.3. Raman Analysis of GO, ZnO and Synthesized ZnO/GO Nanocomposites

Figure 7 shows the Raman spectra of GO, bare ZnO and ZnO/GO nanocomposites prepared for 4 (H4), 7 (H7), 10 (H10) and 13 h (H13). The Raman spectrum of GO displays two prominent peaks approximately at 1335 cm−1 and 1583 cm−1 that were assigned to the D- and G-bands of carbon-based materials, respectively [49]. The D-band is related to the edge defects and structural imperfections in the carbon basal plane, whereas the G-band is related to the characteristic of sp2-hybridized carbon atoms (C=C stretching) due to the first-order scattering of the E2g phonon modes [49]. For the bare ZnO sample, the Raman spectrum indicates vibrational modes at 320, 428, 513, 551, 640 and 1114 cm−1. The multi-phonon scattering modes are depicted at 320, 513 and 640 cm−1, which can be attributed to 3E2(high)–E2(low), E1(TO)+E2(low) and 2(E2(high)–E2(low)), respectively. The E2(high)–E2(low) mode can only be observed when the ZnO is a single crystal. The E2(high) mode at 428 cm−1 is a characteristic peak of wurtzite hexagonal ZnO, proving that the grown NRs are wurtzite hexagonal ZnO [50]. The presence of peak 551 cm−1 is ascribed to the vibration of the E1(LO) mode, which is associated with the impurities and formation of defects, including oxygen vacancies, zinc interstitial, etc. [51]. Meanwhile, the last peak at 1114 cm−1 of the ZnO spectrum represents the phonon scattering phenomenon [52].
For the ZnO/GO nanocomposite samples, as seen in Figure 7, all the four Raman spectra show similar spectral characteristics with eight Raman-active regions: the first six regions for ZnO NRs and the other two regions related to the existence of GO, which demonstrates the successful formation of nanocomposites. The only difference was that the peak intensity varied with the increase of hydrothermal time. It can be seen that the intensity of the characteristic peak of ZnO decreased, while the peak intensity of GO (D- and G- bands) increased when the hydrothermal time increased from 4 to 13 h. This phenomenon could be explained by the fact that the generation of new ZnO seed crystals under the extended hydrothermal time are small, which are unable to connect to the large ZnO NRs covered by GO membranes [53]. Moreover, because of the slower growth rate of these self-generated ZnO seeds compared to the dissolution rate of NaOH, the seeds would interact with the remaining NaOH to form a stable complex without further developing [53]. Furthermore, compared to GO, the D- and G-bands in the nanocomposite were shifted to higher wavenumbers, 1350 and 1589 cm−1, respectively; this observation is probably due to the fact that the honeycomb structure of graphene was partially damaged during the hydrothermal treatment process and/or due to hybridization of ZnO with GO.

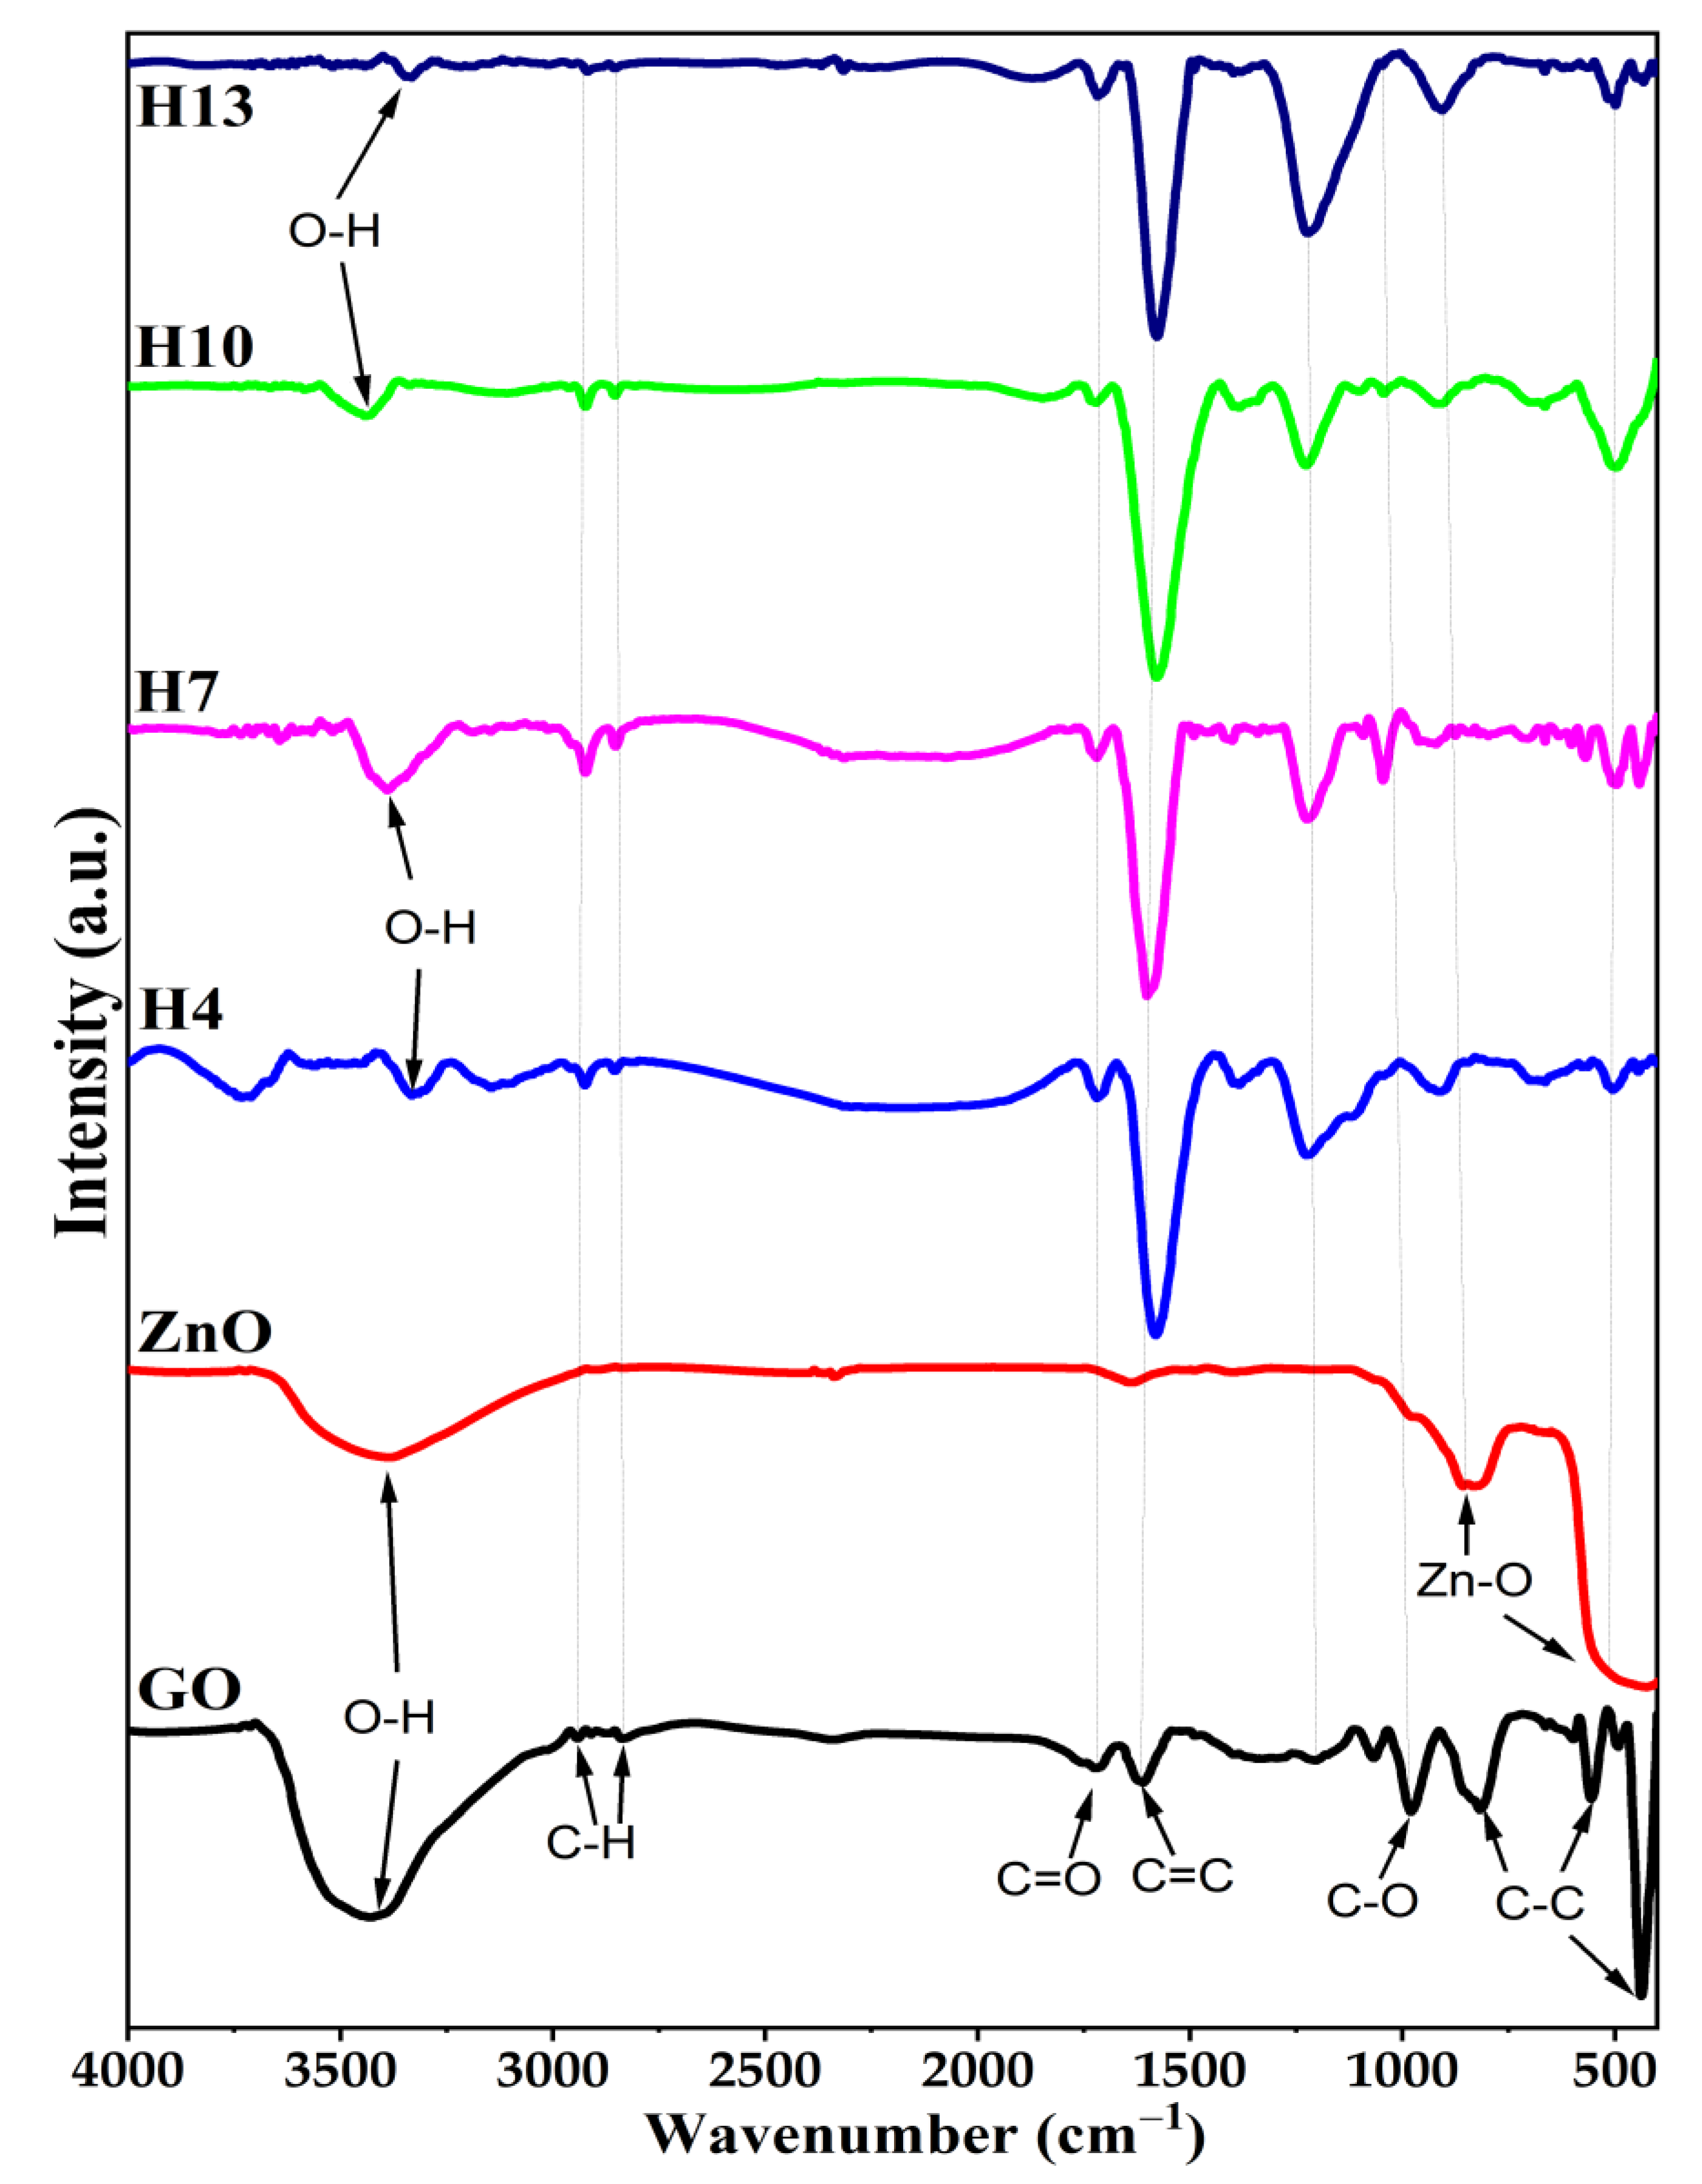
3.4. Feature Chemical Functional Groups Using Fourier Transformation Infrared Spectra (FTIR)

Figure 8 indicates the FTIR spectra of GO, ZnO and as-prepared ZnO/GO nanocomposites. In the FTIR spectrum of GO, a strong and wide band located at 3350–3500 cm−1 could be assigned to O-H group with the stretching vibration [54]. The peaks at wavenumbers of 2942 cm−1 and 2836 cm−1 are characteristic of the C-H stretch. The bands observed at 1726 cm−1, 1615 cm−1 and 1044 cm−1 are ascribed to the stretching vibration of carboxyl group C=O, C=C and C-O, respectively [55]. Additionally, the band located at 1222 cm−1 can be ascribed to C-OH stretching vibration [56]. In the ZnO spectrum, the absorption peak at 3421 cm−1 corresponds to the hydroxyl group. The peaks around 473–530 cm−1 and 815–860 cm−1 are related to the main Zn-O stretching vibration [57].
In the case of ZnO/GO nanocomposites, as depicted in Figure 8, all the four FTIR spectra possess identical peaks with GO and ZnO, thus, confirming the presence of both GO and ZnO in the nanocomposites. When increasing the hydrothermal reaction time, the functional groups of GO in the nanocomposite samples decrease considerably, especially the 3350 cm−1 peak of the hydroxyl group due to the hydrogen atom linked to the OH- of the NaOH solution. The band of O-H occurs significantly in the spectra of structures H7 and H10, and its intensity is low for the spectra of structures H4 and H13. There is something similar to the Zn-O band in the spectrum of the H10 structure. At the same time, the band similar to C=C dominates in the spectra of all ZnO/GO structures, but it is slightly shifted. The band at about 1250 cm−1 has no analogues in the ZnO and GO spectra. In addition, it is strange that the C=C band in the spectra of ZnO/GO structures is much more intense than in the spectra of GO. On the other hand, the 1627 cm−1 peak ascribed to the C=C bond increases as the hydrothermal time changes. At the same time, the peaks at 473 cm−1 and 530 cm−1 typical for Zn-O bonds increase gradually when the hydrothermal time is from 4 to 10 h and then decrease when the time is up to 13 h. This can be explained by the formation of ZnO crystals, which rapidly grow during a 4 to 10 h hydrothermal reaction time; however, increasing the hydrothermal time to 13 h would impede the growth of ZnO crystals due to the dissolution of the crystals in the remaining NaOH [53,58]. The result is consistent with the XRD and Raman analysis.

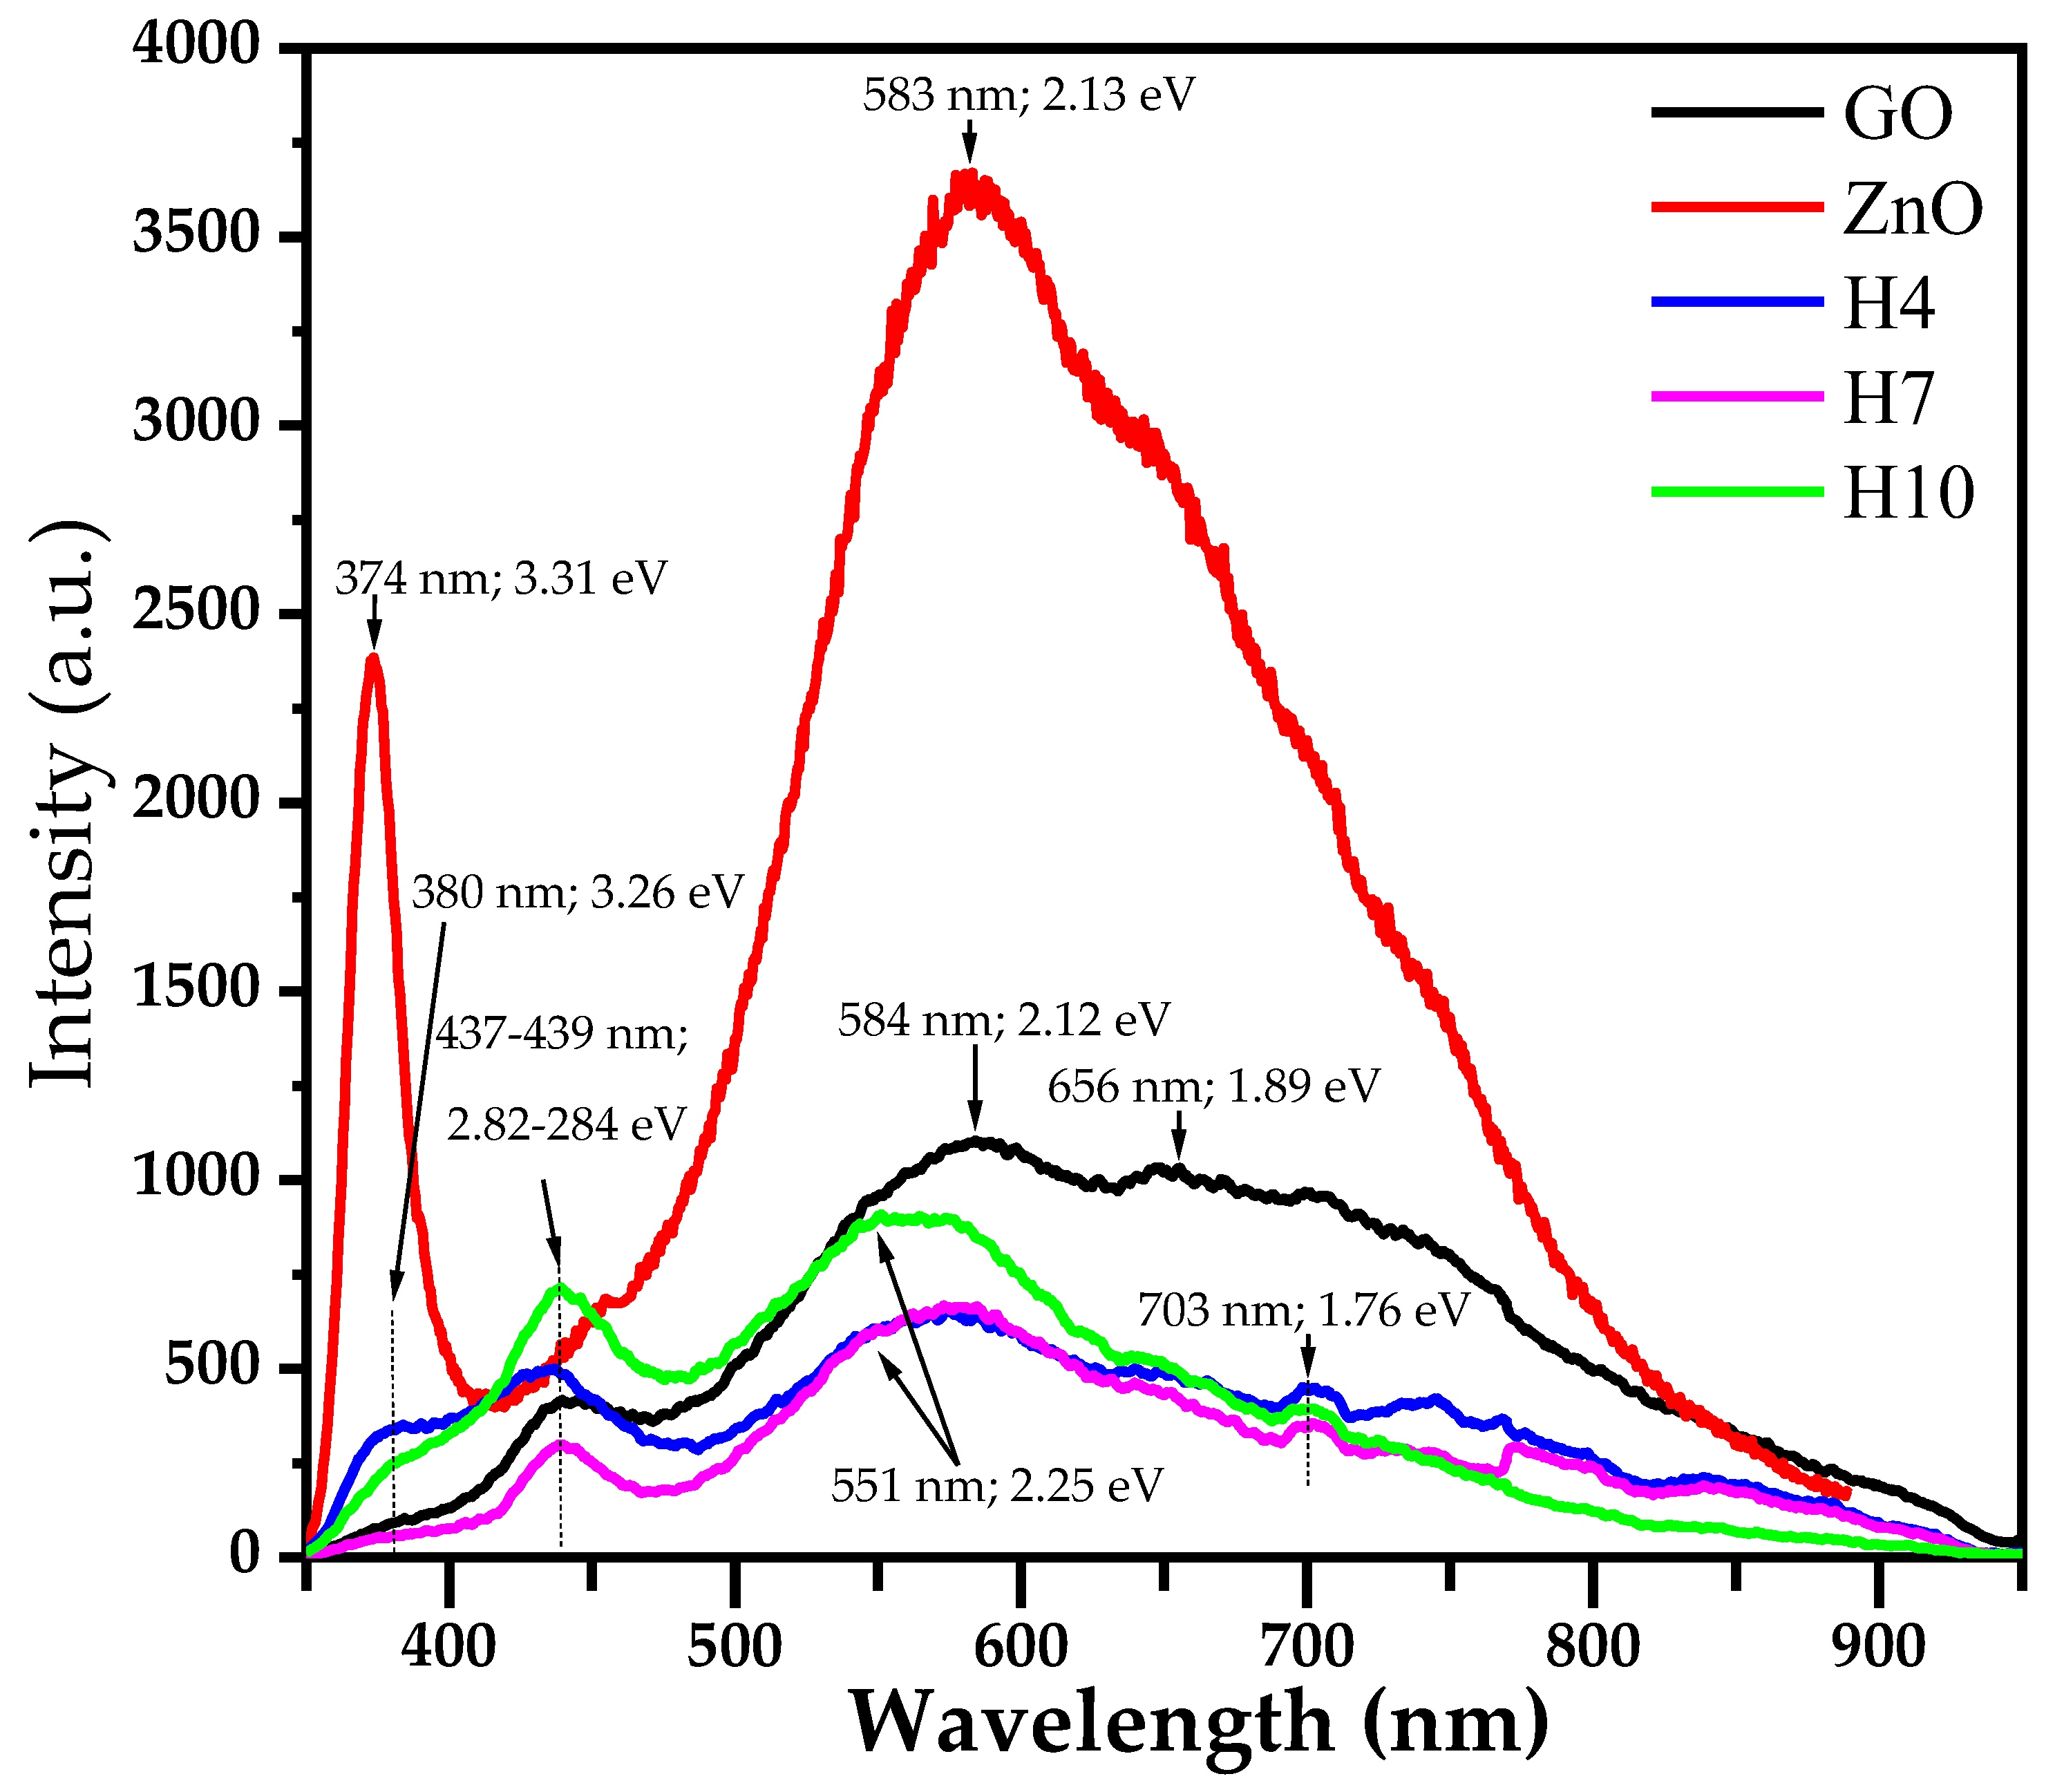
3.5. Optical Property

Figure 9 illustrates the PL spectra of GO, bare ZnO NRs, H4, H7 and H10 samples. The raw material of GO exhibits luminescence bands at ~439 nm (blue emission) and ~584 nm (green emission). The peak at ∼440 nm is assigned to the π–π* transitions of GO. The emission peak at 580 nm in GO emerges due to the C=O and C–O functionalized groups present on the GO surface [59]. For the ZnO NRs, it depicts two typical PL band peaks; the low band peaked at 374 nm (UV emission) and the high band peaked at 583 nm (green emission). The near-band-edge UV emission is due to free ZnO exciton recombination [25]. The intensity of the peak indicates the degree of crystallization of ZnO. The green emission peak obtained at 583 nm is attributed to the transitions from the oxygen vacancy level of ZnO [60].
For the PL spectra of the H4, H7 and H10 samples, these nanocomposites show three main bands: in UV emission, blue emission and green emission regions corresponding to peaks at 380, 439 and 570 nm, respectively. As seen in PL spectra, the PL intensities of all nanocomposites are substantially decreased and there is a slight red shift towards the higher wavelength, after the addition of GO, due to the interaction between ZnO and GO and the interfacial charge transfer between the ZnO and GO layers [34,61]. A detailed analysis of the peak position and photon energy of the samples is shown in Table 2. Furthermore, as the hydrothermal time increases, the intensity of the peak at green emission (550–570 nm) slightly increases, which is attributed to the high number of the oxygen vacancy level of ZnO.

4. Conclusions

In summary, we successfully prepared nanocomposite materials that were composed of ZnO NRs and GO nanosheets via the hydrothermal process. The influence of the hydrothermal reaction time from 4 to 13 h on the structure and optical property of the ZnO/GO nanocomposites were investigated in detail. The results showed that by increasing the reaction time from 4 to 10 h, ZnO NRs with larger diameters and lengths were formed and subsequently increase in their aspect ratios (length/diameter), then dropped slightly as the hydrothermal reaction time extended to 13 h. In addition, it was found that the TChkl values of ZnO NRs in the nanocomposites could be controlled conveniently by adjusting the reaction time. On the other hand, it was shown that the presence of GO affected not only the TChkl values but also the PL intensity of ZnO NRs in the nanocomposite without influencing its crystal structure and chemical composition.

Author Contributions

Conceptualization, T.V.K. and N.H.T.; methodology, T.V.K. and N.H.T.; software, N.H.T.K. and N.H.T.; validation, T.V.K., N.H.T. and L.N.L.; formal analysis, L.N.L.; investigation, T.V.K., L.N.L. and N.H.T.; resources, T.V.K., L.N.L. and N.H.T.; data curation, T.V.K., N.H.T. and N.H.T.K.; writing—original draft preparation, T.V.K. and N.H.T.; writing—review and editing, T.V.K. and N.H.T.; visualization, T.V.K., N.H.T.K. and N.H.T.; supervision, T.V.K.; project administration, T.V.K.; funding acquisition, T.V.K. All authors have read and agreed to the published version of the manuscript.

Funding

This research is funded by Vietnam National University Ho Chi Minh City (VNU-HCM) under grant number B2020-20-07.

Institutional Review Board Statement

Not applicable.

Informed Consent Statement

Not applicable.

Data Availability Statement

Not applicable.

Acknowledgments

This research is funded by Vietnam National University Ho Chi Minh City (VNU-HCM) under grant number B2020-20-07. We acknowledge the support, time and facilities from Ho Chi Minh City University of Technology (HCMUT) and VNU-HCM for supporting this study.

Conflicts of Interest

The authors declare no conflict of interest.

References

  1. Zon, R.; He, G.; Xu, K.; Liu, Q.; Zhang, Z.; Hu, J. ZnO nanorods on reduced graphene sheets with excellent field emission, gas sensor and photocalytic properties. J. Mater. Chem. A 2013, 1, 8445–8452. [Google Scholar]
  2. Lee, Y.J.; Ruby, D.S.; Peters, D.W.; McKenzie, B.B.; Hsu, J.W.P. ZnO nanostructures as efficient antireflection layers in solar cells. Nano Lett. 2008, 8, 1501–1505. [Google Scholar] [CrossRef] [PubMed]
  3. Khai, T.V.; Maneeratanasarn, P.; Choi, B.G.; Ham, H.; Shim, K.B. Diameter-and density-controlled synthesis of well-aligned ZnO nanowire arrays and their properties using a thermal evaporation technique. Phys. Status Solidi A 2012, 209, 1498–1510. [Google Scholar] [CrossRef]
  4. Khai, T.V.; Thu, L.V.; Lam, T.D. Vertically well-aligned ZnO nanowire arrays directly synthesized from Zn vapor deposition without catalyst. J. Electron. Mater. 2016, 45, 2601–2607. [Google Scholar] [CrossRef]
  5. Wang, Z.L. Nanostructures of zinc oxide. Mater. Today 2004, 2, 26–33. [Google Scholar] [CrossRef]
  6. Lao, J.Y.; Wen, J.G.; Ren, Z.F. Hierarchical ZnO nanostructures. Nano Lett. 2002, 2, 1287–1291. [Google Scholar] [CrossRef]
  7. Yi, G.C.; Wang, C.; Park, W. ZnO nanorods: Synthesis, characterization and applications. Semicond. Sci. Technol. 2005, 20, S22–S34. [Google Scholar] [CrossRef]
  8. Martinez, A.G.; Santana, G.; Güell, F.; Martínez-Alanis, P.R.; Dutt, A. Photoluminescence of ZnO nanowires: A review. Nanomaterials 2020, 10, 857. [Google Scholar] [CrossRef]
  9. Wen, B.; Huang, Y.; Boland, J.J. Controllable growth of ZnO nanostructures by a simple solvothermal process. J. Phys. Chem. C 2008, 112, 106–111. [Google Scholar] [CrossRef]
  10. Yang, D.; Ramu, A.G.; Lee, Y.; Kim, S.; Jeon, H.; Sathishkumar, V.E.; Al-Mohaimeed, A.M.; Al-onazi, W.A.; Algarni, T.S.; Choi, D. Fabrication of ZnO nanorods based gas sensor pattern by photolithography and lift off techniques. J. King Saud Univ. Sci. 2021, 33, 101397. [Google Scholar] [CrossRef]
  11. Zhang, L.; Liu, X.; Lian, Z.; Wang, X.; Shen, G.; Shen, D.; Yan, Q. Highly efficient field emission from large-scale and uniform monolayer graphene sheet supported on patterned ZnO nanorod arrays. J. Mater. Chem. C 2014, 2, 3965–3971. [Google Scholar]
  12. Fan, Z.; Wang, D.; Chang, P.-C.; Tseng, W.-Y.; Lu, J.G. ZnO nanowire field-effect transistor and oxygen sensing property. Appl. Phys. Lett. 2004, 85, 5923–5925. [Google Scholar] [CrossRef]
  13. Banszerus, L.; Schmitz, M.; Engels, S.; Dauber, J.; Oellers, M.; Haupt, F.; Watanabe, K.; Taniguchi, T.; Beschoten, B.; Stampfer, C. Ultrahigh-mobility graphene devices from chemical vapor deposition on reusable copper. Sci. Adv. 2015, 1, e1500222. [Google Scholar] [CrossRef] [PubMed] [Green Version]
  14. Allen, M.J.; Tung, V.C.; Kaner, R.B. Honeycomb carbon: A review of graphene. Chem. Rev. 2010, 110, 132–145. [Google Scholar] [CrossRef] [PubMed]
  15. Paul, R.; Gayen, R.N.; Biswas, S.; Bhat, S.V.; Bhunia, R. Enhanced UV detection by transparent graphene oxide/ZnO composite thin films. RSC Adv. 2016, 6, 61661–61672. [Google Scholar] [CrossRef]
  16. Wang, H.; Yang, Y.; Liang, Y.; Robinson, J.T.; Li, Y.; Jackson, A.; Cui, Y.; Dai, H. Graphene-wrapped sulfur particles as a rechargeable lithium–sulfur battery cathode material with high capacity and cycling stability. Nano Lett. 2011, 11, 2644–2647. [Google Scholar] [CrossRef] [Green Version]
  17. Zhu, C.; Fang, Y.; Wen, D.; Dong, S. One-pot synthesis of functional two-dimensional graphene/SnO2 composite nanosheets as a building block for self-assembly and an enhancing nanomaterial for biosensing. J. Mater. Chem. 2011, 21, 16911–16917. [Google Scholar] [CrossRef]
  18. Xiang, Q.; Yu, J.; Jaroniec, M. Graphene-based semiconductor photocatalysts. Chem. Soc. Rev. 2012, 41, 782–796. [Google Scholar] [CrossRef]
  19. Hsieh, C.-T.; Lin, C.-Y.; Chen, Y.-F.; Lin, J.-S. Synthesis of ZnO@Graphene composites as anode materials for lithium ion batteries. Electrochim. Acta 2013, 111, 359–365. [Google Scholar] [CrossRef]
  20. Kim, J.; Cote, L.J.; Huang, J. Two dimensional soft material: New faces of graphene oxide. Acc. Chem. Res. 2012, 45, 1356–1364. [Google Scholar] [CrossRef]
  21. Brisebois, P.P.; Siaj, M. Harvesting graphene oxide—Years 1859 to 2019: A review of its structure, synthesis, properties and exfoliation. J. Mater. Chem. C 2020, 8, 1517. [Google Scholar] [CrossRef]
  22. Chen, Y.-L.; Hu, Z.-A.; Chang, Y.-Q.; Wang, H.-W.; Zhang, Z.-Y.; Yang, Y.-Y.; Wu, H.-Y. Zinc oxide/reduced graphene oxide composites and electrochemical capacitance enhanced by homogeneous incorporation of reduced graphene oxide sheets in zinc oxide matrix. J. Phys. Chem. C 2011, 115, 2563–2571. [Google Scholar] [CrossRef]
  23. Vessalli, B.A.; Zito, C.A.; Perfecto, T.M.; Volanti, D.P.; Mazon, T. ZnO nanorods/graphene oxide sheets prepared by chemical bath deposition for volatile organic compounds detection. J. Alloy. Compd. 2017, 696, 996–1003. [Google Scholar] [CrossRef] [Green Version]
  24. Chung, Y.T.; Mahmoudi, E.; Mohammad, A.W.; Benamor, A.; Johnson, D.; Hilal, N. Development of polysulfone-nanohybrid membranes using ZnO-GO composite for enhanced antifouling and antibacterial control. Desalination 2017, 402, 123–132. [Google Scholar] [CrossRef] [Green Version]
  25. Rokhsat, E.; Akhavan, O. Improving the photocatalytic activity of graphene oxide/ZnO nanorod films by UV irradiation. Appl. Surf. Sci. 2016, 371, 590–595. [Google Scholar] [CrossRef]
  26. Alamdari, S.; Ghamsari, M.S.; Afarideh, H.; Mohammadi, A.; Geranmayeh, S.; Tafreshi, M.J.; Ehsani, M.H. Preparation and characterization of GO-ZnO nanocomposite for UV detection application. Opt. Mater. 2019, 92, 243–250. [Google Scholar] [CrossRef]
  27. Qi, Y.; Zhang, C.; Liu, S.; Zong, Y.; Men, Y. Room-temperature synthesis of ZnO@GO nanocomposites as anode for lithium-ion batteries. J. Mater. Res. 2018, 33, 1506–1514. [Google Scholar] [CrossRef]
  28. Khorramshahi, V.; Karamdel, J.; Yousefi, R. High acetic acid sensing performance of Mg-doped ZnO/rGO nanocomposites. Ceram. Int. 2019, 45, 7034–7043. [Google Scholar] [CrossRef]
  29. Lu, T.; Zhang, Y.; Li, H.; Pan, L.; Li, Y.; Sun, Z. Electrochemical behaviors of graphene–ZnO and graphene–SnO2 composite fifilms for supercapacitors. Electrochim. Acta 2010, 55, 4170–4173. [Google Scholar] [CrossRef]
  30. Lu, T.; Pan, L.; Li, H.; Zhu, G.; Lv, T.; Liu, X.; Sun, Z.; Chen, T.; Chua, D.H.C. Microwaveassisted synthesis of graphene ZnO nanocomposite for electrochemical supercapacitors. J. Alloy. Compd. 2011, 509, 5488–5492. [Google Scholar] [CrossRef]
  31. Kim, Y.J.; Lee, J.H.; Yi, G.C. Vertically aligned ZnO nanostructures grown on graphene layers. Appl. Phys. Lett. 2009, 95, 213101. [Google Scholar] [CrossRef] [Green Version]
  32. Wu, J.; Shen, X.; Jiang, L.; Wang, K.; Chen, K. Solvothermal synthesis and characterization of sandwich-like graphene/ZnO nanocomposites. Appl. Surf. Sci. 2010, 256, 2826–2830. [Google Scholar] [CrossRef]
  33. Marlinda, A.R.; Huang, N.M.; Muhamad, M.R.; Ańamt, M.N.; Chang, B.Y.S.; Yusoff, N.; Harrison, I.; Lim, H.N.; Chia, C.H.; Kumar, S.V. Highly effificient preparation of ZnO nanorods decorated reduced graphene oxide nanocomposites. Mater. Lett. 2012, 80, 9–12. [Google Scholar] [CrossRef]
  34. Alver, U.; Zhoub, W.; Belay, A.B.; Krueger, R.; Davis, K.O.; Hickman, N.S. Optical and structural properties of ZnO nanorods grown on graphene oxide and reduced graphene oxide film by hydrothermal method. Appl. Surf. Sci. 2012, 258, 3109–3114. [Google Scholar] [CrossRef]
  35. Kim, S.J.; Kim, H.H.; Kwon, J.B.; Lee, J.G.; Beom-Hoan, O.; Lee, S.G.; Lee, E.H.; Park, S.G. Novel fabrication of various size ZnO nanorods using hydrothermal method. Microelectron. Eng. 2010, 87, 1534–1536. [Google Scholar] [CrossRef]
  36. Baruah, S.; Dutta, J. Hydrothermal growth of ZnO nanostructures. Sci. Technol. Adv. Mater. 2009, 10, 013001. [Google Scholar] [CrossRef]
  37. Almamari, M.R.; Ahmed, N.M.; Holi, A.M.; Yam, F.K.; Kyaw, H.H.; Almessiere, M.A.; Al-Abr, M.Z. Some distinct attributes of ZnO nanorods arrays: Effects of varying hydrothermal growth time. Materials 2022, 15, 5827. [Google Scholar] [CrossRef]
  38. Shi, R.; Yang, P.; Wang, J.; Zhang, A.; Zhu, Y.; Cao, Y.; Ma, Q. Growth of flower-like ZnO via surfactant-free hydrothermal synthesis on ITO substrate at low temperature. CrystEngComm 2012, 14, 5996–6003. [Google Scholar] [CrossRef]
  39. Cai, X.; Han, B.; Deng, S.; Wang, Y.; Dong, C.; Wang, Y.; Djerdj, I. Hydrothermal growth of ZnO nanorods on Zn substrates and their application in degradation of azo dyes under ambient conditions. CrystEngComm 2014, 16, 7761–7770. [Google Scholar] [CrossRef]
  40. Khai, T.V.; Lam, T.D.; Thu, L.V.; Kim, H.W. A two-step method for the preparation of highly conductive graphene film and its gas-sensing property. Mater. Sci. Appl. 2015, 6, 963–977. [Google Scholar] [CrossRef] [Green Version]
  41. Khai, T.V.; Kwak, D.S.; Kwon, Y.J.; Kim, S.S.; Shim, K.B.; Kim, H.W. High-quality graphene thin films synthesized by H2 ambient-annealing of reduced graphene oxide sheets. J. Ceram. Process. Res. 2013, 14, 355–362. [Google Scholar]
  42. Bindu, P.; Thomas, S. Estimation of lattice strain in ZnO nanoparticles: X-ray peak profile analysis. J. Theor. Appl. Phys. 2014, 8, 123–134. [Google Scholar] [CrossRef] [Green Version]
  43. Janotti, A.; van de Walle, C.G. Fundamentals of zinc oxide as a semiconductor. Rep. Prog. Phys. 2009, 72, 126501. [Google Scholar] [CrossRef]
  44. Samanta, P.K.; Bandyopadhyay, A.K. Chemical growth of hexagonal zinc oxide nanorods and their optical properties. Appl. Nanosci. 2012, 2, 111–117. [Google Scholar] [CrossRef] [Green Version]
  45. Li, W.J.; Shi, E.W.; Zhong, W.Z.; Yin, Z.W. Growth mechanism and growth habit of oxide crystal. J. Cryst. Growth 1999, 203, 186–196. [Google Scholar] [CrossRef]
  46. Barret, C.S.; Massalski, T.B. Structure of Metals: Crystallographic Methods, Principles and Data; Pergamon Press: Oxford, UK, 1980; p. 204. [Google Scholar]
  47. Boukhoubza, I.; Khenfouch, M.; Achehboune, M.; Mothudi, B.M.; Zorkani, I.; Jorio, A. Graphene oxide/ZnO nanorods/graphene oxide sandwich structure: The origins and mechanisms of photoluminescence. J. Alloy. Compd. 2019, 797, 1320–1326. [Google Scholar] [CrossRef]
  48. Saleem, M.; Fang, L.; Ruan, H.B.; Wu, F.; Huang, Q.L.; Xu, C.L.; Kong, C.Y. Effect of zinc acetate concentration on the structural and optical properties of ZnO thin films deposited by Sol-Gel method. Int. J. Phys. Sci. 2012, 7, 2971–2979. [Google Scholar] [CrossRef]
  49. Kudin, K.N.; Ozbas, B.; Schniepp, H.C.; Prud’Homme, R.K.; Aksay, I.A.; Car, R. Raman spectra of graphite oxide and functionalized graphene sheets. Nano Lett. 2008, 8, 36–41. [Google Scholar] [CrossRef]
  50. Gautam, N.; Singh, F.; Gautam, S.K.; Singh, R.G.; Ojha, S.; Kapoor, A. Growth of highly transparent CdxZn1−xO (CZO) thin films: Structural and optical studies. J. Alloy. Compd. 2015, 650, 311–317. [Google Scholar] [CrossRef]
  51. Vettumperumal, R.; Kalyanaraman, S.; Santoshkumar, B.; Thangavel, R. Estimation of electron–phonon coupling and Urbach energy in group-I elements doped ZnO nanoparticles and thin films by sol–gel method. Mater. Res. Bull. 2016, 77, 101–110. [Google Scholar] [CrossRef]
  52. Ye, X.-Y.; Zhou, Y.-M.; Sun, Y.-Q.; Chen, J.; Wang, Z.-Q. Preparation and characterization of Ag/ZnO composites via a simple hydrothermal route. J. Nanoparticle Res. 2009, 11, 1159–1166. [Google Scholar] [CrossRef]
  53. Vaibhav, K.; Lokesh, S.; Malik, M.M. Effect of NaOH concentration on optical properties of zinc oxide nanoparticles. Mater. Sci.-Poland 2016, 34, 819–827. [Google Scholar]
  54. Zare, M.; Safa, S.; Azimirad, R.; Mokhtari, S. Graphene oxide incorporated ZnO nanostructures as a powerful ultraviolet composite detector. J. Mater. Sci. Mater. Electron. 2017, 28, 6919–6927. [Google Scholar] [CrossRef]
  55. Kumar, N.; Srivastava, V.C. Simple synthesis of large graphene oxide sheets via electrochemical method coupled with oxidation process. ACS Omega 2018, 3, 10233–10242. [Google Scholar] [CrossRef] [PubMed]
  56. Zhang, T.; Zhang, D.; Shen, M. A low-cost method for preliminary separation of reduced graphene oxide nanosheets. Mater. Lett. 2009, 63, 2051–2054. [Google Scholar] [CrossRef]
  57. Bano, N.; Hussain, I.; El-Naggar, A.M.; Albassam, A.A. Reduced graphene oxide nanocomposites for optoelectronics applications. Appl. Phys. A 2019, 125, 215. [Google Scholar] [CrossRef]
  58. Salih, E.; Mekawy, M.; Hassan, R.Y.A.; El-Sherbiny, I.M. Synthesis, characterization and electrochemical-sensor applications of zinc oxide/graphene oxide nanocomposite. J. Nanostruct. Chem. 2016, 6, 137–144. [Google Scholar] [CrossRef] [Green Version]
  59. Ding, J.; Wang, M.; Zhang, X.; Yang, Z.; Song, X.; Ran, C. Photoluminescence investigation about zinc oxide with graphene oxide & reduced graphene oxide buffer layers. J. Colloid Interface Sci. 2014, 416, 289–293. [Google Scholar]
  60. Yang, Y.; Liu, T. Fabrication and characterization of graphene oxide/zinc oxide nanorods hybrid. Appl. Surf. Sci. 2011, 257, 8950–8954. [Google Scholar] [CrossRef]
  61. Son, D.I.; Kwon, B.W.; Yang, J.D.; Park, D.H.; Seo, W.S.; Lee, H.; Yi, Y.; Lee, C.L.; Choi, W.K. Charge separation and ultraviolet photovoltaic conversion of ZnO quantum dots conjugated with graphene nanoshells. Nano Res. 2012, 5, 747–761. [Google Scholar] [CrossRef]
Figure 1. Schematic illustration of the GO synthesis.
Crystals 12 01825 g001
Figure 2. Schematic illustration for hydrothermal synthesis of the ZnO/GO nanocomposites.
Crystals 12 01825 g002
Figure 3. XRD patterns of GO, bare ZnO and ZnO/GO nanocomposites synthesized at different times: 4, 7, 10 and 13 h corresponding to H4, H7, H10 and H13, respectively.
Crystals 12 01825 g003
Figure 4. (a–h). FESEM images at low and high magnification of ZnO/GO nanocomposites synthesized at different times: (a,b) 4 h; (c,d) 7 h; (e,f) 10 h; and (g,h) 13 h.
Crystals 12 01825 g004
Figure 5. (a,b). EDX spectra of ZnO and ZnO/GO nanocomposite with a synthesis time of 10 h (H10). The calculated elemental compositions are shown in the tables and are inserted in Figure 5. (a,b), accordingly.
Crystals 12 01825 g005
Figure 6. TEM images of synthesized ZnO/GO nanocomposite (H10): (a) low magnification (b) high magnification.
Crystals 12 01825 g006
Figure 7. Raman spectra of GO, bare ZnO and ZnO/GO nanocomposites prepared for 4 (H4), 7 (H7), 10 (H10) and 13 h (H13).
Crystals 12 01825 g007
Figure 8. FTIR spectra of GO, ZnO and as-synthesized ZnO/GO nanocomposites.
Crystals 12 01825 g008
Figure 9. PL spectra of GO, ZnO NRs, and ZnO/GO nanocomposites.
Crystals 12 01825 g009
Table 1. XRD data, TChkl and crystallite size of ZnO NRs.
SampleDiffraction PlaneIntensity (a.u.) Calculated TChkl for 3 Main PeaksFWHM (Radian)Peak Position (Degree)Crystallite Size: D (nm)
I0
((JCPDS-ICDD:36-1451)
I (Measured)
ZnO(100)57661.020.0044331.8532.57
(002)44541.090.0039834.5036.53
(101)1001000.890.0054336.3029.06
H4 (100)571002.400.0114431.8012.61
(002)4400---
(101)100430.60---
H7 (100)571002.920.0050231.8428.71
(002)4400---
(101)100400.08---
H10 (100)571001.770.0029731.8148.60
(002)44330.760.0057634.6225.24
(101)100470.470.0050636.3228.86
H13 (100)571001.540.0069831.9120.70
(002)44660.860.0122134.7011.90
(101)100540.600.0073336.4719.90
Table 2. Position of PL peaks and photon energy of GO, ZnO NR and ZnO/GO nanocomposites.
SampleWavelength (nm) Energy (eV)
GO4392.82
584
656
2.12
1.89
ZnO3743.31
5832.12
H4 3803.26
4372.84
551
703
2.25
1.76
H7 3803.26
4392.82
560
703
2.21
1.76
H10 3803.26
4392.82
551
703
2.25
1.76
Publisher’s Note: MDPI stays neutral with regard to jurisdictional claims in published maps and institutional affiliations.

