
The Presence of Charge Transfer Defect Complexes in Intermediate Band CuAl1−pFepS2


Abstract
:1. Introduction
2. Methods
3. Results and Discussion
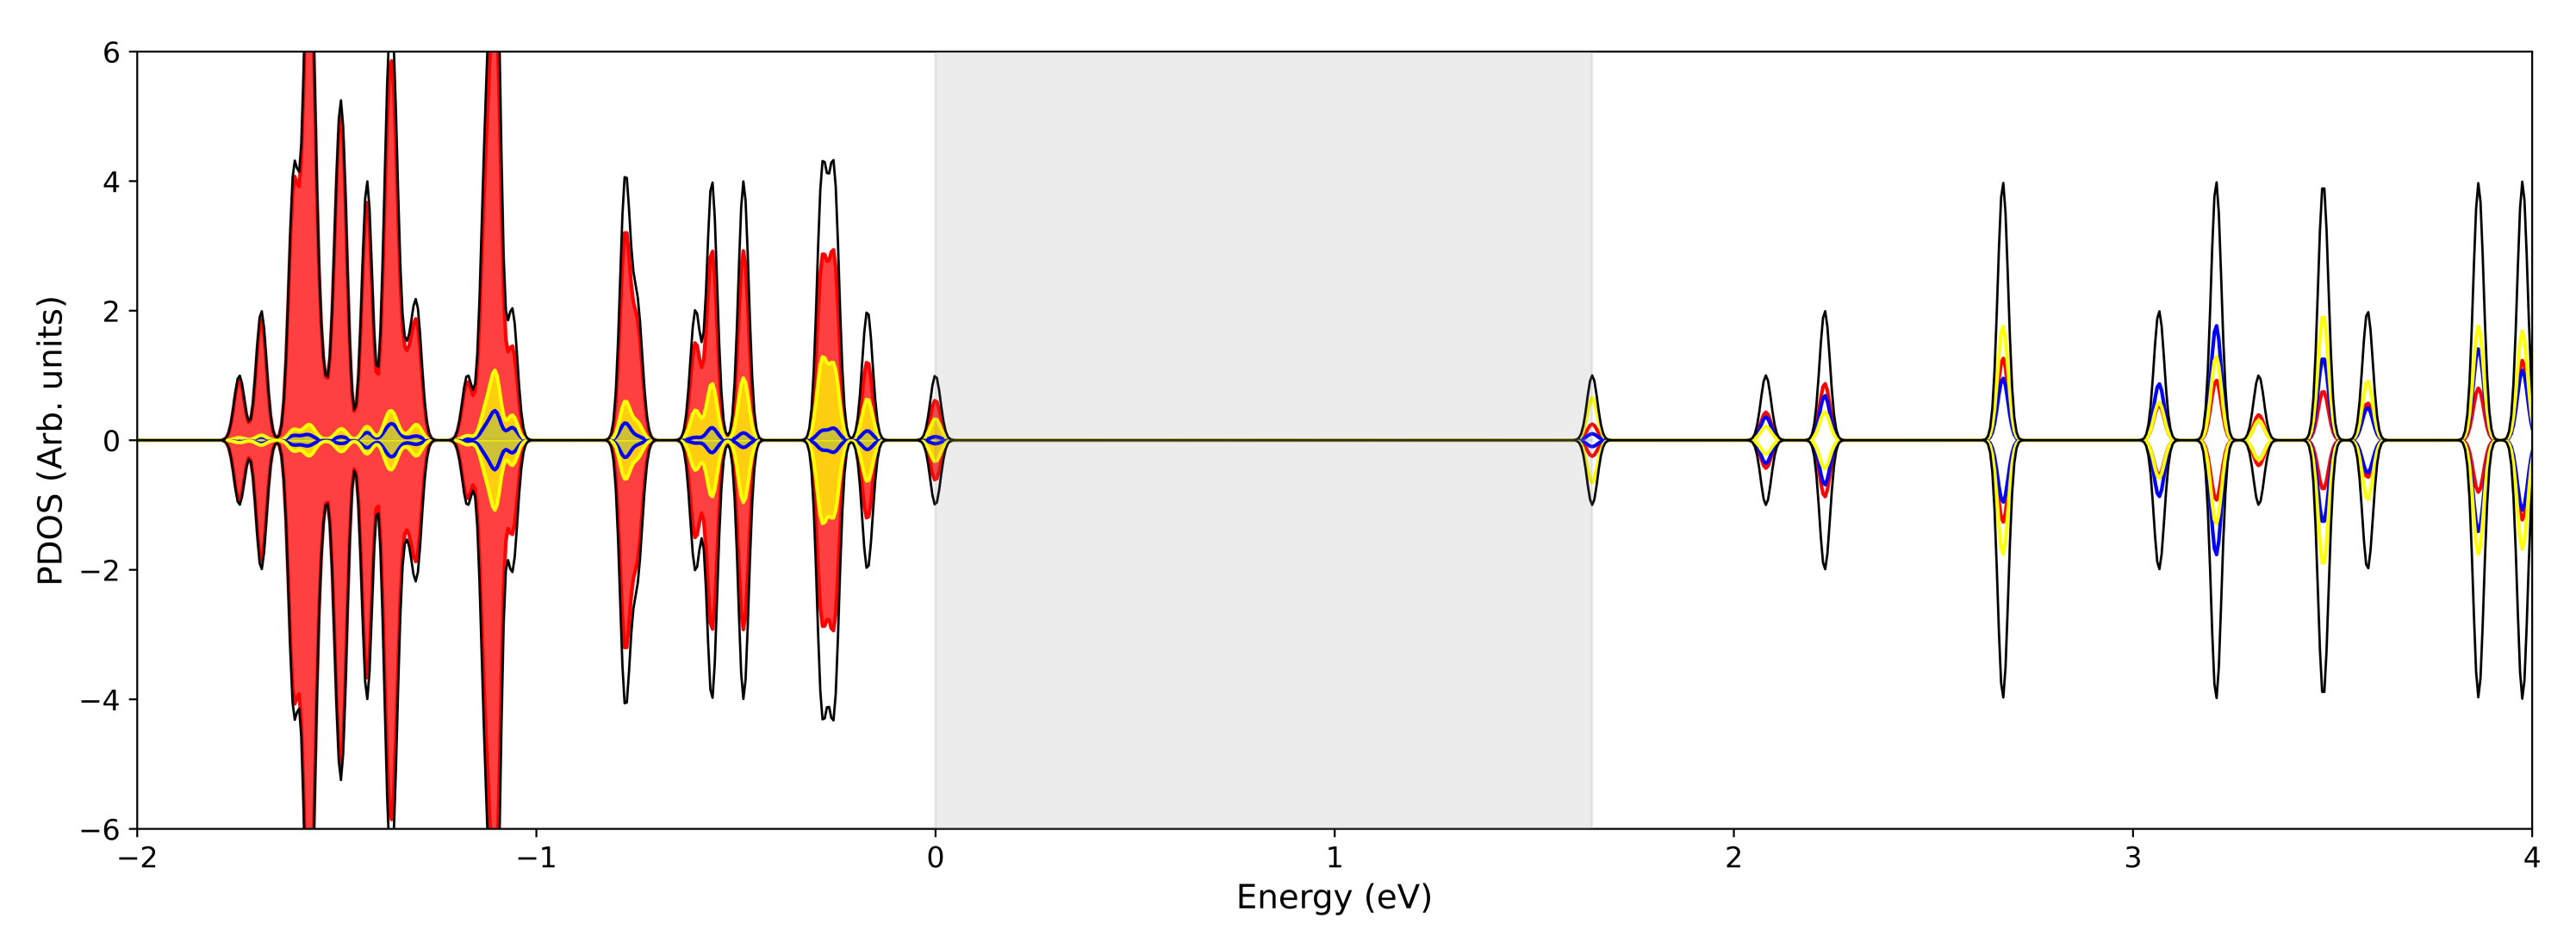
3.1. Single () Fe Substitution
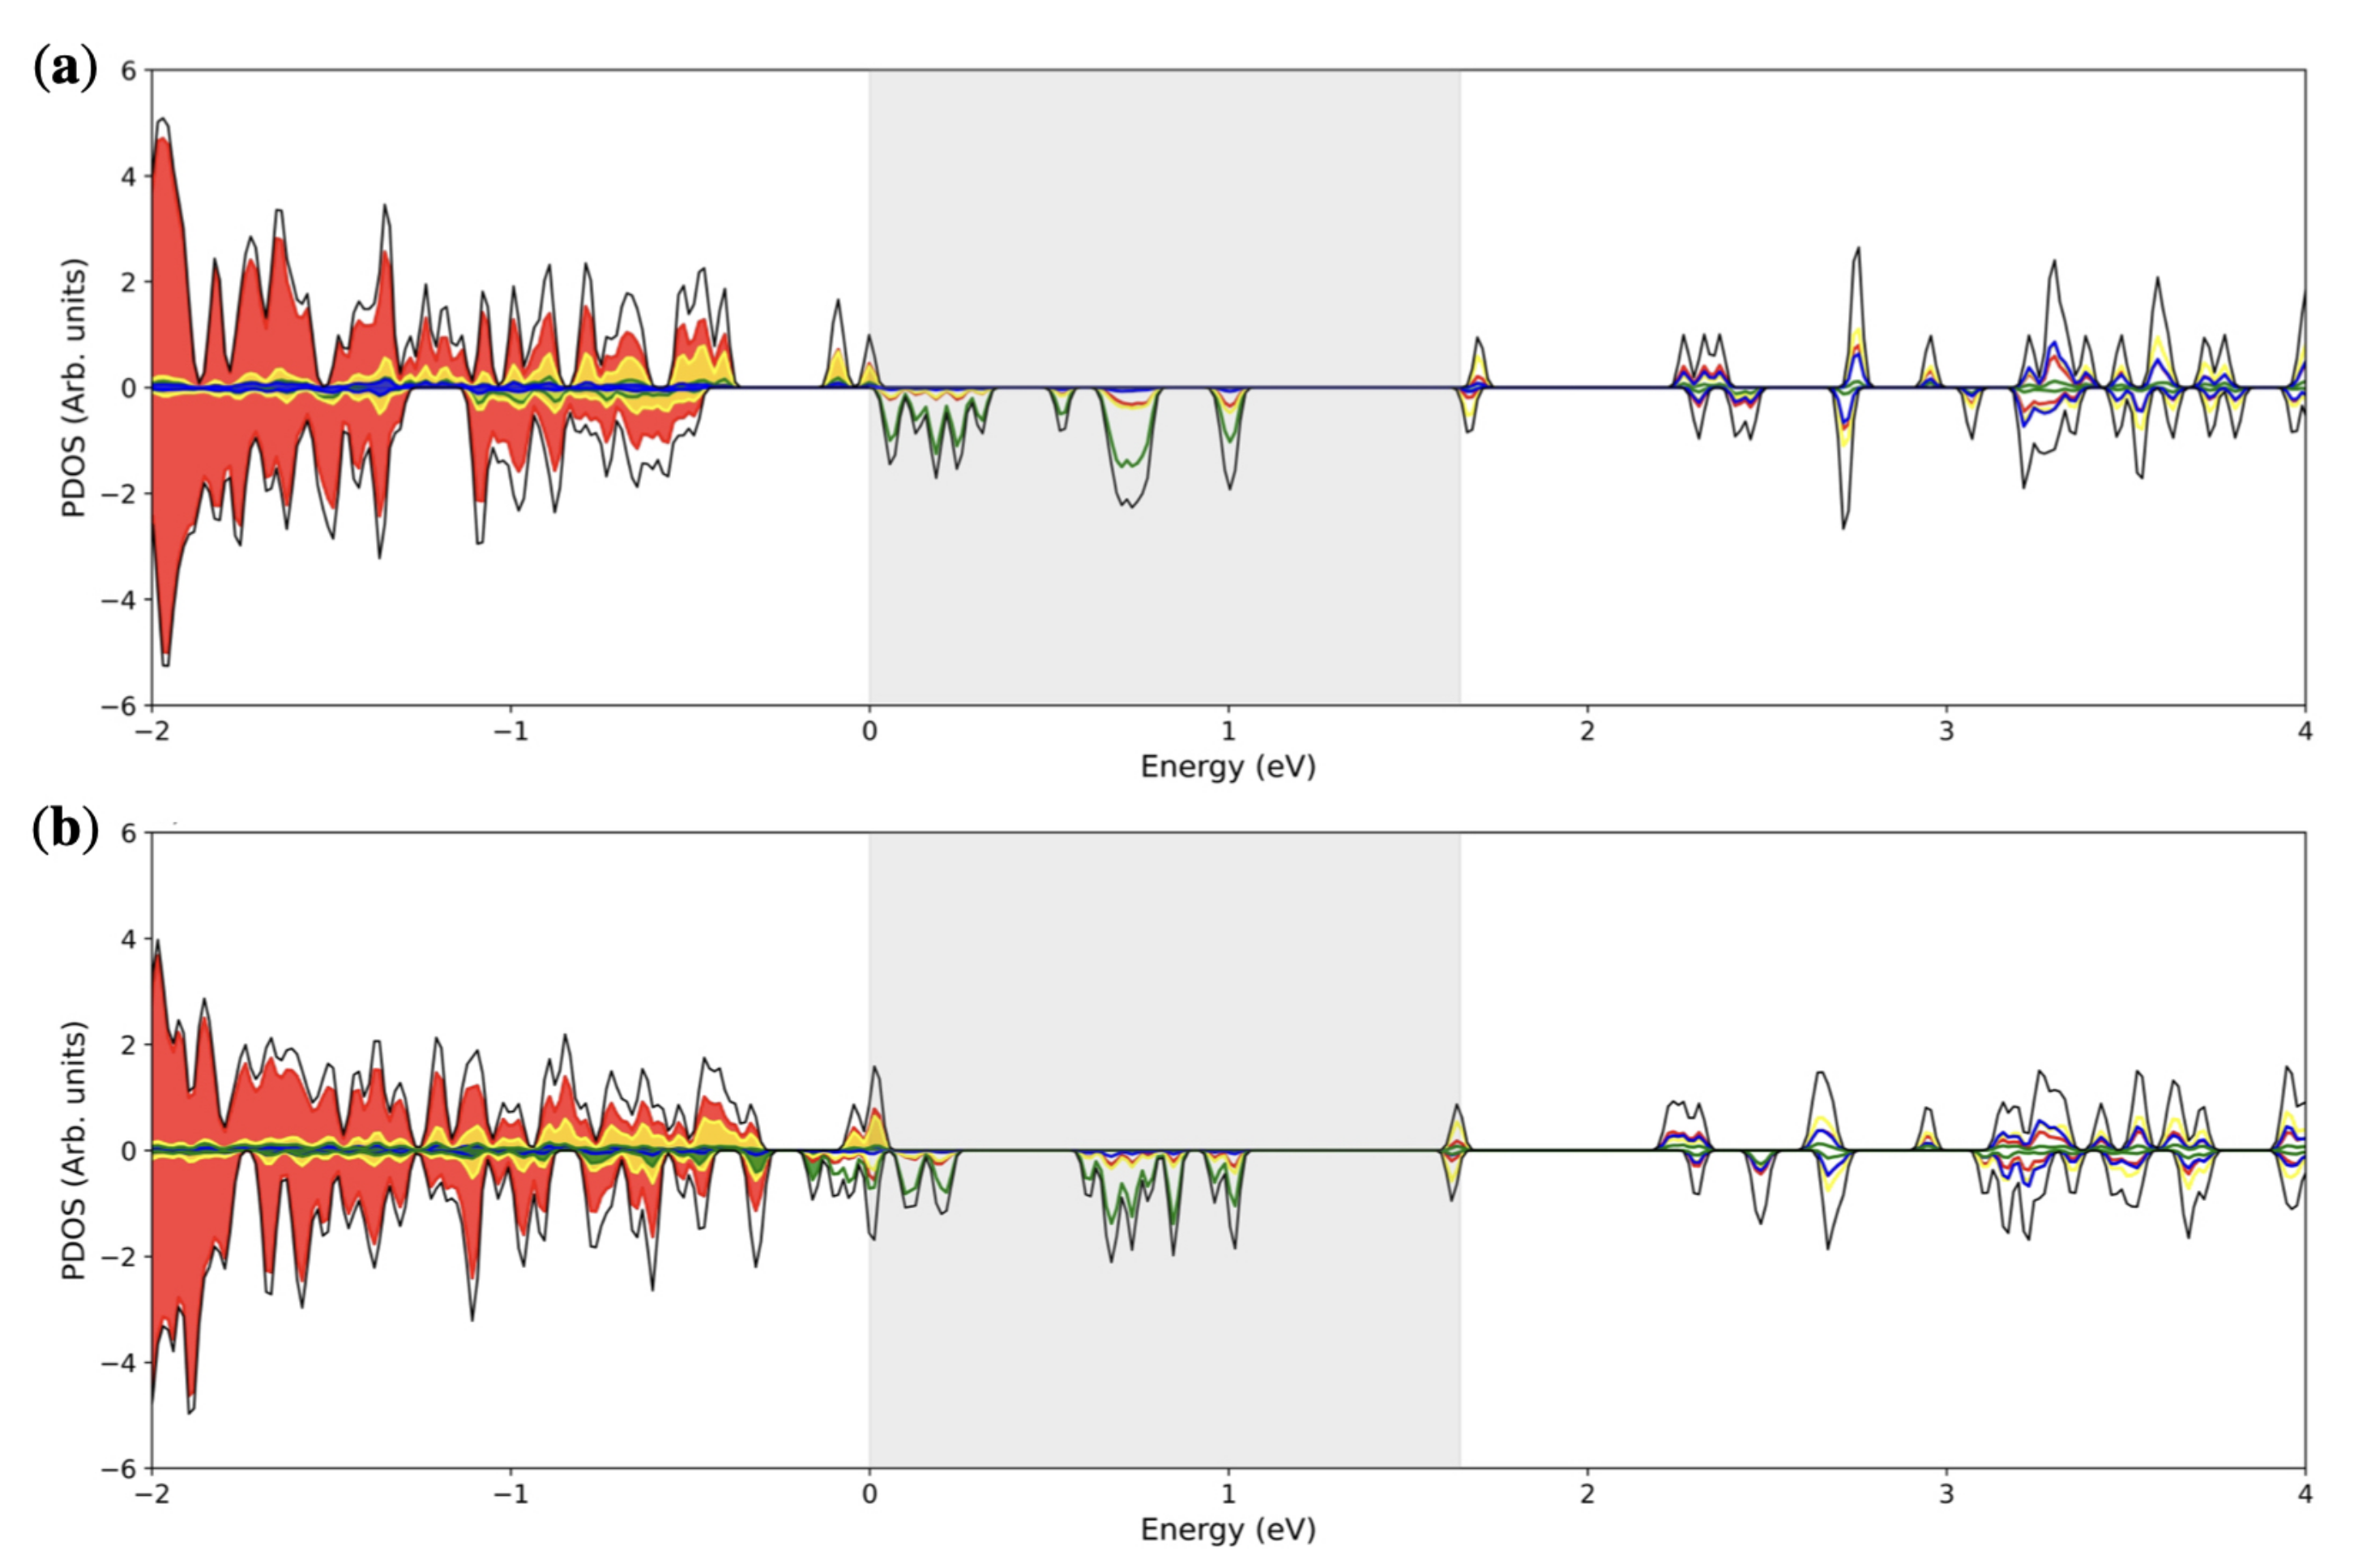
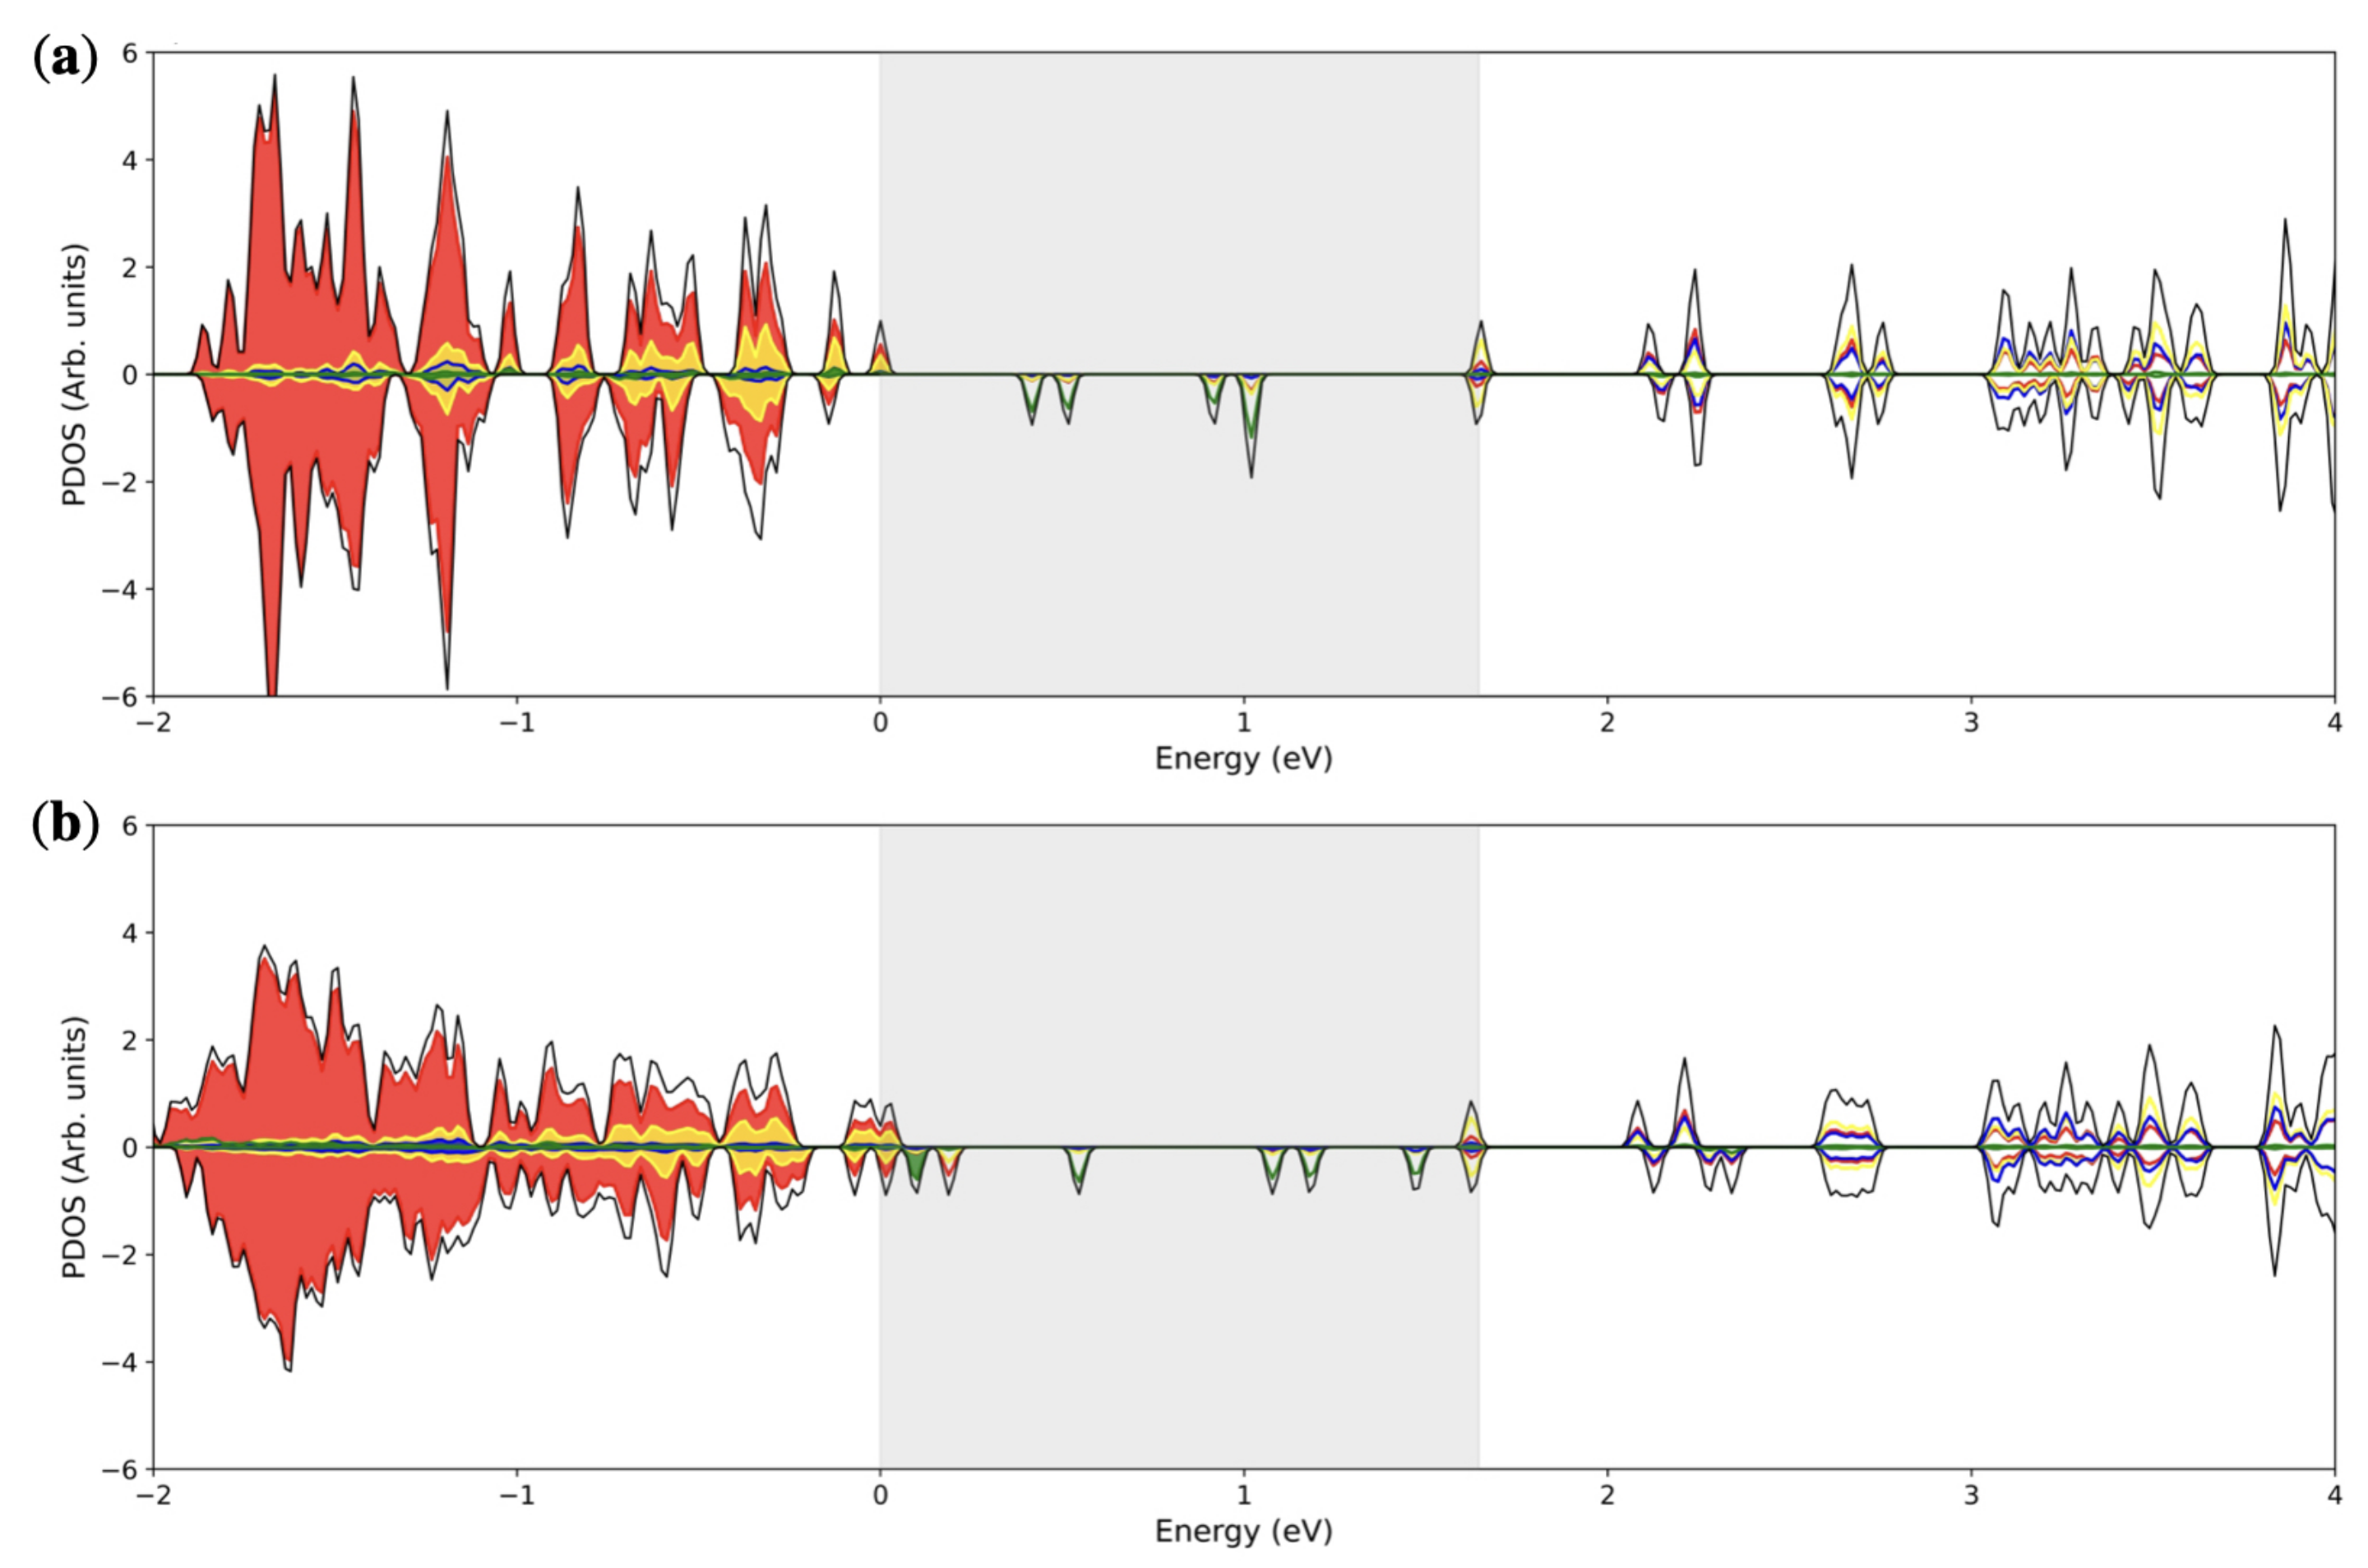
3.2. Double () Fe Substitution
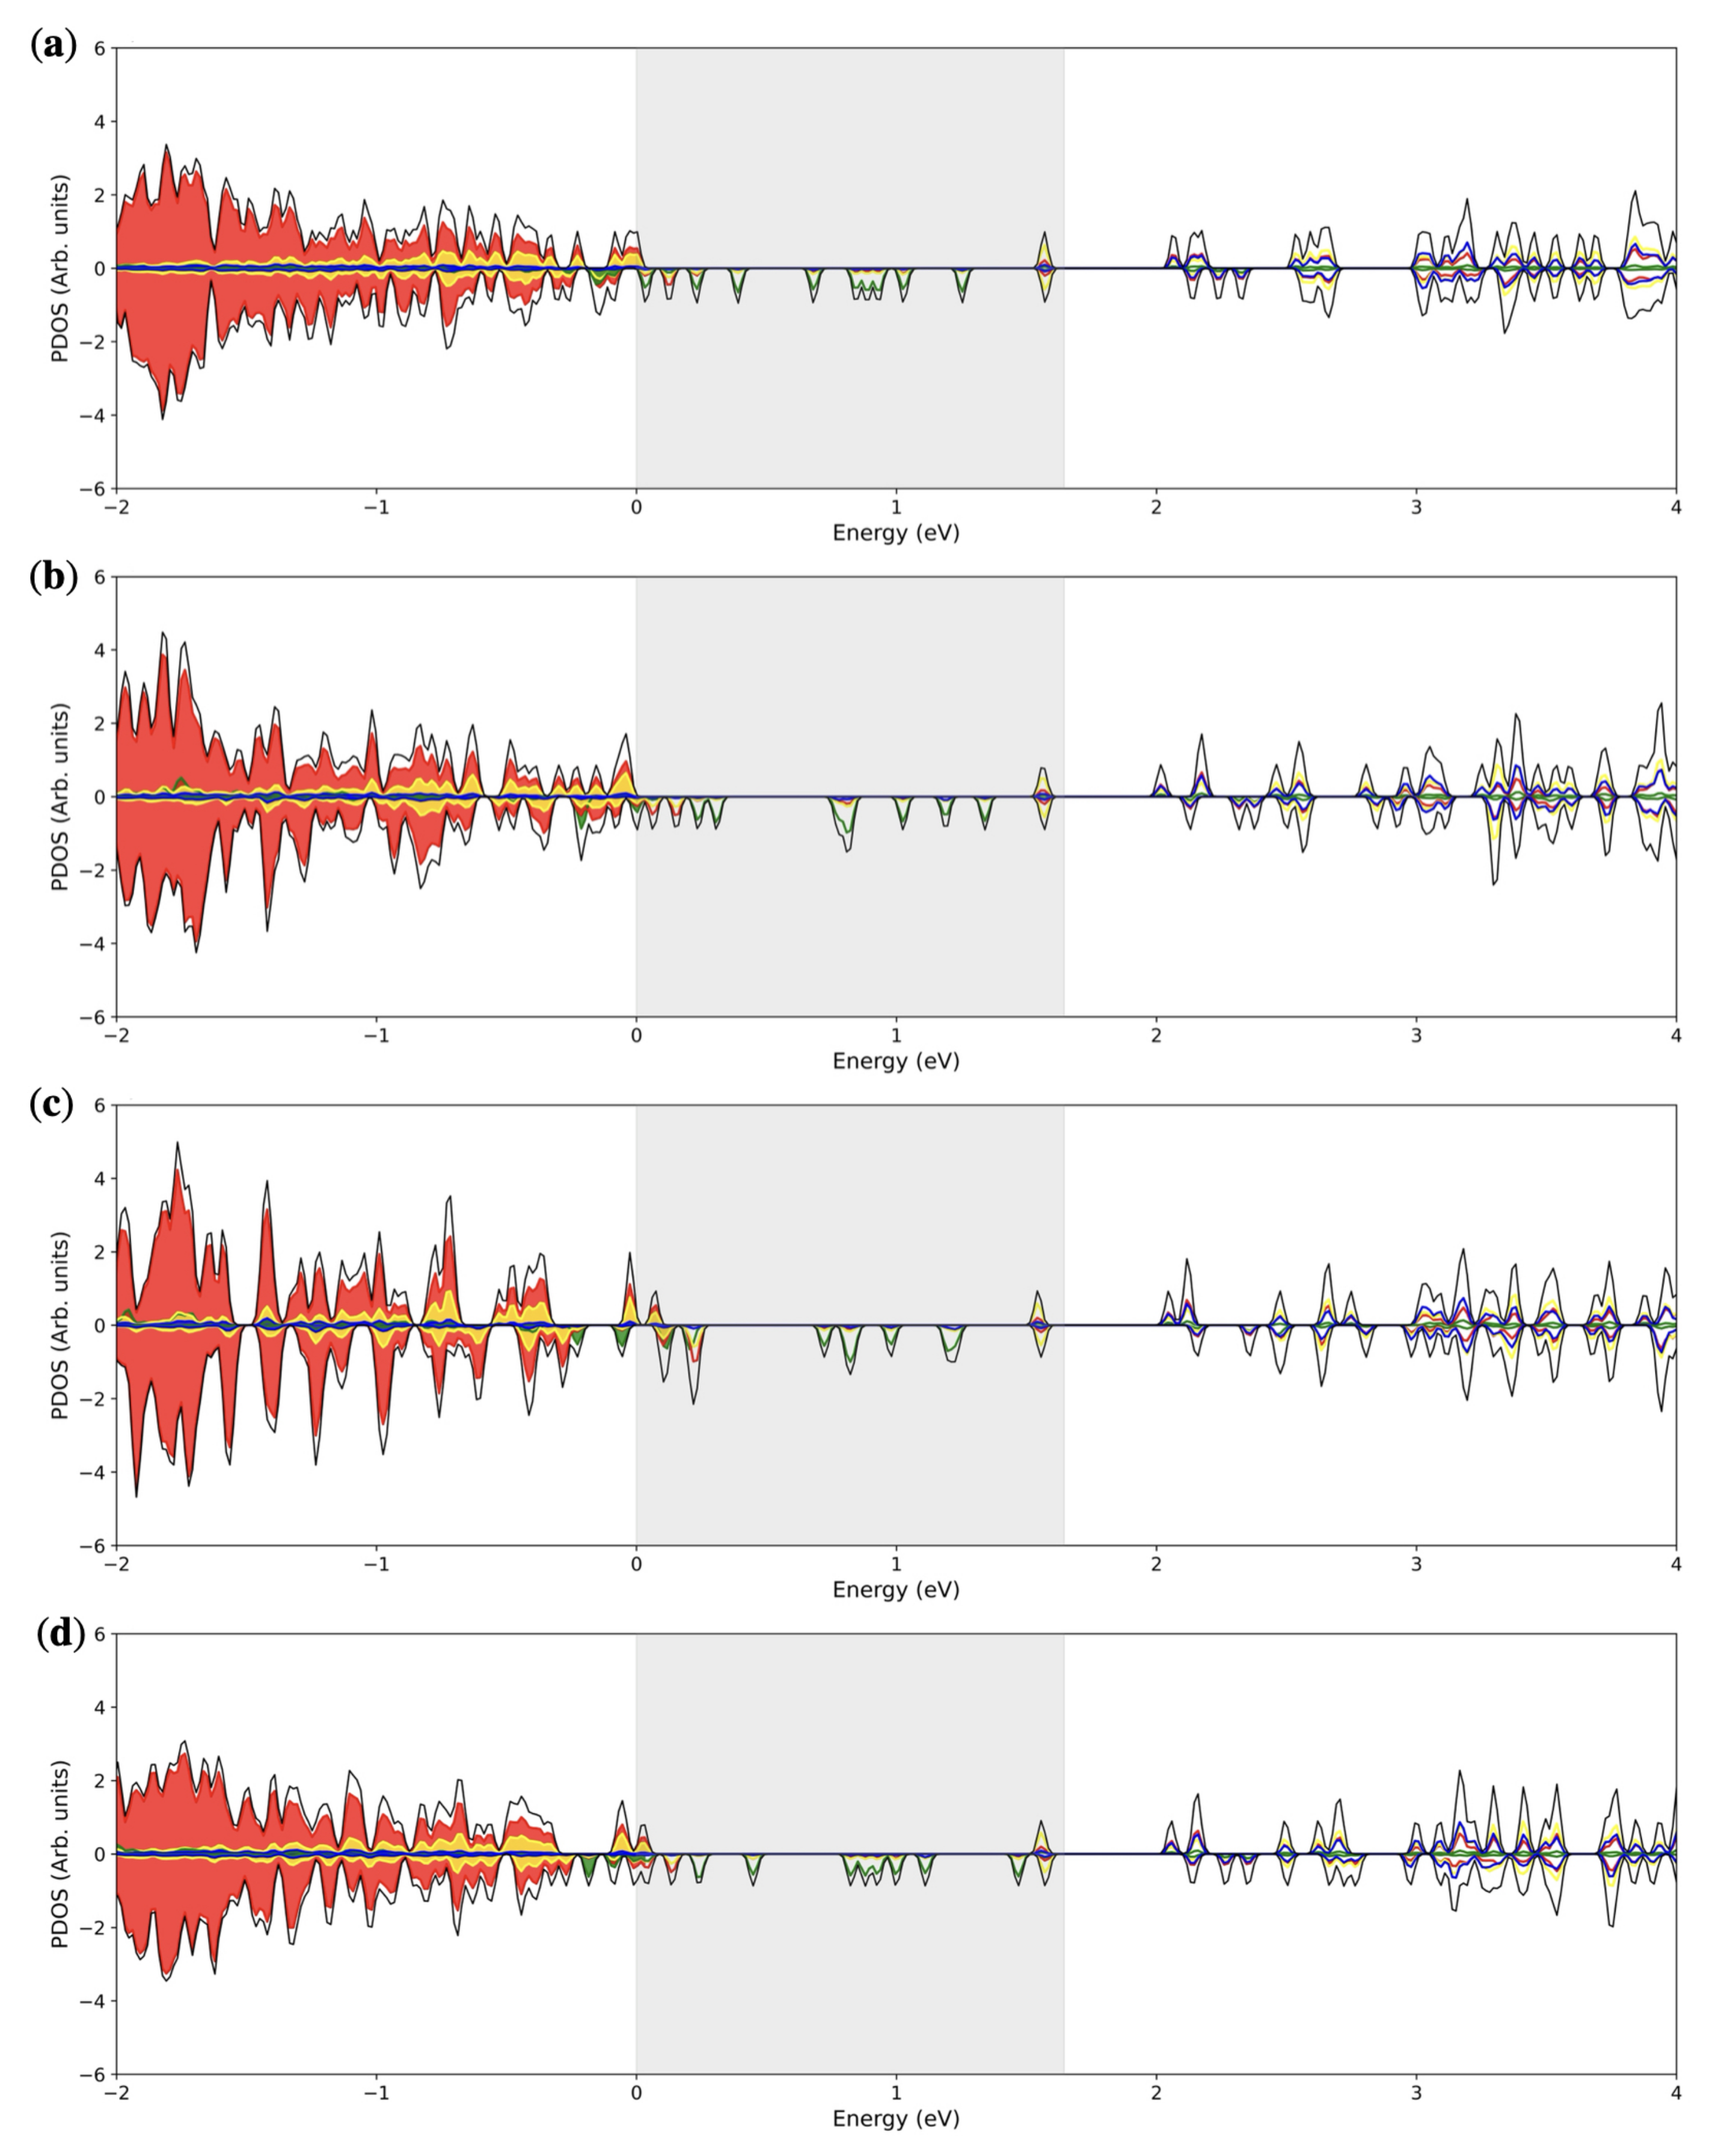
3.3. Multiple ( Fe Substitutions
4. Conclusions
Author Contributions
Funding
Data Availability Statement
Acknowledgments
Conflicts of Interest
Abbreviations
| CB | Conduction Band |
| DFT | Density Functional Theory |
| IB | Intermediate Band |
| PDOS | Projected Density of States |
| QD | Quantum Dot |
| SCF | Self Consistent Field |
| VB | Valence Band |
Appendix A


References
- Kairdolf, B.; Smith, A.; Stokes, T.; Wang, M.; Young, A.; Nie, S. Semiconductor Quantum Dots for Bioimaging and Biodiagnostic Applications. Annu. Rev. Anal. Chem. (Palo Alto Calif.) 2013, 6, 143–162. [Google Scholar] [CrossRef] [PubMed] [Green Version]
- Bilan, R.; Nabiev, I.; Sukhanova, A. Quantum Dot-Based Nanotools for Bioimaging, Diagnostics, and Drug Delivery. ChemBioChem 2016, 17, 2103–2114. [Google Scholar] [CrossRef] [PubMed]
- Pandey, S.; Bodas, D. High-quality quantum dots for multiplexed bioimaging: A critical review. Adv. Colloid Interface Sci. 2020, 278, 102137. [Google Scholar] [CrossRef] [PubMed]
- Wood, V.; Bulović, V. Colloidal quantum dot light-emitting devices. Nano Rev. 2010, 1, 5202. [Google Scholar] [CrossRef] [PubMed] [Green Version]
- Lu, M.; Guo, J.; Sun, S.; Lu, P.; Wu, J.; Wang, Y.; Kershaw, S.V.; Yu, W.W.; Rogach, A.L.; Zhang, Y. Bright CsPbI3 perovskite quantum dot light-emitting diodes with top-emitting structure and a low efficiency roll-off realized by applying zirconium acetylacetonate surface modification. Nano Lett. 2020, 20, 2829–2836. [Google Scholar] [CrossRef]
- Carey, G.H.; Abdelhady, A.L.; Ning, Z.; Thon, S.M.; Bakr, O.M.; Sargent, E.H. Colloidal quantum dot solar cells. Chem. Rev. 2015, 115, 12732–12763. [Google Scholar] [CrossRef]
- Liu, Z.; Lin, C.H.; Hyun, B.R.; Sher, C.W.; Lv, Z.; Luo, B.; Jiang, F.; Wu, T.; Ho, C.H.; Kuo, H.C.; et al. Micro-light-emitting diodes with quantum dots in display technology. Light. Sci. Appl. 2020, 9, 1–23. [Google Scholar] [CrossRef]
- Reiss, P.; Carriere, M.; Lincheneau, C.; Vaure, L.; Tamang, S. Synthesis of semiconductor nanocrystals, focusing on nontoxic and earth-abundant materials. Chem. Rev. 2016, 116, 10731–10819. [Google Scholar] [CrossRef]
- Chuang, Y.J.; Zhen, Z.; Zhang, F.; Liu, F.; Mishra, J.P.; Tang, W.; Chen, H.; Huang, X.; Wang, L.; Chen, X.; et al. Photostimulable near-infrared persistent luminescent nanoprobes for ultrasensitive and longitudinal deep-tissue bio-imaging. Theranostics 2014, 4, 1112. [Google Scholar] [CrossRef] [Green Version]
- Li, P.; Duan, X.; Chen, Z.; Liu, Y.; Xie, T.; Fang, L.; Li, X.; Yin, M.; Tang, B. A near-infrared fluorescent probe for detecting copper (II) with high selectivity and sensitivity and its biological imaging applications. Chem. Commun. 2011, 47, 7755–7757. [Google Scholar] [CrossRef]
- Yu, K.; Ng, P.; Ouyang, J.; Zaman, M.B.; Abulrob, A.; Baral, T.N.; Fatehi, D.; Jakubek, Z.J.; Kingston, D.; Wu, X.; et al. Low-temperature approach to highly emissive copper indium sulfide colloidal nanocrystals and their bioimaging applications. ACS Appl. Mater. Interfaces 2013, 5, 2870–2880. [Google Scholar] [CrossRef] [PubMed] [Green Version]
- Choi, J.Y.; Kim, G.H.; Guo, Z.; Lee, H.Y.; Swamy, K.; Pai, J.; Shin, S.; Shin, I.; Yoon, J. Highly selective ratiometric fluorescent probe for Au3+ and its application to bioimaging. Biosens. Bioelectron. 2013, 49, 438–441. [Google Scholar] [CrossRef] [PubMed] [Green Version]
- Jara, D.H.; Yoon, S.J.; Stamplecoskie, K.G.; Kamat, P.V. Size-dependent photovoltaic performance of CuInS2 quantum dot-sensitized solar cells. Chem. Mater. 2014, 26, 7221–7228. [Google Scholar] [CrossRef]
- Zhou, H.; Hsu, W.C.; Duan, H.S.; Bob, B.; Yang, W.; Song, T.B.; Hsu, C.J.; Yang, Y. CZTS nanocrystals: A promising approach for next generation thin film photovoltaics. Energy Environ. Sci. 2013, 6, 2822–2838. [Google Scholar] [CrossRef]
- Dalui, A.; Khan, A.H.; Pradhan, B.; Pradhan, J.; Satpati, B.; Acharya, S. Facile synthesis of composition and morphology modulated quaternary CuZnFeS colloidal nanocrystals for photovoltaic application. RSC Adv. 2015, 5, 97485–97494. [Google Scholar] [CrossRef]
- Jaffe, J.; Zunger, A. Electronic structure of the ternary chalcopyrite semiconductors CuAlS2, CuGaS2, CuInS2, CuAlSe2, CuGaSe2, and CuInSe2. Phys. Rev. B 1983, 28, 5822. [Google Scholar] [CrossRef] [Green Version]
- Bhattacharyya, B.; Simlandy, A.K.; Chakraborty, A.; Rajasekar, G.P.; Aetukuri, N.B.; Mukherjee, S.; Pandey, A. Efficient photosynthesis of organics from aqueous bicarbonate ions by quantum dots using visible light. ACS Energy Lett. 2018, 3, 1508–1514. [Google Scholar] [CrossRef]
- Mukherjee, A.; Dutta, P.; Bhattacharyya, B.; Rajasekar, G.P.; Simlandy, A.K.; Pandey, A. Ultrafast spectroscopic investigation of the artificial photosynthetic activity of CuAlS2/ZnS quantum dots. Nano Sel. 2021, 2, 958–966. [Google Scholar] [CrossRef]
- Bhattacharyya, B.; Pandit, T.; Rajasekar, G.P.; Pandey, A. Optical transparency enabled by anomalous Stokes shift in visible light-emitting CuAlS2-based quantum dots. J. Phys. Chem. Lett. 2018, 9, 4451–4456. [Google Scholar] [CrossRef]
- Donnay, G.; Corliss, L.; Donnay, J.; Elliott, N.; Hastings, J. Symmetry of magnetic structures: Magnetic structure of chalcopyrite. Phys. Rev. 1958, 112, 1917. [Google Scholar] [CrossRef]
- Woolley, J.; Lamarche, A.M.; Lamarche, G.; Quintero, M.; Swainson, I.; Holden, T. Low temperature magnetic behaviour of CuFeS2 from neutron diffraction data. J. Magn. Magn. Mater. 1996, 162, 347–354. [Google Scholar] [CrossRef]
- Pauling, L.; Brockway, L. The crystal structure of chalcopyrite CuFeS2. Z. Krist.-Cryst. Mater. 1932, 82, 188–194. [Google Scholar] [CrossRef]
- Hu, J.; Lu, Q.; Deng, B.; Tang, K.; Qian, Y.; Li, Y.; Zhou, G.; Liu, X. A hydrothermal reaction to synthesize CuFeS2 nanorods. Inorg. Chem. Commun. 1999, 2, 569–571. [Google Scholar] [CrossRef]
- Todd, E.; Sherman, D.; Purton, J. Surface oxidation of chalcopyrite (CuFeS2) under ambient atmospheric and aqueous (pH 2–10) conditions: Cu, Fe L-and O K-edge X-ray spectroscopy. Geochim. Cosmochim. Acta 2003, 67, 2137–2146. [Google Scholar] [CrossRef]
- Mikhlin, Y.; Tomashevich, Y.; Tauson, V.; Vyalikh, D.; Molodtsov, S.; Szargan, R. A comparative X-ray absorption near-edge structure study of bornite, Cu5FeS4, and chalcopyrite, CuFeS2. J. Electron Spectrosc. Relat. Phenom. 2005, 142, 83–88. [Google Scholar] [CrossRef]
- Boekema, C.; Krupski, A.; Varasteh, M.; Parvin, K.; Van Til, F.; Van Der Woude, F.; Sawatzky, G. Cu and Fe valence states in CuFeS2. J. Magn. Magn. Mater. 2004, 272, 559–561. [Google Scholar] [CrossRef]
- Pearce, C.; Pattrick, R.; Vaughan, D.; Henderson, C.; Van der Laan, G. Copper oxidation state in chalcopyrite: Mixed Cu d9 and d10 characteristics. Geochim. Cosmochim. Acta 2006, 70, 4635–4642. [Google Scholar] [CrossRef]
- Zaanen, J.; Sawatzky, G. The electronic structure and superexchange interactions in transition-metal compounds. Can. J. Phys. 1987, 65, 1262–1271. [Google Scholar] [CrossRef]
- Fujisawa, M.; Suga, S.; Mizokawa, T.; Fujimori, A.; Sato, K. Electronic structures of CuFeS2 and CuAl0.9Fe0.1S2 studied by electron and optical spectroscopies. Phys. Rev. B 1994, 49, 7155. [Google Scholar] [CrossRef]
- Sato, K.; Harada, Y.; Taguchi, M.; Shin, S.; Fujimori, A. Characterization of Fe 3d states in CuFeS2 by resonant X-ray emission spectroscopy. Phys. Status Solidi (A) 2009, 206, 1096–1100. [Google Scholar] [CrossRef]
- Ghosh, S.; Avellini, T.; Petrelli, A.; Kriegel, I.; Gaspari, R.; Almeida, G.; Bertoni, G.; Cavalli, A.; Scotognella, F.; Pellegrino, T.; et al. Colloidal CuFeS2 nanocrystals: Intermediate Fe d-band leads to high photothermal conversion efficiency. Chem. Mater. 2016, 28, 4848–4858. [Google Scholar] [CrossRef] [PubMed] [Green Version]
- Gaspari, R.; Della Valle, G.; Ghosh, S.; Kriegel, I.; Scotognella, F.; Cavalli, A.; Manna, L. Quasi-static resonances in the visible spectrum from all-dielectric intermediate band semiconductor nanocrystals. Nano Lett. 2017, 17, 7691–7695. [Google Scholar] [CrossRef] [PubMed]
- Bastola, E.; Bhandari, K.P.; Subedi, I.; Podraza, N.J.; Ellingson, R.J. Structural, optical, and hole transport properties of earth-abundant chalcopyrite (CuFeS2) nanocrystals. MRS Commun. 2018, 8, 970–978. [Google Scholar] [CrossRef]
- Kowalik, P.; Bujak, P.; Penkala, M.; Kotwica, K.; Kmita, A.; Gajewska, M.; Ostrowski, A.; Pron, A. Synthesis of CuFeS2−x Sex-alloyed nanocrystals with localized surface plasmon resonance in the visible spectral range. J. Mater. Chem. C 2019, 7, 6246–6250. [Google Scholar] [CrossRef]
- Sugathan, A.; Bhattacharyya, B.; Kishore, V.; Kumar, A.; Rajasekar, G.P.; Sarma, D.; Pandey, A. Why does CuFeS2 resemble gold? J. Phys. Chem. Lett. 2018, 9, 696–701. [Google Scholar] [CrossRef] [PubMed]
- Lee, S.; Ghosh, S.; Hoyer, C.E.; Liu, H.; Li, X.; Holmberg, V.C. Iron-content-dependent, quasi-static dielectric resonances and oxidative transitions in bornite and chalcopyrite copper iron sulfide nanocrystals. Chem. Mater. 2021, 33, 1821–1831. [Google Scholar] [CrossRef]
- Yao, Y.; Bhargava, A.; Robinson, R.D. Fe cations control the plasmon evolution in CuFeS2 nanocrystals. Chem. Mater. 2021, 33, 608–615. [Google Scholar] [CrossRef]
- Chen, P.; Qin, M.; Chen, H.; Yang, C.; Wang, Y.; Huang, F. Cr incorporation in CuGaS2 chalcopyrite: A new intermediate-band photovoltaic material with wide-spectrum solar absorption. Phys. Status Solidi (A) 2013, 210, 1098–1102. [Google Scholar] [CrossRef]
- Baltz, V.; Manchon, A.; Tsoi, M.; Moriyama, T.; Ono, T.; Tserkovnyak, Y. Antiferromagnetic spintronics. Rev. Mod. Phys. 2018, 90, 015005. [Google Scholar] [CrossRef] [Green Version]
- Gabka, G.; Zybała, R.; Bujak, P.; Ostrowski, A.; Chmielewski, M.; Lisowski, W.; Sobczak, J.W.; Pron, A. Facile Gram-Scale Synthesis of the First n-Type CuFeS2 Nanocrystals for Thermoelectric Applications. Eur. J. Inorg. Chem. 2017, 2017, 3150–3153. [Google Scholar] [CrossRef]
- Teranishi, T.; Sato, K.; Kondo, K. Optical properties of a magnetic semiconductor: Chalcopyrite CuFeS2: I. Absorption spectra of CuFeS2 and Fe-Doped CuAlS2 and CuGaS2. J. Phys. Soc. Jpn. 1974, 36, 1618–1624. [Google Scholar] [CrossRef]
- Liu, M.L.; Huang, F.Q.; Chen, L.D.; Wang, Y.M.; Wang, Y.H.; Li, G.F.; Zhang, Q. p-type transparent conductor: Zn-doped CuAlS2. Appl. Phys. Lett. 2007, 90, 072109. [Google Scholar] [CrossRef]
- Liu, M.L.; Huang, F.Q.; Chen, L.D. p-Type electrical conduction and wide optical band gap in Mg-doped CuAlS2. Scr. Mater. 2008, 58, 1002–1005. [Google Scholar] [CrossRef]
- Wang, T.; Li, X.; Li, W.; Huang, L.; Ma, C.; Cheng, Y.; Cui, J.; Luo, H.; Zhong, G.; Yang, C. Transition metals doped CuAlSe2 for promising intermediate band materials. Mater. Res. Express 2016, 3, 045905. [Google Scholar] [CrossRef] [Green Version]
- Yadav, R.; Bhattacharyya, B.; Saha, S.K.; Dutta, P.; Roy, P.; Rajasekar, G.P.; Narayan, A.; Pandey, A. Electronic Structure Insights into the Tunable Luminescence of CuAlxFe1−xS2/ZnS Nanocrystals. J. Phys. Chem. C 2021, 125, 2511–2518. [Google Scholar] [CrossRef]
- Sato, K. Chalcopyrite Crystals Doped with Transition Elements, Rare Earths, Ternary and Multinary Compounds in the 21st Century; IPAP: Tokyo, Japan, 2001; pp. 228–243. [Google Scholar]
- Navrátil, J.; Levinský, P.; Hejtmánek, J.; Pashchenko, M.; Knížek, K.; Kubíčková, L.; Kmječ, T.; Drašar, C. Peculiar magnetic and transport properties of CuFeS2: Defects play a key role. J. Phys. Chem. C 2020, 124, 20773–20783. [Google Scholar] [CrossRef]
- Shannon, R.D. Revised effective ionic radii and systematic studies of interatomic distances in halides and chalcogenides. Acta Crystallogr. Sect. A Cryst. Phys. Diffr. Theor. Gen. Crystallogr. 1976, 32, 751–767. [Google Scholar] [CrossRef]
- Ueng, H.; Hwang, H. The defect structure of CuInS2. part I: Intrinsic defects. J. Phys. Chem. Solids 1989, 50, 1297–1305. [Google Scholar] [CrossRef]
- Zhang, S.; Wei, S.H.; Zunger, A.; Katayama-Yoshida, H. Defect physics of the CuInSe2 chalcopyrite semiconductor. Phys. Rev. B 1998, 57, 9642. [Google Scholar] [CrossRef]
- Zhang, S.; Wei, S.H.; Zunger, A. Stabilization of ternary compounds via ordered arrays of defect pairs. Phys. Rev. Lett. 1997, 78, 4059. [Google Scholar] [CrossRef]
- Huang, D.; Persson, C. Stability of the bandgap in Cu-poor CuInSe2. J. Phys. Condens. Matter 2012, 24, 455503. [Google Scholar] [CrossRef] [PubMed]
- Harvie, A.J.; Booth, M.; Chantry, R.L.; Hondow, N.; Kepaptsoglou, D.M.; Ramasse, Q.M.; Evans, S.D.; Critchley, K. Observation of compositional domains within individual copper indium sulfide quantum dots. Nanoscale 2016, 8, 16157–16161. [Google Scholar] [CrossRef] [PubMed] [Green Version]
- Grau-Crespo, R.; Hamad, S.; Catlow, C.R.A.; De Leeuw, N. Symmetry-adapted configurational modelling of fractional site occupancy in solids. J. Phys. Condens. Matter 2007, 19, 256201. [Google Scholar] [CrossRef]
- Kühne, T.D.; Iannuzzi, M.; Del Ben, M.; Rybkin, V.V.; Seewald, P.; Stein, F.; Laino, T.; Khaliullin, R.Z.; Schütt, O.; Schiffmann, F.; et al. CP2K: An electronic structure and molecular dynamics software package—Quickstep: Efficient and accurate electronic structure calculations. J. Chem. Phys. 2020, 152, 194103. [Google Scholar] [CrossRef]
- Perdew, J.P.; Burke, K.; Ernzerhof, M. Generalized Gradient Approximation Made Simple. Phys. Rev. Lett. 1996, 77, 3865–3868. [Google Scholar] [CrossRef] [Green Version]
- VandeVondele, J.; Hutter, J. Gaussian basis sets for accurate calculations on molecular systems in gas and condensed phases. J. Chem. Phys. 2007, 127, 114105. [Google Scholar] [CrossRef] [Green Version]
- Hartwigsen, C.; Goedecker, S.; Hutter, J. Relativistic separable dual-space Gaussian pseudopotentials from H to Rn. Phys. Rev. B 1998, 58, 3641–3662. [Google Scholar] [CrossRef] [Green Version]
- Krack, M. Pseudopotentials for H to Kr optimized for gradient-corrected exchange-correlation functionals. Theor. Chem. Acc. 2005, 114, 145–152. [Google Scholar] [CrossRef] [Green Version]
- VandeVondele, J.; Hutter, J. An efficient orbital transformation method for electronic structure calculations. J. Chem. Phys. 2003, 118, 4365–4369. [Google Scholar] [CrossRef] [Green Version]
- Lany, S.; Zunger, A. Assessment of correction methods for the band-gap problem and for finite-size effects in supercell defect calculations: Case studies for ZnO and GaAs. Phys. Rev. B 2008, 78, 235104. [Google Scholar] [CrossRef]
- Larsen, A.H.; Mortensen, J.J.; Blomqvist, J.; Castelli, I.E.; Christensen, R.; Dułak, M.; Friis, J.; Groves, M.N.; Hammer, B.; Hargus, C.; et al. The atomic simulation environment—A Python library for working with atoms. J. Phys. Condens. Matter 2017, 29, 273002. [Google Scholar] [CrossRef] [PubMed] [Green Version]
- Sato, K.; Ishii, K.; Watanabe, K.W.K.; Ohe, K.O.K. Time-Resolved Photoluminescence Spectra in Single Crystals of CuAlS2:Mn. Jpn. J. Appl. Phys. 1991, 30, 307. [Google Scholar] [CrossRef]
- Perdew, J.P. Density Functional Theory and the Band Gap Problem. Int. J. Quantum Chem. 1985, 28, 497–523. [Google Scholar] [CrossRef]
- Lide, D.R. Handbook of Chemistry and Physics, 80th ed.; CRC Press: Boca Raton, FL, USA, 2002. [Google Scholar]
- Mahmood, Q.; Hassan, M.; Noor, N. Theoretical Study of Electronic, Magnetic, and Optical Response of Fe-doped ZnS: First-Principle Approach. J. Supercond. Nov. Magn. 2017, 30, 1463–1471. [Google Scholar] [CrossRef]
- Adachi, S. Properties of Semiconductor Alloys: Group-IV, III-V and II-VI Semiconductors; John Wiley & Sons: Hoboken, NJ, USA, 2009. [Google Scholar]
- Ahn, K.; Kim, M.G.; Park, S.; Ryu, B. Entropy stabilized off-stoichiometric cubic γ-Cu1-xIx phase containing high-density Cu vacancies. AIP Adv. 2021, 11, 095018. [Google Scholar] [CrossRef]
- Yao, J.; Wang, Z.; van Tol, J.; Dalal, N.S.; Aitken, J.A. Site preference of manganese on the copper site in Mn-substituted CuInSe2 chalcopyrites revealed by a combined neutron and X-ray powder diffraction study. Chem. Mater. 2010, 22, 1647–1655. [Google Scholar] [CrossRef]


| Effective Ionic Radius, Å | |
|---|---|
| Cu | 0.60 |
| Fe | 0.49 |
| Al | 0.39 |
| Defect Formation Energy, eV | |
|---|---|
| 2.789 | |
| 0.471 | |
| 4.112 | |
| 3.559 |
Publisher’s Note: MDPI stays neutral with regard to jurisdictional claims in published maps and institutional affiliations. |
© 2022 by the authors. Licensee MDPI, Basel, Switzerland. This article is an open access article distributed under the terms and conditions of the Creative Commons Attribution (CC BY) license (https://creativecommons.org/licenses/by/4.0/).
Share and Cite
Dickens, C.; Kinsella, A.O.J.; Watkins, M.; Booth, M. The Presence of Charge Transfer Defect Complexes in Intermediate Band CuAl1−pFepS2. Crystals 2022, 12, 1823. https://doi.org/10.3390/cryst12121823
Dickens C, Kinsella AOJ, Watkins M, Booth M. The Presence of Charge Transfer Defect Complexes in Intermediate Band CuAl1−pFepS2. Crystals. 2022; 12(12):1823. https://doi.org/10.3390/cryst12121823
Chicago/Turabian StyleDickens, Christopher, Adam O. J. Kinsella, Matt Watkins, and Matthew Booth. 2022. "The Presence of Charge Transfer Defect Complexes in Intermediate Band CuAl1−pFepS2" Crystals 12, no. 12: 1823. https://doi.org/10.3390/cryst12121823
APA StyleDickens, C., Kinsella, A. O. J., Watkins, M., & Booth, M. (2022). The Presence of Charge Transfer Defect Complexes in Intermediate Band CuAl1−pFepS2. Crystals, 12(12), 1823. https://doi.org/10.3390/cryst12121823