Article

Effect of Short-Range Ordering on the Grain Boundary Character Distribution Optimization of FCC Metals with High Stacking Fault Energy: A Case Study on Ni-Cr Alloys

1
Department of Materials Physics and Chemistry, School of Materials Science and Engineering, Northeastern University, Shenyang 110819, China
2
Key Laboratory for Anisotropy and Texture of Materials, Ministry of Education, Northeastern University, Shenyang 110819, China
*
Author to whom correspondence should be addressed.
Crystals 2022, 12(12), 1822; https://doi.org/10.3390/cryst12121822
Submission received: 14 November 2022 / Revised: 10 December 2022 / Accepted: 12 December 2022 / Published: 14 December 2022
(This article belongs to the Special Issue Advances in High Strength Steels)

Abstract

:
The critical roles of short-range ordering (SRO) in the grain boundary character distribution (GBCD) optimization of Ni-Cr alloys with high stacking fault energies were experimentally studied by thermomechanical treatments. It is found that, with the enhancement of the SRO degree (or the increase in Cr content), the dislocation slip mode changes from wavy slip to planar slip, and even deformation twins (DTs) appear in the cold-rolled Ni-40at.%Cr alloy. Within the lower level of Cr content (≤20 at.%), the optimized result of GBCD is conspicuous with the increase in Cr content. As the Cr content is higher than 20 at.%, the GBCD optimization of Ni-Cr alloys cannot be further enhanced, since the cold rolling induced DTs would hinder the growth of twin related domains during subsequent annealing.

1. Introduction

As is well known, the grain boundary character distribution (GBCD) optimization (otherwise named grain boundary engineering, GBE) generally presents obvious advantages in improving grain boundary-related properties, e.g., intergranular corrosion [1,2], intergranular stress corrosion cracking [3], high-temperature tension [4] and low cycle fatigue properties [5] of face-centered cubic (FCC) metal materials. Through a proper thermomechanical treatment, a large number of annealing twins (ATs) would be nucleated to increase the fraction of special grain boundaries (Σ ≤ 29, fSBs), which effectively blocks the network connectivity of random high angle grain boundaries (RHAGBs) and naturally facilitates the realization of the GBCD optimization. Thus, many previous studies [6,7,8] found that the optimization of GBCD can be realized only for materials with low stacking fault energy (SFE), since the low SFE is beneficial to exciting the nucleation of ATs in large quantities. However, our recent studies [9,10] have found that the nucleation of ATs is mainly introduced by the planar-slip dislocation structures in deformed microstructures. Specifically, the GBE quantifying parameters of Cu-16at.%Al alloy and AL6XN austenitic stainless steel were significantly improved by a reasonable annealing treatment after planar-slip dislocation structures were introduced by mechanical deformation. Therefore, taking the dislocation slip mode into key account might provide an insight into the design for GBCD optimization of materials with high SFE.
Coincidently, Han et al. and Zhang et al. [11,12,13] found that increasing the short-range ordering (SRO) degree in high SFE materials (Cu-Mn alloys and Ni-Cr alloys) by alloying design can accelerate the generation of planar-slip dislocations. Furthermore, Gerold and Karnthaler [14,15] also suggested that SRO played an active role in slip planarity of dislocations in FCC metals, which mainly resulted from the “glide plane softening” effect. To be specific, when the leading dislocation destroys the SRO structure on the slip plane, an antiphase domain boundary will be formed, which will lead to an increase in energy. In order to avoid a further increase in system energy, the subsequent dislocations will move along to the leading dislocation, which inhibits the cross-slip of dislocations and promotes the generation of dislocation planar slip. In short, increasing the SRO degree in high SFE materials contributes to enhancing the slip planarity of dislocations, which is conductive to promoting the nucleation of ATs. Here, a question is thus raised: could the optimization of GBCD in materials with high SFE be achieved by increasing the SRO degree? It still remains an issue and is worthy of further exploration.
Therefore, the present work designs a series of high SFE Ni-Cr alloys (≥75 mJ/m2) [16,17] with different SRO degrees, and different thermomechanical treatments are implemented on these target alloys, to clarify whether the SRO degree in high SFE FCC alloys would have a positive effect on the GBCD optimization.

2. Materials and Methods

Three kinds of Ni-xCr alloys (x = 5, 20, 40 at.%) were adopted as the target materials. The SFE and SRO degrees of three Ni-Cr alloys and pure Ni are shown in Table 1 [16,17,18]. These three Ni-Cr alloys ingots were first manufactured by vacuum induction furnace with high purity Ni and Cr. Subsequently, the ingots were hot forged into plates with a thickness of 20 mm, which were then thinned by five hot rolls at 900–1200 °C to a thickness of 10 mm. In order to obtain the base samples (BM) with a suitable grain size, these 10 mm plates were cold rolled with a large deformation of 50% to 70% and then annealed under different conditions. Specifically, the Ni-5at.%Cr alloy with large deformation was annealed at 800 °C for 3 min, the Ni-20at.%Cr alloy at 900 °C for 20 min and the Ni-40at.%Cr alloy at 900 °C for 180 min. Subsequently, the BM samples underwent different thermomechanical processes (TMP) to obtain the GBE samples with the same twin related domain (TRD) size. First, three BM samples were cold rolled with a small deformation of 7%. Then, the Ni-5at.%Cr, Ni-20at.%Cr and Ni-40at.%Cr alloys were annealed at 900 °C for 2 min, 45 min and 150 h, respectively. The preparation process of BM and GBE samples are shown in Figure 1.
The GBCDs of BM and TMPed samples were characterized by electron backscattering diffraction (EBSD). The samples for EBSD observations were processed in accordance with the metallographic sample preparation standard. The surface was observed along the rolling direction–normal direction (RD–ND) plane. First, the surfaces were ground with #600–#2000 emery papers, and then mechanically polished to become a scratch free mirror. Afterwards, the samples were electrolytically polished to eliminate the stress generated in the polishing process. The composition of the polishing solution was HNO3: CH3OH = 1:2, and the electrolytic temperature and voltage were 5–10 °C and 10 V, respectively. Finally, the GBCD of samples was examined by orientation image microscopy (OIM) system attached in a JSM 7001F field emission scanning electron microscope (SEM). The EBSD test was performed under an acceleration voltage of 20 kV, an acquisition speed of 28.68 Hz and a sample tilt of 70°. The scanning step of 1 µm was adopted according to the grain size of the experimental alloys. The binning of the EBSD camera was 4 × 4.
With the aim of investigating the effect of deformation microstructures on the GBCD optimization of Ni-Cr alloys, 7% cold-rolled samples were observed by an FEI Tecnai G220 transmission electron microscope (TEM) operated at 200 kV. The TEM samples with the initial thickness of 0.5 mm taken from a plane perpendicular to the rolling transverse phase were firstly ground to 0.1 mm with #600–#2000 emery papers, and further ground to ~50 μm by #2000 emery papers exquisitely. Finally, the samples for TEM observations were twin-jet electropolished with a solution of HClO4: C2H5OH = 1:9. The temperature for twin-jet electropolishing was −20 °C, and the operating voltage was 30 V.

3. Results

3.1. Microstructures of BM Samples

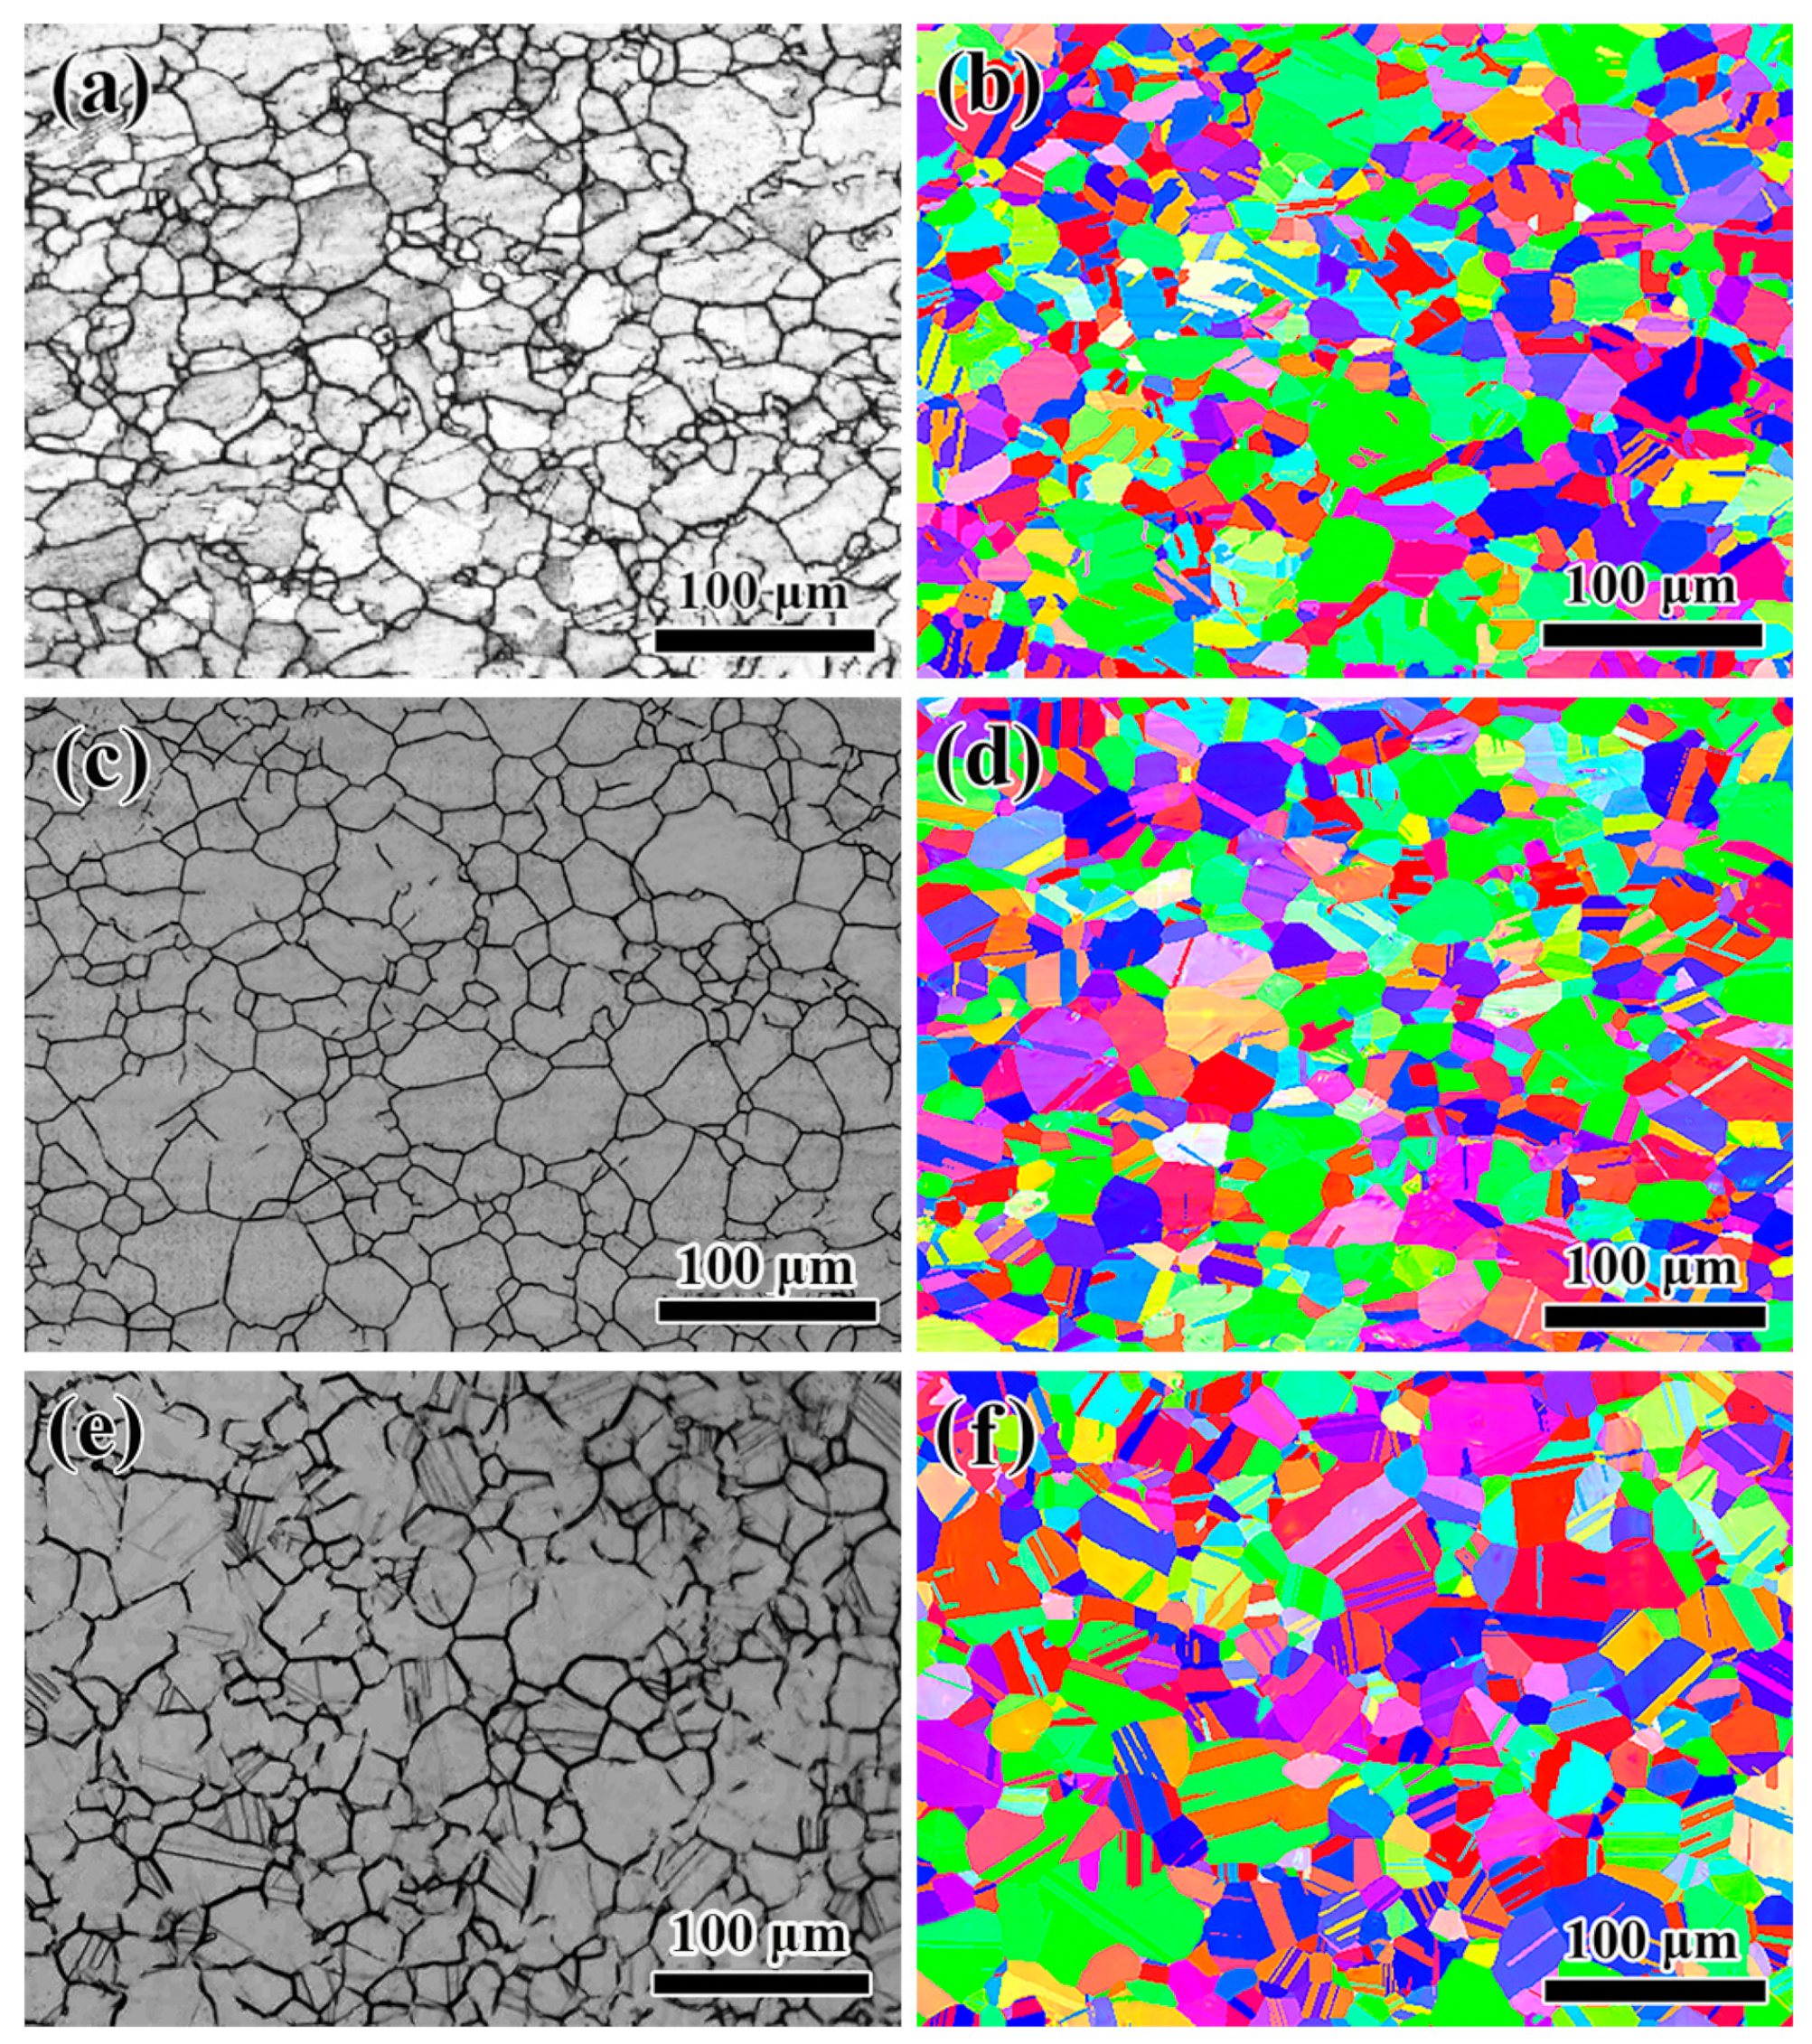
Figure 2 shows the optical microscopy (OM) images and the inverse pole figures (IPF) of the BM samples. With the purpose of excluding the influence of grain size on the opti-mization of GBCD, the average grain sizes of the three initial samples are unified at about 8 μm (Figure 2a,c,e). Furthermore, it can be clearly seen from OM images that almost no ATs are formed in the Ni-5at.%Cr and Ni-20at.%Cr alloys (Figure 2a,c), while some ATs can be observed in the Ni-40at.%Cr alloy (Figure 2e). The EBSD observation further reveals the microstructures of BM samples (Figure 2b,d,f). Obviously, they are mainly composed of equiaxed grains. The grain orientation of the BM samples is basically randomly distributed, and no texture occurs in these alloys (Figure 2b,d,f).
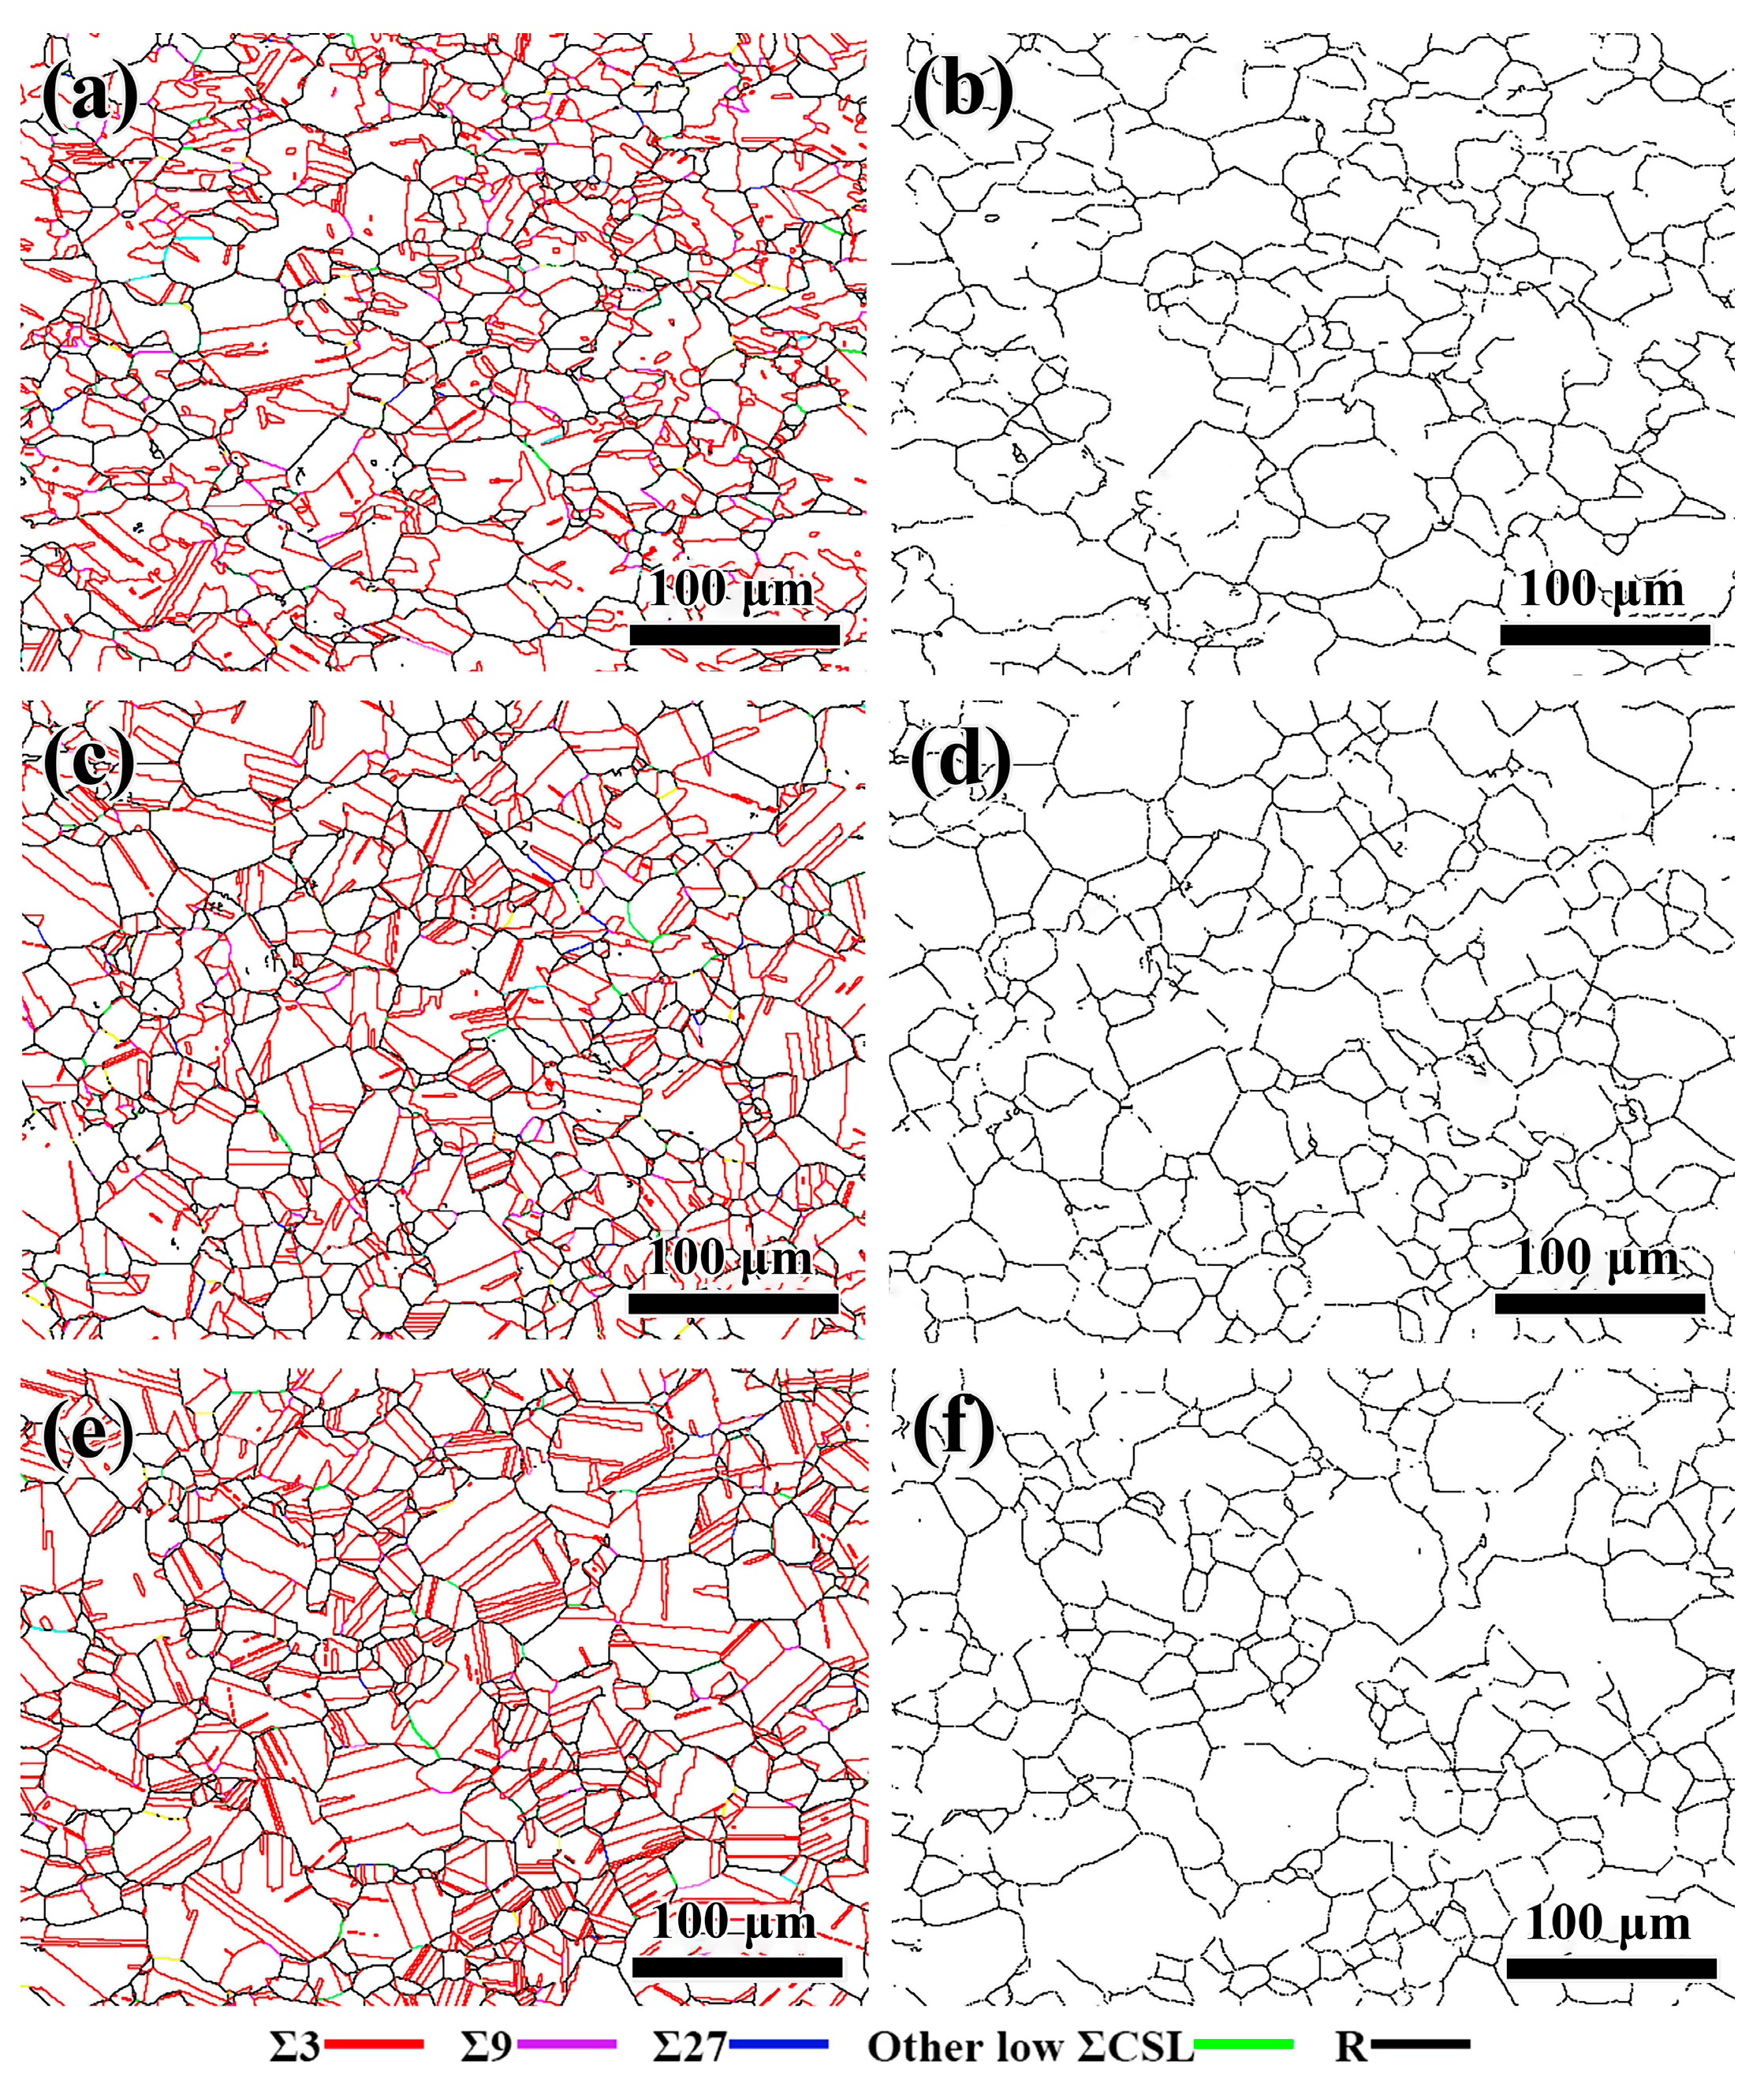
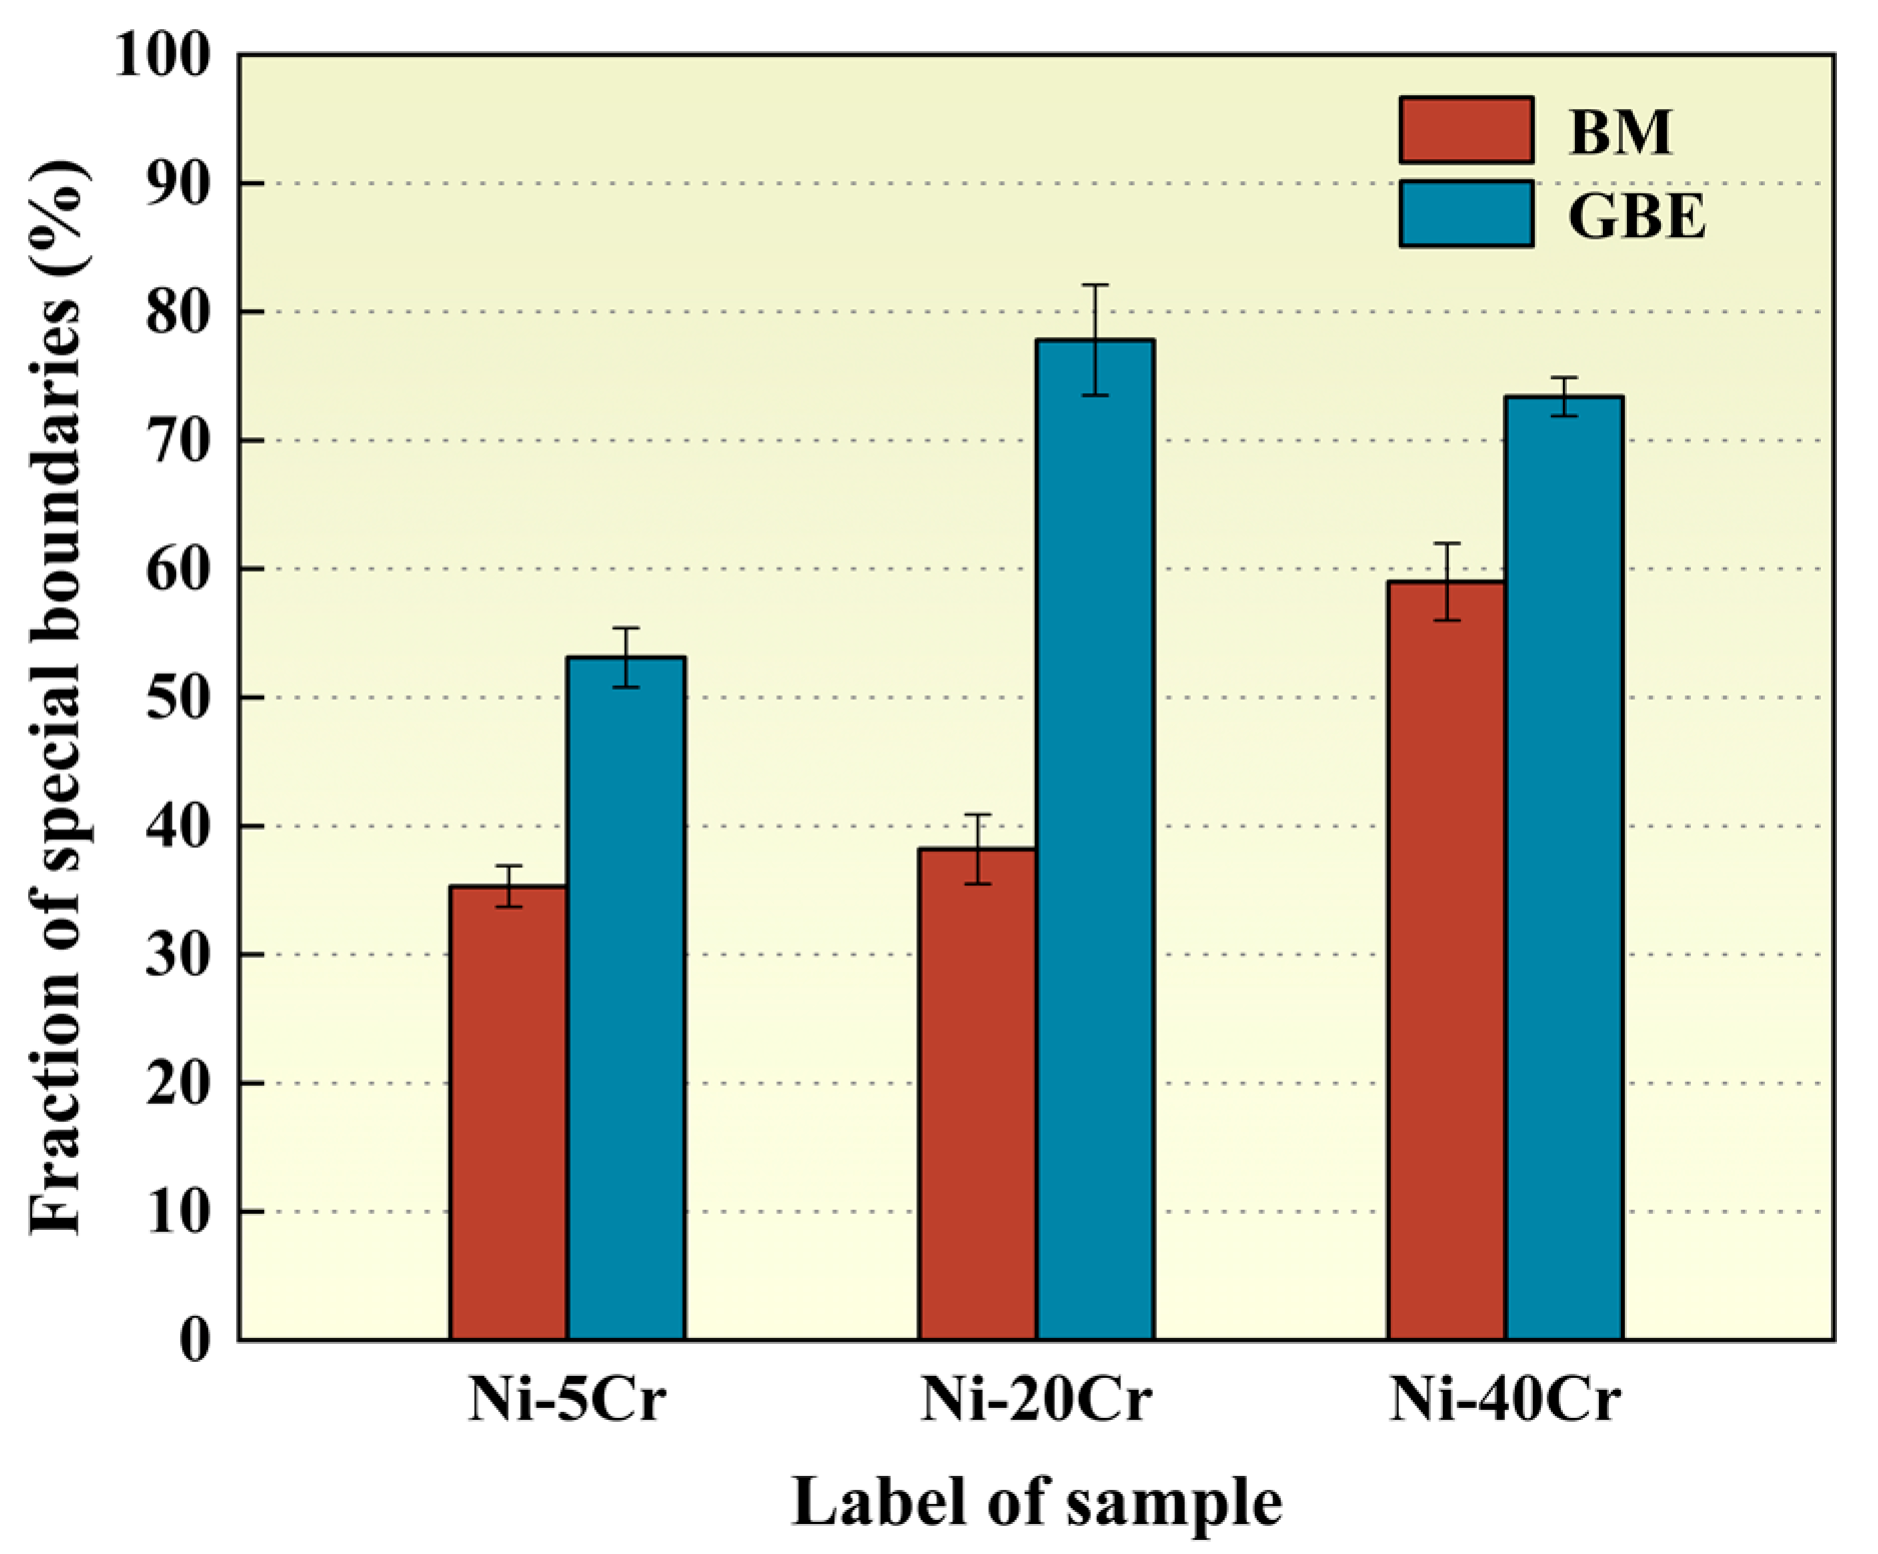
The reconstructed maps of GBCD and network connectivity of RHAGBs of these BM samples are shown in Figure 3. It can be seen that a certain number of special grain boundaries exist in these three Ni-Cr alloys, where Σ3 grain boundaries occupy the highest proportion. In addition, with the increase in Cr content, the proportion of parallel Σ3 grain boundaries (coherent twin boundaries) increases significantly (Figure 3a,c,e); however, these Σ3 coherent twin boundaries often cross the whole grain or end inside a grain, which cannot effectively block the connectivity of RHAGBs. The reconstructed network connectivity maps of RHAGBs also indicate that the RHAGBs in the BM samples are not well interrupted. They basically interconnect with each other, and form a well-connected grain boundary network (Figure 3b,d,f). In terms of the statistics, the proportions of special grain boundaries in BM samples of Ni-5at.%Cr, Ni-20at.%Cr and Ni-40at.%Cr alloys are 35.3% (±1.6%), 38.2% (±2.7%) and 59.0% (±3.0%), respectively, which are relatively low. Accordingly, the TRD size (~22 μm) of the three BM samples is also relatively small.

3.2. Microstructure of TMPed Samples

Figure 4 presents the IPF maps of the GBE samples. After TMP, the average grain size (ATs included) of GBE samples increases to ~18 μm. Similar to the BM samples, the grain orientation of the GBE samples is still randomly distributed, and there is no texture in the samples. It is worth noting that the permeable ATs are seldom formed in GBE samples, whereas the ones with different directions are crosswise contacted with each other, which is closely related to the GBE processes.
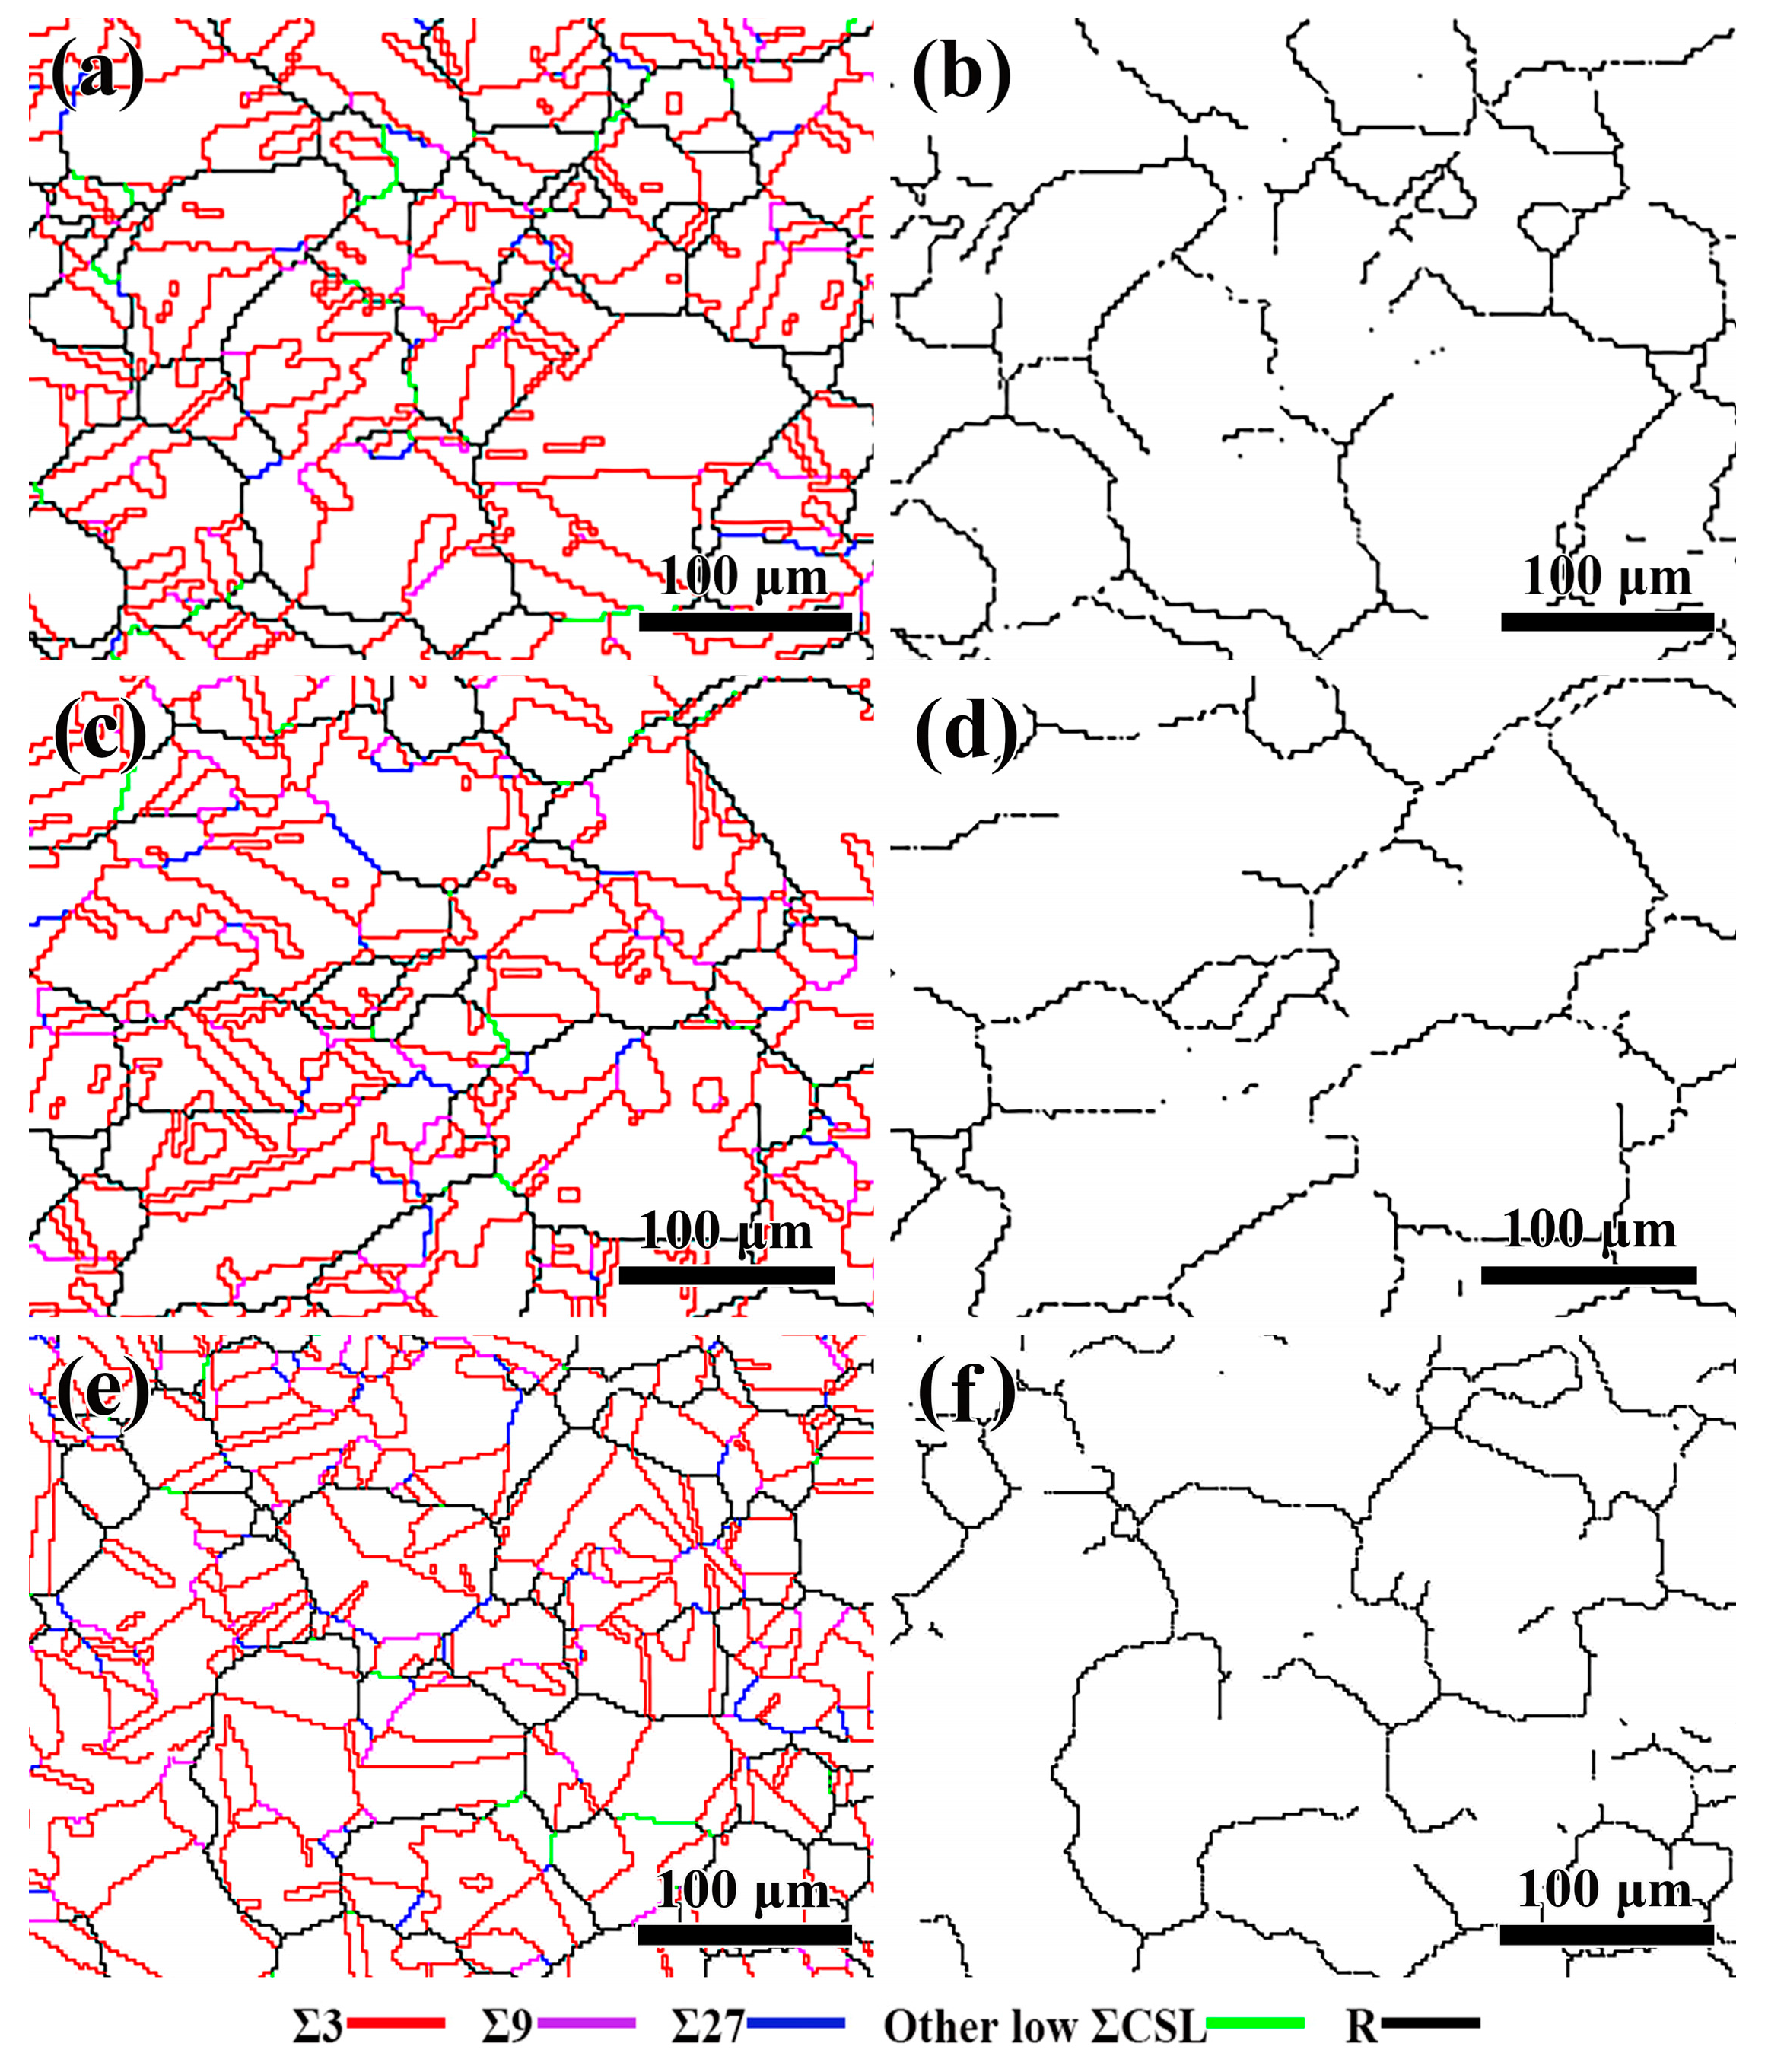
In order to further explore the evolution of GBCD during deformation and annealing, the maps of GBCD and RHAGBs network connectivity of GBE Ni-Cr alloy samples are reconstructed, as shown in Figure 5. Obviously, compared with BM samples, the proportion of Σ3-coherent twin boundaries running through the whole grain is significantly reduced. Besides, lots of special grain boundaries with low Σ values initiated at RHAGBs can be observed. In the process of TRD growth, Σ3-coherent twin boundaries react with each other to form other special grain boundaries, such as Σ9 and Σ27 boundaries. These special grain boundaries have a certain amount in the GBE samples (Figure 5a,c,e). Clearly, the connectivity of RHAGBs is effectively broken by these special grain boundaries, which thus plays a positive role in the GBCD optimization. After the GBE treatment, the size of TRD increases from ~22 μm to ~73 μm. Based on these statistics, the proportions of special grain boundaries in the GBEed Ni-5at.%Cr, Ni-20at.%Cr and Ni-40at.%Cr alloys are 53.1% (±2.3%), 77.8% (±4.3%) and 73.4% (±1.5%), respectively (Figure 5), which are significantly higher than those in the BM state.

3.3. Comparison of GBE Quantifying Parameters

To reveal the influence of SRO on the GBCD optimization of Ni-Cr alloys, statistical analyses on the variation trend of each GBE signifying parameter are carried out. As the Cr content increases to 20%, the fraction of special grain boundaries increases to a peak value, indicating that the improvement of SRO degree is beneficial for the GBCD optimization. When the Cr content exceeds 20%, the excitation of a special grain boundary ratio reaches a relatively stable state. In addition, the proportion of special grain boundaries in the Ni-40at.%Cr alloy reaches a high state even after a simple solution treatment (Figure 6), and it rises to 73.4% after GBE treatment, which demonstrates that the formation of ATs is relatively easier in the Ni-40at.%Cr alloy.
Apart from the fraction of special grain boundaries, the ratio v of TRD size to the grain size and the ratio of fJ2/(1-fJ3) are also important evaluation parameters for the GBCD optimization [8,19]. The ratio v is a criterion to evaluate the number of grains connected by Σ3n special grain boundaries in a large cluster and, the larger the value of v, the better the GBCD optimization is [8]. The ratio of fJ2/(1-fJ3) can reflect the blocking effect of the special grain boundaries on the RHAGBs. It should be noted that the fJ2 and fJ3 represent the proportion of two and three special grain boundaries in the triple-junctions, respectively, and the higher ratio of fJ2/(1-fJ3) means the better blocking effect of the special grain boundaries on the RHAGBs [20]. After a series of GBE treatments, the v values of Ni-5at.%Cr, Ni-20at.%Cr and Ni-40at.%Cr alloys increase from 2.8, 2.3 and 2.6 in BM samples to 3.6, 4.2 and 4.0 in GBE samples, respectively (Figure 7a). The ratios of fJ2/(1-fJ3) increase from 0.14, 0.13 and 0.09 in BM samples to 0.26, 0.30 and 0.32 in GBE samples (Figure 7b). Accordingly, both signifying parameters of grain boundary optimization are improved, indicating that the GBCD optimization of high SFE Ni-Cr alloys has been realized after proper thermomechanical treatment.

3.4. Deformation Microstructures of Cold-Rolled Ni-Cr Alloys

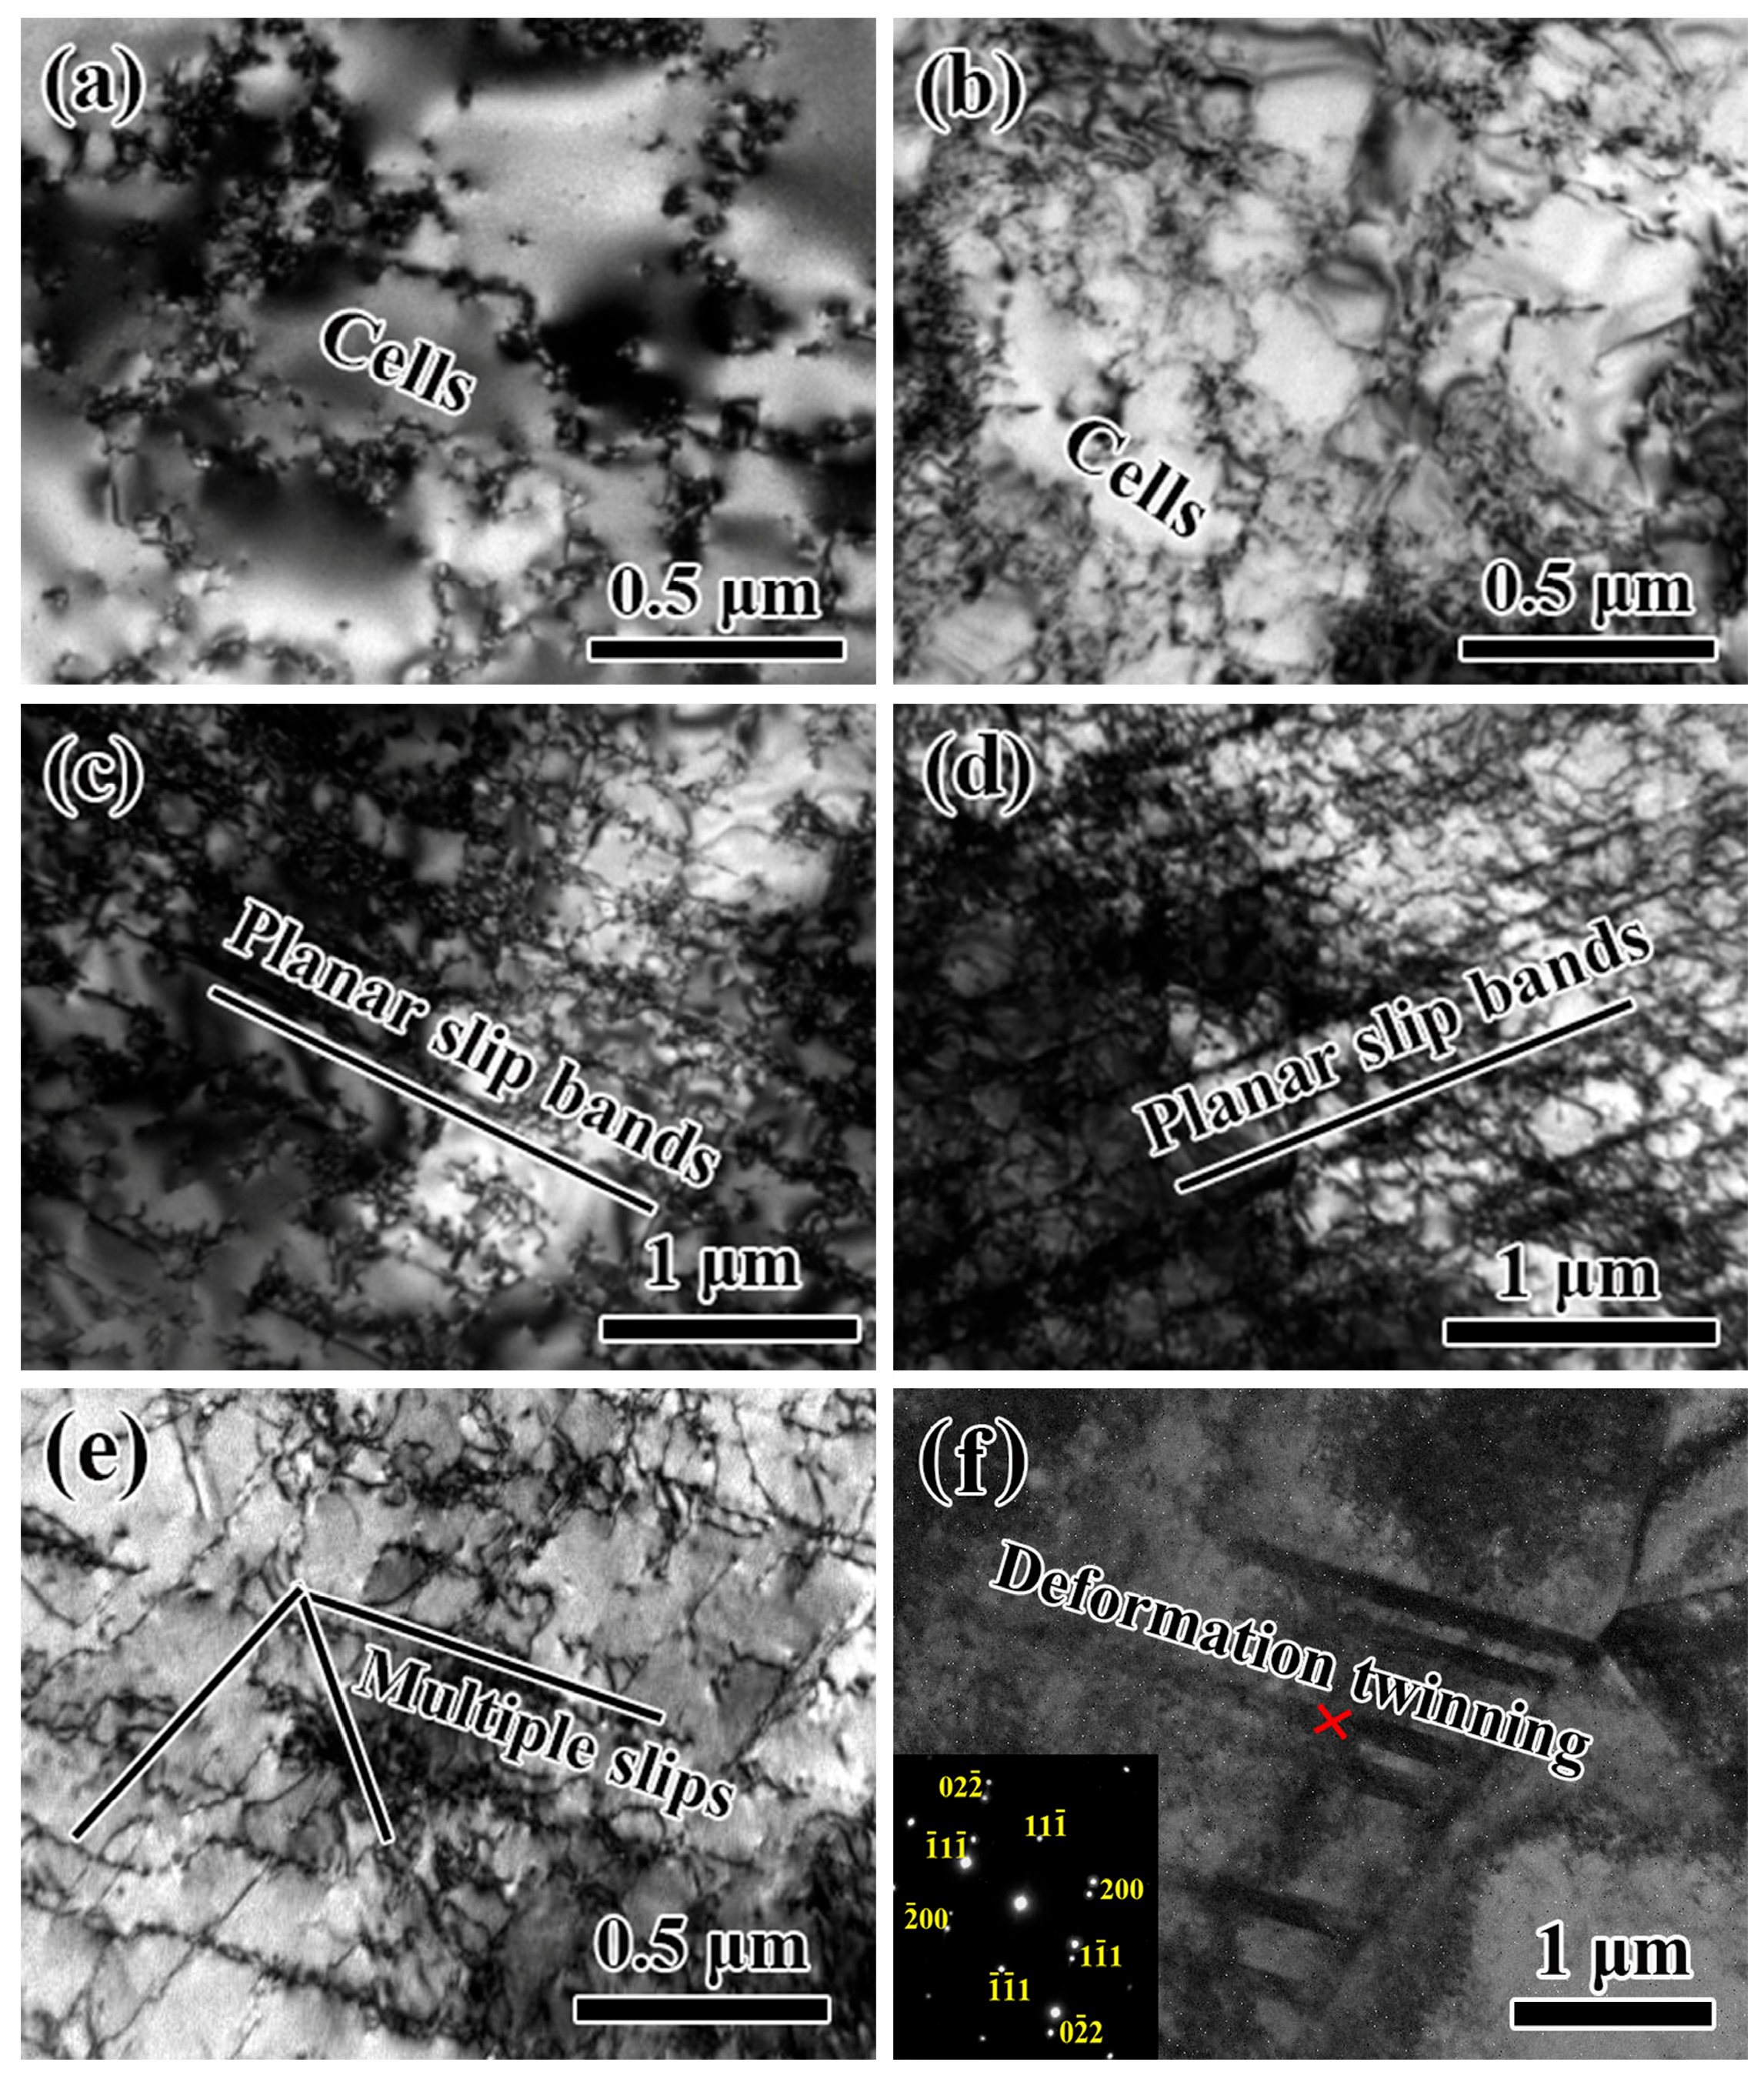
In order to explore the influence of deformation microstructures on the GBCD optimization of Ni-Cr alloys, TEM observations were performed to show the microstructures of three Ni-Cr alloys after 7% cold rolling. Apparently, the dislocation configuration of the Ni-5at.%Cr alloy is dominated by dislocation cells (Figure 8a,b). It should be attributed to the high SFE and the low SRO degree of the Ni-5at.%Cr alloy (Table 1) [14,20], which induce easier cross slip of dislocations. For the Ni-20at.%Cr alloy, a large number of planar slip bands are formed (Figure 8c,d). As the Cr content reaches 40%, the slip planarity of dislocations becomes more remarkable, e.g., multiple planar slip systems are operated (Figure 8e). Interestingly, deformation twins (DTs) are even observed in the Ni-40at.%Cr alloy (Figure 8f), indicating that the increase in SRO degree plays a positive role on the formation of planar slip dislocation structures and DTs.

4. Discussion

In the present work, the SRO degree of Ni-Cr alloys increases with the addition of Cr element, but the SFE remains almost unchanged. In this case, the GBCD optimization parameters of Ni-Cr alloys show a trend of rapid increasing and then stabilizing. Clearly, such a trend is closely related to the increase in SRO degree.

4.1. Influence of SRO on Dislocation Slip Mode

Most of the previous studies on GBCD optimization are focused on the materials, in which the deformation mode is dominated by dislocation planar slip [6,7,8,21]. In these studies, the planar dislocation configurations in pre-deformed microstructures are beneficial for the ATs nucleation, thereby promoting the GBCD optimization in such materials. Hence, it is generally believed that these advantages profit from the low SFE of the materials. However, the SFE is not the only factor affecting the dislocation slip mode in FCC alloys, and the key role of SRO seems to be ignored [22]. Previous studies have shown that, when solute atoms are induced into the matrix, they do not randomly distribute in the matrix, but tend to form SRO structures at the atomic level in the system [23]. Moreover, the degree of SRO in alloys increases with the increase in alloying content. Gerold and Karnthaler [12] show that, although the SFE in some alloy systems is very high, the dislocation slip mode is still dominated by planar slip as the first SRO parameter −α1 = 0.5 ± 0.1 (−α1 reflects the SRO degree). Therefore, besides lowering SFE, increasing the SRO degree of alloys is also a feasible way to increase the planarity of dislocation slip. For instance, Han et al. [24] indicated that increasing Mn content in Cu-Mn alloys can improve the SRO degree of the alloy, thus increasing the planarity of dislocation slip, and improving the work hardening capacity of Cu-Mn alloys. For Ni-Cr alloys, with the increasing of Cr content, the SRO degree of Ni-Cr alloys also gradually increases and the SFE is almost unchanged (Table 1) [16,17,18]. Therefore, with the increase in Cr content, the dislocation slip mode changes from wavy slip to planar slip (Figure 8).

4.2. Influence of Planar Slip on GBCD Optimization

It is well known that the planar slip dislocation structures in the pre-deformed microstructure are beneficial to increasing the proportion of ATs in the thermomechanical treatment process, thus promoting the GBCD optimization of the material [9,10]. In the process of TRD evolution, the RHAGBs migrate from a recrystallized structure to a deformed structure driven by strain storage energy. Upon encountering the planar slip band, it will react with planar slip dislocations and make the atomic arrangement sequence change from ···ABC··· to the contrary ···CBA···. Thus, the ATs are induced behind the RHAGBs and grow up with the migration of RHAGB [25,26,27]. With the growth of TRD, the number of formed ATs increases, and the ATs with different orientations will react with each other behind the RHAGB to form other low Σ coincidence site lattice (CSL) grain boundaries. For example, CSL grain boundaries occur at triple junctions by the following reactions: Σ3 + Σ3 = Σ9 or Σ3 + Σ9 = Σ3/Σ27 [28]. The full evolution of TRD increases the proportion of Σ3n special grain boundaries in grain boundaries (special grain boundaries and RHAGBs), thereby better blocking the connectivity of RHAGB network and enhancing the optimization effect of GBCD.
After the GBE treatment, the grain size of these three Ni-Cr alloys increases by about 2 times, and the TRD size increases by almost 3.5 times, indicating that the internal stress level of the BM Ni-Cr alloys reaches a suitable state after a 7% cold rolling deformation, and it can provide a sufficient driving force for the migration of the grain boundary during the annealing process and consequently for the evolution of TRD. Certainly, this must be attributed to the significant change in the SRO degree from a very low level in the Ni-5at.%Cr alloy to a higher level in the Ni-20at.%Cr alloy (Table 1). The Ni-5at.%Cr alloy only exhibits a wavy slip characteristic due to its extremely low SRO degree and relatively high SFE (Figure 8a,b). However, as the content of Cr increases to 20%, the SRO degree reaches a high level, which effectively inhibits the cross-slip of dislocations and promotes the appearance of a large number of planar slip dislocations (Figure 8c,d). Due to such a change in slip mode from wavy slip to planar slip, a mass of annealing twin boundaries can be induced, greatly increasing the proportion of special grain boundaries in the alloy during GBE treatment. As the Cr content increases from 20 at.% to 40 at.%, the SRO degree is continuously improved, and the planar slip becomes further enhanced (Figure 8e); in this case, the GBCD is also optimized, but the degree of GBCD optimization becomes lower. This phenomenon can also be reflected from the variation of the v value and fJ2/(1-fJ3) ratio (Figure 7a,b). Moreover, many DTs are observed in the Ni-40at.%Cr alloy (Figure 8f), indicating that the 7% cold-rolling deformation reaches the minimum driving force for the nucleation of DTs and the increase in SRO is conducive to the initiation of DTs in Ni-Cr alloys. It has been confirmed [9,10] that the TRD growth can be hindered by DTs during the annealing process. Since the structure of DTs is relatively stable, the migration of RHAGBs is hindered by the stable DTs during TRD growth, which will limit the growth of TRD and thus inhibit the effect of GBCD optimization. That is to say, the hinderance of TRD growth by DTs is detrimental to the GBCD optimization of the Ni-40at.%Cr alloy, so that the GBCD cannot be further optimized as the Cr content increases from 20 at.% to 40 at.%.

5. Conclusions

In summary, even for some high SFE FCC metals, as is the case for Ni-Cr alloys, their GBCD can also be well optimized by a suitable thermomechanical treatment, provided the slip mode is dominated by planar slip of dislocations. Specifically, for the present Ni-Cr alloys, as the Cr content is within a lower level (≤20 at.%), the SRO degree of Ni-Cr alloys increases significantly with the increase in Cr content, and the dislocation slip mode changes from wavy slip to planar slip; in this case, the GBCD can be greatly optimized. As the Cr content increases to a high level (>20 at.%), the increase in SRO degree cannot further improve the GBCD optimization of Ni-Cr alloys, because the DTs formed under cold-rolling deformation would hinder the TRD growth during the subsequent process of annealing.

Author Contributions

Conceptualization, X.L.; methodology, X.L. and X.G.; validation, Y.L.; formal analysis, Y.L.; investigation, Y.L.; resources, X.L., X.G. and Y.Z.; writing—original draft preparation, Y.L., X.G. and Y.Z.; writing—review and editing, X.L., X.G., Y.Z., Z.J. and S.L.; visualization, X.L., X.G. and Y.Z.; supervision, X.L., X.G. and Y.Z.; project administration, Y.L., X.G. and Y.Z.; funding acquisition, X.L. All authors have read and agreed to the published version of the manuscript.

Funding

This research was funded by National Natural Science Foundation of China under grant numbers 51871048 and 52171108, and also by Fundamental Research Funds for the Central University under grant number N2002014.

Data Availability Statement

The raw/processed data required to reproduce these findings cannot be shared at this time as the data also forms part of an ongoing study.

Acknowledgments

Special thanks are also due to the instrumental or data analysis from Analytical and Testing Center, Northeastern University, China.

Conflicts of Interest

The authors declare no conflict of interest.

References

  1. Kobayashi, S.; Kobayashi, R.; Watanabe, T. Control of grain boundary connectivity based on fractal analysis for improvement of intergranular corrosion resistance in SUS316L austenitic stainless steel. Acta Mater. 2016, 102, 397–405. [Google Scholar] [CrossRef]
  2. Liu, T.G.; Xia, S.; Du, D.H.; Bai, Q.; Zhang, L.F.; Lu, Y.H. Grain boundary engineering of large-size 316 stainless steel via warm-rolling for improving resistance to intergranular attack. Mater. Lett. 2019, 234, 201–204. [Google Scholar] [CrossRef]
  3. Telang, A.; Gill, A.S.; Kumar, M.; Teysseyre, S.; Qian, D. Iterative thermomechanical processing of alloy 600 for improved resistance to corrosion and stress corrosion cracking. Acta Mater. 2016, 113, 180–193. [Google Scholar] [CrossRef] [Green Version]
  4. Guan, X.J.; Shi, F.; Ji, H.M.; Li, X.W. A possibility to synchronously improve the high-temperature strength and ductility in face-centered cubic metals through grain boundary engineering. Scr. Mater. 2020, 187, 216–220. [Google Scholar] [CrossRef]
  5. Guan, X.J.; Jia, Z.P.; Liang, S.M.; Shi, F.; Li, X.W. A pathway to improve low-cycle fatigue life of face-centered cubic metals via grain boundary engineering. J. Mater. Sci. Technol. 2022, 113, 82–89. [Google Scholar] [CrossRef]
  6. Shimada, M.; Kokawa, H.; Wang, Z.J.; Sato, Y.S.; Karibe, I. Optimization of grain boundary character distribution for intergranular corrosion resistant 304 stainless steel by twin-induced grain boundary engineering. Acta Mater. 2002, 50, 2331–2341. [Google Scholar] [CrossRef]
  7. Lehockey, E.M.; Brennenstuhl, A.M.; Thompson, I. On the relationship between grain boundary connectivity, coincident site lattice boundaries, and intergranular stress corrosion cracking. Corros. Sci. 2004, 46, 2383–2404. [Google Scholar] [CrossRef]
  8. Barr, C.M.; Leff, A.C.; Demott, R.W.; Doherty, R.D.; Taheri, M.L. Unraveling the origin of twin related domains and grain boundary evolution during grain boundary engineering. Acta Mater. 2018, 144, 281–291. [Google Scholar] [CrossRef]
  9. Guan, X.J.; Shi, F.; Ji, H.M.; Li, X.W. Gain boundary character distribution optimization of Cu-16at.%Al alloy by thermomechanical process: Critical role of deformation microstructure. Mater. Sci. Eng. A 2019, 765, 138299. [Google Scholar] [CrossRef]
  10. Guan, X.J.; Shi, F.; Jia, Z.P.; Li, X.W. Grain boundary engineering of AL6XN super-austenitic stainless steel: Distinctive effects of planar-slip dislocations and deformation twins. Mater. Charact. 2020, 170, 110689. [Google Scholar] [CrossRef]
  11. Han, D.; Wang, Z.Y.; Yan, Y.; Shi, F.; Li, X.W. A good strength-ductility match in Cu-Mn alloys with high stacking fault energies: Determinant effect of short range ordering. Scr. Mater. 2017, 133, 59–64. [Google Scholar] [CrossRef]
  12. Han, D.; Zhang, Y.J.; Li, X.W. A crucial impact of short-range ordering on the cyclic deformation and damage behavior of face-centered cubic alloys: A case study on Cu-Mn alloys. Acta Mater. 2021, 205, 116559. [Google Scholar] [CrossRef]
  13. Zhang, Y.J.; Han, D.; Li, X.W. A unique two-stage strength-ductility match in low solid-solution hardening Ni-Cr alloys: Decisive role of short range ordering. Scr. Mater. 2020, 178, 269–273. [Google Scholar] [CrossRef]
  14. Gerold, V.; Karnthaler, H.P. On the origin of planar slip in f.c.c. alloys. Acta Metall. 1989, 37, 2177–2183. [Google Scholar] [CrossRef]
  15. Pfeiler, W. Investigation of short-range order by electrical resistivity measurement. Acta Metall. 1988, 36, 2417–2434. [Google Scholar] [CrossRef]
  16. Clément, N.; Coulomb, P. Energies de défaut d’empilement et mécanismes de déformation dans les alliages nickel-chrome. Philos. Mag. A 1974, 30, 663–672. [Google Scholar] [CrossRef]
  17. Carter, C.B.; Holmes, S.M. The stacking-fault energy of nickel. Philos. Mag. A 2006, 35, 1161–1172. [Google Scholar] [CrossRef]
  18. Schwander, P.; Schönfeld, B.; Kostorz, G. Configurational energy change caused by slip in short-range ordered Ni-Mo. Phys. Status Solidi B 1992, 172, 73–85. [Google Scholar] [CrossRef]
  19. Cao, W.; Xia, S.; Bai, Q.; Zhang, W.Z.; Zhou, B.X.; Li, Z.J.; Jiang, L. Effects of initial microstructure on the grain boundary network during grain boundary engineering in Hastelloy N alloy. J. Alloys Compd. 2017, 704, 724–733. [Google Scholar] [CrossRef] [Green Version]
  20. Grace, F.I.; Inman, M.C. Influence of stacking fault energy on dislocation configurations in shock-deformed metals. Metallography 1970, 3, 89–98. [Google Scholar] [CrossRef]
  21. Gallagher, P.C.J. The influence of alloying, temperature, and related effects on the stacking fault energy. Metall. Trans. 1970, 1, 2429–2461. [Google Scholar] [CrossRef]
  22. Wolf, K.; Gudladt, H.J.; Calderon, H.A. Transition between planar and wavy slip in cyclically deformed short-range ordered alloys. Acta Metall. Mater. 1994, 42, 3759–3765. [Google Scholar] [CrossRef]
  23. Pettinari-Sturmel, F.; Coujou, A.; Clément, N. The fluctuation of short-range order evidenced by mobile dislocations in the γ-phase of a nickel-based superalloy. Mater. Sci. Eng. A 2005, 400, 114–117. [Google Scholar] [CrossRef]
  24. Han, D.; Guan, X.J.; Yan, Y.; Shi, F.; Li, X.W. Anomalous recovery of work hardening rate in Cu-Mn alloys with high stacking fault energies under uniaxial compression. Mater. Sci. Eng. A 2019, 743, 745–754. [Google Scholar] [CrossRef]
  25. Rae, C.M.F.; Smith, D.A. On the mechanisms of grain boundary migration. Philos. Mag. A 1980, 41, 477–492. [Google Scholar] [CrossRef]
  26. Jhan, R.; Bristowe, P.D. A molecular dynamics study of grain boundary migration without the participation of secondary grain boundary dislocations. Scr. Metall. Mater. 1990, 24, 1313–1318. [Google Scholar] [CrossRef]
  27. Merkle, K.L.; Thompson, L.J.; Phillipp, F. In-situ HREM studies of grain boundary migration. Interface Sci. 2004, 12, 277–292. [Google Scholar] [CrossRef]
  28. Randle, V. Mechanism of twinning-induced grain boundary engineering in low stacking fault energy materials. Acta Mater. 1999, 47, 4187–4196. [Google Scholar] [CrossRef]
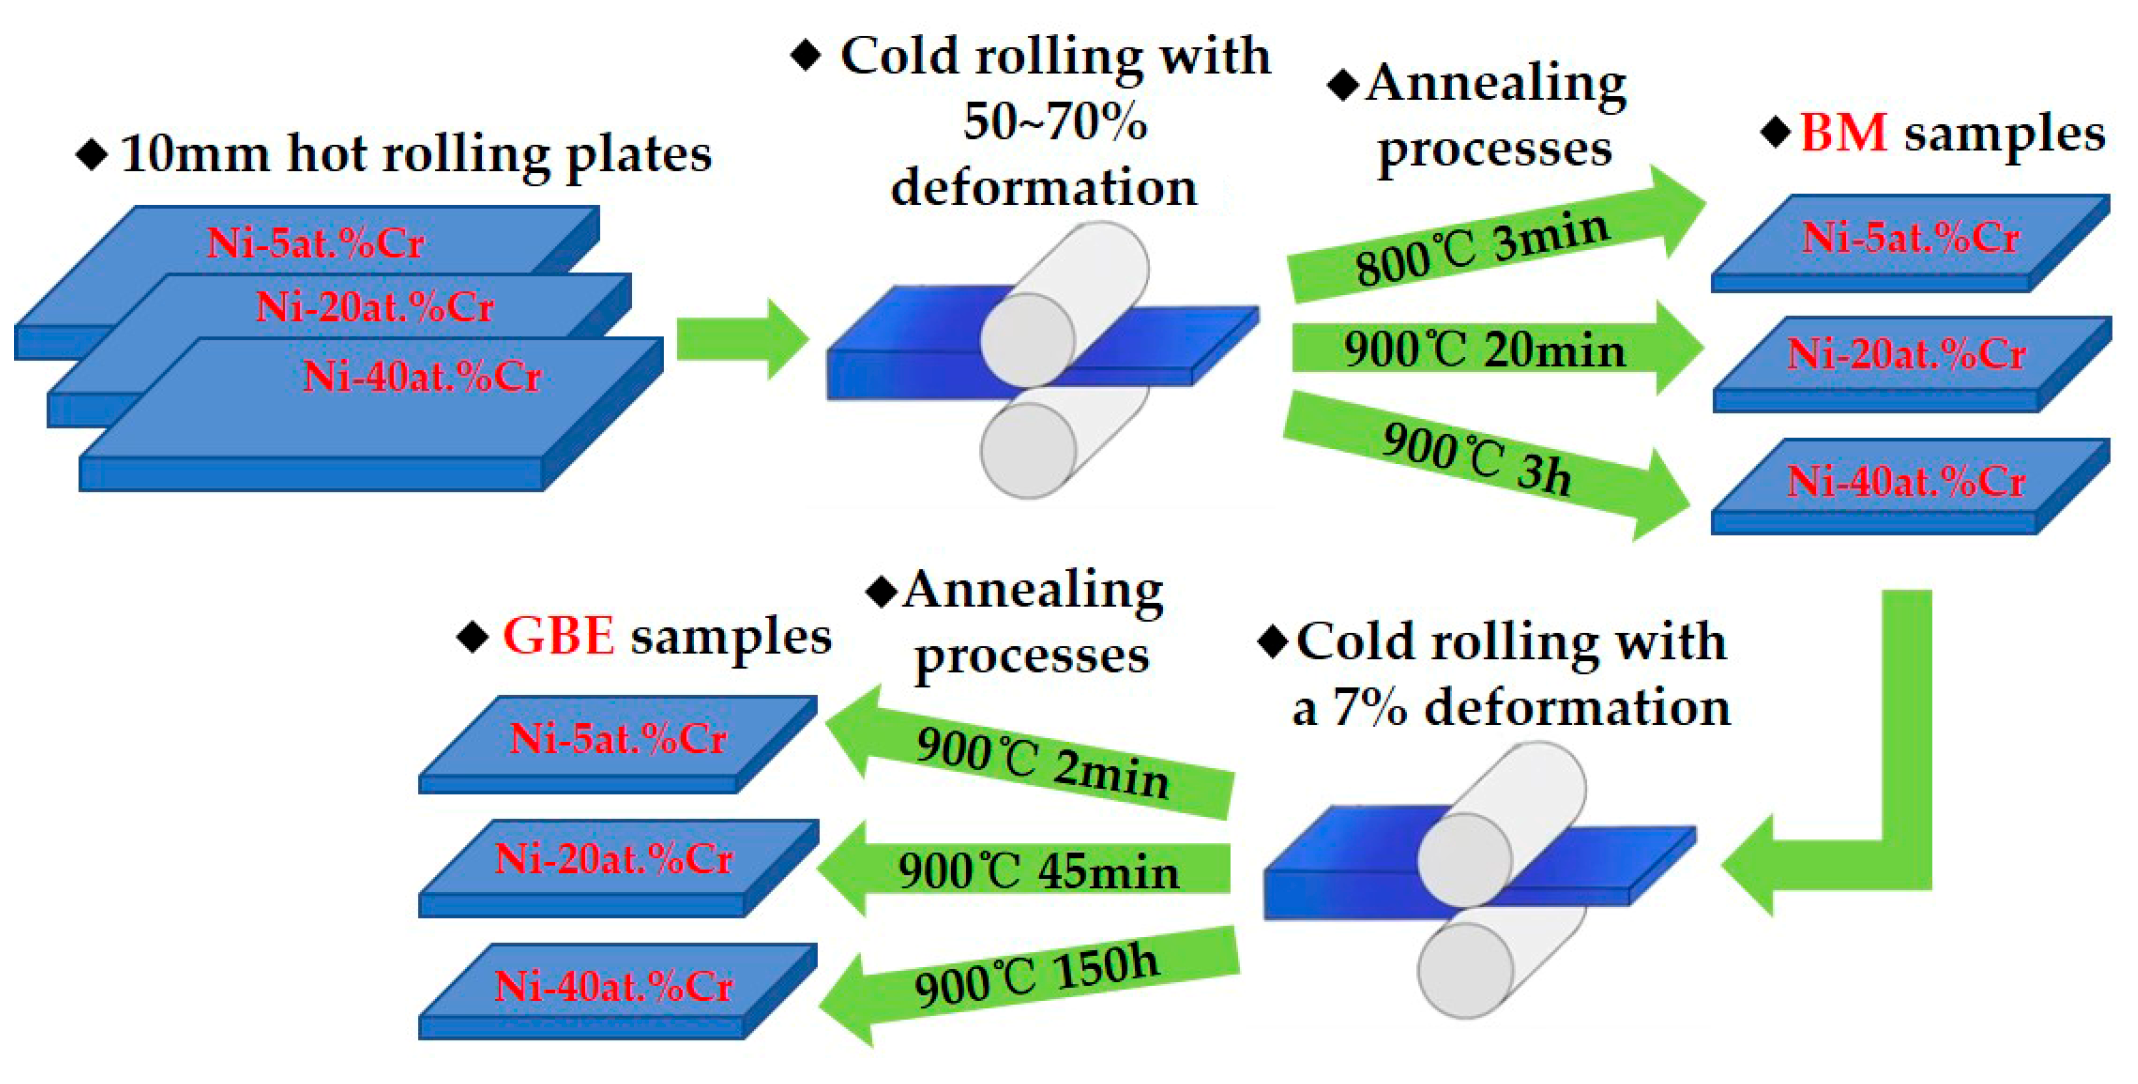
Figure 1. The diagram of the preparation process of BM and GBE samples.
Crystals 12 01822 g001
Figure 2. OM images and IPF of the BM samples: (a,b) Ni-5at.%Cr; (c,d) Ni-20at.%Cr; (e,f) Ni-40at.%Cr.
Crystals 12 01822 g002
Figure 3. GBCD and corresponding RHAGB network maps of the BM samples: (a,b) Ni-5at.%Cr; (c,d) Ni-20at.%Cr; (e,f) Ni-40at.%Cr.
Crystals 12 01822 g003
Figure 4. IPF of GBE samples: (a) Ni-5at.%Cr; (b) Ni-20at.%Cr; (c) Ni-40at.%Cr.
Crystals 12 01822 g004
Figure 5. GBCD and corresponding RHAGB network maps of the GBE samples: (a,b) Ni-5at.%Cr; (c,d) Ni-20at.%Cr; (e,f) Ni-40at.%Cr.
Crystals 12 01822 g005
Figure 6. Comparison of special grain boundary proportions in BM and GBE samples.
Crystals 12 01822 g006
Figure 7. Variations of GBE parameters, v (a) and fJ2/(1-fJ3) ratio (b), in the BM and GBE Ni-Cr alloy samples with the Cr content.
Crystals 12 01822 g007
Figure 8. TEM images showing the deformation microstructures after 7% cold rolling: (a,b) Ni-5at.%Cr; (c,d) Ni-20at.%Cr; (e,f) Ni-40at.%Cr.
Crystals 12 01822 g008
Table 1. SFE and SRO degree of Ni and Ni-Cr alloys [16,17,18].
SpecimensNiNi-5at.%CrNi-20at.%CrNi-40at.%Cr
SFE (mJ/m2)130867475
SRO degree (mJ/m2) *031833
* Note that a diffuse antiphase boundary (APB) energy is defined as the quantitative parameter of SRO degree [18].
Publisher’s Note: MDPI stays neutral with regard to jurisdictional claims in published maps and institutional affiliations.