
Near-Infrared Spectroscopy Study of OH Stretching Modes in Pyrophyllite and Talc

Abstract
:1. Introduction
2. Materials and Methods
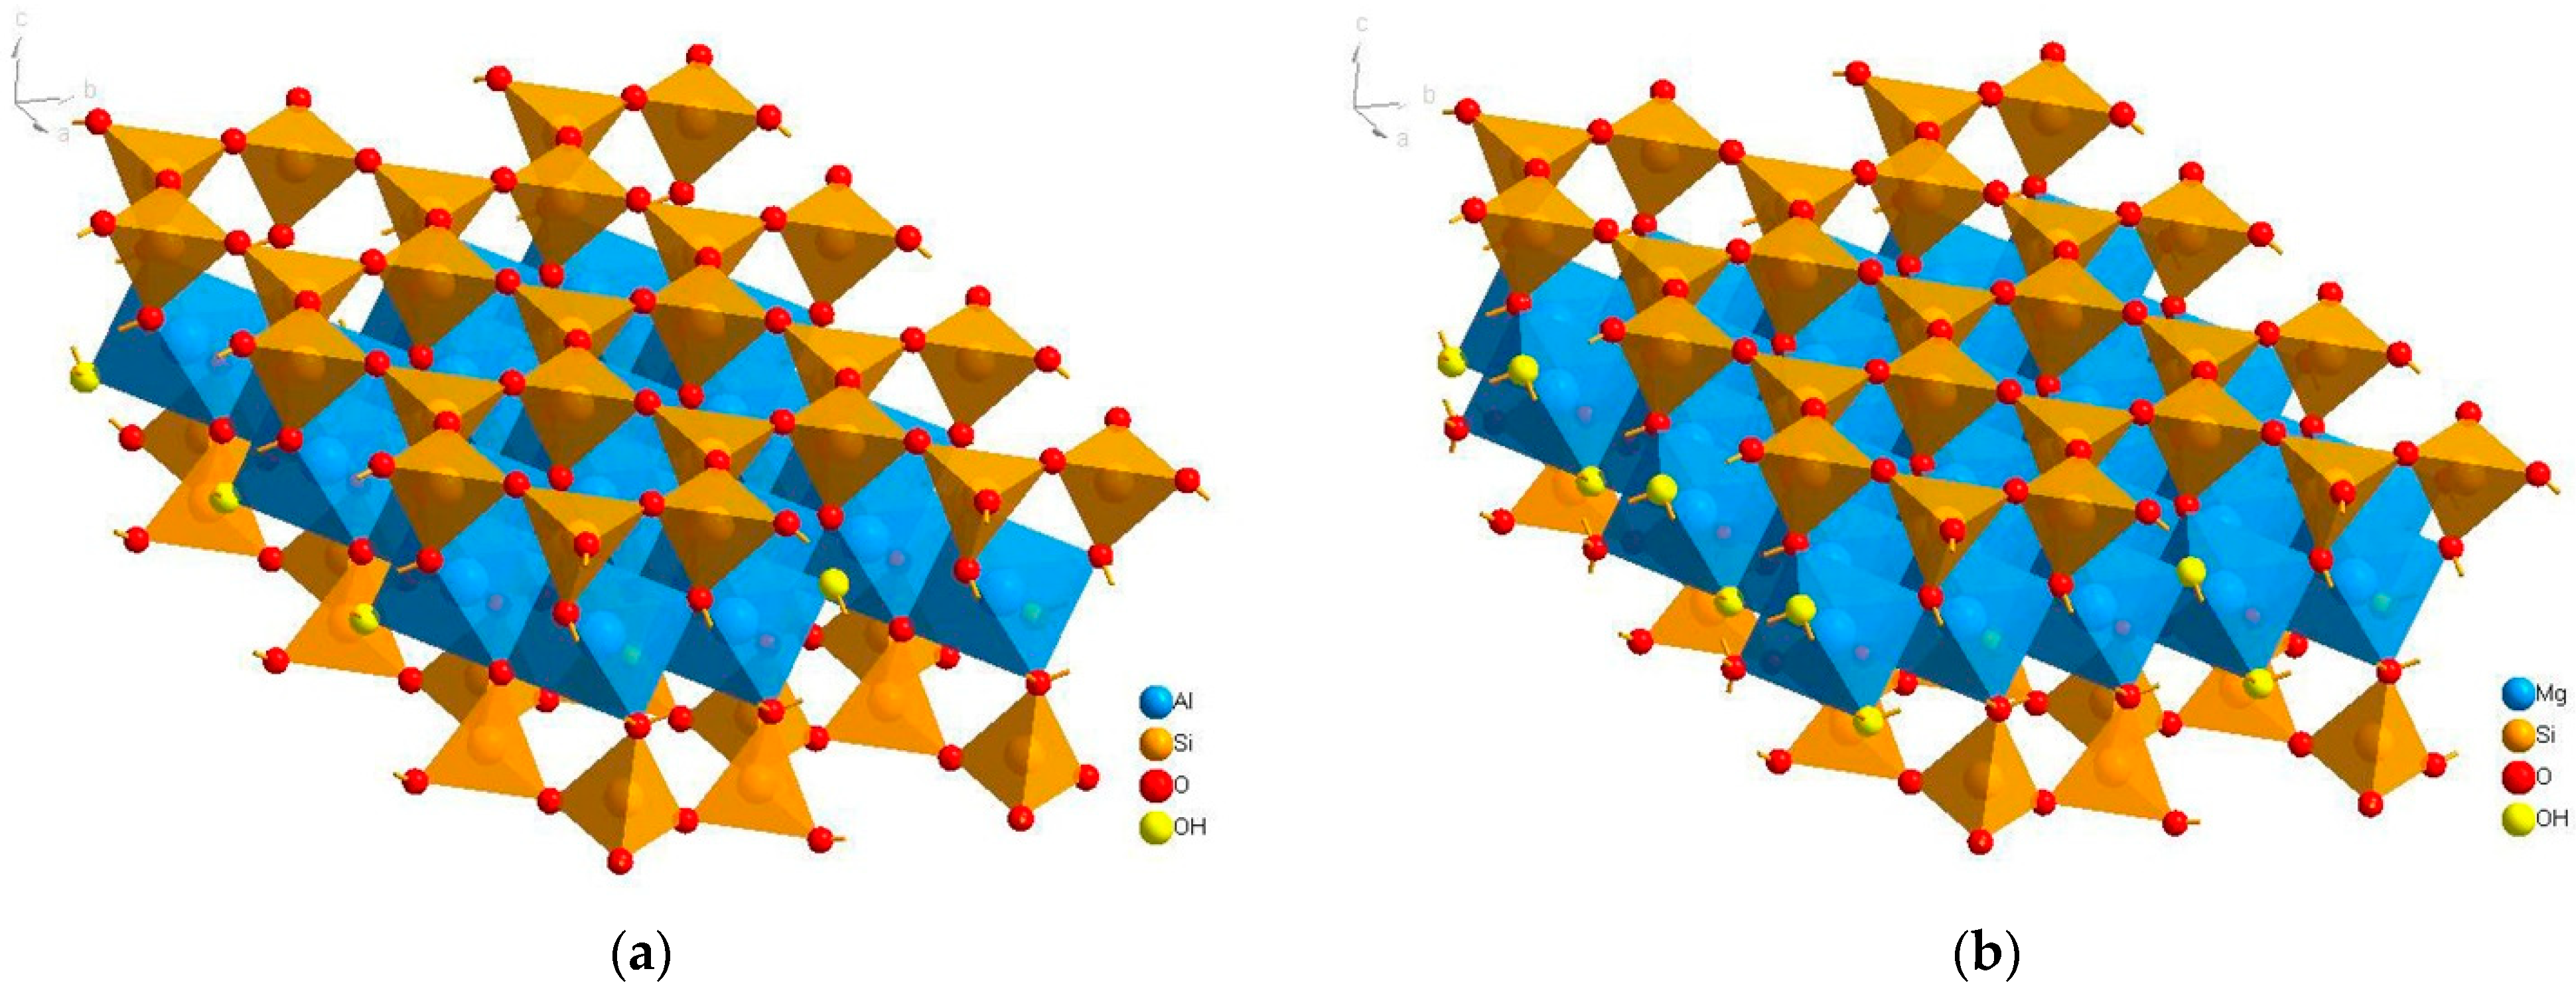
2.1. Materials
2.2. Methods
3. Results
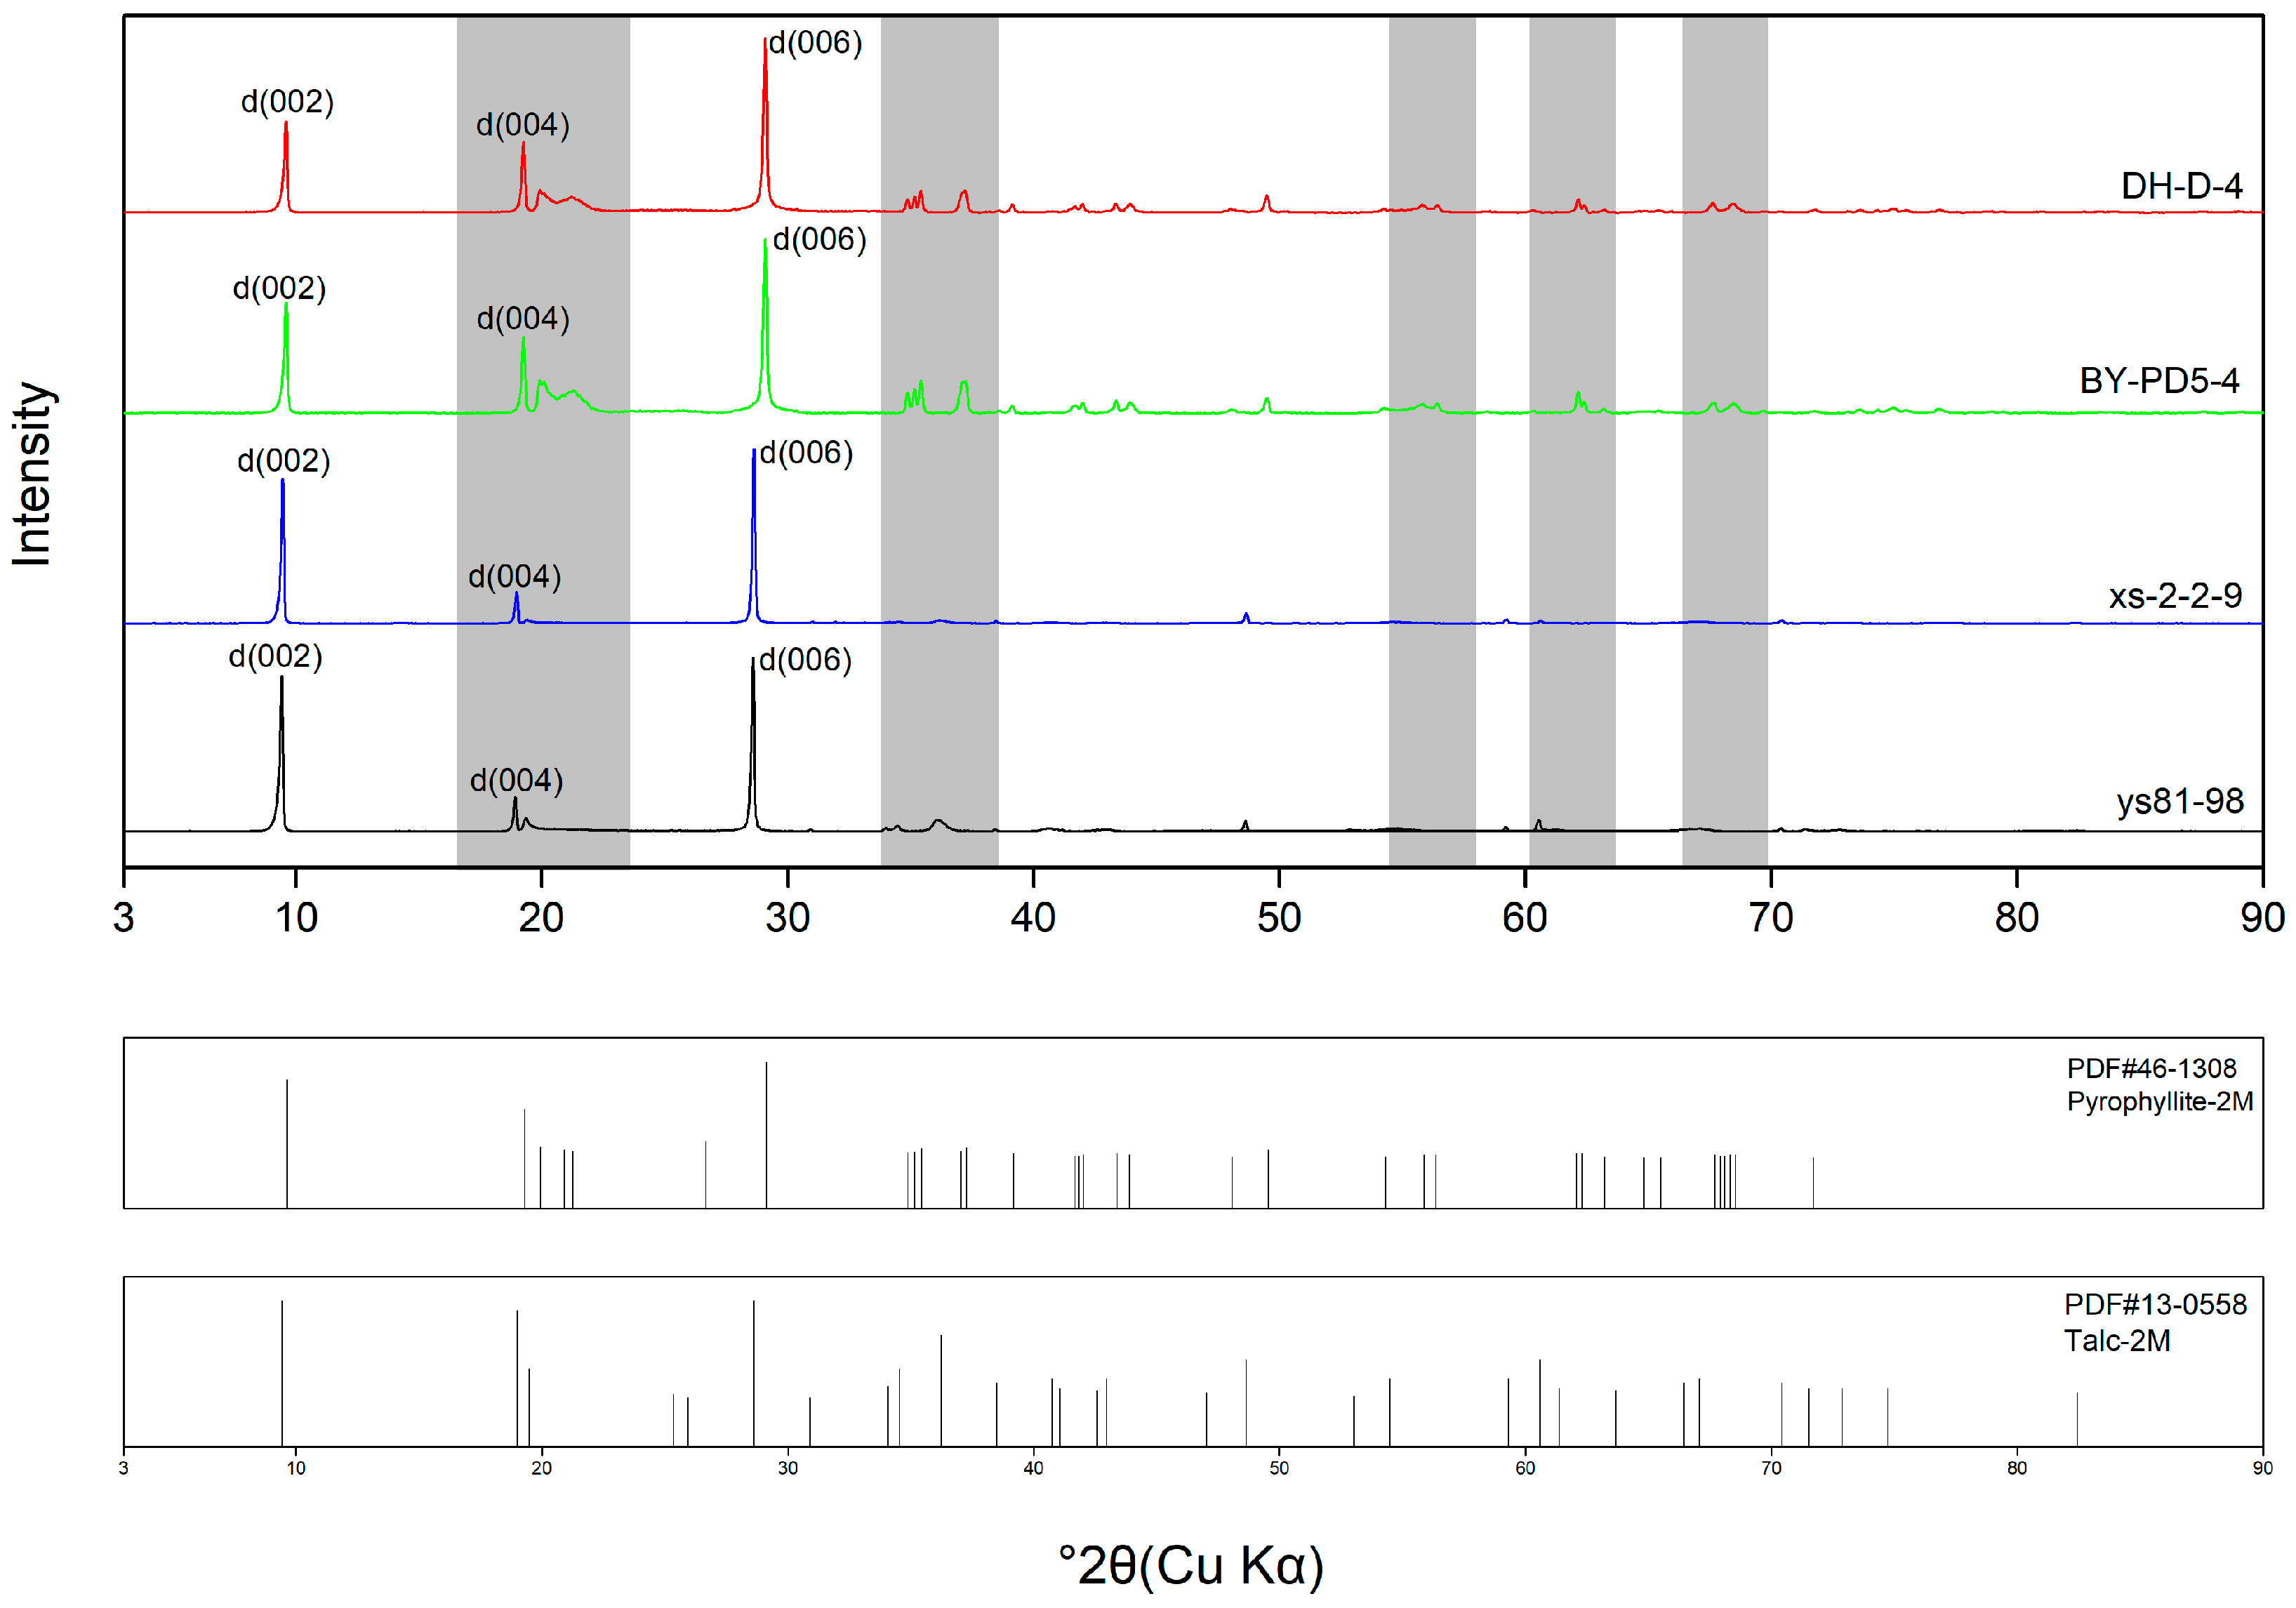
3.1. X-ray Diffraction
3.2. MIR Characteristics
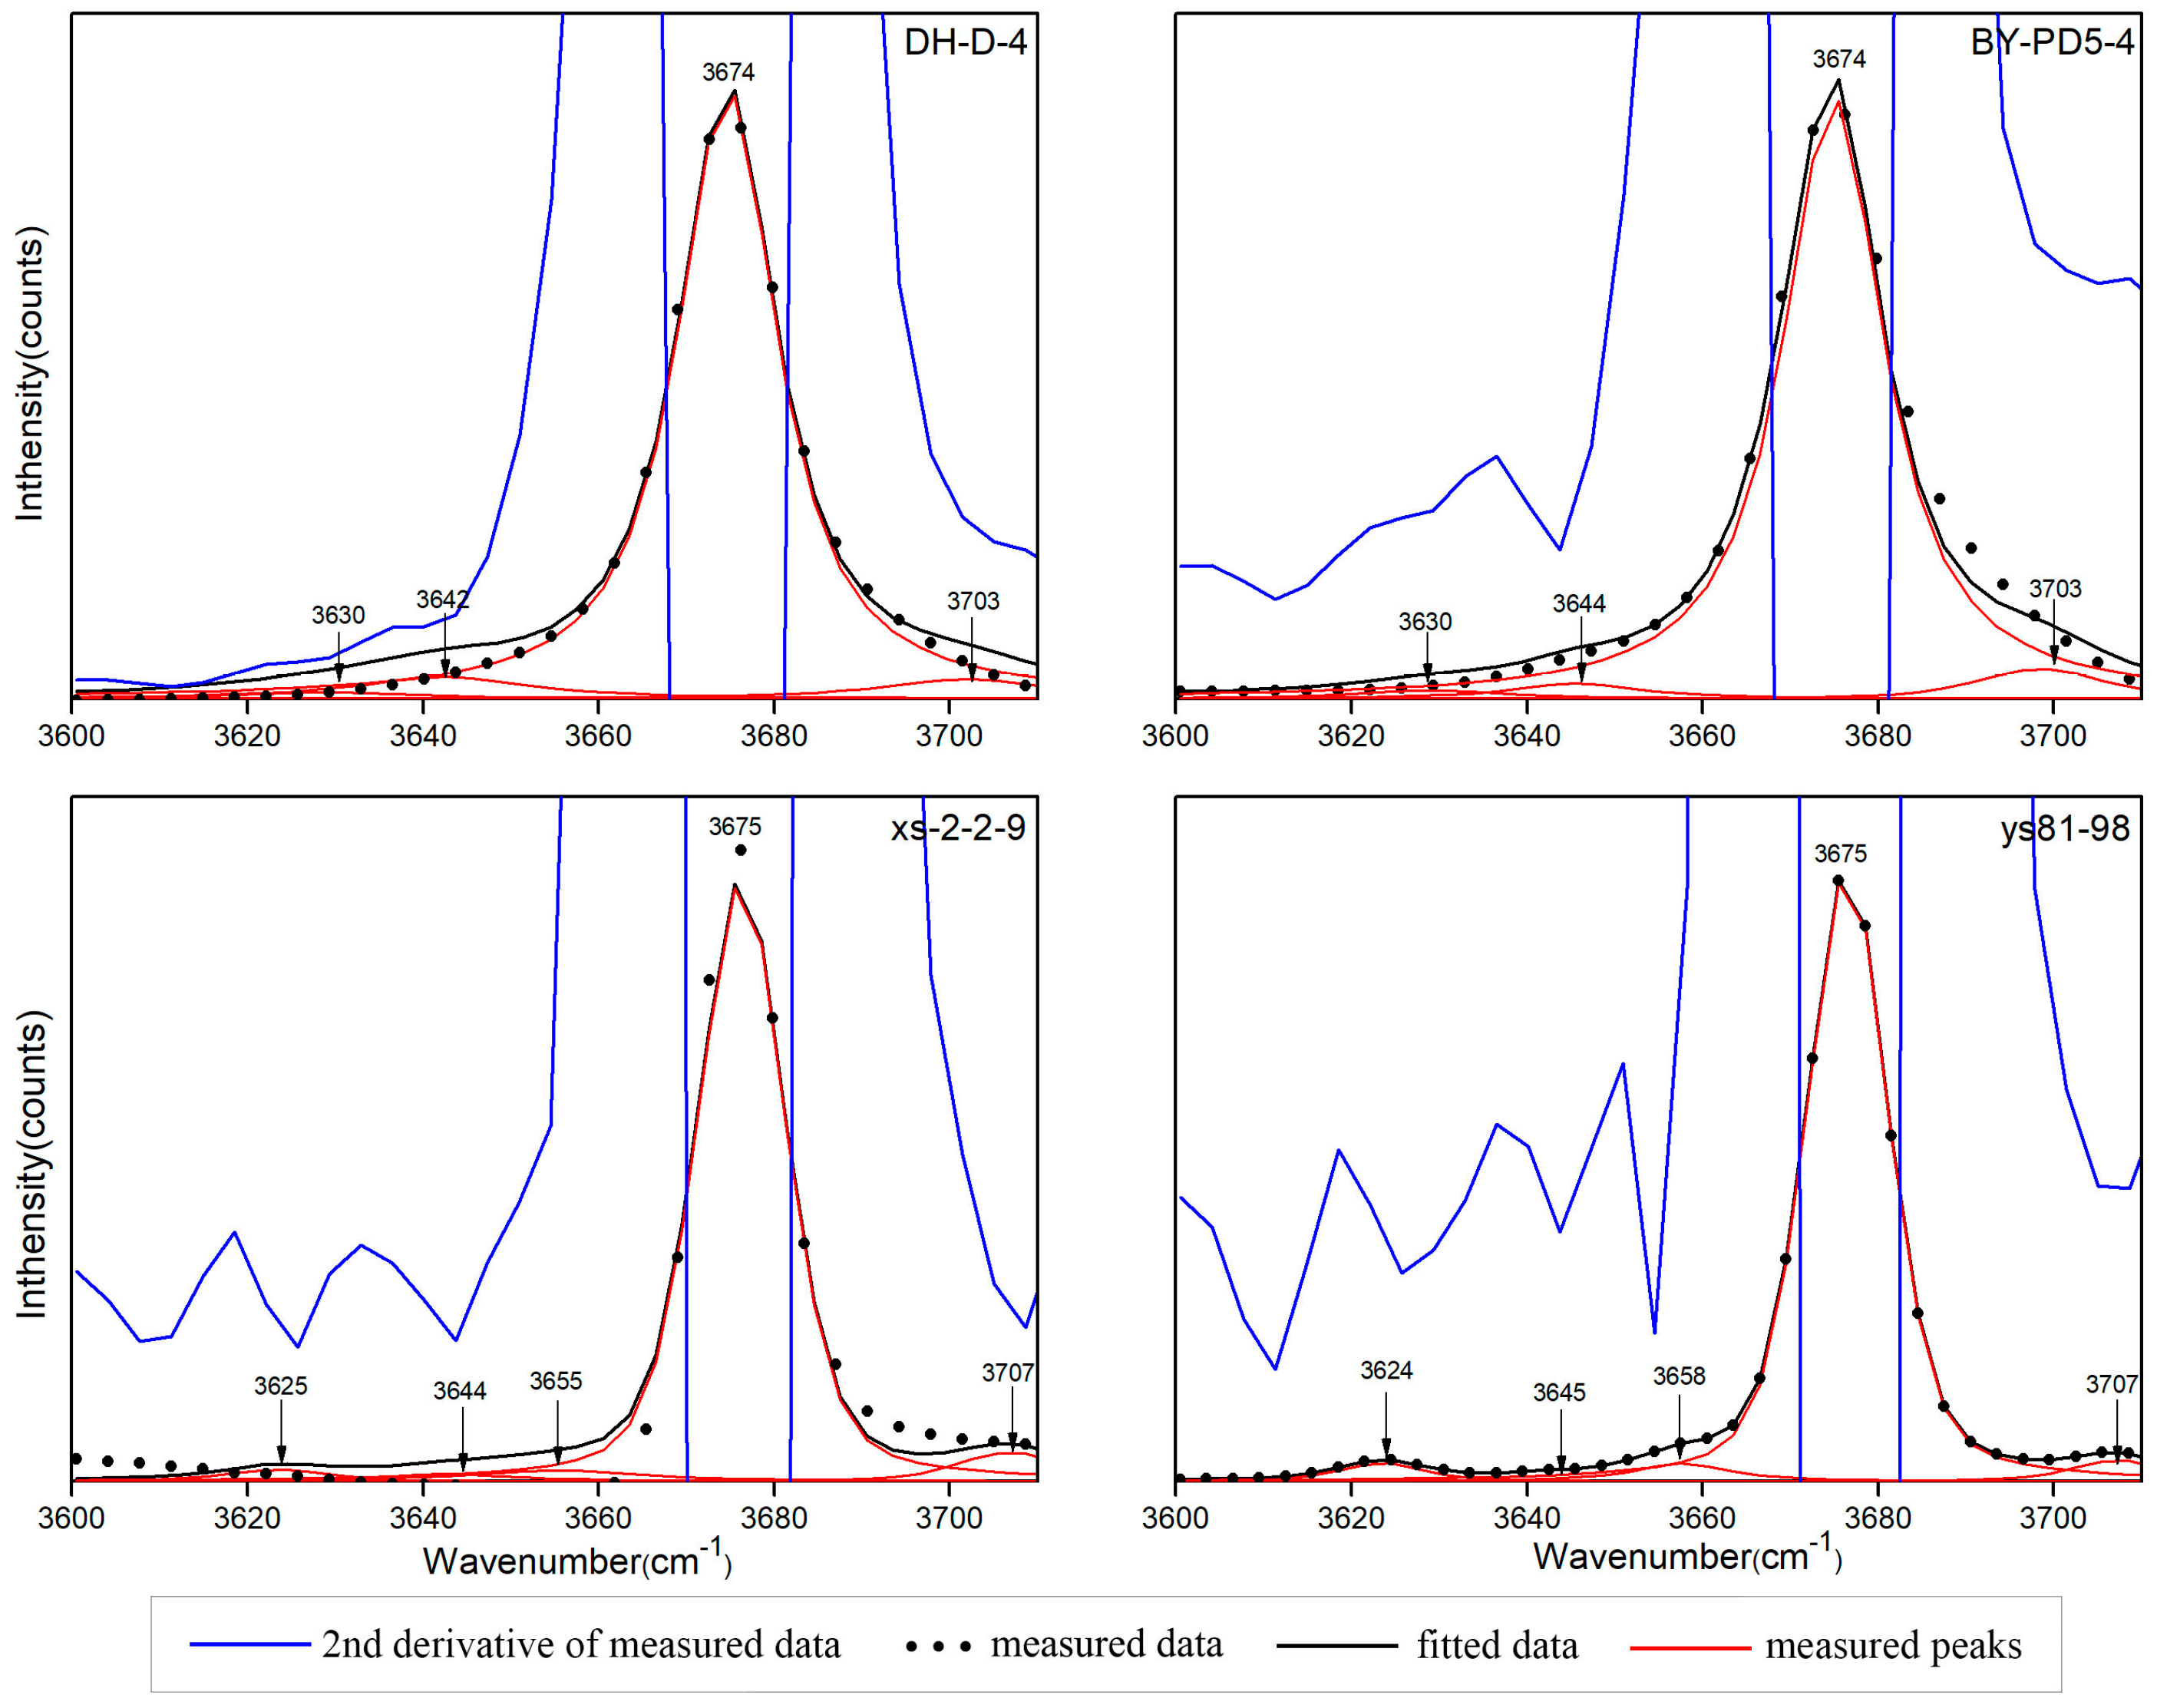
3.3. NIR Characteristics

| Assignment | Pyrophyllite [17] | Talc [18,19,20] | DH-D-4 | BY-PD-4 | xs-2-2-9 | ys81-98 |
|---|---|---|---|---|---|---|
| Combination of OH and Si-O-Si stretching band | 4615 | 4615 | 4617 | |||
| Combination of OH stretching and bending vibration | 4055 | 4056 | 4056 | |||
| 4186 | 4182 | 4185 | 4185 | 4180 | 4177 | |
| 4323 | 4323 | 4323 | ||||
| 4369 | 4368 | 4368 | ||||
| 6908 | 6922 | 6916 | 6916 | 6916 | 6925 | |
| The first fundamental overtone of OH stretching vibration | 7073 | 7069 | 7070 | 7069 | 7076 | |
| 7094 | 7094 | 7094 | 7089 | |||
| 7100 | 7106 | 7106 | 7105 | 7111 | ||
| 7118 | 7118 | 7118 | 7118 | 7118 | ||
| 7136 | 7139 | 7139 | 7139 | 7132 | ||
| 7153 | 7152 | 7152 | ||||
| 7175 | 7185 | 7175 | 7175 | 7183 | 7183 | |
| 7201 | 7201 | 7204 | 7204 | 7204 | 7209 | |
| 7234 | 7231 | 7231 | 7231 | 7236 | ||
| 7327 | 7327 | 7327 | 7327 | 7327 | 7327 | |
| 7340 | 7341 | 7341 | 7341 | 7342 | ||
| Combination of OH and H2O stretching vibration | 7294 | 7294 | 7294 | 7294 | 7289 | |
| 7300 | 7309 | 7309 | 7308 | 7302 |
4. Discussion
5. Conclusions
- XRD data show that the samples that were studied in this article are consistent with the characteristics of minerals in PDF cards, which can verify that these samples are pure minerals. The ranges of 18–22°, 37–41°, 54–58°, 60–64°, and 66–70° are the obvious regions for distinguishing between pyrophyllite and talc by observing the number and intensity of the peaks.
- Obvious differences were identified between the MIR spectra of pyrophyllite and talc samples. In the 400–600 cm−1 region, pyrophyllite exhibits six peaks, while talc only exhibits five. In the 1000–1200 cm−1 region, pyrophyllite exhibits three clear peaks at approximately 1051, 1070, and 1121 cm−1; while talc exhibits one strong peak near 1020 cm−1.
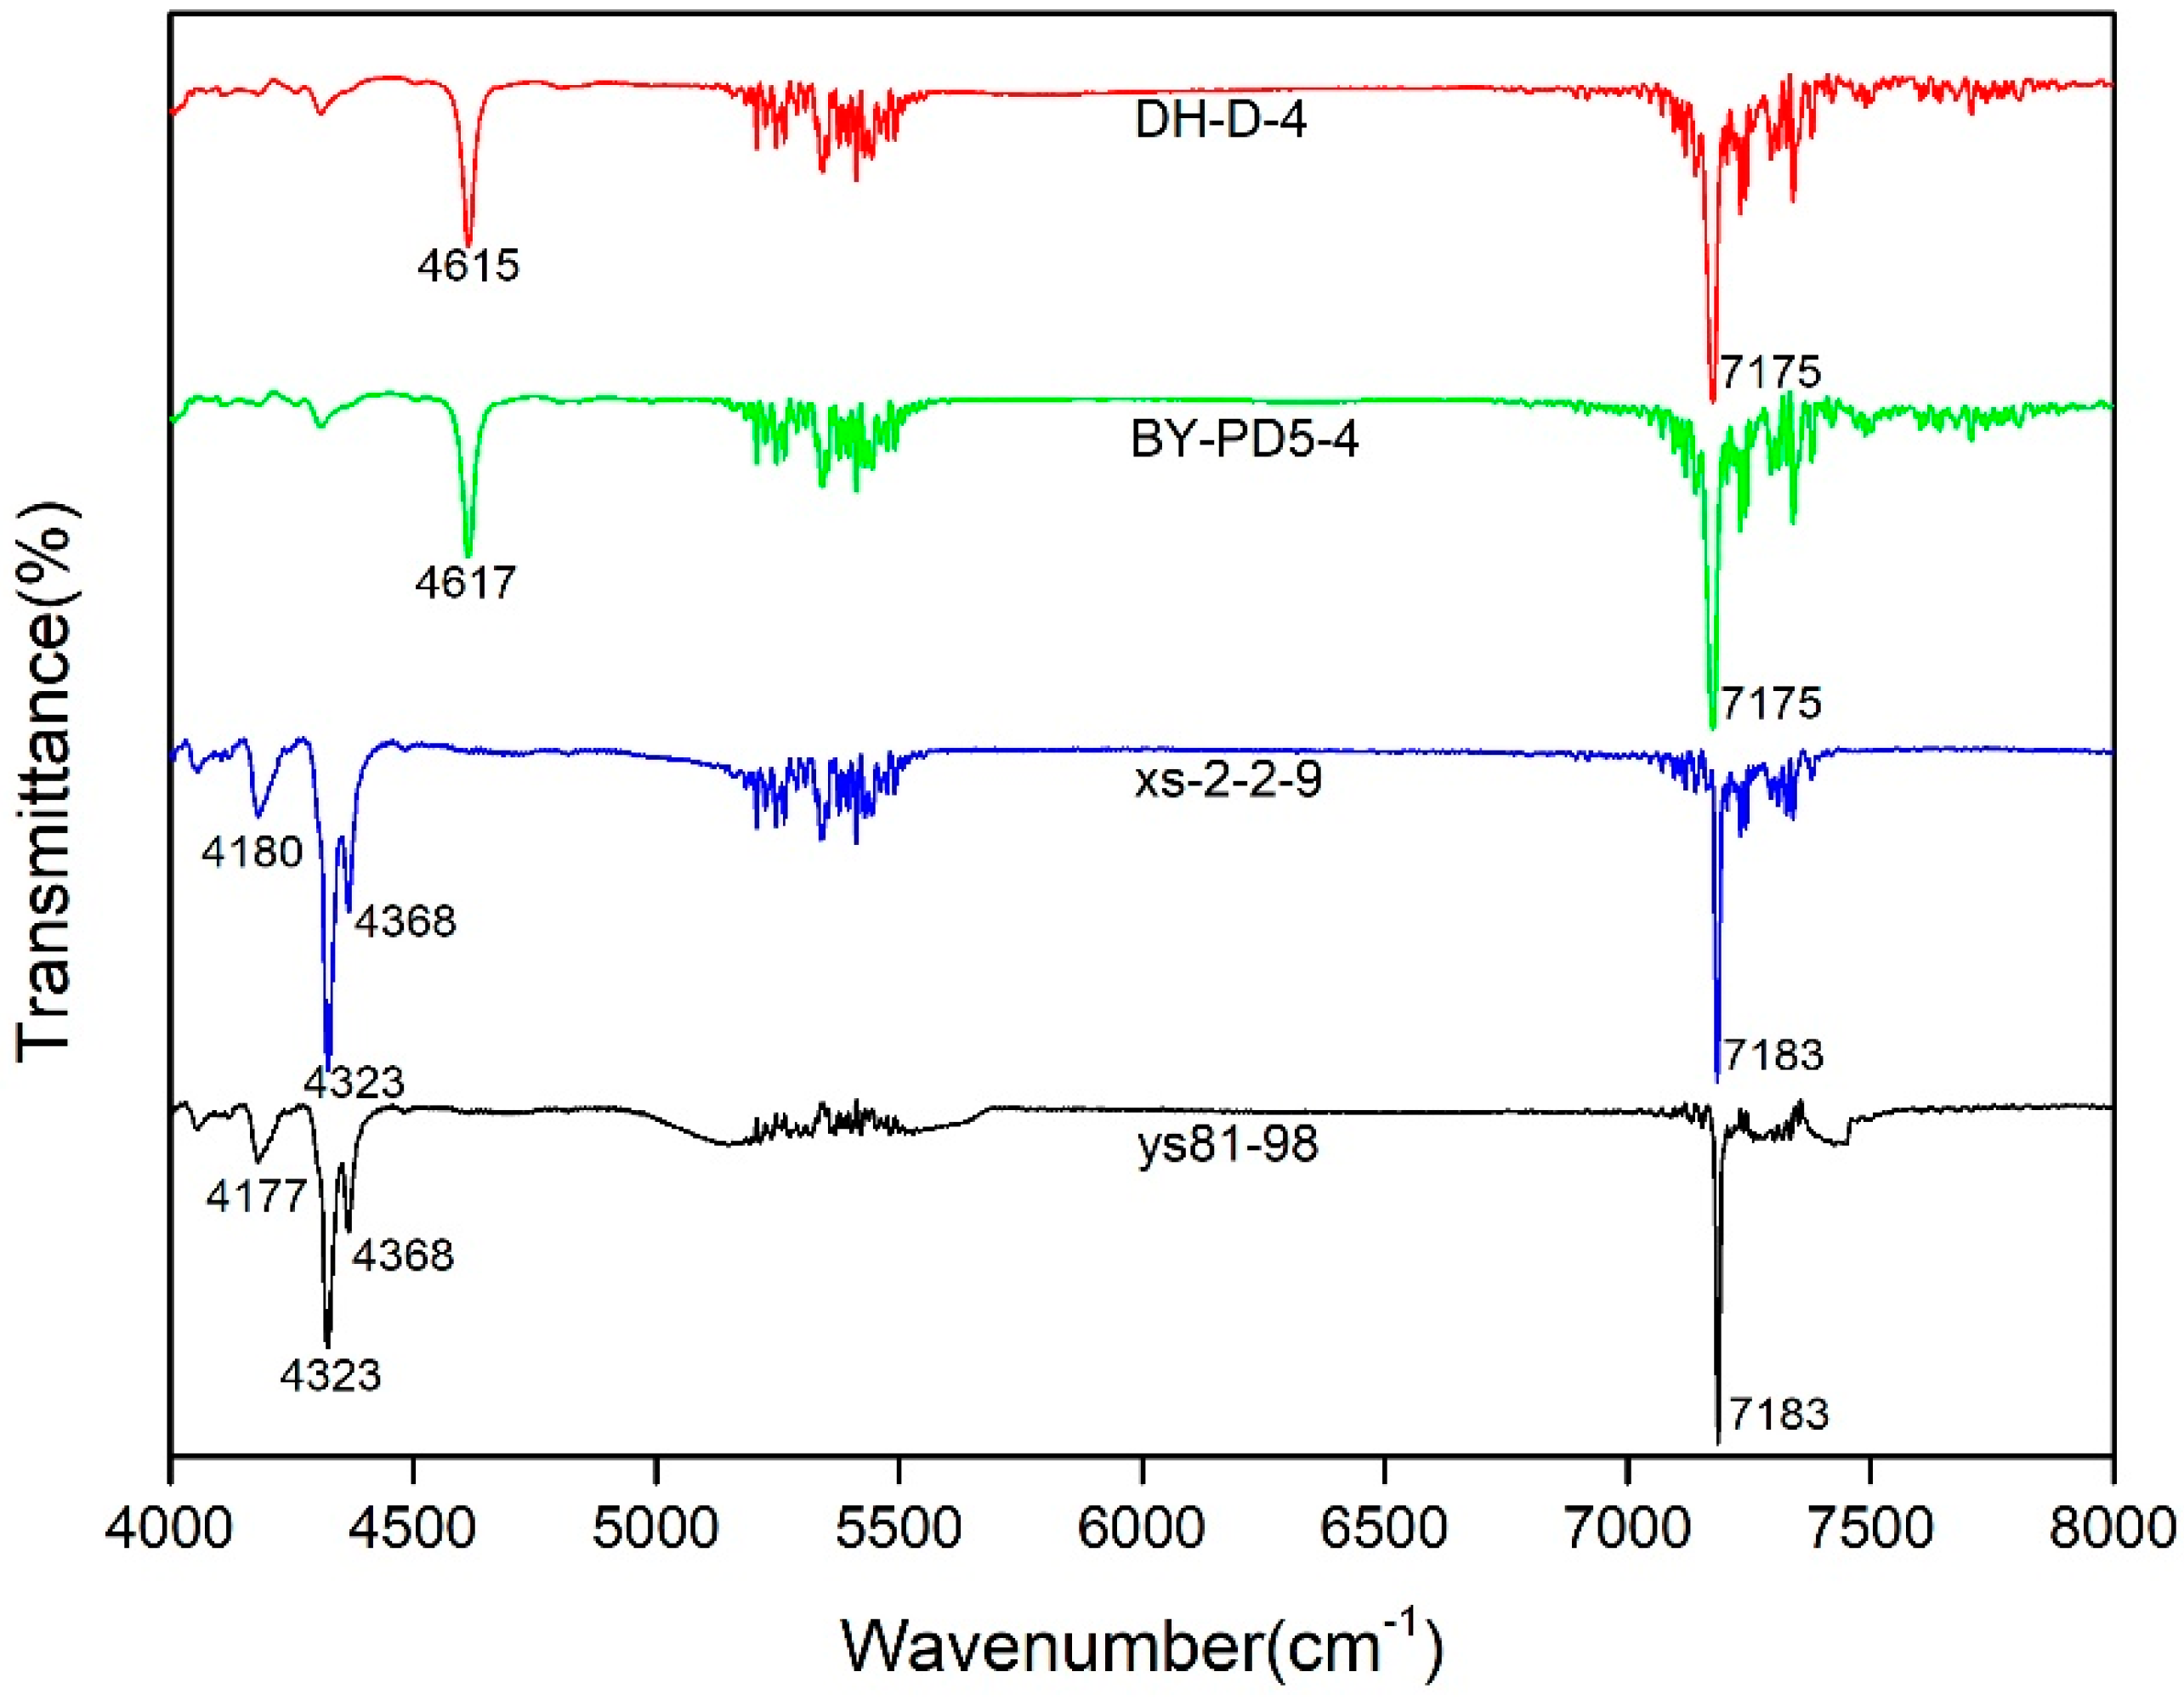
- The NIR spectral characteristic peaks of pyrophyllite and talc are located in the 4000–4700 cm−1 region, and they are more obvious than the MIR spectral characteristic peaks. Pyrophyllite exhibits a strong peak at around 4615 cm−1, which is attributed to the combination of the OH and Si-O-Si stretching bands. Talc exhibits a maximum peak that is located near 4323 cm−1, which is assigned to the OH stretching vibration. In addition, the talc samples exhibit a secondary peak near 4366 cm−1. Talc also contains two other weaker peaks at around 4056 and 4180 cm−1.
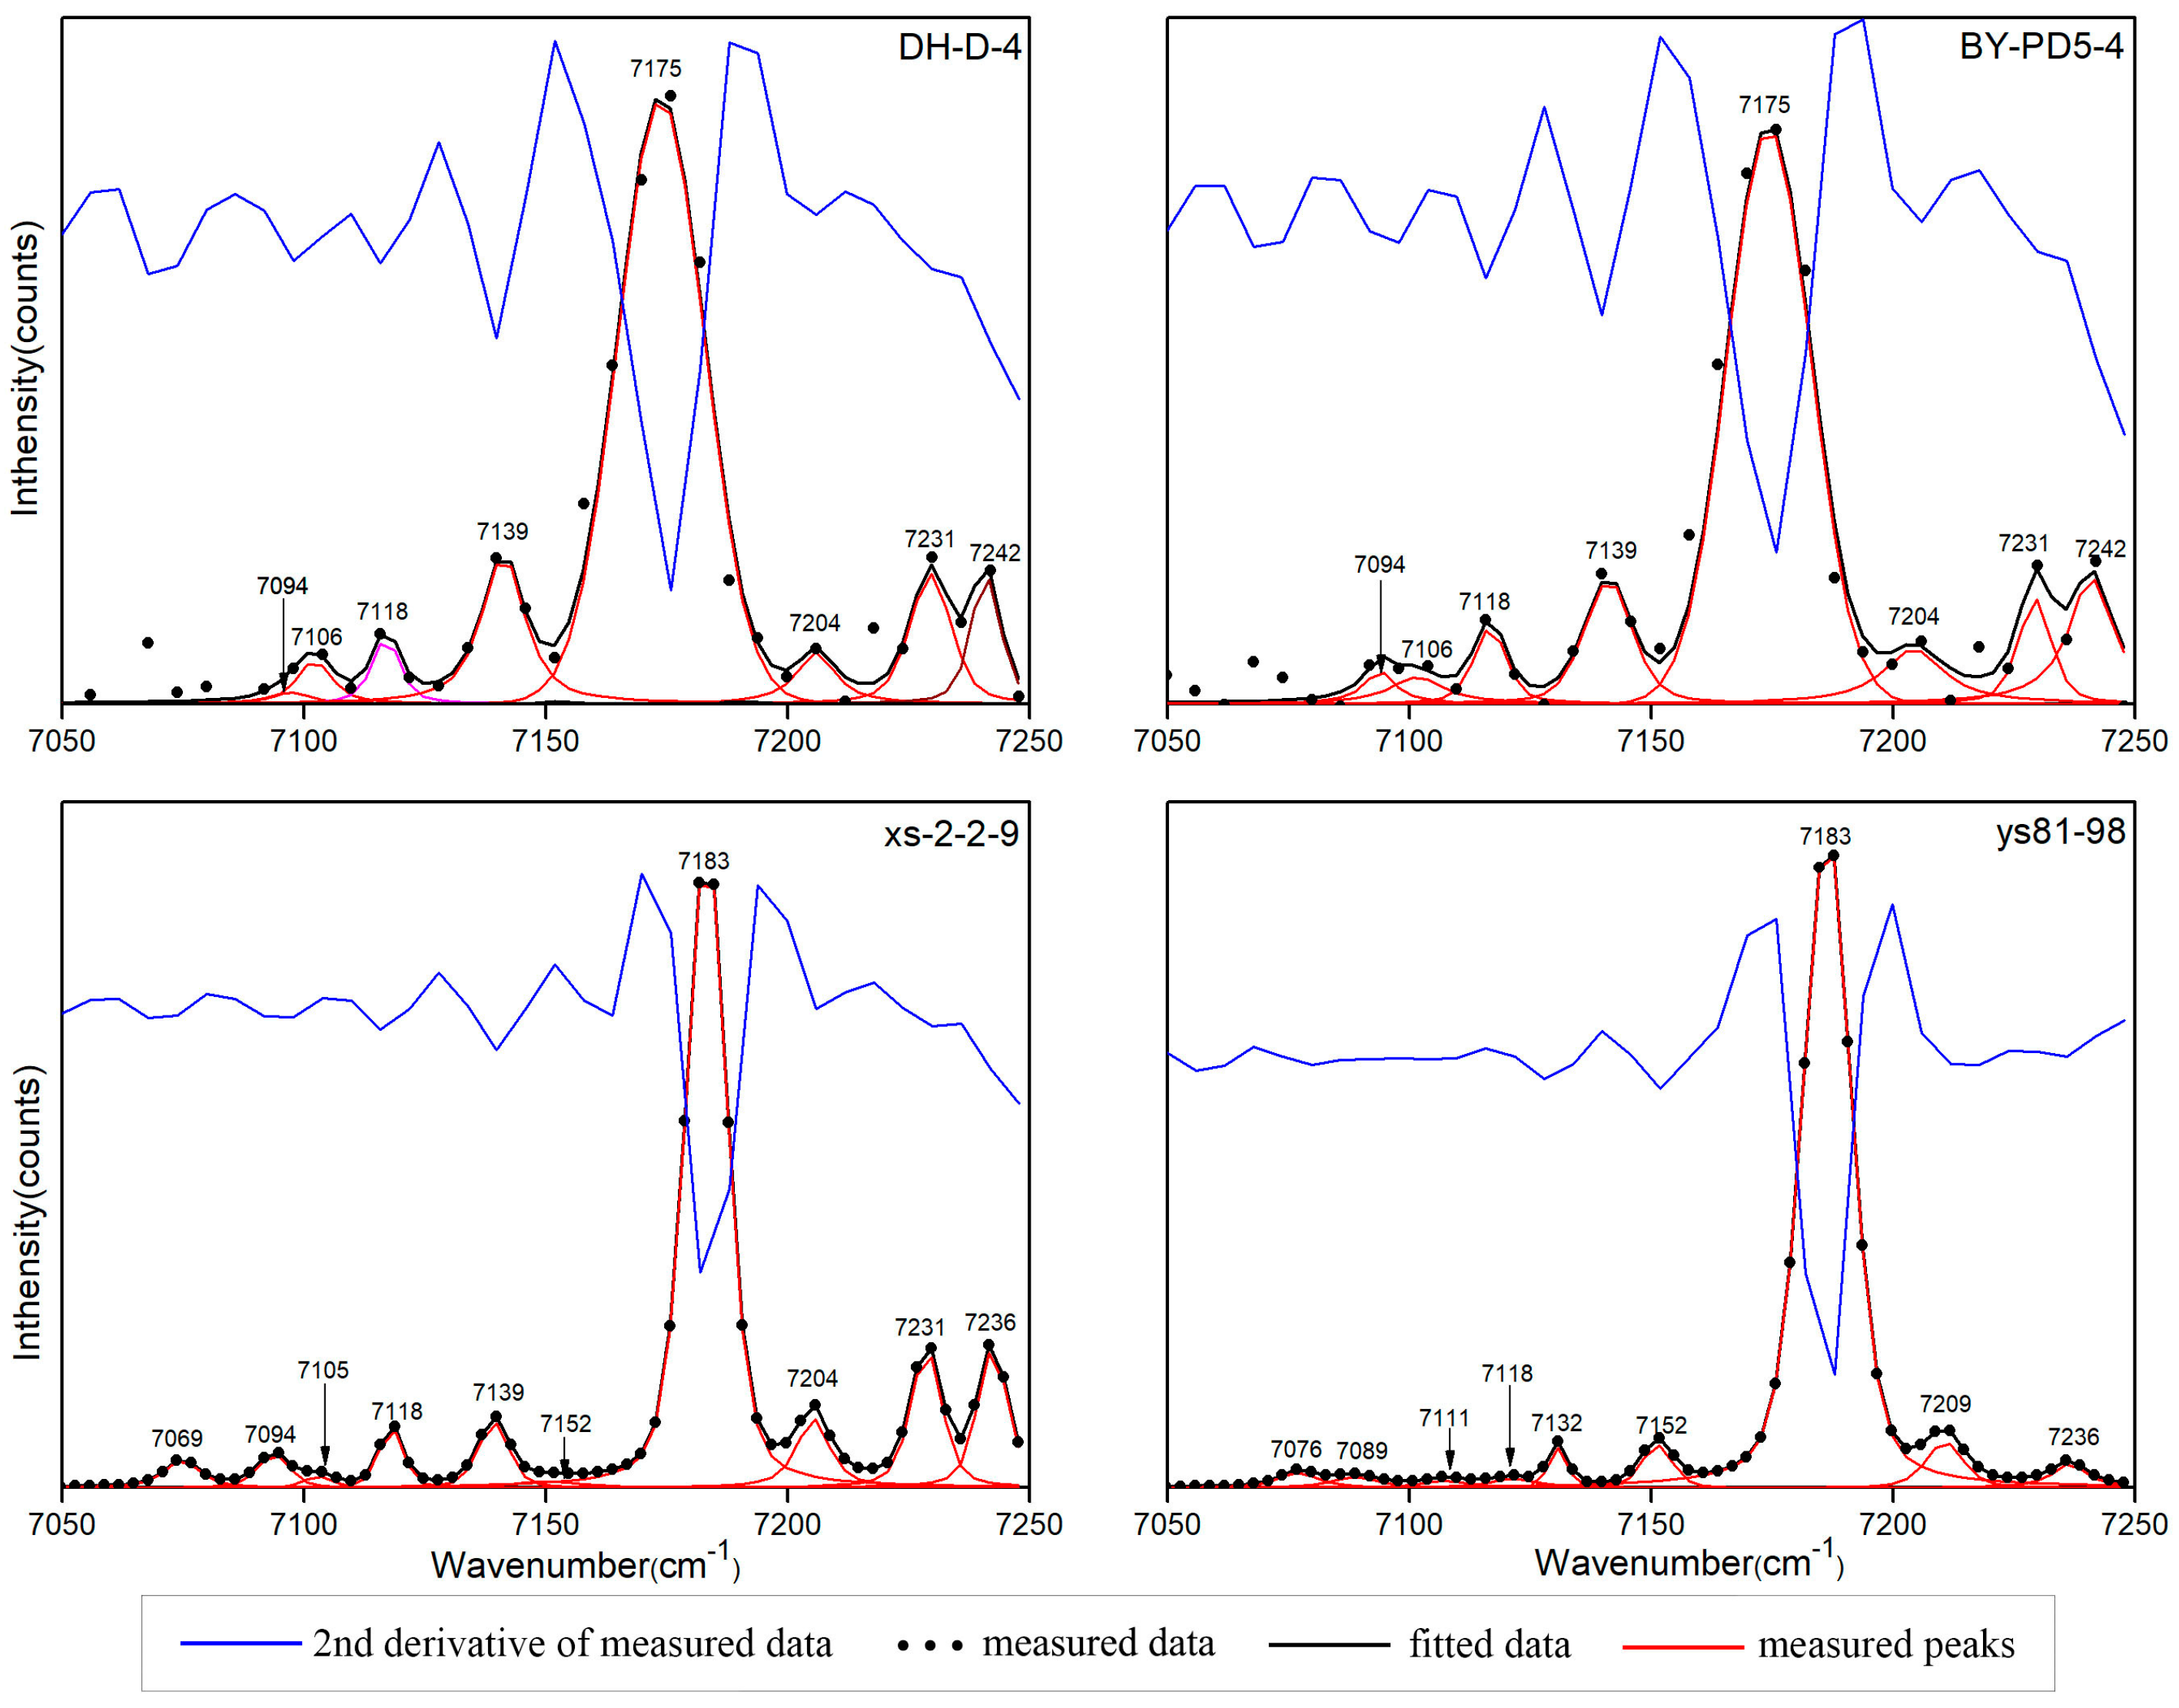
- The OH stretching vibration can be combined with the OH bending vibration and Si-O vibration. The OH combination vibration of pyrophyllite is located at 4615–4617 cm−1, which is a combination of the peaks around 3674 cm−1 and 950 cm−1. The peak at 3674 cm−1 is attributed to O-H stretching vibration, and the peak at 950 cm−1 is attributed to Al-OH in-plane libration. Additionally, 7000–7250 cm−1 is the first fundamental overtone region for the OH stretching vibration, including an obvious absorption peak and various small peaks. Pyrophyllite and talc each have a few combined overtones of the OH stretching vibration, which are composed of adjacent OH stretching vibrations. The peaks of the two minerals at around 7094 cm−1 appear to be a combination of the 3630 (±5) cm−1 and 3642 (±3) cm−1 peaks. The 7000–7250 cm−1 region cannot be used to distinguish between pyrophyllite and talc.
- Due to the effect of the non-ideal conditions, the theoretical peak position of the overtone peak is higher than that of the actual position. The factor of the first fundamental overtone of the OH group stretching vibration is 1.95 (±0.003).
Author Contributions
Funding
Data Availability Statement
Conflicts of Interest
References
- Ravindra Reddy, T.; Lakshmi Reddy, S.; Endo, T. Structural characterization studies on the natural mineral pyrophyllite. Radiat. Eff. Defects Solids 2016, 171, 307–315. [Google Scholar] [CrossRef]
- Vedanand, S.; Sambasiva Rao, P.; Reddy, B.J. Spectroscopic investigations on different grade samples of Talc. Radiat. Eff. Defects Solids 1993, 127, 169–176. [Google Scholar] [CrossRef]
- Claverie, M.; Carême, C.; Dumas, A.; Poirier, M.; Le Roux, C.; Micoud, P.; Martin, F.; Aymonier, C. Synthetic Talc and Talc-Like Structures: Preparation, Features and Applications. Chem. A Eur. J. 2018, 24, 519–542. [Google Scholar] [CrossRef] [PubMed] [Green Version]
- Petit, S.; Decarreau, A.; Martin, F.; Wiewiora, A.; De Parseval, P. Crystal-chemistry of talc: A near infrared (NIR) spectroscopy study. Am. Miner. 2004, 89, 319–326. [Google Scholar] [CrossRef]
- Zhang, M.; Salje, E.K.H.; Carpenter, M.A.; Wang, J.Y.; Groat, L.A.; Lager, G.A.; Wang, L.; Beran, A.; Bismayer, U. Temperature dependence of IR absorption of hydrous/OH species in minerals and synthetic materials. Am. Miner. 2007, 92, 1502–1517. [Google Scholar] [CrossRef]
- Cheng, H.F.; Hao, R.W.; Zhou, Y.; Frost, R.L. Visible and near-infrared spectroscopic comparison of five phyllosilicate mineral samples. Spectrochim. Acta Part A Mol. Biomol. Spectrosc. 2017, 180, 19–22. [Google Scholar] [CrossRef]
- Wu, S.; He, M.Y.; Yang, M.; Peng, B.J. Near-Infrared Spectroscopic Study of OH Stretching Modes in Kaolinite and Dickite. Crystals 2022, 12, 907. [Google Scholar] [CrossRef]
- Wu, S.; He, M.Y.; Yang, M.; Zhang, B.Y.; Wang, F.; Li, Q.Z. Near-Infrared Spectroscopy Study of Serpentine Minerals and Assignment of the OH Group. Crystals 2021, 11, 1130. [Google Scholar] [CrossRef]
- Madejová, J.; Gates, W.P.; Petit, S. Chapter 5––IR Spectra of Clay Minerals. Dev. Clay Sci. 2017, 8, 107–149. [Google Scholar]
- Kloprogge, J. Chapter 6––Raman Spectroscopy of Clay Minerals. Dev. Clay Sci. 2018, 150, 199. [Google Scholar]
- Zhang, M.; Redfern, S.A.T.; Salje, E.K.H.; Carpenter, M.A.; Wang, L. H2O and the dehydroxylation of phyllosilicates: An infrared spectroscopic study. Am. Miner. 2010, 95, 1686–1693. [Google Scholar] [CrossRef]
- Kloprogge, J.T.; Ruan, H. Near-infrared spectroscopic study of synthetic and natural pyrophyllite. Neues Jahrb. Fur Mineral. Mon. 2000, 8, 337–347. [Google Scholar]
- Byungsuk, K.; Young-Ah, W. Optimization of in-line near-infrared measurement for practical real time monitoring of coating weight gain using design of experiments. Drug Dev. Commun. 2021, 47, 72–82. [Google Scholar]
- Peng, X.W.; Li, G.Y. The Preliminary Discussion on Mineral Characterics and Genesis of the Pyrophyllite Deposit in Southeastern ZheJiang. Geol. Zhejiang 1991, 7, 68–75, 85–87. [Google Scholar]
- Bishop, J.L.; Pieters, C.M.; Edwards, J.O. Infrared spectroscopic analyses on the nature of water in montmorillonite. Clays Clay Miner. 1994, 42, 702–716. [Google Scholar] [CrossRef]
- Liu, Z.; Zong, Y.; Hou, J. Preparation of slag glass ceramic from electric arc furnace slag, quartz sand and talc under various MgO/Al2O3 ratios. Adv. Appl. Ceram. 2016, 115, 144–151. [Google Scholar]
- Sébastien, L.; Jean-Michel, B.; Fabrice, M.; Rémi, C. Integration of iron in natural and synthetic Al-pyrophyllites: An infrared spectroscopic study. Clay Miner. 2007, 42, 129–143. [Google Scholar]
- Blanchard, M.; Méheut, M.; Delon, L.; Poirier, M.; Micoud, P.; Le Roux, C.; Martin, F. Infrared spectroscopic study of the synthetic Mg-Ni talc series. Phys. Chem. Miner. 2018, 45, 843–854. [Google Scholar] [CrossRef] [Green Version]
- Julia, S.G.; Chi, M.; George, R.R. Dehydroxylation, proton migration, and structural changes in heated talc: An infrared spectroscopic study. Am. Miner. 2006, 91, 816–825. [Google Scholar]
- Kato, Y.; Sasakura, D.; Miura, T.; Nagatomo, A.; Terada, K. Evaluation of risk and benefit in the application of near-infrared spectroscopy to monitor the granule coating process. Pharm. Dev. Technol. 2008, 13, 205–211. [Google Scholar] [CrossRef]
- Huang, Z.M.; Tang, D.P.; Liu, H.; Xie, X.J. Near Infrared Spectroscopy: A New Tool to Identify Different Types of Larderites. J. Gems Gemmol. 2014, 16, 34–43. [Google Scholar]
- Kloprogge, J.T.; Frost, R.L. An infrared emission spectroscopic study of synthetic and natural pyrophyllite. Neues Jahrb. Fur Mineral. Mon. 1999, 2, 62–74. [Google Scholar]
- Baron, F.; Petit, S. Interpretation of the infrared spectra of the lizardite-nepouite series in the near- and mid-infrared range. Am. Miner. 2016, 101, 423–430. [Google Scholar] [CrossRef]
- Liang, P.; Liu, Q.F.; He, G.W. Mineralogical Characteristics and Genesis of Pyrophyllite from the Hongmiaoling Formation in Tanzhesi Region, Western Beijing, China. Bull. Mineral. Petrol. Geochem. 2015, 34, 1223–1230. [Google Scholar]
- Xu, Y.T.; Qin, H.F.; Chen, T. Mineralogical and Spectroscopic Study on Xidan Stone from Shoushan County, Fujian Province. Spectrosc. Anal. 2019, 39, 543–547. [Google Scholar]
- Wang, L.; Zhang, M.; Redfern, S.A.T.; Zhang, Z.Y. Dehydroxylation and Transformations of the 2:1 Phyllosilicate Pyrophyllite at Elevated Temperatures: An Infrared Spectroscopic Study. Clays Clay Miner. 2002, 50, 272–283. [Google Scholar] [CrossRef]
- Chen, D.M.; Jiang, Z.C.; Zhang, H.F. Differential Thermal Analysis and Nfrared Absorption Spectroscopy of Pyrophyllite from China. Acta Mineral. Sin. 1991, 11, 92–96. [Google Scholar]
- Drits, V.A.; Besson, G.; Muller, F. An improved model for structural transformations of heat-treated aluminous dioctahedral 2:1 layer silicates. Clays Clay Min. 1995, 43, 718–731. [Google Scholar] [CrossRef]
- Wilkins, R.W.T.; Jun, I. Infrared Spectra of some Synthetic Talcs. Am Miner. 1967, 52, 1649–1661. [Google Scholar]
- Bishop, J.; Murad, E.; Dyar, M.D. The influence of octahedral and tetrahedral cation substitution on the structure of smectites and serpentines as observed through infrared spectroscopy. Clay Miner. 2002, 37, 617–628. [Google Scholar] [CrossRef]
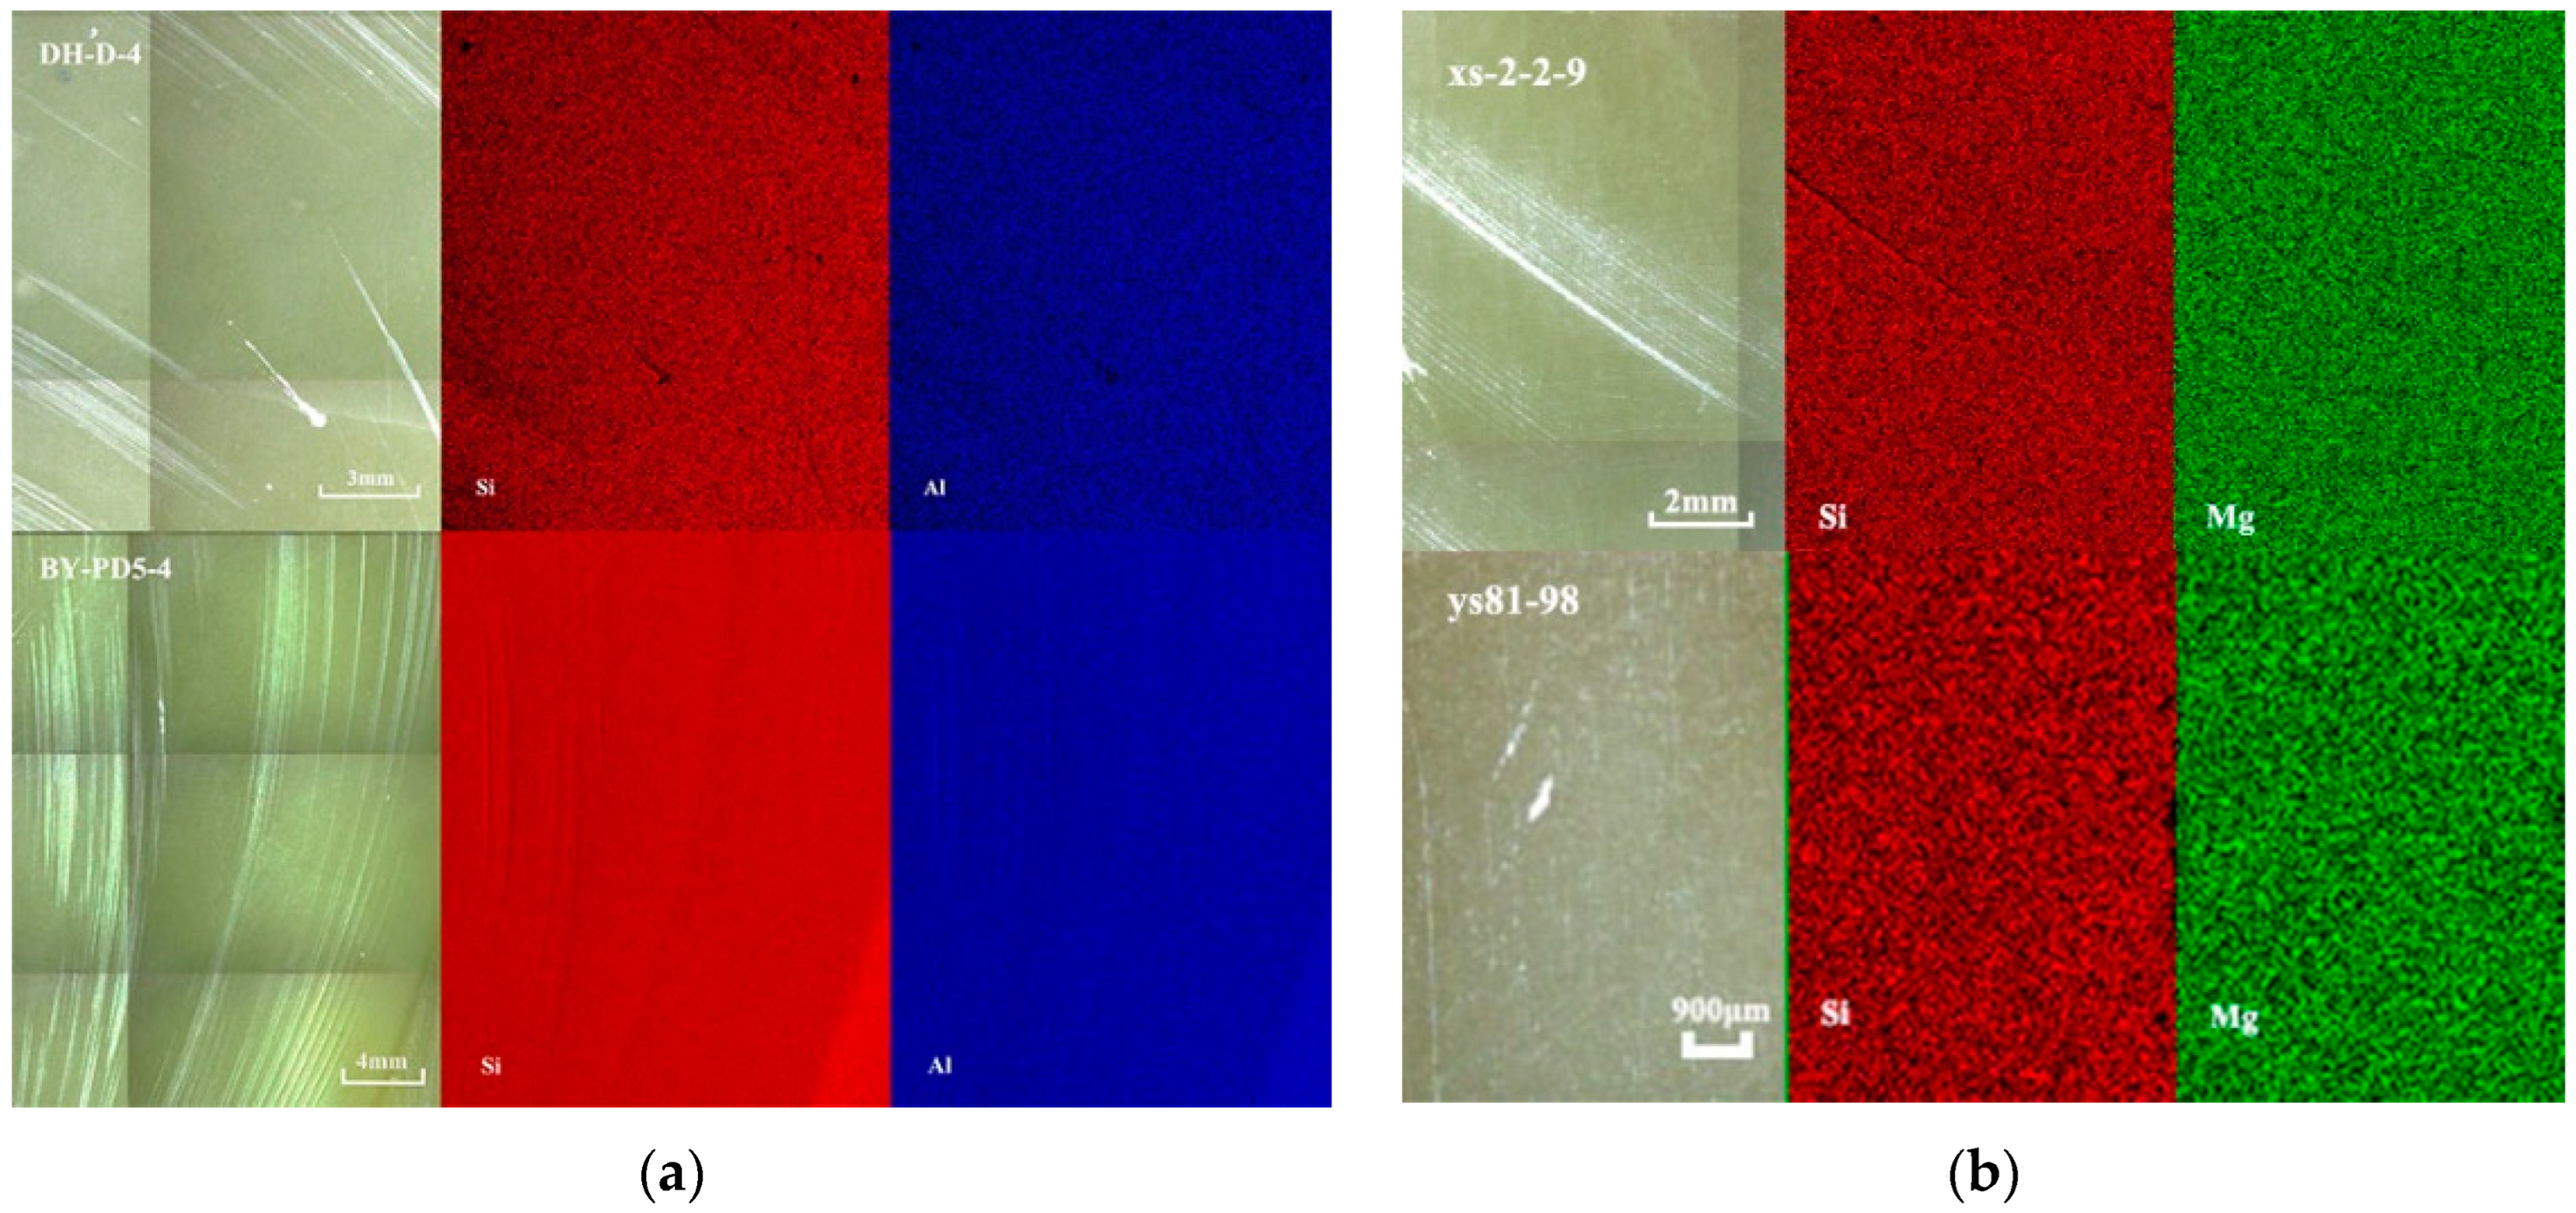

| Sample | Minerals | Color | Specific Gravity (SG) | Isomorphism (ω%) |
|---|---|---|---|---|
| DH-D-4 | Pyrophyllite | Yellow green | 2.82 | Mg/0. 19%, Fe/0.10%, Ti/0.05%, S/0.02% |
| BY-PD-4 | Pyrophyllite | Yellow green | 2.81 | Mg/0.51%, Cl/0.25%, Fe/0.14%, S/0.02% |
| xs-2-2-9 | Talc | White | 2.76 | Fe/0.10%, Cr/0.01%, Ti/0.01% |
| ys81-98 | Talc | Light yellow | 2.77 | Fe/0.28%, Al/0.09%, Cl/0.02%, Ti/0.01% |
| Band Assignment | Pyrophyllite [12] | Talc [13] | DH-D-4 | BY-PD-4 | xs-2-2-9 | ys81-98 |
|---|---|---|---|---|---|---|
| Si-O bending vibration | 422 | 419 | 419 | |||
| O-H bending vibration | 450 | 423 439 452 | 423 438 451 | |||
| Si-O bending vibration | 459 | 457 | 457 | |||
| O-H bending vibration | 465 | 466 | 465 | |||
| Si-O bending vibration | 480 | 482 | 482 | |||
| Si-O-Al bending vibration | 516 | 518 | 518 | |||
| O-H bending vibration | 538 | 535 | 535 | |||
| Si-O-Al bending vibration | 541 | 540 | 540 | |||
| 578 | 575 | 575 | ||||
| OH bending vibration | 669 | 668 | 669 | |||
| OH bending | 690 | 692 | 694 | |||
| OH species | 781 | 781 | 781 | |||
| Al-OH bending vibration | 812 | 812 | 812 | |||
| 833 | 834 | 834 | ||||
| 853 | 852 | 852 | ||||
| 949 | 950 | 950 | ||||
| Si-O stretching vibration | 1020 | 1020 | ||||
| Si-O-Si stretching vibration | 1052 | 1051 | 1051 | |||
| 1068 | 1070 | 1070 | ||||
| Si-O stretching vibration | 1122 | 1121 | 1121 | |||
| H2O band | 1632 | 1634 | 1634 | |||
| Overtone of SiO4 vibrational mode of 2ν3 | 2850 | 2850 | 2855 | 2853 | 2857 | 2855 |
| 2925 | 2926 | 2926 | 2928 | 2928 | ||
| O-H stretching vibration | 3590 | 3590 | 3588 | 3584 | 3584 | |
| 3630 | 3623 | 3630 | 3630 | 3625 | 3624 | |
| 3645 | 3644 | 3642 | 3644 | 3644 | 3645 | |
| 3652 | 3655 | 3658 | ||||
| 3675 | 3676 | 3674 | 3674 | 3675 | 3675 | |
| 3700 | 3703 | 3703 | 3707 | 3707 |
| Sample | Measured Peak | Fundamental Peaks | Theoretical Peak [24,25] | Δ |
|---|---|---|---|---|
| DH-D-4 | 4615 | 3674 + 950 | 4624 | 9 |
| BY-PD-4 | 4617 | 3674 + 950 | 4624 | 7 |
| xs-2-2-9 | 4056 | 3625 + 439 | 4064 | 8 |
| 4177 | 3644 + 535 | 4179 | 2 | |
| 4323 | 3655 + 669 | 4324 | 1 | |
| 4368 | 3675 + 692 | 4367 | 1 | |
| ys81-98 | 4056 | 3624 + 438 | 4062 | 6 |
| 4177 | 3645 + 535 | 4180 | 3 | |
| 4323 | 3658 + 669 | 4327 | 4 | |
| 4368 | 3675 + 694 | 4369 | 1 |
| Sample | Measured Peak | Fundamental Peaks | Factor | Sample | Measured Peak | Fundamental Peaks | Factor |
|---|---|---|---|---|---|---|---|
| DH-D-4 | 7094 | (3630 + 3642)/2 | 1.9510 | BY-PD-4 | 7094 | (3630 + 3644)/2 | 1.9505 |
| 7118 | 3642 | 1.9544 | 7118 | 3644 | 1.9533 | ||
| 7175 | 3674 | 1.9529 | 7175 | 3674 | 1.9529 | ||
| 7231 | 3703 | 1.9527 | 7231 | 3703 | 1.9527 | ||
| Average 1.9528 | Average 1.9524 | ||||||
| xs-2-2-9 | 7094 | (3625 + 3644)/2 | 1.9519 | ys81-98 | 7089 | (3624 + 3645)/2 | 1.9505 |
| 7118 | 3644 | 1.9533 | 7118 | 3645 | 1.9528 | ||
| 7183 | 3675 | 1.9546 | 7183 | 3675 | 1.9546 | ||
| 7231 | 3707 | 1.9506 | 7236 | 3707 | 1.9519 | ||
| Average 1.9526 | Average 1.9525 |
Publisher’s Note: MDPI stays neutral with regard to jurisdictional claims in published maps and institutional affiliations. |
© 2022 by the authors. Licensee MDPI, Basel, Switzerland. This article is an open access article distributed under the terms and conditions of the Creative Commons Attribution (CC BY) license (https://creativecommons.org/licenses/by/4.0/).
Share and Cite
Wu, H.; He, M.; Wu, S.; Yang, M.; Liu, X. Near-Infrared Spectroscopy Study of OH Stretching Modes in Pyrophyllite and Talc. Crystals 2022, 12, 1759. https://doi.org/10.3390/cryst12121759
Wu H, He M, Wu S, Yang M, Liu X. Near-Infrared Spectroscopy Study of OH Stretching Modes in Pyrophyllite and Talc. Crystals. 2022; 12(12):1759. https://doi.org/10.3390/cryst12121759
Chicago/Turabian StyleWu, Haoyu, Mingyue He, Shaokun Wu, Mei Yang, and Xi Liu. 2022. "Near-Infrared Spectroscopy Study of OH Stretching Modes in Pyrophyllite and Talc" Crystals 12, no. 12: 1759. https://doi.org/10.3390/cryst12121759
APA StyleWu, H., He, M., Wu, S., Yang, M., & Liu, X. (2022). Near-Infrared Spectroscopy Study of OH Stretching Modes in Pyrophyllite and Talc. Crystals, 12(12), 1759. https://doi.org/10.3390/cryst12121759