Article

Citrate-Capped AuNP Fabrication, Characterization and Comparison with Commercially Produced Nanoparticles

by
Abdul Ghaffar Memon
1,2,*,
Iftikhar Ahmed Channa
3,*,
Asif Ahmed Shaikh
1,
Jabran Ahmad
3,4,
Abdul Fatah Soomro
2,5,
Abdulmoseen Segun Giwa
6,
Zenab Tariq Baig
2,7,
Wael A. Mahdi
8 and
Sultan Alshehri
8
1
Department of Environmental Engineering, NED University of Engineering and Technology, University Road, Karachi 75270, Pakistan
2
State Key Joint Laboratory of ESPC, School of Environment, Tsinghua University, Beijing 100084, China
3
Thin Film Lab, Department of Metallurgical Engineering, NED University of Engineering and Technology, University Road, Karachi 75270, Pakistan
4
Environmental Consultant, Equalis Società Cooperativa Sociale, 78130 Les Mureaux, France
5
Department of Energy & Environment Engineering, Dawood University of Engineering & Technology, Karachi 74800, Pakistan
6
School of Environment and Civil Engineering, Nanchang Institute of Science and Technology, Nanchang 330108, China
7
Department of Environmental Sciences, University of Haripur, Haripur 21120, Pakistan
8
Department of Pharmaceutics, College of Pharmacy, King Saud University, Riyadh 11451, Saudi Arabia
*
Authors to whom correspondence should be addressed.
Crystals 2022, 12(12), 1747; https://doi.org/10.3390/cryst12121747
Submission received: 8 November 2022 / Revised: 26 November 2022 / Accepted: 29 November 2022 / Published: 2 December 2022

Abstract

:
Gold nanoparticles (AuNPs) were synthesized using citrate reduction, also known as the Turkevich method. The AuNPs were compared with the commercially available product and later subjected to characterization. The AuNPs were 13 nm in diameter with a 2.7 × 10⁸ M−1cm−1 extension coefficient. The calculated concentration was 5.1 nM through the Beer–Lambert law using UV–vis absorbance spectra. Further detailed characterization was applied, such as scanning electron microscopy (SEM), high-resolution transmission electron microscopy (HR-TEM), elemental analysis using electro and DLS instruments, energy-dispersive X-ray spectroscopy (EDS), XRD, and Zeta potential. The synthesized AuNPs had a higher UV-absorbance peak of 0.93 in comparison to commercially available nanoparticles at 5.8 identical conditions. The characterization confirmed successful fabrication of colloidal-citrate-capped AuNPs and their dispersed and aggregated state with induced salt concentration. The shape and morphology were confirmed through XRD, showing a face-centered cubic lattice of {111}, confirmed at 38.1 round shape, and a crystalline lattice. AuNPs tend to be applied in sensing, detection, drug delivery, pharmaceuticals, and other applications in the environment and materials. Other applications include environmental contaminant detection, colorimetric sensors, antimicrobial applications, biosensing and drug delivery, tissue engineering, nanomedicines, optoelectronics, and catalysts.

1. Introduction

Various metallic nanoparticles are being synthesized using green methods; such nanoparticles include gold [1], silver [2], copper [3], zirconium oxide, platinum [4], zinc oxide [5], titanium oxide & Silica along with nanoclay [5,6,7], and many more. Among these metallic nanoparticles, gold nanoparticles (Au-NPs) are the material of choice for researchers due to their remarkable properties, such as chemical stability, broad spectra, antimicrobial activity, surface-enhanced Raman scattering, and nonlinear optical behavior [8]. A broader spectrum of the fungicidal and bactericidal activity of Au-NPs has made them an extremely popular component in the fields of medicine, agriculture, food preservation, biosensing, and consumer products [9]. Nanoparticle (NP) fabrication has become a new paradigm in the field of material science, as NPs have found a variety of applications, including environmental, pharmaceutical, medicinal, textile, and many more. The application of AuNPs in the development of sensors that can be used for heavy-metal detection, medicine, and drug delivery along with renewable energy applications [10,11,12,13,14] are of particular interest. AuNPs are also used as catalysts in a number of reactions. Some researchers have also shown effective results of AuNPs in fuel-cell technology. Therefore, in order to maintain the constant supply of AuNPs, several cost-effective and high-yielding techniques have been developed [15,16].
Recently, the synthesis of AuNPs from green sources, using cost-effective methods, has evolved and is the widely used technique for particle production. Due to its cost effectiveness and simple steps, Turkevich is viewed as the most frequently used method [3]. Since the first reported fabrication of AuNPs in 1973 by Michael Faraday [16], the citrate reduction method developed by Turkevich et al. [17] received a great deal of attention. This green method offers a number of advantages over other conventional methods, such as cost savings, less energy consumption, and ambient-condition processing, thus eliminating the strict requirements for inert atmosphere maintenance [4,5,15]. Different sizes and shapes, such as spheres, cubes [18], rods [19], shells [20], stars [21], and prisms [22], have been synthesized via this method and applied in various applications, including biosensing. This is considered one of the most commonly used techniques for formulating spherical AuNPs since AuNPs prepared using this method can have sizes down to 1–2 nm. The basic principle of this technique involves the reduction of gold ions (Au3+) to produce gold atoms (Au) by using reducing agents, such as amino acids, ascorbic acid, UV light, or citrate. The stabilization of AuNPs is achieved by using different capping/stabilizing agents. At the beginning, the applications of the Turkevich method were finite because of the limited range of AuNPs that could be synthesized using this technique. Later, after several advancements to the basic method, researchers were able to extend the size range of particles synthesized using this method as it was initially established by varying the ratio of reducing, as well as stabilizing, agents. Therefore, with the help of this advancement, AuNPs within the range of 16 to 147 nm can be produced, and that size of NPs can play a significant role as well. Also, these Turkevich methods give great control over the size and shape of the particles [23,24]. Due to the stable structure and strong electrostatic properties of localized surface-plasmon resonance (LSPR) [25,26], spherical-shaped colloidal gold nanoparticles have been widely applied in the development of labels [27], label-free [28], colorimetric [29], and evanescent-wave optical biosensing strategies [30]. Apart from the Turkevich method, seed-mediated growth and digestive ripening have also been reported in the literature [17]. According to the literature, the formulation of AuNPs involves two main stages. In the first stage, the gold precursor, which is usually an aqueous gold salt solution, is reduced to gold nanoparticles using a specific reducing agent, such as citrate. In the second stage, the stabilization of gold nanoparticles is carried out by a specific capping agent. The capping agents hinder the agglomeration of metallic nanoparticles.
In this research, the Turkevich method has been employed to synthesize gold nanoparticles, and prepared particles were fully characterized by various means, including SEM, TEM, UV–vis, EDS, XRD, zeta sizer and particle-size distribution, etc. In the literature, no research was found to provide the full characterization of AuNPs, as per the best knowledge of the authors. Moreover, optimization of the synthesis process was also carried out by variations in salt concentration and relevant parameters. The synthesized particles also exhibited greater thermal stability even after months of storage. Thus, this study will be helpful for researchers to understand the synthesis and development of gold nanoparticles, as several characterizations and tests were performed. The developed gold nanoparticles are the potential materials for developing various types of calorimetric sensors for various purposes.

2. Experimental Work

2.1. Materials and Methods

Gold chloroauric acid salt (HAuCl4) was purchased from the Sinopharm Chemical Reagent Company (Shanghai, China). The trisodium citrate (C6H5Na3O7.2H2O), HNO3, HCl, and other solutions of analytical reagent grade were bought from Beijing Chemical Reagent Company. All the solutions were prepared using sterile, molecular-grade DNase-, RNase-, and Protease-free water of USP standard.

2.2. Preparation of Gold Nanoparticles

A fresh stock of the gold colloidal solution with a 13 nm diameter was synthesized through citrate reduction (Turkevich method) [17,31,32,33,34,35,36,37]. In brief, 4 mL of the gold chloric acid at 25 mM was added to 196 mL of molecular-grade water in a piranha solution (HCl: HNO3 3:1), pre-rinsed in a 250 mL round-bottom flask containing magnetic beads, and heated to above 100 °C in an oil bath. Later, 20 mL of the citrate solution at 38.8 mM was rapidly injected into the heating solution and continued to be vigorously stirred for 30 min. The color of the reaction changed from light, pale gold to colorless and then to a red-wine. The synthesized AuNPs were then stored at 4 °C for further use. A small volume was taken for concentration calculation and further characterization.

2.3. Characterization

The UV–Vis Spectrophotometer U-3900 of Hitachi, Japan was used for recording absorption spectra in the concentration calculation and measurement. Scanning electron microscope GeminiSEM 500 (Carl Zeiss Microscopy GmbH, Jena, Germany), high-resolution transmission electron microscopy (HR-TEM) (JEOL JEM—2100F) (JOEL, Tokyo, Japan), and energy-dispersive X-ray spectroscopy (EDS) with SDD detector for TEM X-MaxN 80T (Oxford Instruments, Abingdon-on-Thames, UK) were utilized in the characterization of AuNPs. Zetasizer Nano ZS90 (Malvern Instruments Ltd., Malvern, UK) was used for the measurement of zeta potential and dynamic light scattering. Thermostatic oil bath DF 101S, along with silicon oil (Shin-Etsu, Tokyo, Japan), was used in the fabrication of AuNPs.

3. Results and Discussion

3.1. Characterization of AuNPs

The performance of synthesized AuNPs was compared with that of the commercial-grade nanoparticles, 13 nm in diameter, through the UV-absorption spectra. Scanning-electron microscopy (SEM), high-resolution transmission electron microscopy (HR-TEM), and elemental analysis using electro and DLS instruments were applied for detailed characterization of the synthesized AuNPs.

3.2. UV-Absorbance Spectra

The synthesized citrate-capped gold nanoparticles were further analyzed via the concentration calculation and characterization using surface morphology, size, distribution, and zeta potential. The UV–vis absorbance spectra showed a surface-plasmon resonance peak at 520 nm. The absorbance was used to calculate the concentration of nanoparticles with a 13 nm diameter using a 2.7 × 10⁸ M−1cm−1 extension coefficient [37,38,39,40] at 520 nm with the Beer–Lambert law. The calculated concentration was 5.1 nM. The lab-scale-fabricated AuNPs were compared with the commercially available colloidal solution (Figure 1). The difference in the concentration can be observed based on the absorbance-peak intensity and the extended incubation in the oil bath with open ends of the round bottom flask.
The absorbance peaks for both commercial and fabricated nanoparticles showed variation in peak intensity at 520 nm, which was mainly due to the concentration of the commercial product. Comparative UV absorbance showed fabricated nanoparticles have the same absorbance peak in their dispersed state in the presence of the citrate-capped reagent. The fabricated nanoparticles were further subjected to an induced salt reaction to compare and validate the dispersed and aggregated states of the nanoparticles.

3.3. Colorimetric Change for Dispersed vs. Aggregated AuNPs

The solution was stable at a low salt concentration since colloids provide electrostatic repulsion from negatively charged AuNPs coated with citrate. The color of the solution remained red unless aggregation with high salt concentration occurred, in which case, the color turned from red/pink to purple and then blue (Figure 2).
The change in the dispersed and aggregated states of nanoparticles can be visualized through the naked eye. The color of the nanoparticles changed from red (dispersed) to blue (aggregated), as shown in the inset of Figure 2. The spectral change can be observed through a peak shift from 520 nm to 680 nm. This phenomenon is quite helpful in developing sensing mechanisms for colorimetric detection, such as the application in environmental contaminants.

3.4. Size and Distribution Using SEM Change for Dispersed vs. Aggregated AuNPs

The AuNPs were also characterized to see the surface morphology through scanning electron microscopy SEM (GeminiSEM 500). The samples were prepared on a silica plate and an aluminum plate of 5 mm × 5 mm size. After drying, each sample after marking was placed by coating it with carbon tape over the copper disk for analysis. The SEM image was taken for the AuNPs in their dispersion and aggregated stages (Figure 3 and Figure 4).
The change between dispersed and aggregated states of the nanoparticles was further confirmed through scanning electron microscopy. Figure 3 shows a round dispersed state of the gold colloidal nanoparticles, in comparison to an induced salt concentration where the gold nanoparticles lost electrostatic repulsiveness and formed aggregated shapes, as can be observed in Figure 4.

3.5. Characterization through HR-TEM

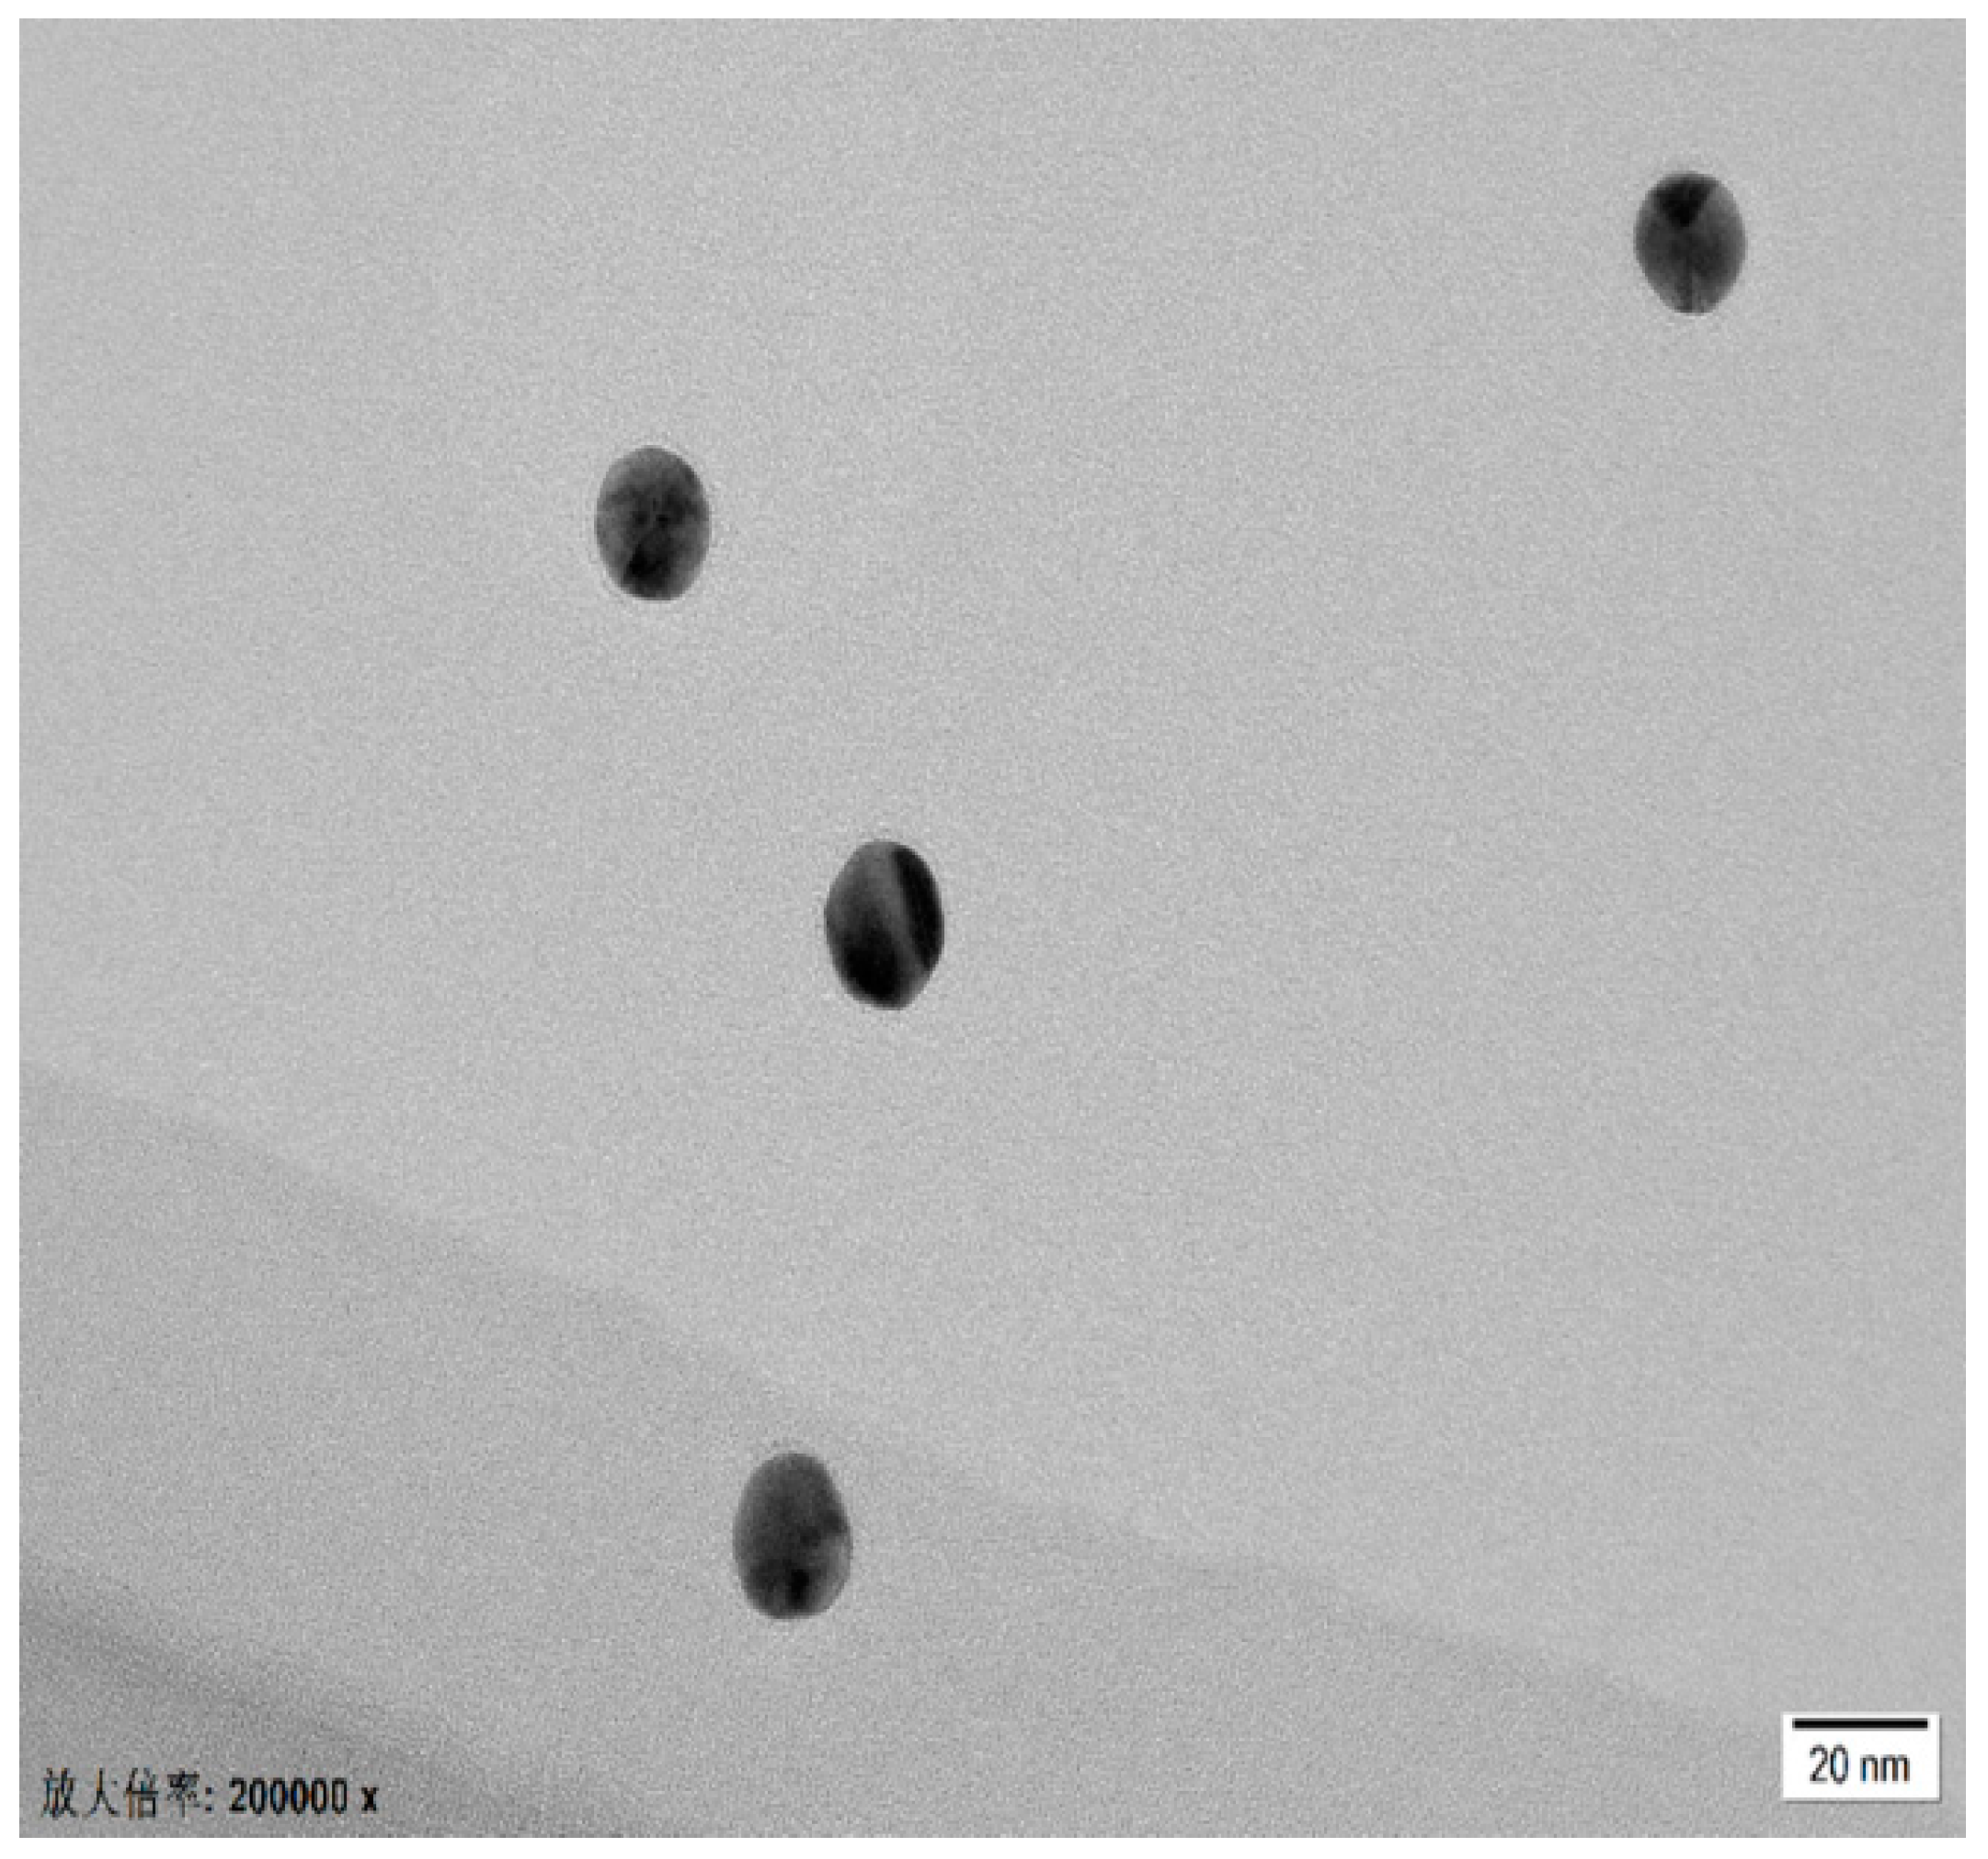
High-resolution transmission electron microscopy (HR-TEM JEOL JEM-2100F) was used for the size and morphology characterization of the synthesized AuNPs. The samples were prepared on carbon-coated copper grids a day before the analysis. Size and shape characteristics of the prepared unmodified AuNPs were analyzed on the magnification of 200,000× at 20 nm scale (Figure 5).
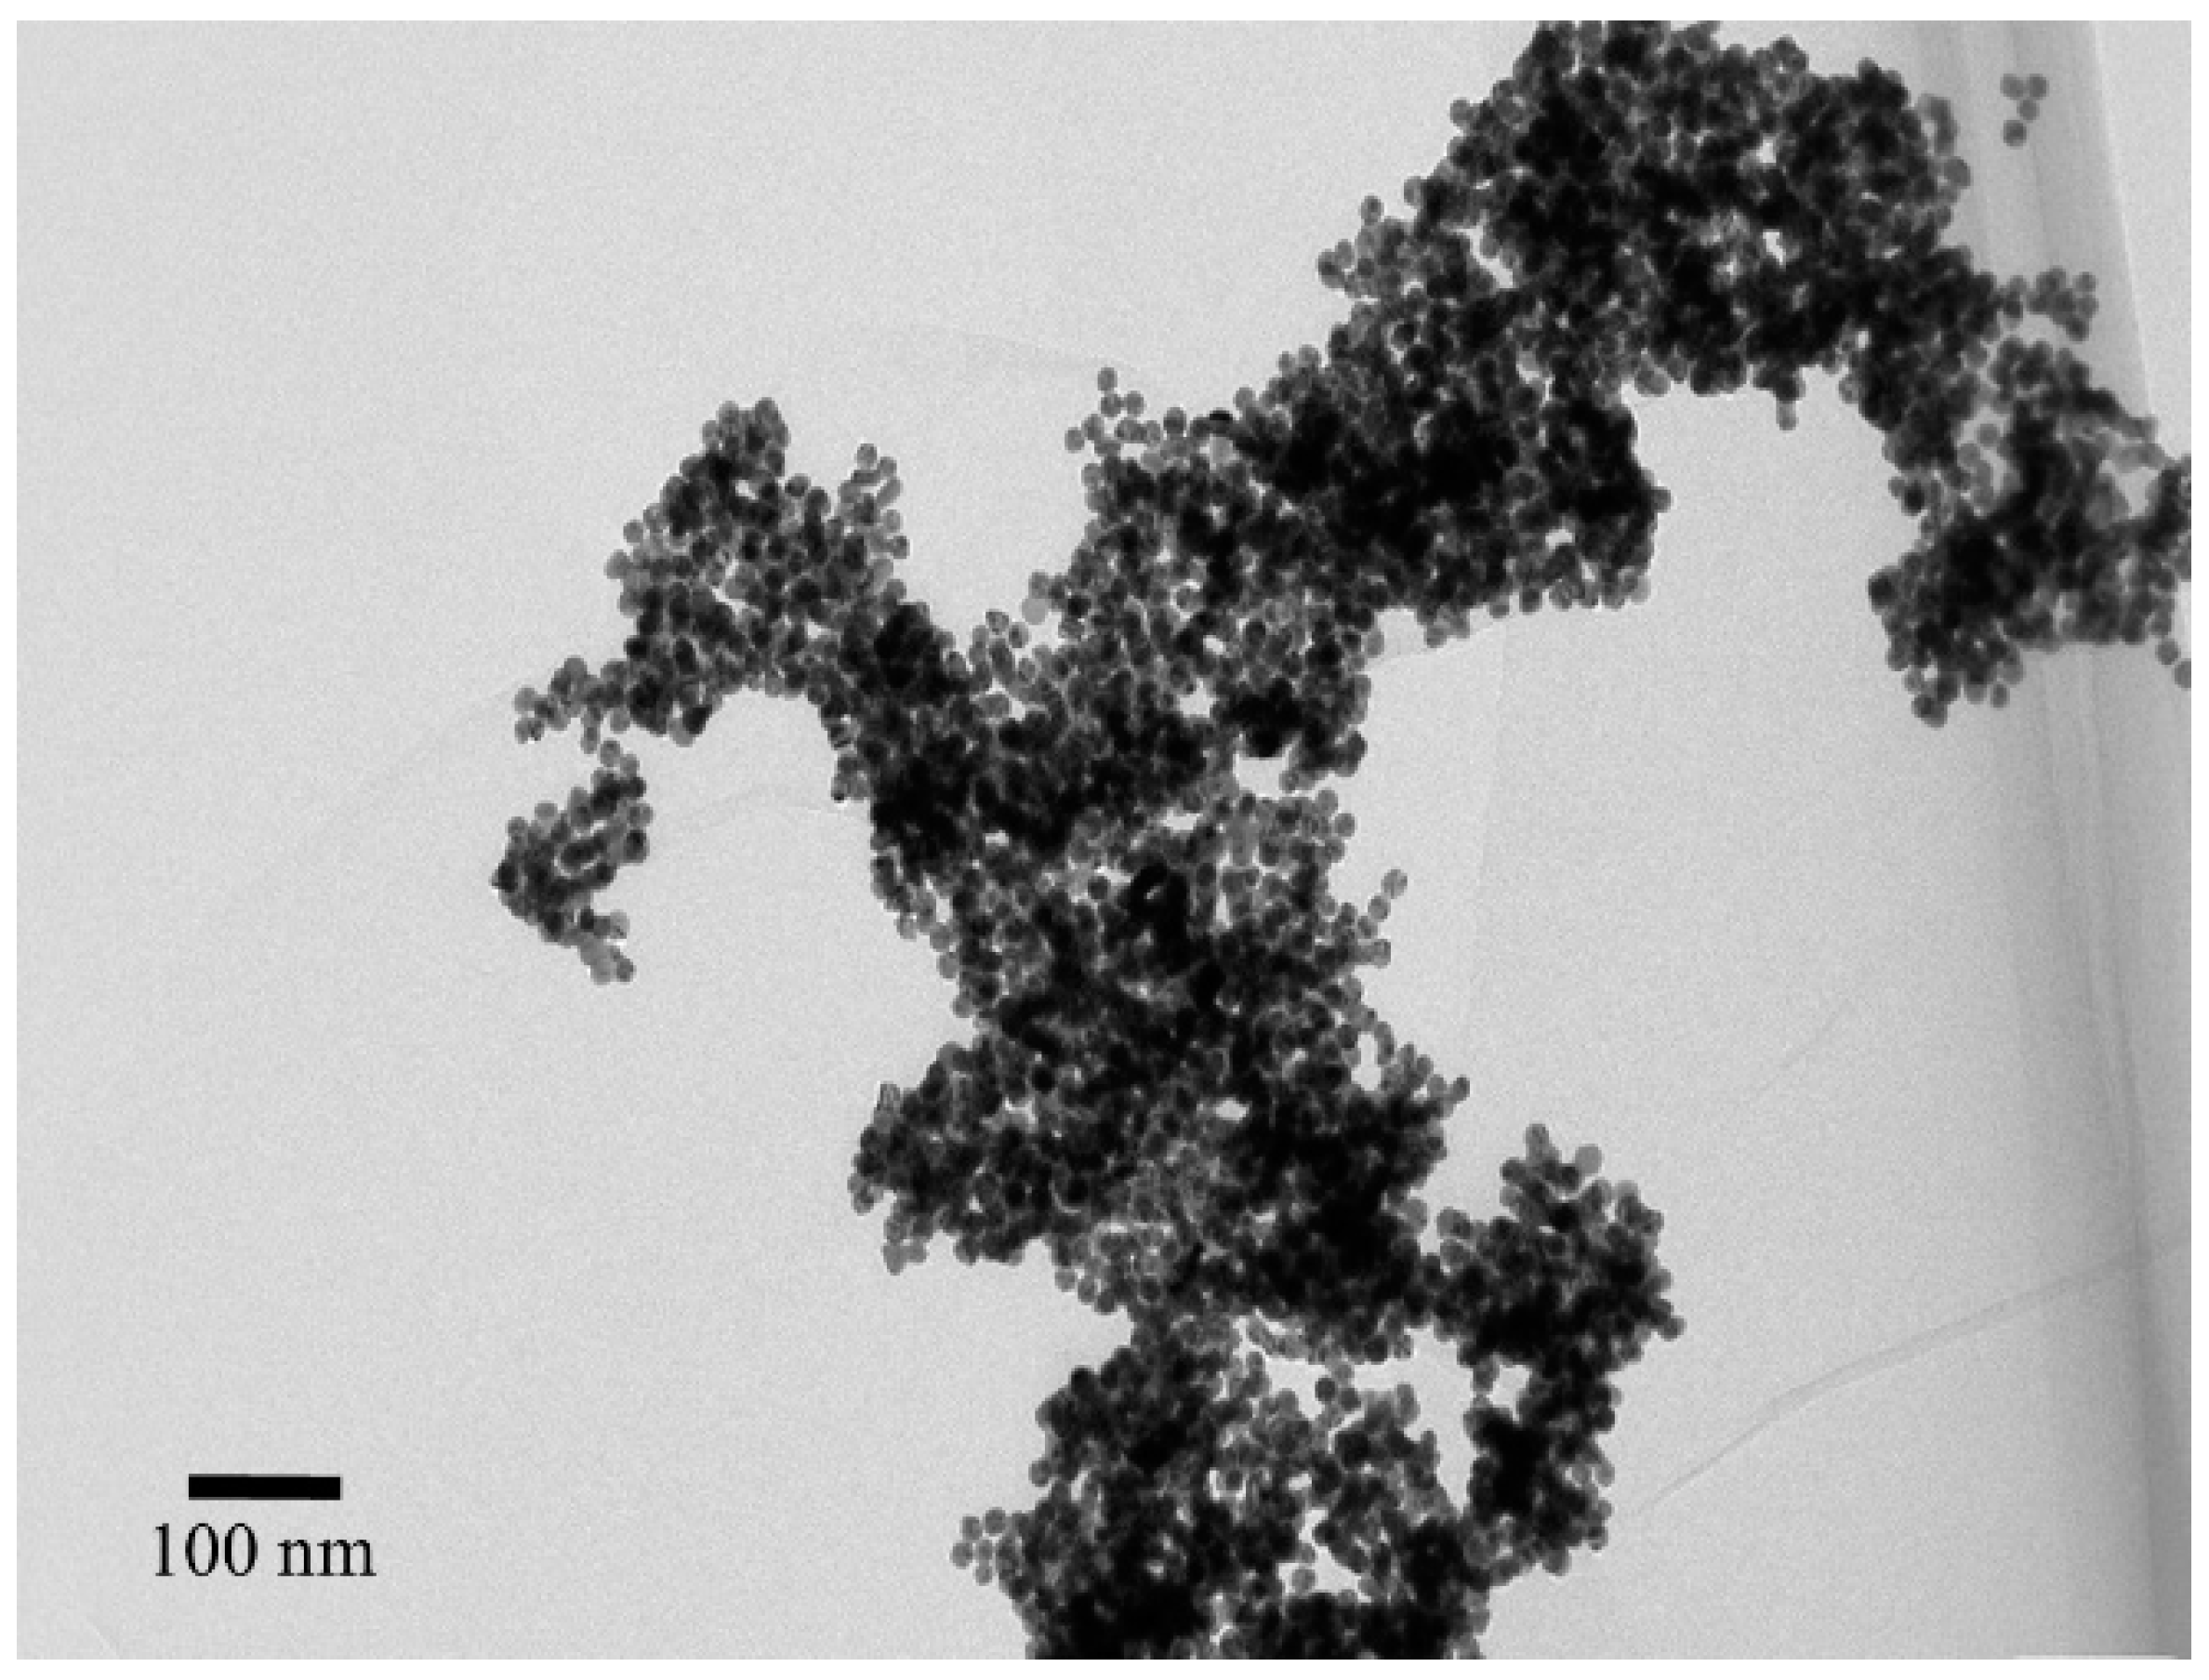
The round crystalline shape of nanoparticles at a distance reflected the dispersed state. These were further magnified to calculate the size, shape, and morphology of the fabricated nanoparticles. Figure 5 was selected, among other similar images that identified the size, shape, and morphology of the fabricated nanoparticle. Thus, the HR-TEM results validated the UV-absorbance results calculated through the Beer–Lambert law. The AuNPs were also observed for the characteristics in the aggregated stage with the addition of salt. High-resolution TEM was observed at different magnifications and scales. The characteristics depicted the overlapping of AuNPs and clustering into an aggregated form (Figure 6 and Figure 7).
These two figures represent the aggregated state of fabricated nanoparticles with induced salt concentration; the figures are captured at 50 nm and 100 nm magnification, showing an aggregated form of the nanoparticles. These results assist fabricated nanoparticles in the application and sensing of environmental contaminants, such as mercury, lead, and other similar contaminants. The shift between the dispersed and aggregated forms provides a visual shift in color from red to blue, with a change in the color shade. The quantification method can further assist in particular applications.

3.6. Elemental Analysis Using Energy-Dispersive X-ray Spectroscopy (EDS)

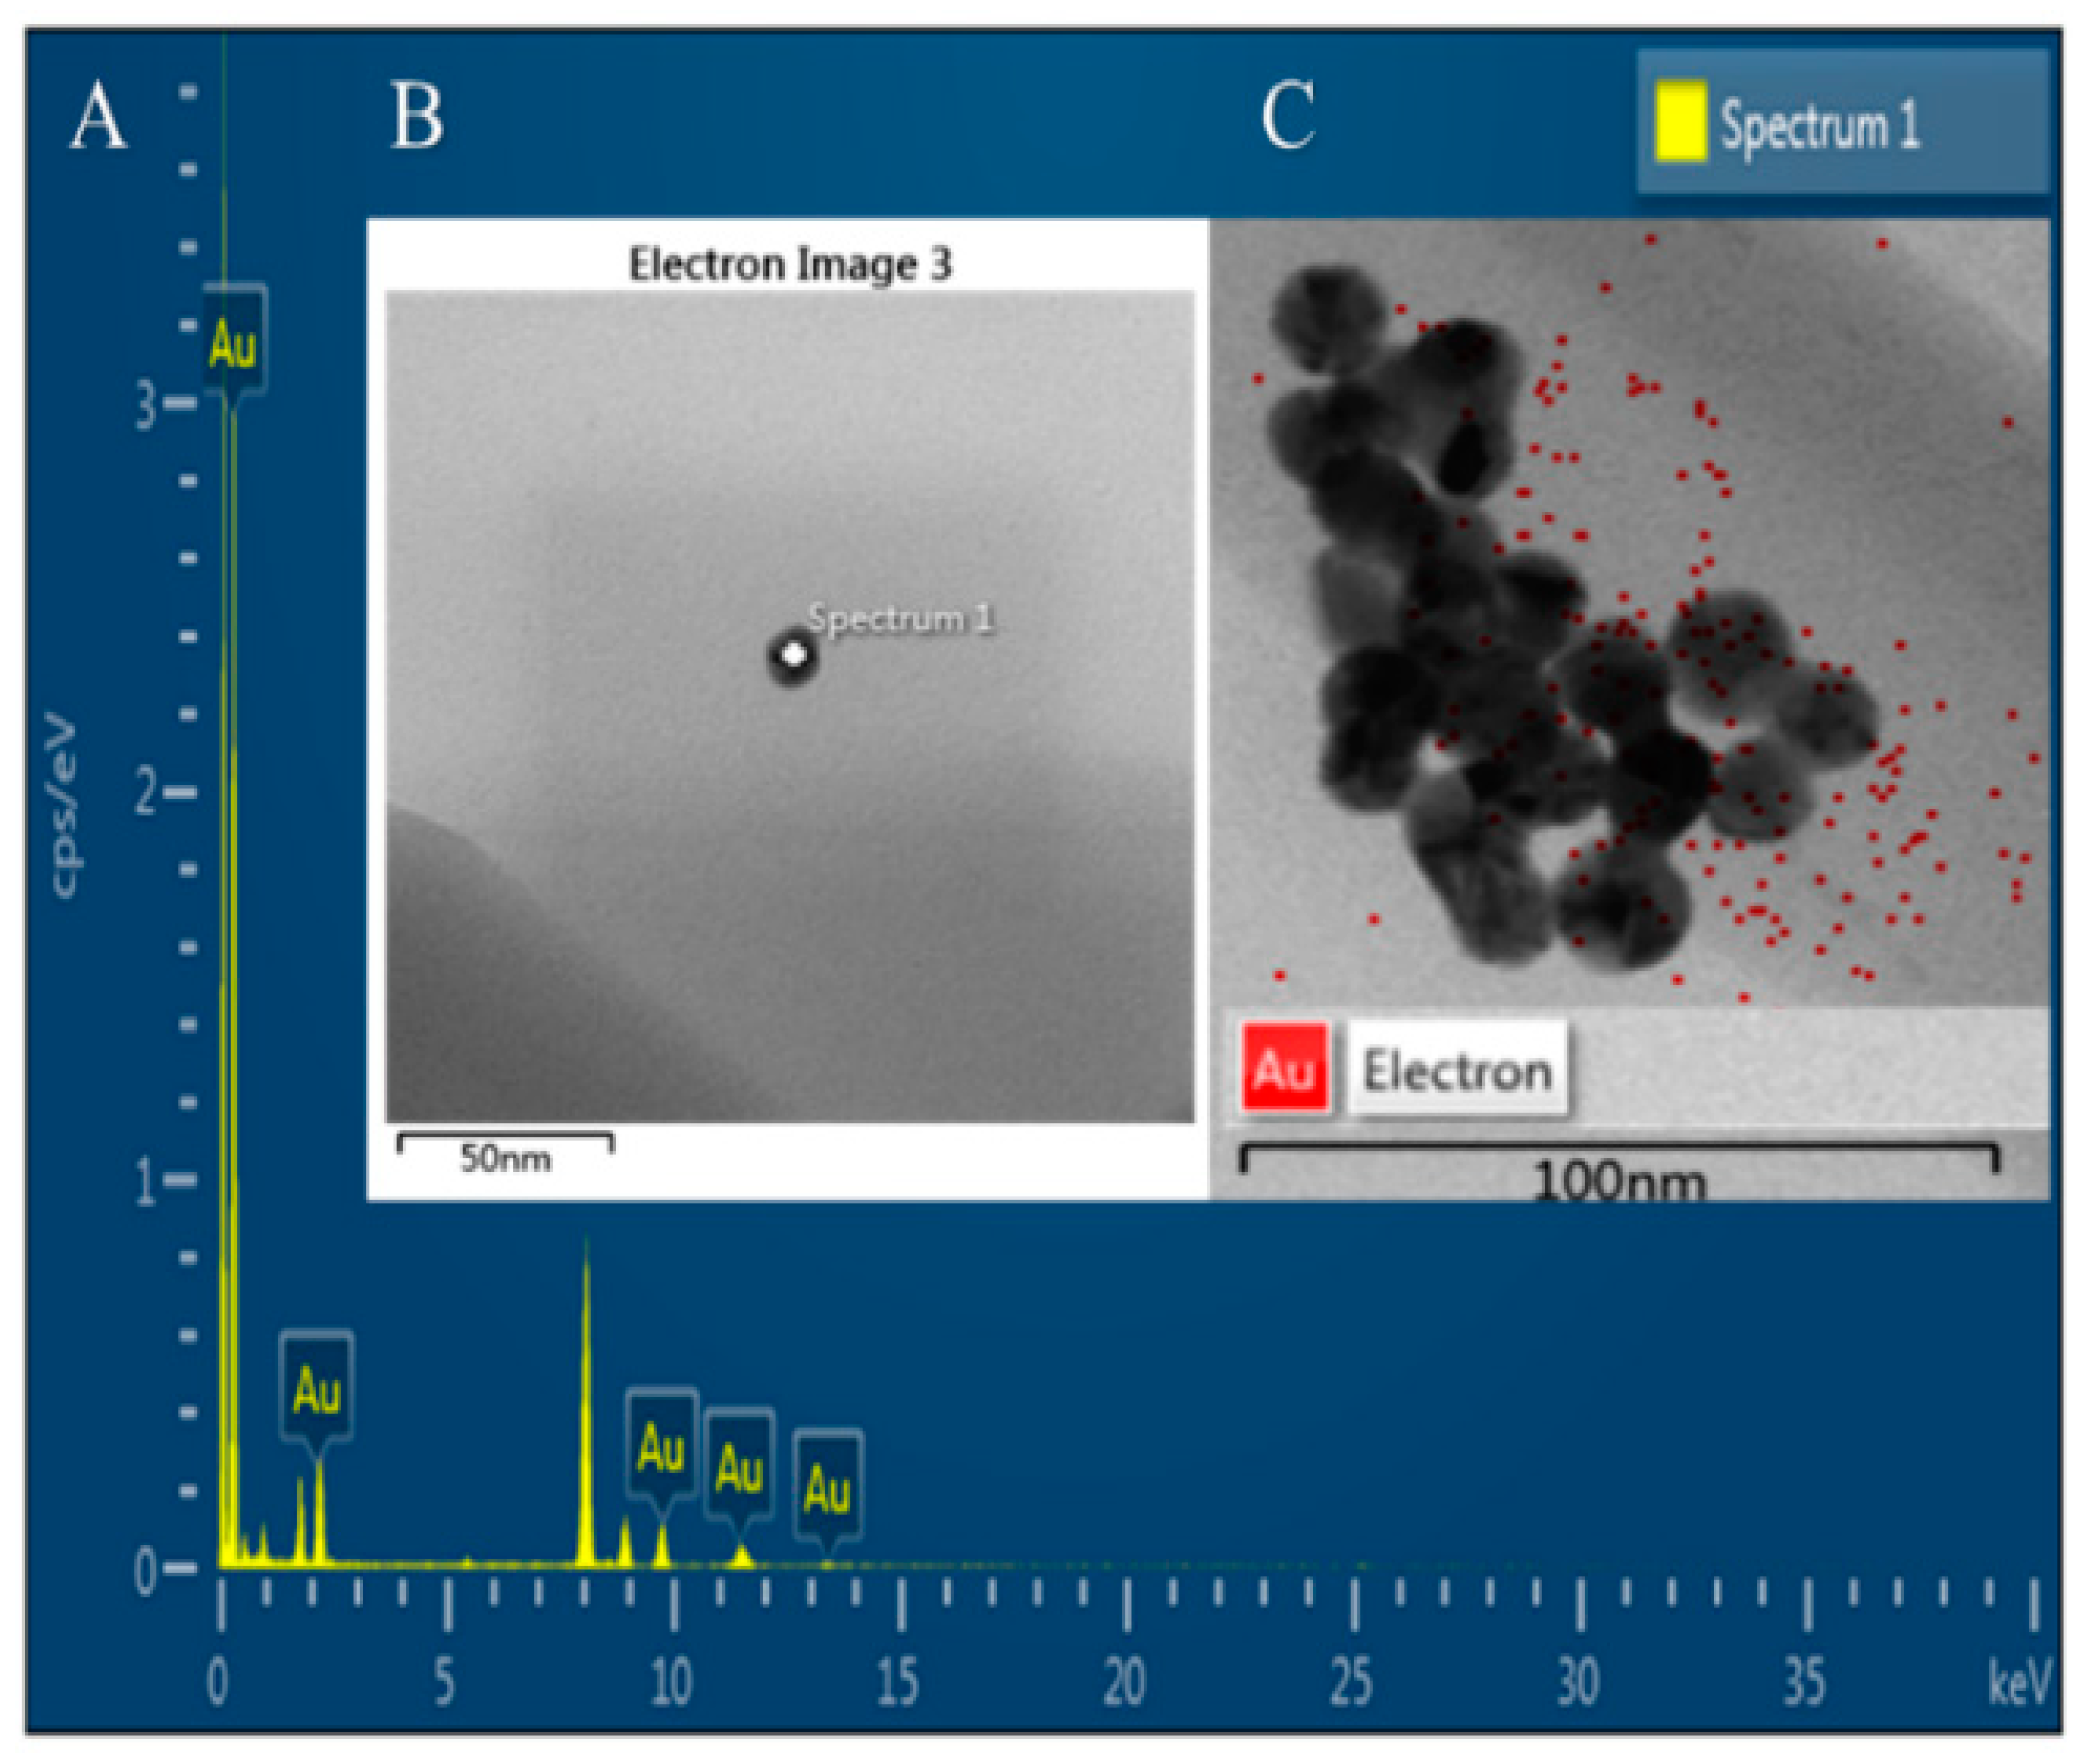
The elemental analysis of the sample was carried out using energy-dispersive X-ray spectroscopy (EDS) in addition to transmission electron microscopy using an SDD detector for TEM X-MaxN 80T. The elemental analysis for the point electron image suggests the presence of Au in the nanoparticles with a K factor of 0.944 and an absorption correction 1.0 and 100% Wt in M series line type. The layered image of the aggregated stage describes the presence of AuNPs (Figure 8).
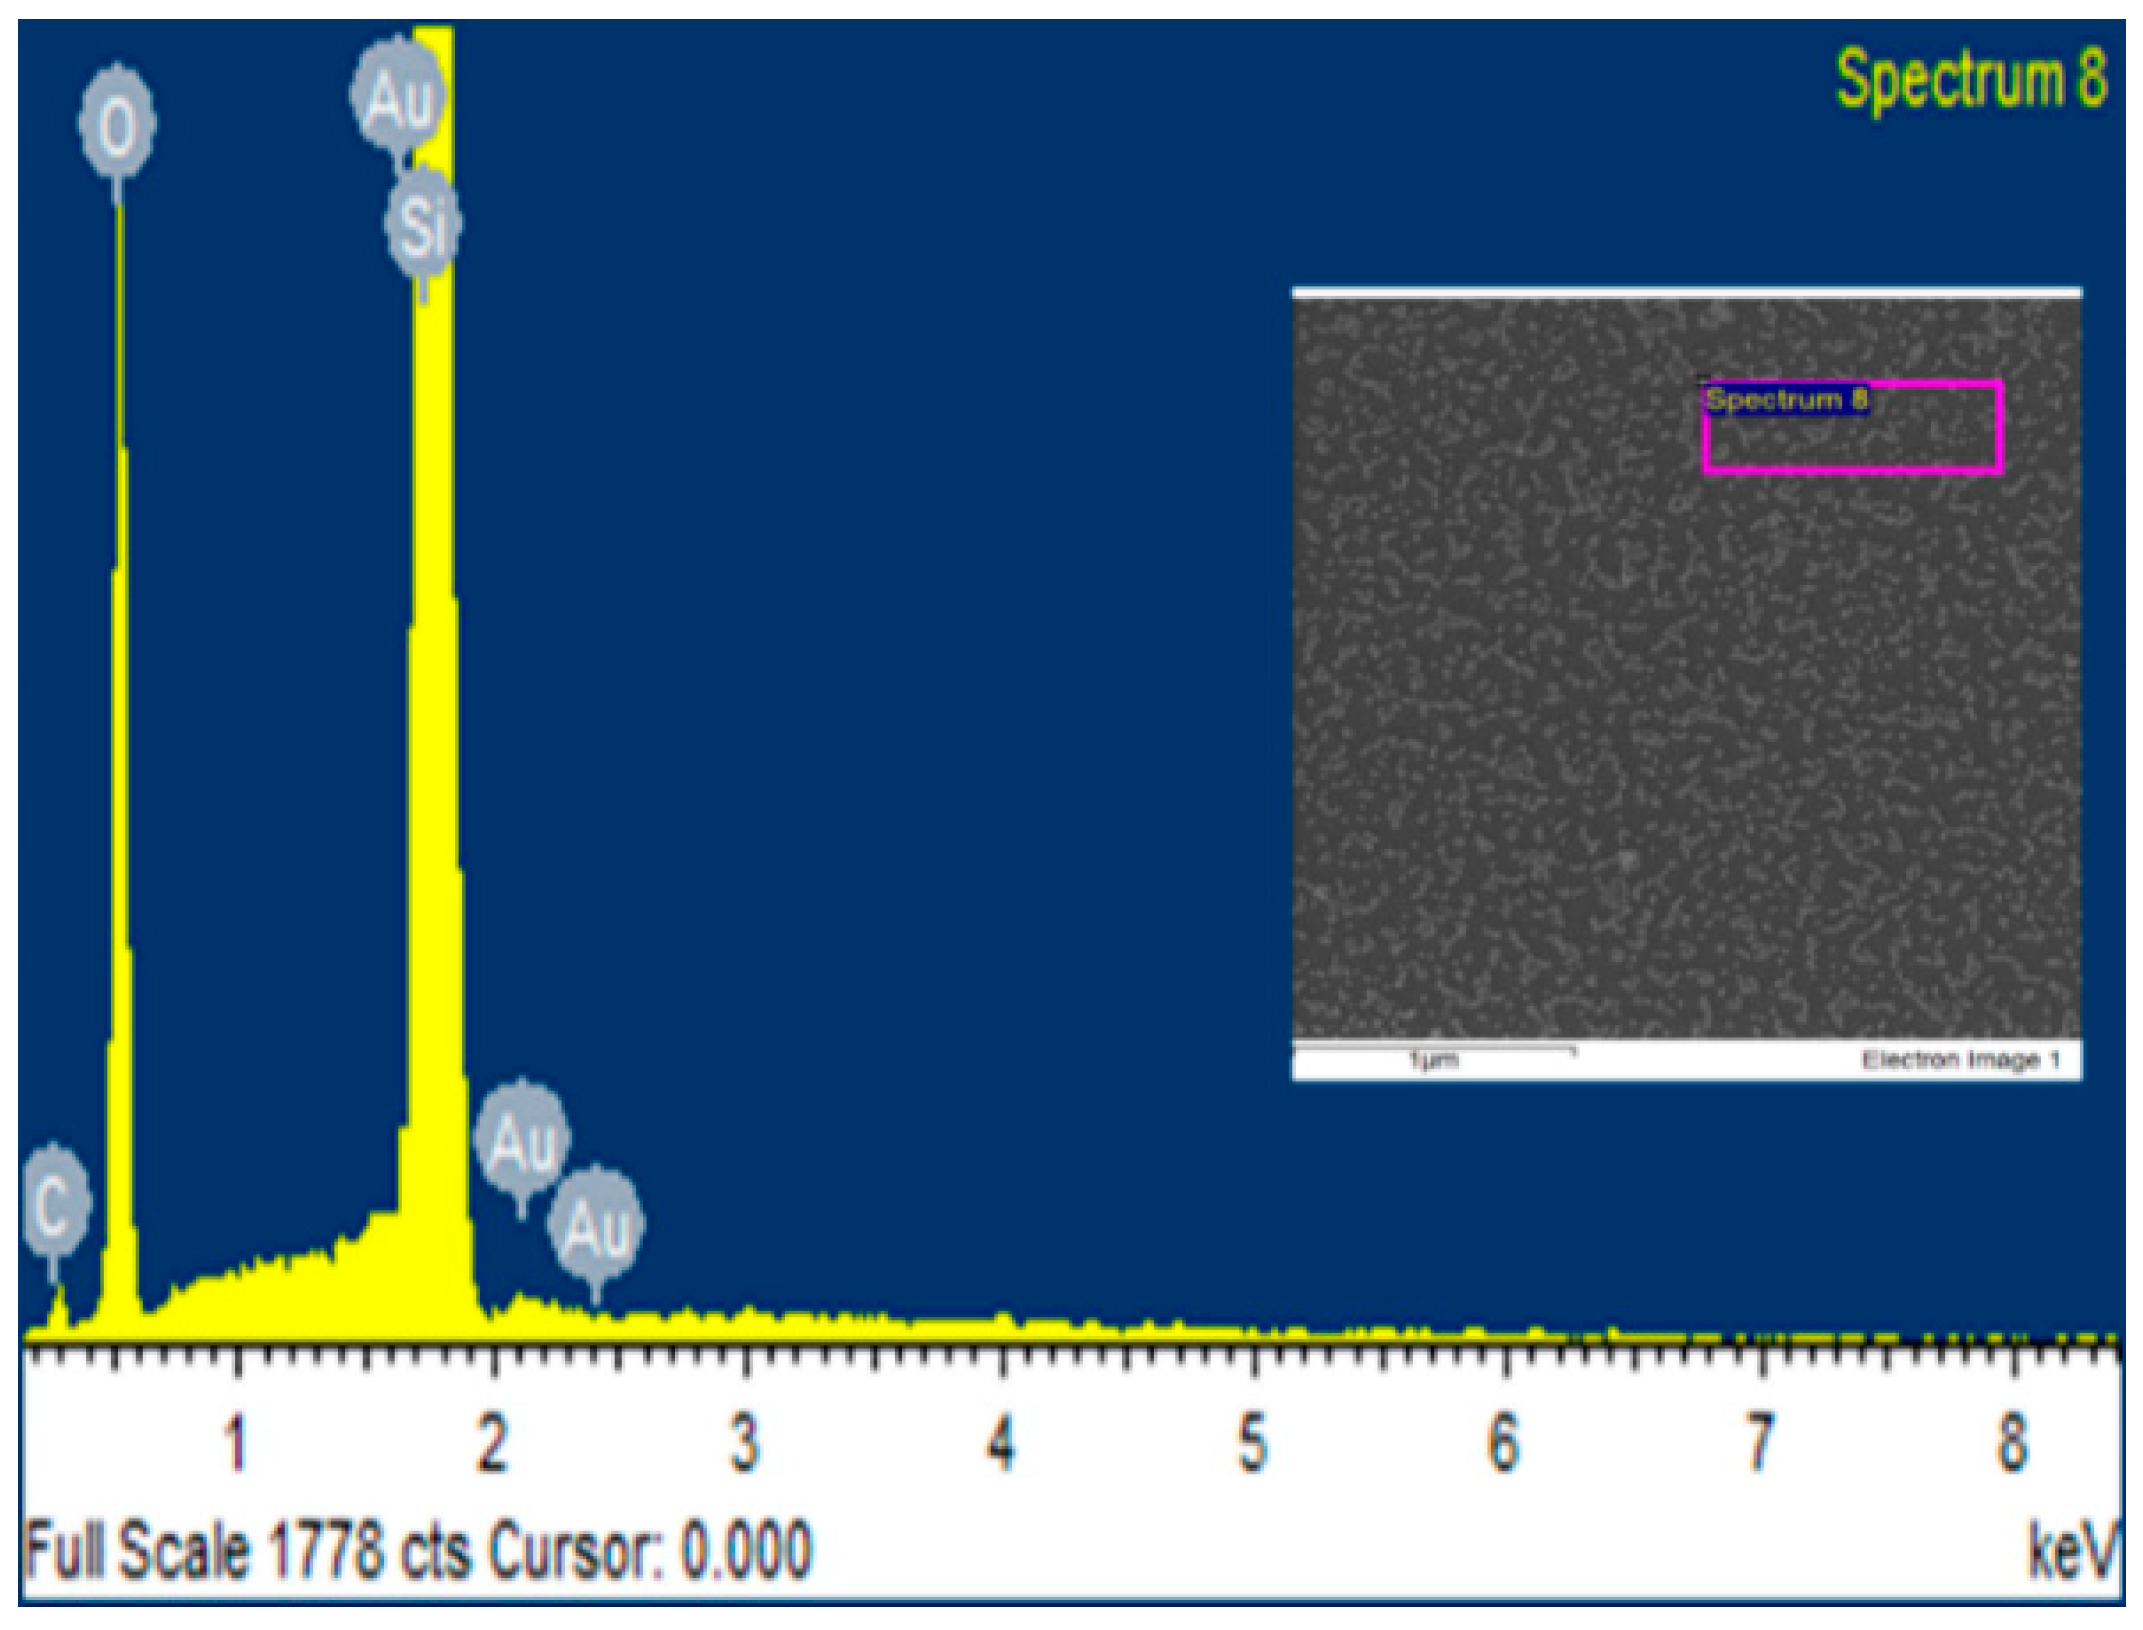
EDS was also carried out by using the SDD detector for TEM X-MaxN 80T attached to the SEM. During the EDS for AuNP samples, other peaks for Si, C, and O were observed using SEM with spectrum processing with a peak possibly omitted at 6.128 keV. Other presences of Si, C, and O were justifiable, representing the substrate base and carbon-tape coating (Figure 9). The Au showed a high-intensity peak with 100% element by weight at 0.238 and 0.523 keV (data not shown) by unchecking other known elements present on the substrate.
The EDS mapping indicated the purity of the material as gold nanoparticles, showing peak spectral values using the electron-spectrum-depicting energy-based elemental peak, which provided the single nanostructure material used in the fabrication process. Inset B of Figure 8 focuses on the spectrum point magnified to 50 nm. Inset C maps electron deposition with red dots aligned with the nanoparticles. There were a few artifacts that were neglected in the assessment.

3.7. XRD Analysis

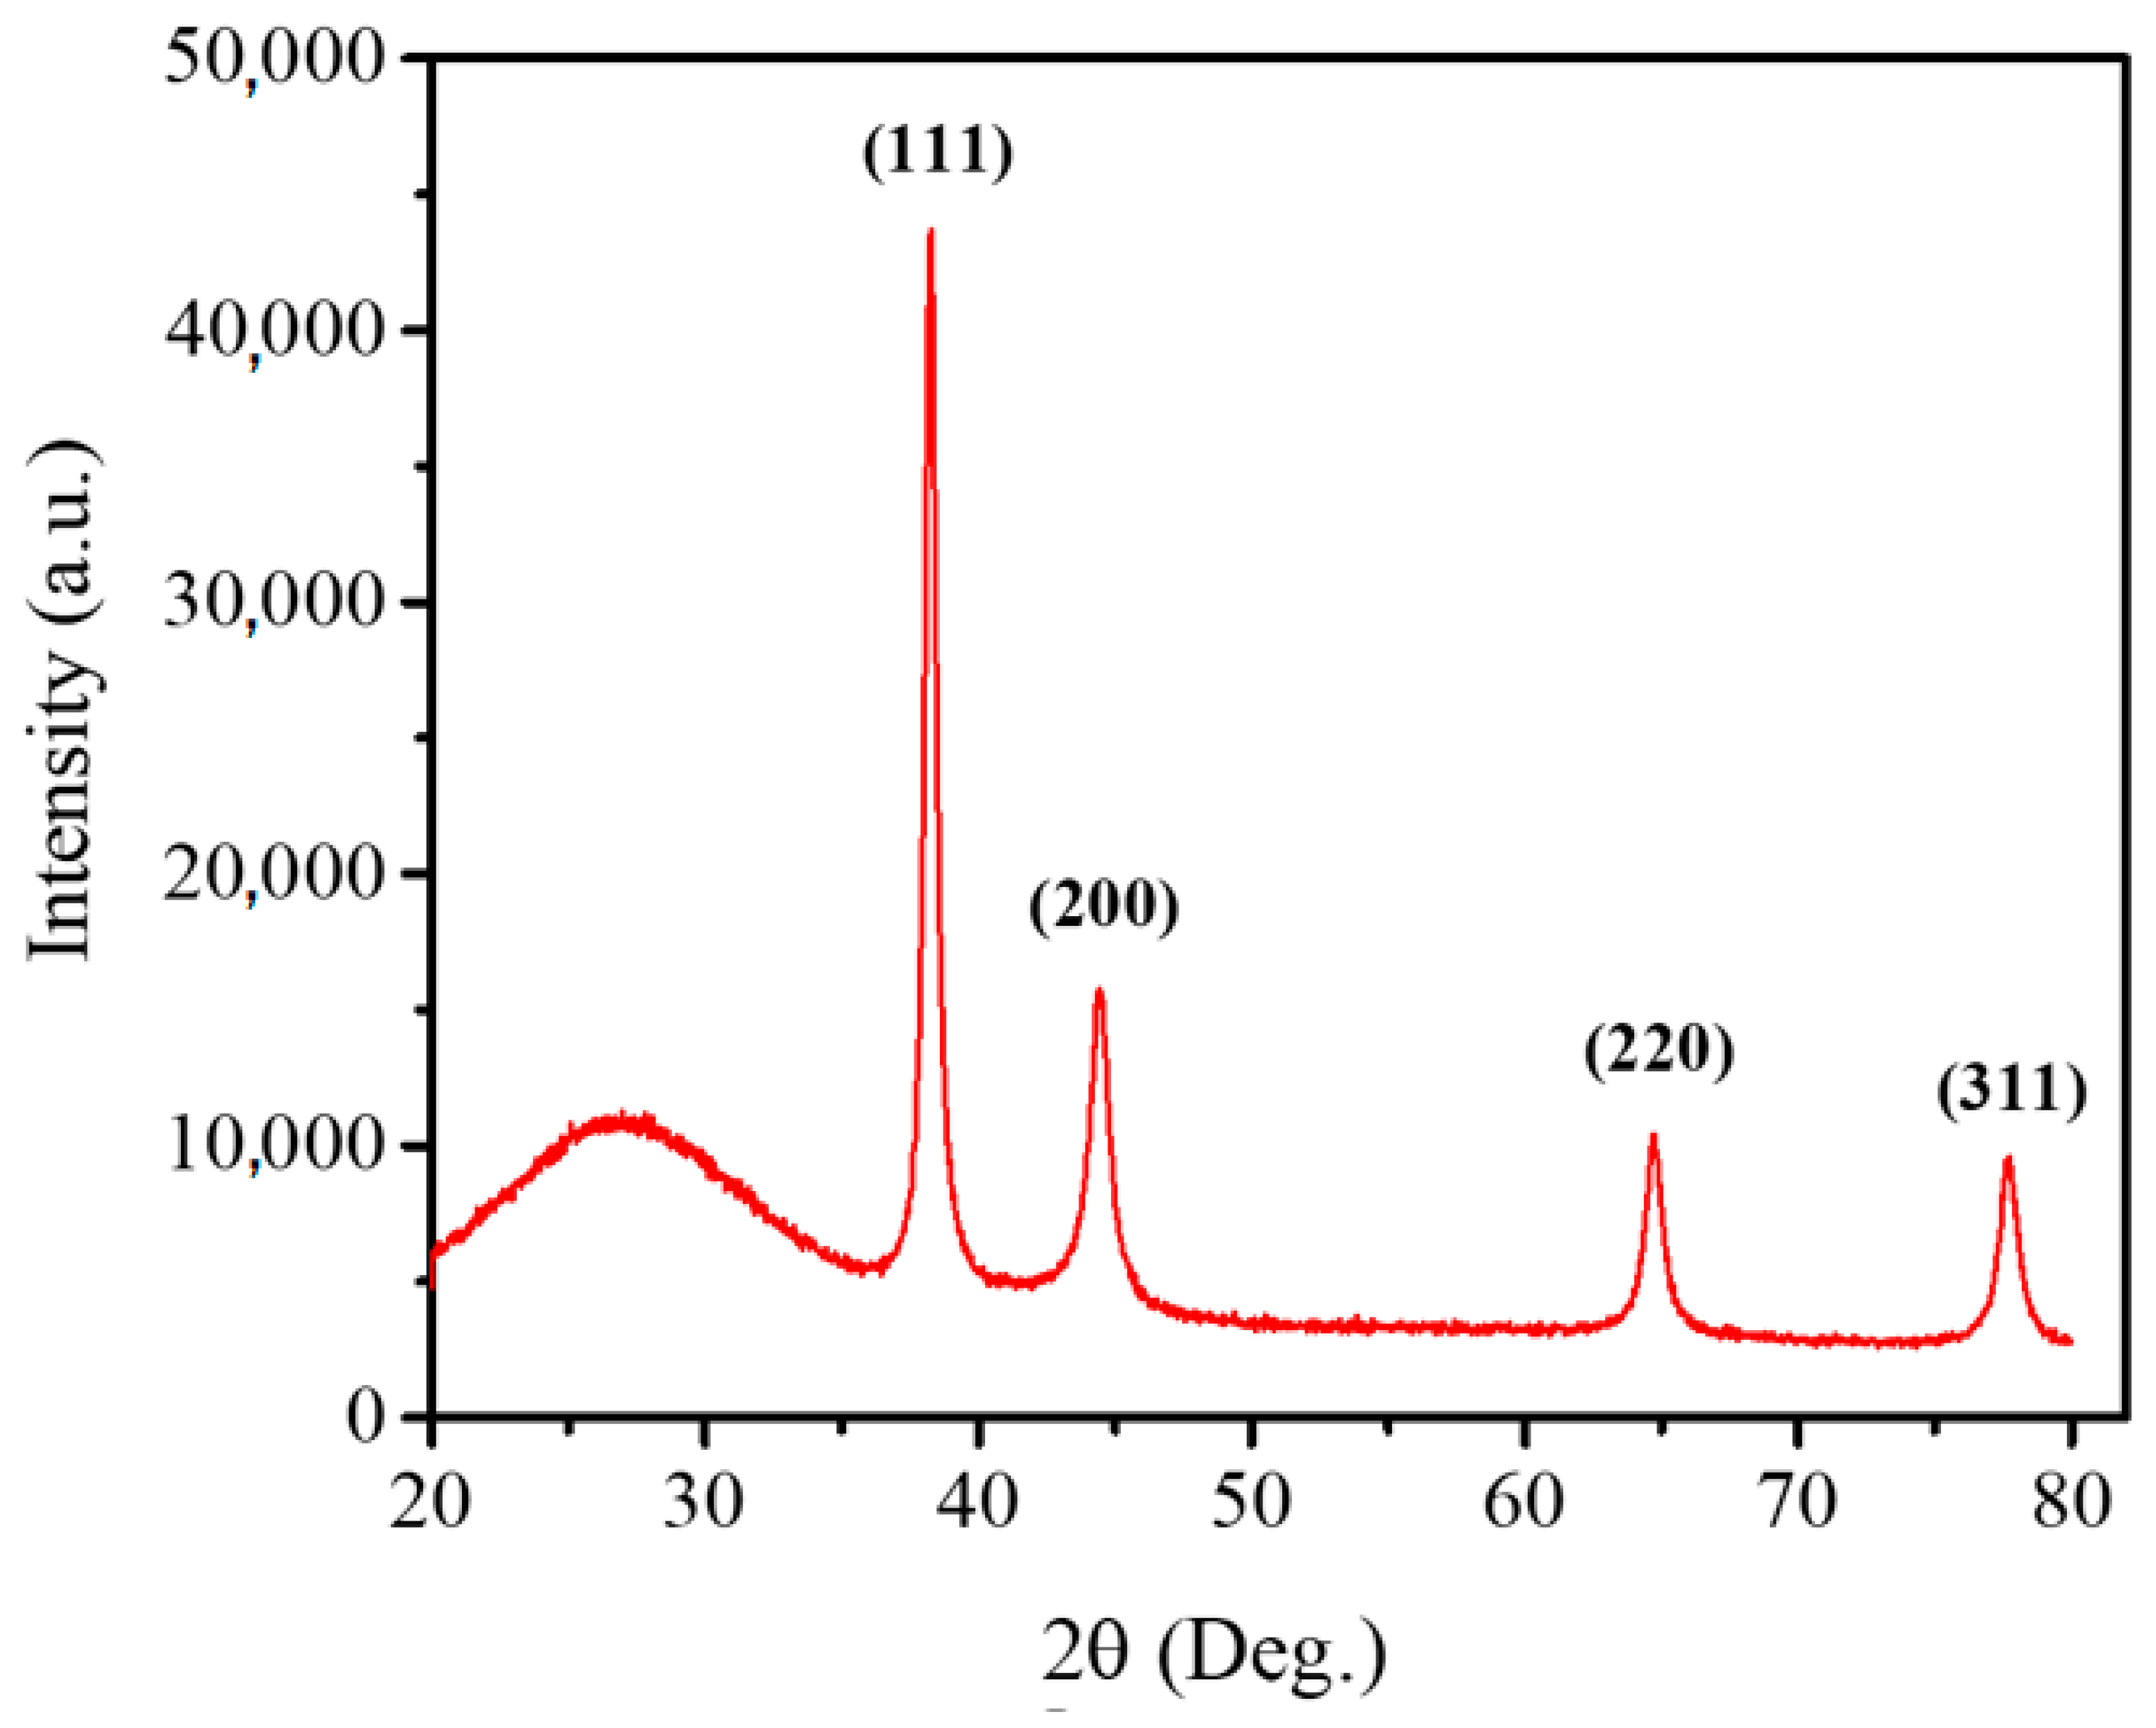
The crystalline structure of the fabricated nanoparticles was analyzed through X-ray diffraction at 2 θ degrees with a range of 20 to 80. The XRD pattern included a distinct sharp peak intensity for the zero valance Au nanocrystals at 38.1. The peak showed an orientation to a face-centered cubic lattice of {111} that can be matched with the standard joint committee for powder diffraction set (JCPDS) data 4-0784. The lattice peak corresponds to the Bragg reflections (Figure 10).
The XRD analysis confirmed the shape and morphology of the fabricated nanoparticles; the face-centered cubic lattice of {111} was confirmed at 38.1. Fabricated AuNPs were round in shape with a crystalline lattice, and they have a tendency to be applied in sensing, detection, drug delivery, pharmaceuticals, and other applications in the environment and materials.

3.8. Size Distribution Using Dynamic Light Scattering

To measure hydrodynamic size, interparticle distance, and even distribution of the AuNPs, the dynamic-light-scattering tool was utilized. The size distribution was measured through Zetasizer nano (ZS90) at a 90° angle at 25 °C with an equilibrium time of 10 s; every sample was measured for 20 runs. The colloidal gold solution represented even distribution with three replicates. A histogram was also prepared to indicate the uniformity of the fabricated AuNPs corresponding to the size (Figure 11).
The z-average for the colloidal nanoparticles was measured as 20.26 with 13.76 diameters and a 0.27 polydispersity index (w1qaPdI). Even distribution of the AuNPs at 13 nm size (Table 1). The zeta potential of the diluted AuNPs was −17.66 mV with 1.05 mS/cm conductivity.

4. Conclusions

This study reported the lab-scale synthesis of citrate-capped gold nanoparticles with the optimized Turkevich method. The synthesized AuNPs were further characterized in detail through UV-absorbance spectra, scanning electron microscopy, high-resolution transmission electron microscopy, energy-dispersive X-ray spectroscopy, X-ray diffraction, and dynamic light scattering to confirm the size, concentration, shape, monodispersity, crystallinity, distribution, and zeta potential. AuNPs exhibited strong surface-plasmon resonance with an absorption-peak intensity at 520 nm on the UV scan with a bright red color, a spherical shape 13 nm in size in a single elemental composition, with an average polydispersity index at 0.27, and −17.667 zeta potential. The characterization confirmed successful fabrication of colloidal citrate-capped AuNPs with stability at room temperature in ambient conditions for 8 months. Synthesized AuNPs can potentially be applied in contaminant detection, water treatment, antimicrobial applications, polymer doping in material, metallurgy, and environmental engineering.

Author Contributions

Conceptualization, A.G.M. and I.A.C.; methodology, A.G.M., I.A.C. and A.F.S.; writing, I.A.C., A.F.S., W.A.M., Z.T.B. and A.S.G.; validation, A.G.M., A.A.S., J.A. and Z.T.B.; investigation, A.S.G. and I.A.C.; supervision, A.G.M., A.A.S. and A.S.G.; funding acquisition, W.A.M. and S.A. All authors have read and agreed to the published version of the manuscript.

Funding

This research was funded by the Researchers Supporting Project (number RSP2022R516) at King Saud University, Riyadh, Saudi Arabia, and the APC was funded by RSP.

Institutional Review Board Statement

Not applicable.

Informed Consent Statement

Not applicable.

Data Availability Statement

Data available upon request from the corresponding authors.

Acknowledgments

Authors are thankful to the Researchers Supporting Project (number RSP2022R516) at King Saud University, Riyadh, Saudi Arabia. In addition to this, authors also acknowledge the services of Maheen Tufail Dehraj (Lecturer Department of Humanities, NED University of Engineering & Technology, Pakistan) for language editing.

Conflicts of Interest

The authors declare that they have no known competing financial interests or personal relationships that could have appeared to influence the work reported in this paper.

References

  1. Sharma, D.; Dhanjal, D.S. Bio-nanotechnology for active food packaging. J. Appl. Pharm. Sci. 2016, 6, 220–226. [Google Scholar] [CrossRef] [Green Version]
  2. Srikar, S.K.; Giri, D.D.; Pal, D.B.; Mishra, P.K.; Upadhyay, S.N. Green Synthesis of Silver Nanoparticles: A Review. Green Sustain. Chem. 2016, 6, 34–56. [Google Scholar] [CrossRef] [Green Version]
  3. Shende, S.; Ingle, A.P.; Gade, A.; Rai, M. Green synthesis of copper nanoparticles by Citrus medica Linn. (Idilimbu) juice and its antimicrobial activity. World J. Microbiol. Biotechnol. 2015, 31, 865–873. [Google Scholar] [CrossRef] [PubMed]
  4. Thirumurugan, A.; Aswitha, P.; Kiruthika, C.; Nagarajan, S.; Christy, A.N. Green synthesis of platinum nanoparticles using Azadirachta indica—An eco-friendly approach. Mater. Lett. 2016, 170, 175–178. [Google Scholar] [CrossRef]
  5. Channa, I.A.; Distler, A.; Scharfe, B.; Feroze, S.; Forberich, K.; Lipovšek, B.; Brabec, C.J.; Egelhaaf, H.-J. Solution prcessed oxygen and moisture barrier based on glass flakes for encapsulation of organic (opto) electronic devices. Flex. Print. Electron. 2021, 6, 025006. [Google Scholar] [CrossRef]
  6. Ahmed, F.; Zain-ul-abdein, M.; Channa, I.A.; Yaseen, M.K.; Gilani, S.J.; Makhdoom, M.A.; Mansoor, M.; Shahzad, U.; Jumah, M.N.B. Effect of Ultrasonic Surface Mechanical Attrition Treatment-Induced Nanograins on the Mechanical Properties and Biocompatibility of Pure Titanium. Materials 2022, 15, 5097. [Google Scholar] [CrossRef]
  7. Masood, F.; Makhdoom, M.A.; Channa, I.A.; Gilani, S.J.; Khan, A.; Hussain, R.; Batool, S.A.; Konain, K.; Rahman, S.U.; Wadood, A.; et al. Development and Characterization of Chitosan and Chondroitin Sulfate Based Hydrogels Enriched with Garlic Extract for Potential Wound Healing/Skin Regeneration Applications. Gels 2022, 8, 676. [Google Scholar] [CrossRef]
  8. Fabrega, J.; Luoma, S.N.; Tyler, C.R.; Galloway, T.S.; Lead, J.R. Silver nanoparticles: Behaviour and effects in the aquatic environment. Environ. Int. 2011, 37, 517–531. [Google Scholar] [CrossRef]
  9. Dawadi, S.; Katuwal, S.; Gupta, A.; Lamichhane, U.; Thapa, R.; Jaisi, S.; Lamichhane, G.; Bhattarai, D.P.; Parajuli, N. Current Research on Silver Nanoparticles: Synthesis, Characterization, and Applications. J. Nanomater. 2021, 2021, 6687290. [Google Scholar] [CrossRef]
  10. Ahmad, J.; Memon, A.G.; Shaikh, A.A.; Ismail, T.; Giwa, A.S.; Mahmood, A. Insight into single-element nobel metal anisotropic silver nanoparticle shape-dependent selective ROS generation and quantification. RSC Adv. 2021, 11, 8314–8322. [Google Scholar] [CrossRef]
  11. Chandio, A.D.; Channa, I.A.; Rizwan, M.; Akram, S.; Javed, M.S.; Siyal, S.H.; Saleem, M.; Makhdoom, M.A.; Ashfaq, T.; Khan, S.; et al. Polyvinyl alcohol and nano-clay based solution processed packaging coatings. Coatings 2021, 11, 942. [Google Scholar] [CrossRef]
  12. Adam, T.; Hashim, U.; Mohan, M.; Uda, M.N.A.; Uda, M.N.A. Integrated ZnO-Al2O3 nano particles as absorbent for heavy metal ions and organic impurities. AIP Conf. Proc. 2021, 2339, 020128. [Google Scholar] [CrossRef]
  13. Rehman, H.; Ali, Z.; Hussain, M.; Gilani, S.R.; Shahzady, T.G.; Zahra, A.; Hussain, S.; Hussain, H.; Hussain, I.; Farooq, M.U. Synthesis and characterization of zno nanoparticles and their use as an adsorbent for the arsenic removal from drinking water. Dig. J. Nanomater. Biostruct. 2019, 14, 1033–1040. Available online: https://www.scopus.com/inward/record.uri?eid=2-s2.0-85082714155&partnerID=40&md5=95e3f5e384791fe58093c55d8c0aa8e9 (accessed on 25 October 2022).
  14. Tang, Y.-C.; Huang, X.-H.; Wu, C.-N. Removal of arsenic(III) from drinking water by adsorption with titanium and ferrous oxide nanoparticles. Asian J. Chem. 2013, 25, 2491–2496. [Google Scholar] [CrossRef]
  15. Raveendran, P.; Fu, J.; Wallen, S.L. A simple and ‘green’ method for the synthesis of Au, Ag, and Au–Ag alloy nanoparticles. Green Chem. 2006, 8, 34–38. [Google Scholar] [CrossRef]
  16. Faraday, M. The Bakerian Lecture: Experimental Relations of Gold (and Other Metals) to Light. Philos. Trans. R. Soc. Lond. 1857, 147, 145–181. [Google Scholar] [CrossRef]
  17. Turkevich, J.; Stevenson, P.C.; Hillier, J. A study of the nucleation and growth processes in the synthesis of colloidal gold. Discuss. Faraday Soc. 1951, 11, 55–75. [Google Scholar] [CrossRef]
  18. Kim, F.; Connor, S.; Song, H.; Kuykendall, T.; Yang, P. Platonic gold nanocrystals. Angew. Chem.-Int. Ed. 2004, 43, 3673–3677. [Google Scholar] [CrossRef]
  19. Busbee, B.D.; Obare, S.O.; Murphy, C.J. An improved synthesis of high-aspect-ratio gold nanorods. Adv. Mater. 2003, 15, 414–416. [Google Scholar] [CrossRef]
  20. Aguirre, C.M.; Kaspar, T.R.; Radloff, C.; Halas, N.J. CTAB Mediated Reshaping of Metallodielectric Nanoparticles. Nano Lett. 2003, 3, 1707–1711. [Google Scholar] [CrossRef]
  21. Kumar, P.S.; Pastoriza-Santos, I.; Rodríguez-González, B.; de Abajo, F.J.G.; Liz-Marzán, L.M. High-yield synthesis and optical response of gold nanostars. Nanotechnology 2008, 19, 015606. [Google Scholar] [CrossRef] [PubMed]
  22. Millstone, J.E.; Park, S.; Shuford, K.L.; Qin, L.; Schatz, G.C.; Mirkin, C.A. Observation of a quadrupole plasmon mode for a colloidal solution of gold nanoprisms. J. Am. Chem. Soc. 2005, 127, 5312–5313. [Google Scholar] [CrossRef] [PubMed]
  23. Chang, S.-S.; Lee, C.-L.; Wang, C.R.C. Gold Nanorods: Electrochemical Synthesis and Optical Properties. J. Phys. Chem. B 1997, 101, 6661–6664. [Google Scholar] [CrossRef]
  24. Chang, S.-S.; Shih, C.-W.; Chen, C.-D.; Lai, W.-C.; Wang, C.R.C. The Shape Transition of Gold Nanorods. Langmuir 1999, 15, 701–709. [Google Scholar] [CrossRef]
  25. Mie, G. Beiträge zur Optik trüber Medien, speziell kolloidaler Metallösungen. Ann. Phys. 1908, 330, 377–445. [Google Scholar] [CrossRef]
  26. Liz-Marzán, L.M. Tailoring surface plasmons through the morphology and assembly of metal nanoparticles. Langmuir 2006, 22, 32–41. [Google Scholar] [CrossRef]
  27. Jung, H.L.; Wang, Z.; Liu, J.; Lu, Y. Highly sensitive and selective colorimetric sensors for uranyl (UO 22+): Development and comparison of labeled and label-free DNAzyme-gold nanoparticle systems. J. Am. Chem. Soc. 2008, 130, 14217–14226. [Google Scholar] [CrossRef] [Green Version]
  28. Wang, Z.; Lee, J.H.; Lu, Y. Label-Free Colorimetric Detection of Lead Ions with a Nanomolar Detection Limit and Tunable Dynamic Range by using Gold Nanoparticles and DNAzyme. Adv. Mater. 2008, 20, 3263–3267. [Google Scholar] [CrossRef]
  29. Wang, Q.; Yang, X.; Yang, X.; Liu, P.; Wang, K.; Huang, J.; Liu, J.; Song, C.; Wang, J. Colorimetric detection of mercury ion based on unmodified gold nanoparticles and target-triggered hybridization chain reaction amplification. Spectrochim. Acta A Mol. Biomol. Spectrosc. 2015, 136, 283–287. [Google Scholar] [CrossRef]
  30. Wang, R.; Zhou, X.; Shi, H.; Luo, Y. T-T mismatch-driven biosensor using triple functional DNA-protein conjugates for facile detection of Hg2+. Biosens. Bioelectron. 2016, 78, 418–422. [Google Scholar] [CrossRef]
  31. Li, H.; Rothberg, L.J. Label-Free Colorimetric Detection of Specific Sequences in Genomic DNA Amplified by the Polymerase Chain Reaction. J. Am. Chem. Soc. 2004, 126, 10958–10961. [Google Scholar] [CrossRef] [PubMed]
  32. Xia, F.; Zuo, X.; Yang, R.; Xiao, Y.; Kang, D.; Vallée-Bélisle, A.; Gong, X.; Yuen, J.D.; Hsu, B.B.Y.; Heeger, A.J.; et al. Colorimetric detection of DNA, small molecules, proteins, and ions using unmodified gold nanoparticles and conjugated polyelectrolytes. Proc. Natl. Acad. Sci. USA 2010, 107, 10837–10841. [Google Scholar] [CrossRef] [PubMed] [Green Version]
  33. Memon, A.G.; Zhou, X.; Liu, J.; Wang, R.; Liu, L.; Yu, B.; He, M.; Shi, H. Utilization of unmodified gold nanoparticles for label-free detection of mercury (II): Insight into rational design of mercury-specific oligonucleotides. J. Hazard. Mater. 2017, 321, 417–423. [Google Scholar] [CrossRef] [PubMed]
  34. Zhang, L.P.; Xing, Y.P.; Liu, L.H.; Zhou, X.H.; Shi, H.C. Fenton reaction-triggered colorimetric detection of phenols in water samples using unmodified gold nanoparticles. Sens. Actuators B Chem. 2016, 225, 593–599. [Google Scholar] [CrossRef]
  35. Kimling, J.; Maier, M.; Okenve, B.; Kotaidis, V.; Ballot, H.; Plech, A. Turkevich method for gold nanoparticle synthesis revisited. J. Phys. Chem. B 2006, 110, 15700–15707. [Google Scholar] [CrossRef]
  36. Memon, A.G.; Xing, Y.; Zhou, X.; Wang, R.; Liu, L.; Zeng, S.; He, M.; Ma, M.; Ma, M. Ultrasensitive colorimetric aptasensor for Hg2+ detection using Exo-III assisted target recycling amplification and unmodified AuNPs as indicators. J. Hazard. Mater. 2019, 384, 120948. [Google Scholar] [CrossRef]
  37. Memon, A.G.; Zhou, X.; Xing, Y.; Wang, R.; Liu, L.; Khan, M.; He, M. Label-free colorimetric nanosensor with improved sensitivity for Pb2+ in water by using a truncated 8–17 DNAzyme. Front. Environ. Sci. Eng. 2019, 13, 12. [Google Scholar] [CrossRef]
  38. Liu, J.; Lu, Y. Accelerated color change of gold nanoparticles assembled by DNAzymes for simple and fast colorimetric Pb2+ detection. J. Am. Chem. Soc. 2004, 126, 12298–12305. [Google Scholar] [CrossRef]
  39. Jin, R.; Wu, G.; Li, Z.; Mirkin, C.A.; Schatz, G.C. What controls the melting properties of DNA-linked gold nanoparticle assemblies? J. Am. Chem. Soc. 2003, 125, 1643–1654. [Google Scholar] [CrossRef]
  40. Channa, I.A.; Ashfaq, J.; Gilani, S.J.; Shah, A.A.; Chandio, A.D.; bin Jumah, M.N. UV Blocking and Oxygen Barrier Coatings Based on Polyvinyl Alcohol and Zinc Oxide Nanoparticles for Packaging Applications. Coatings 2022, 12, 897. [Google Scholar] [CrossRef]
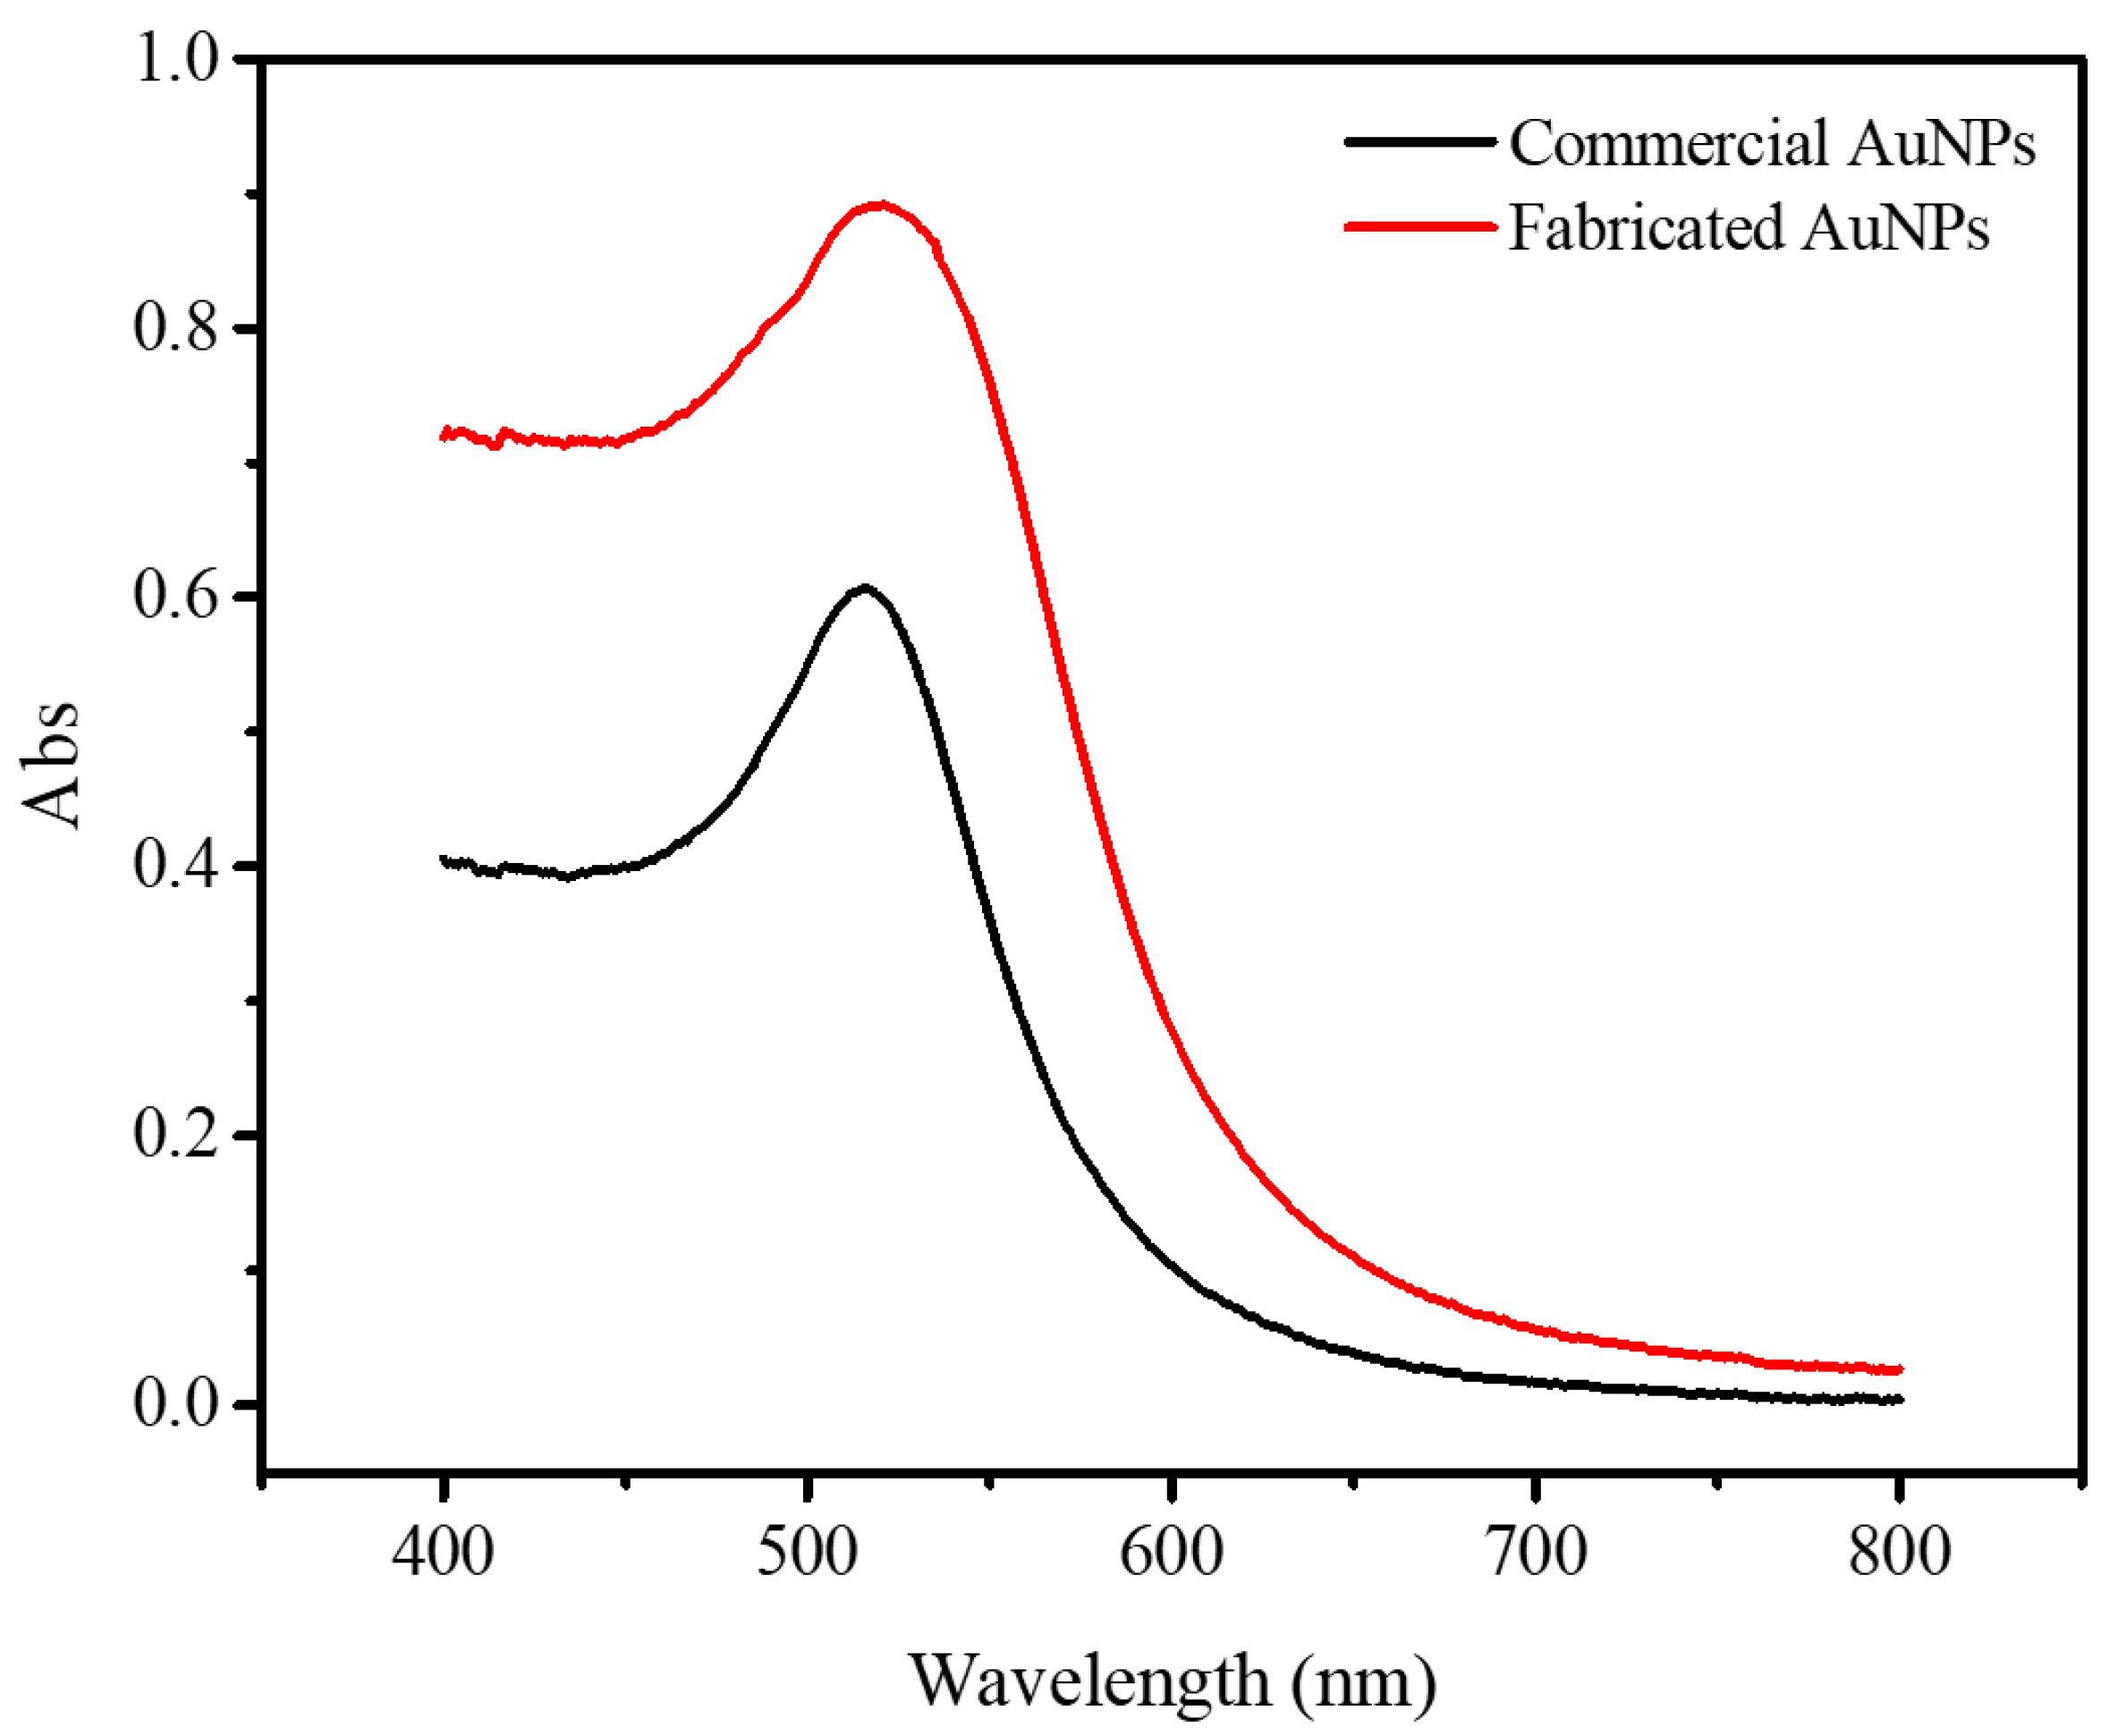
Figure 1. Comparative UV-absorbance spectra of commercial with fabricated AuNPs.
Crystals 12 01747 g001
Figure 2. Comparison of the dispersed and aggregated AuNPs describing UV-absorbance spectra. Salt contained 1 M of NaNO3 (inset: colorimetric change).
Crystals 12 01747 g002
Figure 3. SEM image of the AuNPs, describing morphology and size.
Crystals 12 01747 g003
Figure 4. SEM image of the aggregated stage of the AuNPs.
Crystals 12 01747 g004
Figure 5. HR-TEM image at 20 nm scale with 200K× magnification, showing the characteristics of the colloidal AuNPs.
Crystals 12 01747 g005
Figure 6. HR-TEM image of the aggregated stage of AuNPs.
Crystals 12 01747 g006
Figure 7. HR-TEM image of the aggregated stage of AuNPs.
Crystals 12 01747 g007
Figure 8. EDS mapping for point stage of the AuNP using SDD detector for TEM X-MaxN 80T (A) electron-spectrum-depicting energy-based elemental peak. (B) The spectrum for the point electron image at 50 nm scale. (C) EDS-layered image for electron mapping.
Crystals 12 01747 g008
Figure 9. Elemental composition through EDS spectrum in the section determining the presence of elements.
Crystals 12 01747 g009
Figure 10. XRD analysis for the crystal lattice structure of the AuNPs.
Crystals 12 01747 g010
Figure 11. Size-distribution histogram with triplicate measurement for AuNPs using DLS.
Crystals 12 01747 g011
Table 1. Measurements for the dynamic light scattering and zeta potential in triplicate for AuNPs.
AuNPsZ-Average (r. nm)D(i,10)PdIConductivity (mS/cm)Zeta Potential (mV)
2 120.3113.50.2730.953−17.4
2 220.29140.2711.09−19.4
2 320.1813.80.2661.13−16.2
Publisher’s Note: MDPI stays neutral with regard to jurisdictional claims in published maps and institutional affiliations.