
A Novel Understanding of the Thermal Reaction Behavior and Mechanism of Ni/Al Energetic Structural Materials


Abstract
1. Introduction
2. Experimental
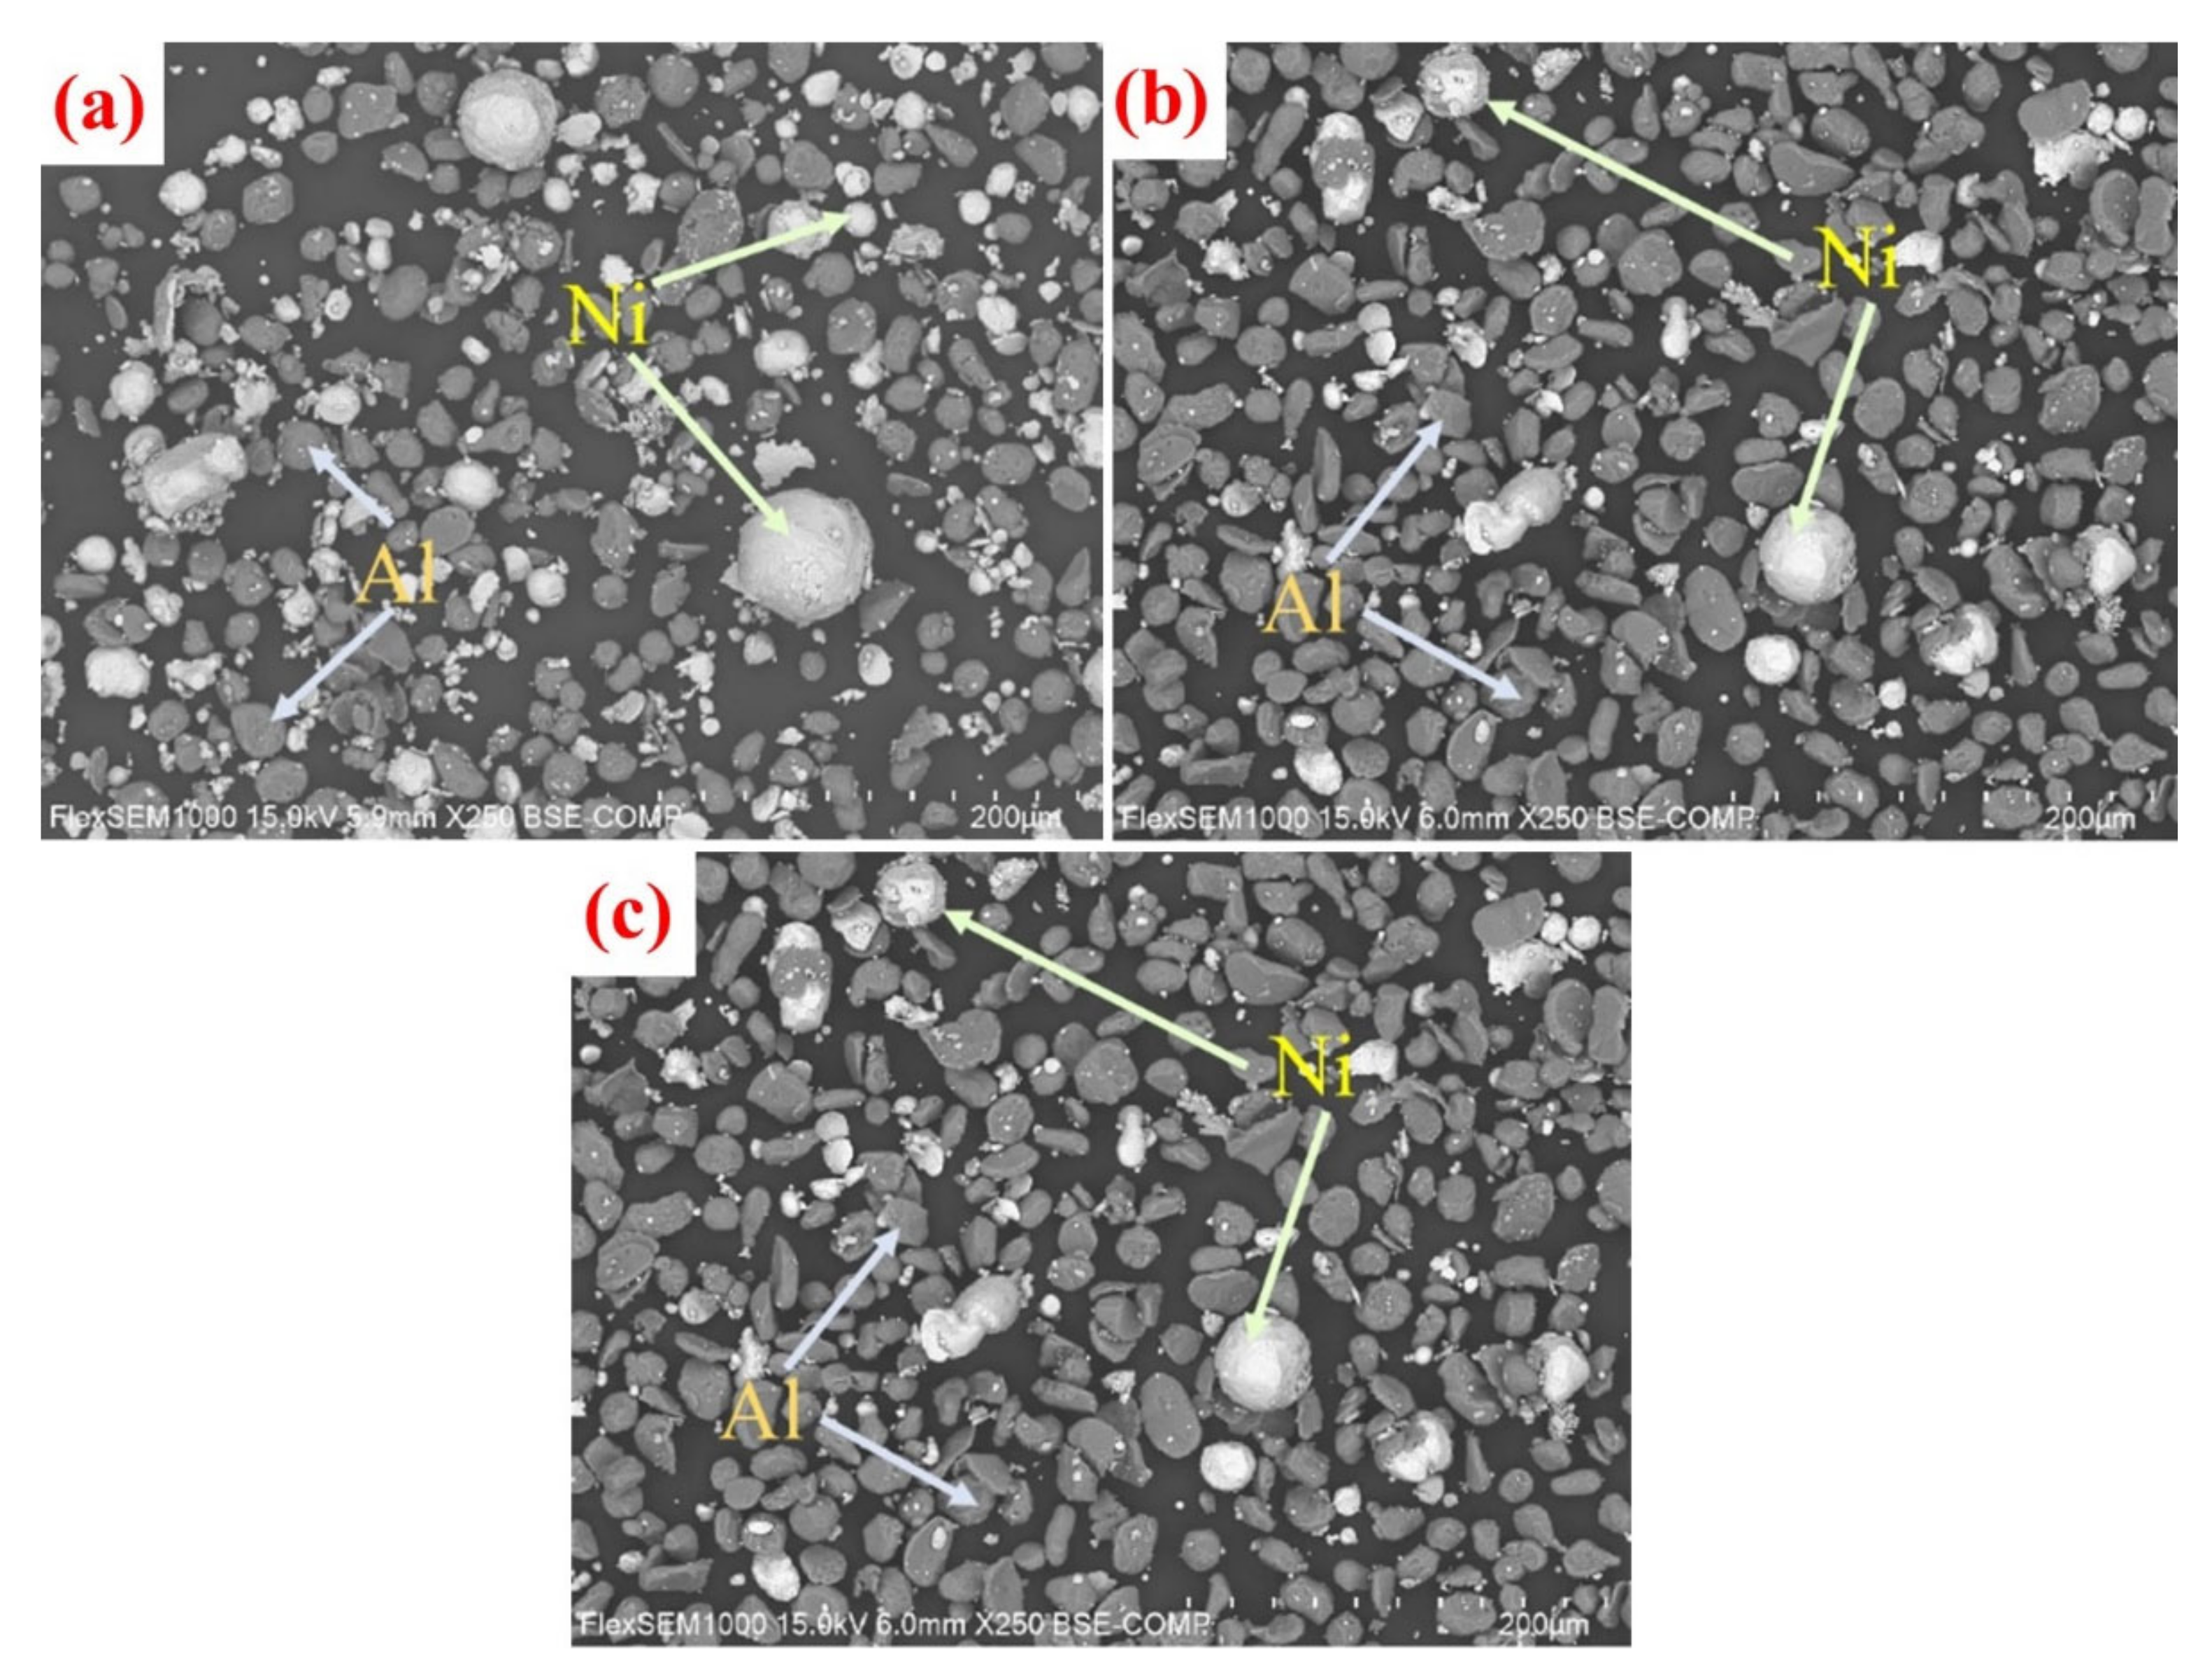
2.1. Materials
2.2. Thermal Analysis and Characterization
3. Results and Discussion
3.1. DSC Analysis
3.2. Reaction Products Analysis
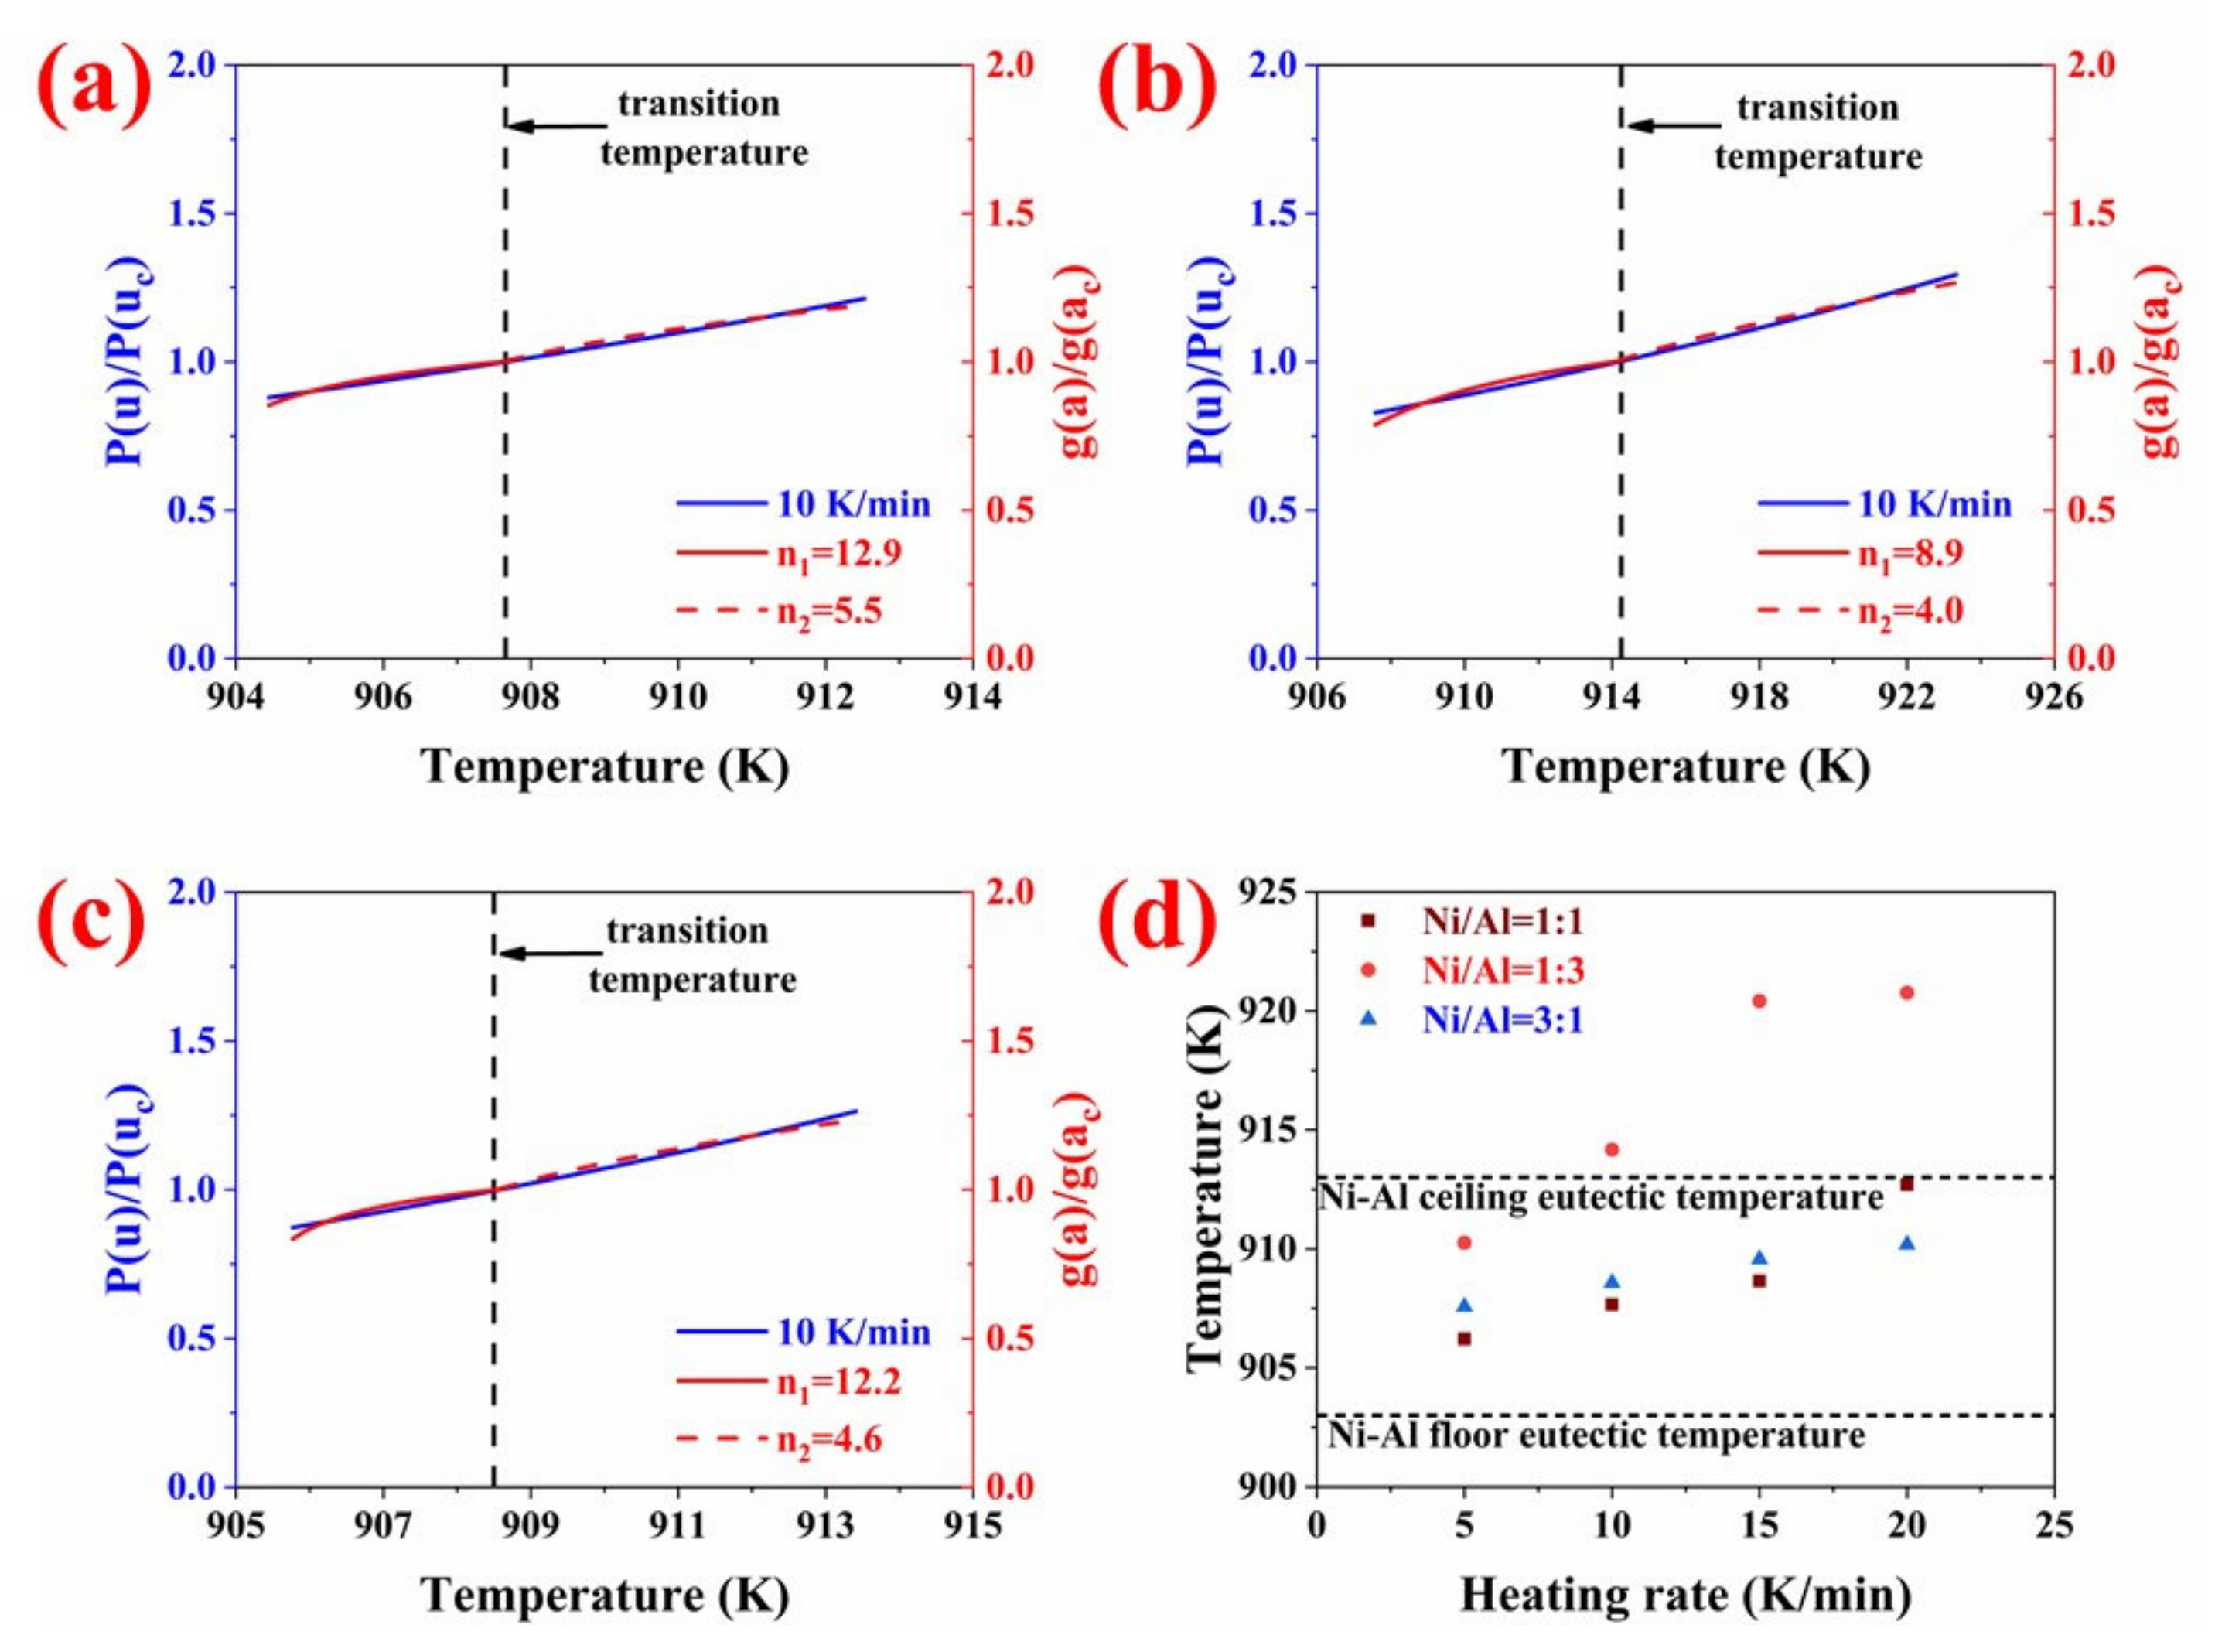
3.3. The Reaction Kinetics Analysis
4. Conclusions
Author Contributions
Funding
Data Availability Statement
Conflicts of Interest
References
- Millar, D.; Marshall, W.; Oswald, I.; Pulham, C. High-pressure structural studies of energetic materials. Crystallogr. Rev. 2010, 16, 115–132. [Google Scholar] [CrossRef]
- Hastings, D.; Dreizin, E. Reactive Structural Materials: Preparation and Characterization. Adv. Eng. Mater. 2018, 20, 1700631. [Google Scholar] [CrossRef]
- Seropyan, S.; Saikov, I.; Andreev, D.; Saikova, G.; Alymov, M. Reactive Ni–Al-Based Materials: Strength and Combustion Behavior. Metals 2021, 11, 949. [Google Scholar] [CrossRef]
- Wu, J.; Wang, H.; Fang, X.; Li, Y.; Mao, Y.; Yang, L.; Yin, Q.; Wu, S.; Yao, M.; Song, J. Investigation on the Thermal Behavior, Mechanical Properties and Reaction Characteristics of Al-PTFE Composites Enhanced by Ni Particle. Materials 2018, 11, 1741. [Google Scholar] [CrossRef]
- Grapes, M.; Weihs, T. Exploring the reaction mechanism in self-propagating Al/Ni multilayers by adding inert material. Combust. Flame 2016, 172, 105–115. [Google Scholar] [CrossRef]
- Vandersall, K.; Thadhani, N. Investigation of “shock-induced” and “shock-assisted” chemical reactions in Mo + 2Sipowder mixtures. Metall. Mater. Trans. A 2003, 34, 15–23. [Google Scholar] [CrossRef]
- Song, I.; Thadhani, N. Shock-induced chemical-reactions and synthesis of nickel aluminides. Metall. Mater. Trans. A 1002, 23, 41–48. [Google Scholar] [CrossRef]
- Bennett, L.; Horie, Y. Shock-induced inorganic reactions and condensed phase detonations. Shock Waves 1994, 4, 127–136. [Google Scholar] [CrossRef]
- Zhang, X.; Shi, A.; Zhang, J.; Qiao, L.; He, Y.; Guan, Z. Thermochemical modeling of temperature controlled shock-induced chemical reactions in multifunctional energetic structural materials under shock compression. J. Appl. Phys. 2012, 111, 123501. [Google Scholar] [CrossRef]
- Mason, B.; Groven, L.; Son, S. The role of microstructure refinement on the impact ignition and combustion behavior of mechanically activated Ni/Al reactive composites. J. Appl. Phys. 2013, 114, 113501. [Google Scholar] [CrossRef]
- Wang, H.; Zheng, Y.; Yu, Q.; Liu, Z.; Yu, W. Impact-induced initiation and energy release behavior of reactive materials. J. Appl. Phys. 2011, 110, 074904. [Google Scholar]
- Xiong, W.; Zhang, X.; Tan, M.; Liu, C.; Wu, X. The Energy Release Characteristics of Shock-Induced Chemical Reaction of Al/Ni Composites. J. Phys. Chem. C 2016, 120, 24551–24559. [Google Scholar] [CrossRef]
- White, J.; Reeves, R.; Son, S.; Mukasyan, A. Thermal Explosion in Al-Ni System: Influence of Mechanical Activation. J. Phys. Chem. A 2009, 113, 13541–13547. [Google Scholar] [CrossRef]
- Deng, P.; Chen, P.; Fang, H.; Liu, R.; Guo, X. The combustion behavior of boron particles by using molecular perovskite energetic materials as high-energy oxidants. Combust. Flame 2022, 241, 112118. [Google Scholar] [CrossRef]
- Izato, Y.; Koshi, M.; Miyake, A.; Habu, H. Kinetics analysis of thermal decomposition of ammonium dinitramide (ADN). J. Therm. Anal. Calorim. 2017, 127, 255–264. [Google Scholar] [CrossRef]
- Huang, C.; Mei, X.; Cheng, Y.; Li, Y.; Zhu, X. A model-free method for evaluating theoretical error of Kissinger equation. J. Therm. Anal. Calorim. 2014, 116, 1153–1157. [Google Scholar] [CrossRef]
- Koga, N. Ozawa’s kinetic method for analyzing thermoanalytical curves History and theoretical fundamentals. J. Therm. Anal. Calorim. 2013, 113, 1527–1541. [Google Scholar] [CrossRef]
- Mian, I.; Li, X.; Jian, Y.; Dacres, O.; Zhong, M.; Liu, J.; Ma, F.; Rahman, N. Kinetic study of biomass pellet pyrolysis by using distributed activation energy model and Coats Redfern methods and their comparison. Bioresour. Technol. 2019, 294, 122099. [Google Scholar] [CrossRef]
- Ren, N.; Wang, F.; Zhang, J.; Zheng, X. Progress in Thermal Analysis Kinetics. Acta Phys.-Chim. Sin. 2020, 36, 1905062. [Google Scholar]
- Meng, F.; Zhou, Y.; Liu, J.; Wu, J.; Wang, G.; Li, R.; Zhang, Y. Thermal decomposition behaviors and kinetics of carrageenan-poly vinyl alcohol bio-composite film. Carbohyd. Polym. 2018, 201, 96–104. [Google Scholar] [CrossRef]
- Hiramoto, M.; Okinaka, N.; Akiyama, T. Self-propagating high-temperature synthesis of nonstoichiometric wustite. J. Alloys Compd. 2012, 520, 59–64. [Google Scholar] [CrossRef]
- Szterner, P.; Legendre, B.; Sghaier, M. Thermodynamic properties of polymorphic forms of theophylline. Part I: DSC, TG, X-ray study. J. Therm. Anal. Calorim. 2010, 99, 325–335. [Google Scholar] [CrossRef]
- Vyazovkin, S.; Burnham, A.; Criado, J.; Perez-Maqueda, L.; Popescu, C.; Sbirrazzuoli, N. ICTAC Kinetics Committee recommendations for performing kinetic computations on thermal analysis data. Thermochim. Acta 2011, 520, 1–19. [Google Scholar] [CrossRef]
- Cai, J.; Liu, R.; Shen, F. Improved version of Doyle integral method for nonisothermal kinetics of solid-state reactions. J. Math. Chem. 2008, 43, 1127–1133. [Google Scholar] [CrossRef]
- Perez-Maqueda, L.; Criado, J.; Gotor, F.; Malek, J. Advantages of combined kinetic analysis of experimental data obtained under any heating profile. J. Phys. Chem. A 2022, 106, 2862–2868. [Google Scholar] [CrossRef]
- Gotor, F.J.; Criado, J.M.; Malek, J.; Koga, N. Kinetic analysis of solid-state reactions: The universality of master plots for analyzing isothermal and nonisothermal experiments. J. Phys. Chem. A 2000, 104, 10777–10782. [Google Scholar] [CrossRef]
- Mamleev, V.; Bourbigot, S.; Le Bras, M.; Duquesne, S.; Sestak, J. Modelling of nonisothermal kinetics in thermogravimetry. Phys. Chem. Chem. Phys. 2000, 2, 4708–4716. [Google Scholar] [CrossRef]
- Philpot, K.; Munir, Z.; Holt, J. An investigation of the synthesis of nickel aluminides through gasless combustion. J. Mater. Sci. 1987, 22, 159–169. [Google Scholar] [CrossRef]
- Bouche, K.; Barbier, F.; Coulet, A. Intermetallic compound layer growth between solid iron and molten aluminium. Mat. Sci. Eng. A-Struct. 1998, 249, 167–175. [Google Scholar] [CrossRef]
- Morsi, K.; Moussa, S.; Wall, J. Reactive extrusion and high-temperature oxidation of Ni3Al. J. Mater. Sci. 2006, 41, 1265–1268. [Google Scholar] [CrossRef]
- Chen, L.; Song, W.; Lv, J.; Wang, L.; Xie, C. Effect of heating rates on TG-DTA results of aluminum nanopowders prepared by laser heating evaporation. J. Therm. Anal. Calorim. 2009, 96, 141–145. [Google Scholar] [CrossRef]
- Yu, L.; Meyers, M. Shock synthesis and synthesis-assisted shock consolidation of suicides. J. Mater. Sci. 1991, 26, 601–611. [Google Scholar] [CrossRef]


| Heating Rate (K/min). | 5 | 10 | 15 | 20 | |
|---|---|---|---|---|---|
| Ni/Al = 1:1 | s (K) | 904.05 | 903.45 | 902.85 | 902.75 |
| (K) | 912.04 | 923.11 | 934.37 | 948.17 | |
| (J/g) | 840.70 | 840.30 | 839.40 | 840.90 | |
| Ni/Al = 1:3 | (K) | 905.35 | 905.45 | 906.25 | 906.75 |
| (K) | 925.42 | 943.02 | 965.92 | 977.31 | |
| (J/g) | 764.00 | 762.40 | 765.40 | 764.00 | |
| (K) | 1127.05 | 1127.05 | 1126.15 | 1126.35 | |
| (K) | 1152.95 | 1158.05 | 1165.85 | 1170.05 | |
| Ni/Al = 3:1 | (K) | 905.75 | 905.15 | 904.75 | 903.85 |
| (K) | 913.11 | 923.73 | 932.55 | 942.83 | |
| (J/g) | 463.70 | 464.00 | 464.00 | 464.10 | |
| Sample | Stage | Heating Rate (K/min) | ||||
|---|---|---|---|---|---|---|
| 5 | 10 | 15 | 20 | |||
| Ni/Al = 1:1 | 27.6 | 12.9 | 10.3 | 5.5 | ||
| 1014 min−1) | 1.3639 | 1.3590 | 1.3567 | 1.3504 | ||
| 12.2 | 5.5 | 4.8 | 2.2 | |||
| 1014 min−1) | 1.3585 | 1.3467 | 1.3436 | 1.3389 | ||
| Ni/Al = 1:3 | 14.5 | 8.9 | 4.9 | 2.9 | ||
| 109 min−1) | 3.4174 | 3.4045 | 3.3773 | 3.1903 | ||
| n2 | 6.5 | 4.0 | 2.1 | 1.9 | ||
| 109 min−1) | 3.3921 | 3.3638 | 3.2979 | 2.8624 | ||
| Ni/Al = 3:1 | 23.5 | 12.2 | 8.2 | 6.3 | ||
| 1017 min−1) | 3.9351 | 3.9216 | 3.9079 | 3.8954 | ||
| 10.1 | 4.6 | 3.1 | 2.4 | |||
| 1017 min−1) | 3.9157 | 3.8754 | 3.8400 | 3.8085 | ||
Publisher’s Note: MDPI stays neutral with regard to jurisdictional claims in published maps and institutional affiliations. |
© 2022 by the authors. Licensee MDPI, Basel, Switzerland. This article is an open access article distributed under the terms and conditions of the Creative Commons Attribution (CC BY) license (https://creativecommons.org/licenses/by/4.0/).
Share and Cite
Wang, K.; Deng, P.; Liu, R.; Ge, C.; Wang, H.; Chen, P. A Novel Understanding of the Thermal Reaction Behavior and Mechanism of Ni/Al Energetic Structural Materials. Crystals 2022, 12, 1632. https://doi.org/10.3390/cryst12111632
Wang K, Deng P, Liu R, Ge C, Wang H, Chen P. A Novel Understanding of the Thermal Reaction Behavior and Mechanism of Ni/Al Energetic Structural Materials. Crystals. 2022; 12(11):1632. https://doi.org/10.3390/cryst12111632
Chicago/Turabian StyleWang, Kunyu, Peng Deng, Rui Liu, Chao Ge, Haifu Wang, and Pengwan Chen. 2022. "A Novel Understanding of the Thermal Reaction Behavior and Mechanism of Ni/Al Energetic Structural Materials" Crystals 12, no. 11: 1632. https://doi.org/10.3390/cryst12111632
APA StyleWang, K., Deng, P., Liu, R., Ge, C., Wang, H., & Chen, P. (2022). A Novel Understanding of the Thermal Reaction Behavior and Mechanism of Ni/Al Energetic Structural Materials. Crystals, 12(11), 1632. https://doi.org/10.3390/cryst12111632