Article

Determination of Secondary Cooling Zone Heat Transfer Coefficient with Different Alloy Types and Roughness in DC Casting by Inverse Heat Conduction Method

1
College of Chemistry and Materials Science, Longyan University, Longyan 364012, China
2
Key Laboratory of Electromagnetic Processing of Materials, Ministry of Education, Northeastern University, Shenyang 110819, China
3
Key Laboratory of Light-Weight Materials, Nanjing Tech University, Nanjing 210009, China
4
Queensland Centre for Advanced Materials Processing and Manufacturing (AMPAM), School of Mechanical and Mining Engineering, The University of Queensland, Brisbane, QLD 4072, Australia
5
Aero Engine Corporation of China Gas Turbine Co., Ltd., Shenyang 110179, China
*
Authors to whom correspondence should be addressed.
Crystals 2022, 12(11), 1571; https://doi.org/10.3390/cryst12111571
Submission received: 16 October 2022 / Revised: 1 November 2022 / Accepted: 2 November 2022 / Published: 4 November 2022
(This article belongs to the Special Issue State-of-the-Art Magnesium Alloys)

Abstract

:
The cooling characteristic curves in a heated ingot with a diameter of 100 mm quenched by a water jet were measured under different conditions. A two-dimensional calculation model was established to calculate the HTC of magnesium alloy ingot with water spray cooling. Data from cast-in thermocouples trail were input into the model and the HTCs were back-calculated for the water quench region. The HTCs were calculated under different alloy types and roughness conditions, and the relationship between the ingot surface temperature, roughness, and the HTC was established accordingly. The results show that the greater the thermal conductivity of the alloy, the greater the heat transfer coefficient (HTC). The HTCs of AZ80, AZ31, and ZK60 alloys increase successively. With the decrease in the surface temperature, the HTC in both the impingement zone and the free−falling zone shows a trend of a rapid increase at first, then slowly increasing to the maximum value, and finally, a rapid decrease, with the peak value appearing at about 400 K. Considering the influence of the ingot surface temperature and the surface roughness on the HTC, the mathematical relationships between them are established.

1. Introduction

Magnesium and its alloys, as the lightest metal-based constructional alloys, have very impressive properties, such as a good machinability, a high specific toughness and rigidity, weldability, and cast ability. Due to these impressive properties, its fondness is increasing in various industries [1,2,3,4]. Direct-chill (DC) casting is the main technology for producing billets and ingots of light alloys for either remelting or forming (forging, rolling, and extrusion) [5,6,7]. The DC casting process involves the continuous input of heat to the mold in the form of liquid metal through the mold cavity, the extraction of heat via the mold wall, and direct water cooling, wherein the cooling via the mold wall was often termed “primary cooling”, and that the water impacting on the emerging solid product was often referred to as “secondary cooling” [8]. Thus, the process is essentially one of establishing a balance between the heat input to the casting mold and the heat extracted from the molten metal and ingot to produce a solid cast product of the desired shape and quality.
Water cooling conditions have a profound effect on the DC casting process, and it is essential to understand water cooling to achieve a good control of DC casting. Numerical simulation is a low-cost and efficient method to deeply study and understand the matching degree between the cooling conditions and the casting process, and it is also an effective means to optimize the casting process. Features of interest in DC casting, such as the occurrence of cracks, the ingot shape and dimensions, microstructural refinement, macrosegregation, and the surface condition, all depend on the temperature distribution during the casting [9]. The accurate interfacial heat transfer coefficient (HTC) is an important basis for the simulation results to reflect the solidification physical field. The physical characteristics of the water spray (the impact velocity, flow rate per perimeter, and angle of the jet) all have a bearing on the cooling, but the most important parameter is the ingot surface temperature at the impact point, which determines the boiling mode and the corresponding HTC [8]. Weckman et al. established a numerical simulation model for the DC casting of the 6063 aluminum alloy and obtained the functional relationship between the effective HTC and the position of the outer surface of the ingot [10]. Moreover, the dependence of HTC on the ingot surface temperature is usually described by a boiling curve. Zhang et al. established a mathematical model that can describe the interaction of multiple physical fields in the process of the conventional and low-frequency electromagnetic semi-continuous casting of the 7××× aluminum alloy, in which the HTC in the secondary cooling zone is described as a function of the temperature [11]. Hao et al. referred to the relationships in the literature to describe the HTC during the secondary cooling for the aluminum alloy’s DC casting and improved it based on experiments to obtain the variation of HTC of the secondary cooling in the impingement zone and free−falling zone, with the surface temperature of the billet for the AZ31 alloy’s DC casting [12]. Le and Chen et al. accurately solved the HTC and heat flux density in the secondary cooling zone of the AZ80 alloy based on the inverse heat conduction method, and analyzed the effect of the initial temperature on the heat flux density [13].
As for the influence of the surface topography on the HTC, many researchers believe that the HTC increases with the increase in the surface roughness [14,15]. Lee found that the critical heat flux measured on the metal surface of 0.41, 40, 60, and 80 µm was about 10% higher than that on the smooth surface of 0.41 µm [16]. In addition, increasing the roughness can improve the wettability and indirectly improve the HTC. The principle is that surface roughness makes the actual area larger, that is, it increases the wetting and cooling area of cooling water [17,18]. When Pais used 0.3, 14, and 22 µm abrasive polished surfaces for the spray cooling, it was found that the surface heat flux after 0.3 µm abrasive processing was the largest; he attributed this phenomenon to the fact that nucleation density plays a major role in the heat transfer, and the reduction in the roughness may increase the density of the nucleation locations and thus enhance heat transfer [19].
In summary, for the DC casting of an aluminum alloy, there are abundant research conclusions to accurately describe the corresponding relationship between the ingot surface temperature and the HTC. However, for a magnesium alloy, there are few relevant studies; most of the studies on the HTC are based on the early theory and model or are defined as a constant, which does not apply to different casting alloys and a wide range of casting conditions. This study aims to investigate the temperature drop behavior of different magnesium alloys’ ingots when it reaches the impingement and free−falling cooling zones and the relationship between the surface temperature, the alloy type, the roughness of the ingot, and the HTC during DC casting, to provide basic data for the optimization of different alloys’ ingot DC casting process parameters. The information will provide a better understanding of the process as it currently exists and helps to provide guidelines for a further process improvement for the DC casting of magnesium alloy ingots.

2. Experimental Method and Numerical Model Description

2.1. Experimental Method

The as-cast magnesium alloy ingot used in this work is the round ingot, which was produced by the DC casting, and the alloy types are AZ80, AZ31, and ZK60, respectively. The self-made experimental device consists of a heated magnesium ingot with a water-spraying and water-cooling device; the water jet arrangement is the same as in the DC casting, as shown in Figure 1. The water outlet is about 15 mm away from the ingot surface, and the cooling water spray angle is at about 35°. In this way, the cooling behavior in the DC casting is duplicated as closely as possible. The ingot has thermocouples (GG-K-36 type) throughout, as shown in Figure 1. The thermocouple is fixed at the edge of the ingot in the height direction. The aperture of the fixed thermocouple is 2.5 mm, and the center of the hole is 5 mm from the surface of the ingot. The thermocouple was embedded at various depths and the temperatures were recorded at 55, 60, 65, 70, 75, 85, 95, 105, 115, and 125 mm from the upper surface of the ingot, covering both the impingement zone and the free−falling zone. The thermocouples were labeled as TC1 ~ TC10, in which TC1~TC5 are in the impingement zone and TC6~TC10 are in the free−falling zone. During the experiment, the ingot was heated in a resistance heating furnace and then taken out for water spray cooling according to different water spray conditions, and a multi-channel data acquisition system was used to record the temperature changes at each test point.

2.2. Inverse Heat Transfer Model

The solution process of the inverse heat conduction method is to calculate the unknown boundary conditions through the known temperature field inside the casting, so it is necessary to calculate the positive heat transfer temperature field iteratively [20]. To alleviate the computing burden, according to the heat transfer characteristic of round ingot in DC casting, only consider the heat transfer of the same horizontal plane: take a small area and simplify it into a two-dimensional calculation model. The plane temperature T (x1, x2, τ) can be calculated from the finite element solution to the heat conduction equation without an internal heat source (Equation (1)):
ρ c T τ = x 1 ( λ T x 1 ) + x 2 ( λ T x 2 )
where T is the temperature (K); ρ , c , and λ are the density (kg·m−3), specific heat capacity (J·g−1K−1), and thermal conductivity (W·m−1K−1), respectively; and τ is the time (s). According to Newton’s law of cooling, (Equation (2)):
q = h × ( T T W )
where h is HTC (W·m−2K−1); q is heat flux (W·m−2); and TW is the temperature of the cooling water (K). The heat flux density on the surface of the ingot can be uniquely determined under the condition of a known ingot temperature field. Conversely, the interfacial HTC can be obtained accordingly.
The process of solving the interfacial HTC using the reverse heat conduction algorithm is shown in Figure 2. First, the geometric model of the reverse heat transfer was established according to the experimental model, and the material properties and initial boundary conditions were input. Then, the ingot and cooling water temperature measured by the experiment were taken as the known temperature field conditions, the initial interface HTC was guessed, and the calculation convergence criterion was set. Based on this, the temperature field was calculated and compared with the measured temperature. Through a continuous iterative calculation and correction, a result that is in a good agreement with the actual temperature was finally obtained, and the corresponding HTC can be obtained.

3. Error Analysis of Inverse Results

Figure 3 shows the comparison between the simulated temperature and the measured temperature of xAZ80 alloy under the conditions of the water flow rate of 4 m3/h, a cooling water temperature of 298 K, an initial temperature of 673 K, and a surface roughness of 55.31 μm. TC2 in the impingement zone and TC8 in the free−falling zone are selected for the comparison. The measured temperature and simulated temperature in both the impingement zone and the free−falling zone show a good consistency, and the error is less than 0.5%.
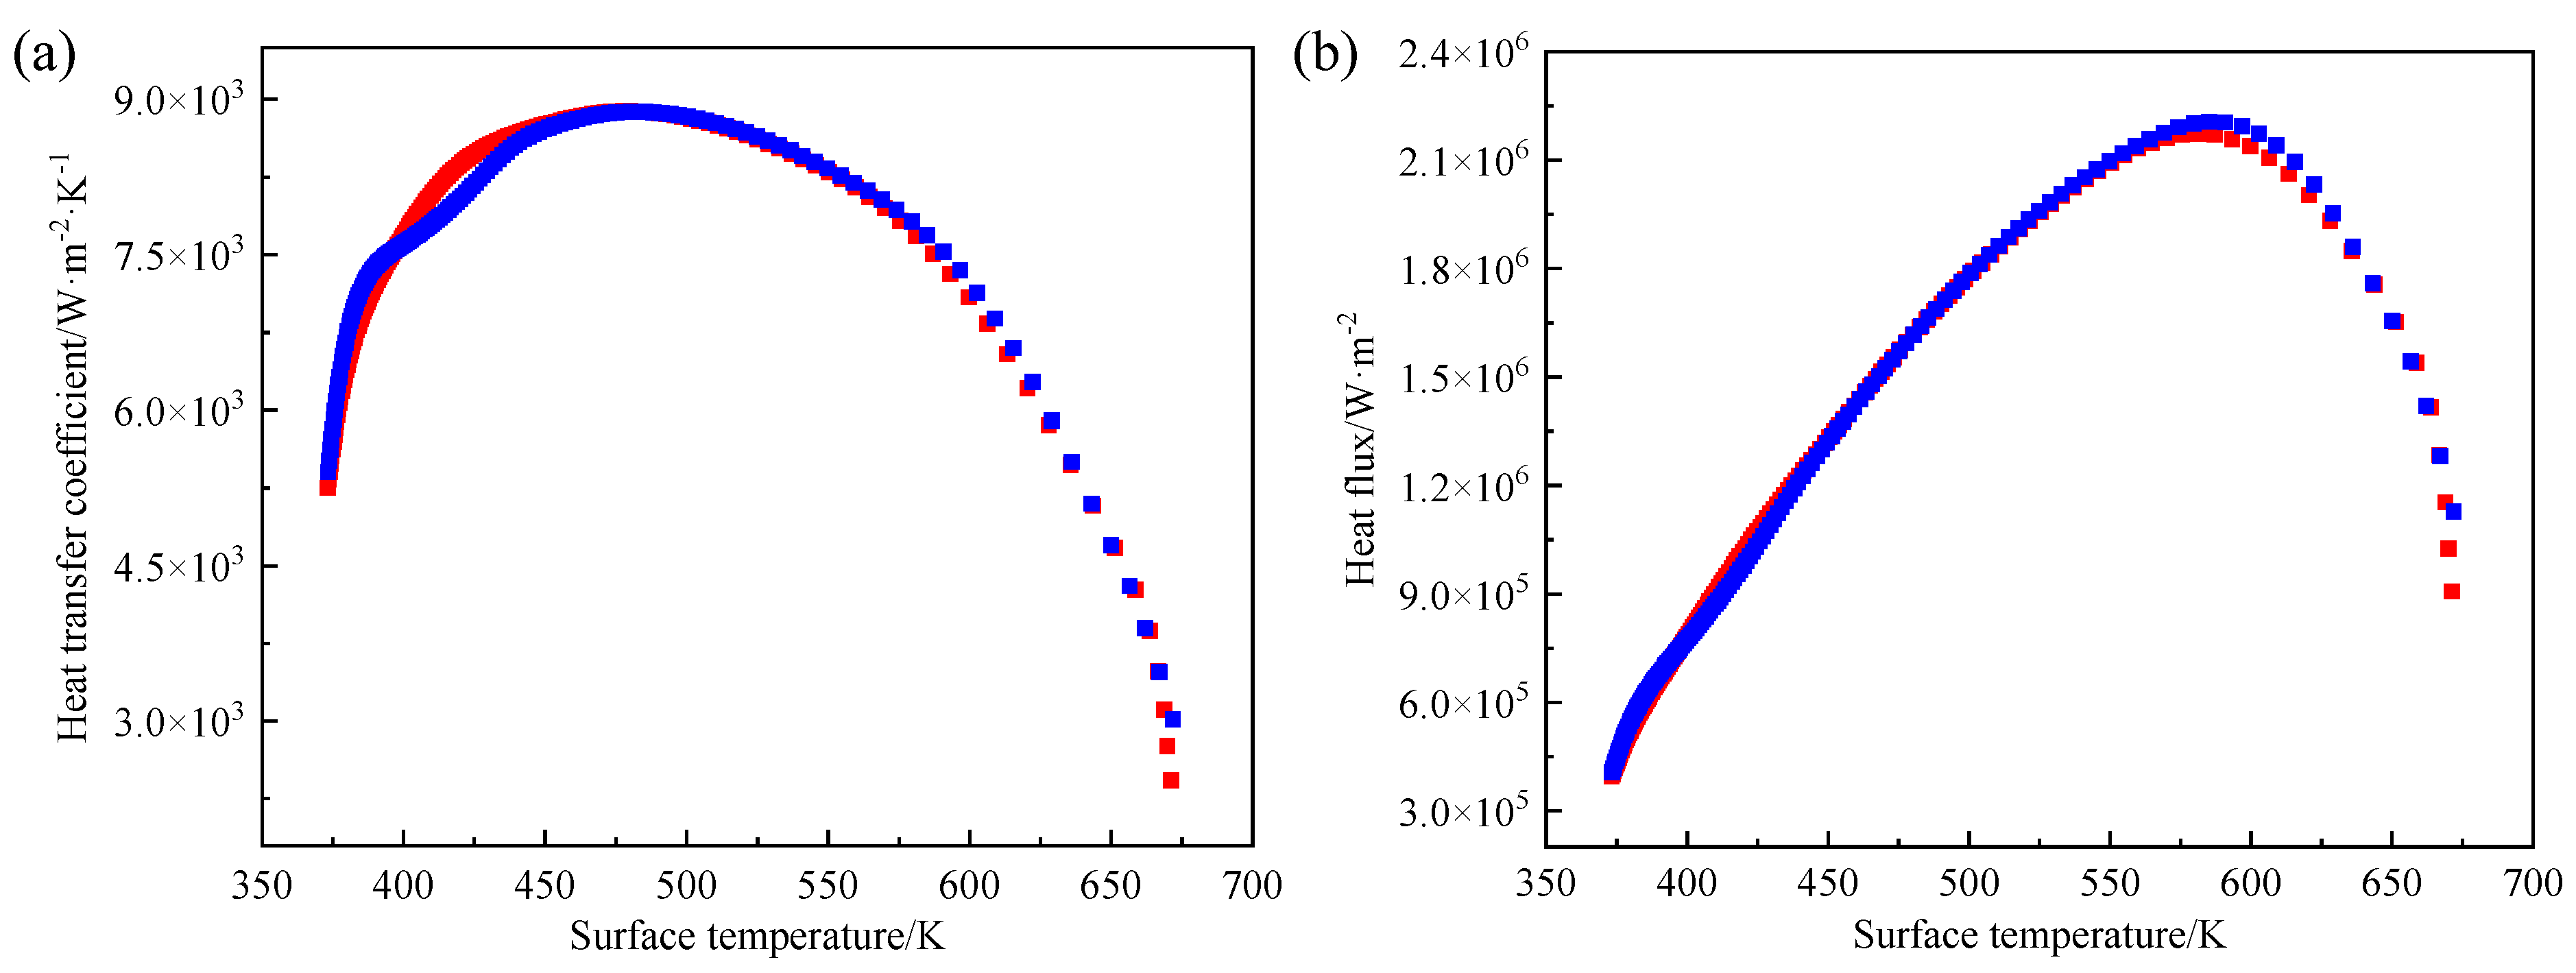
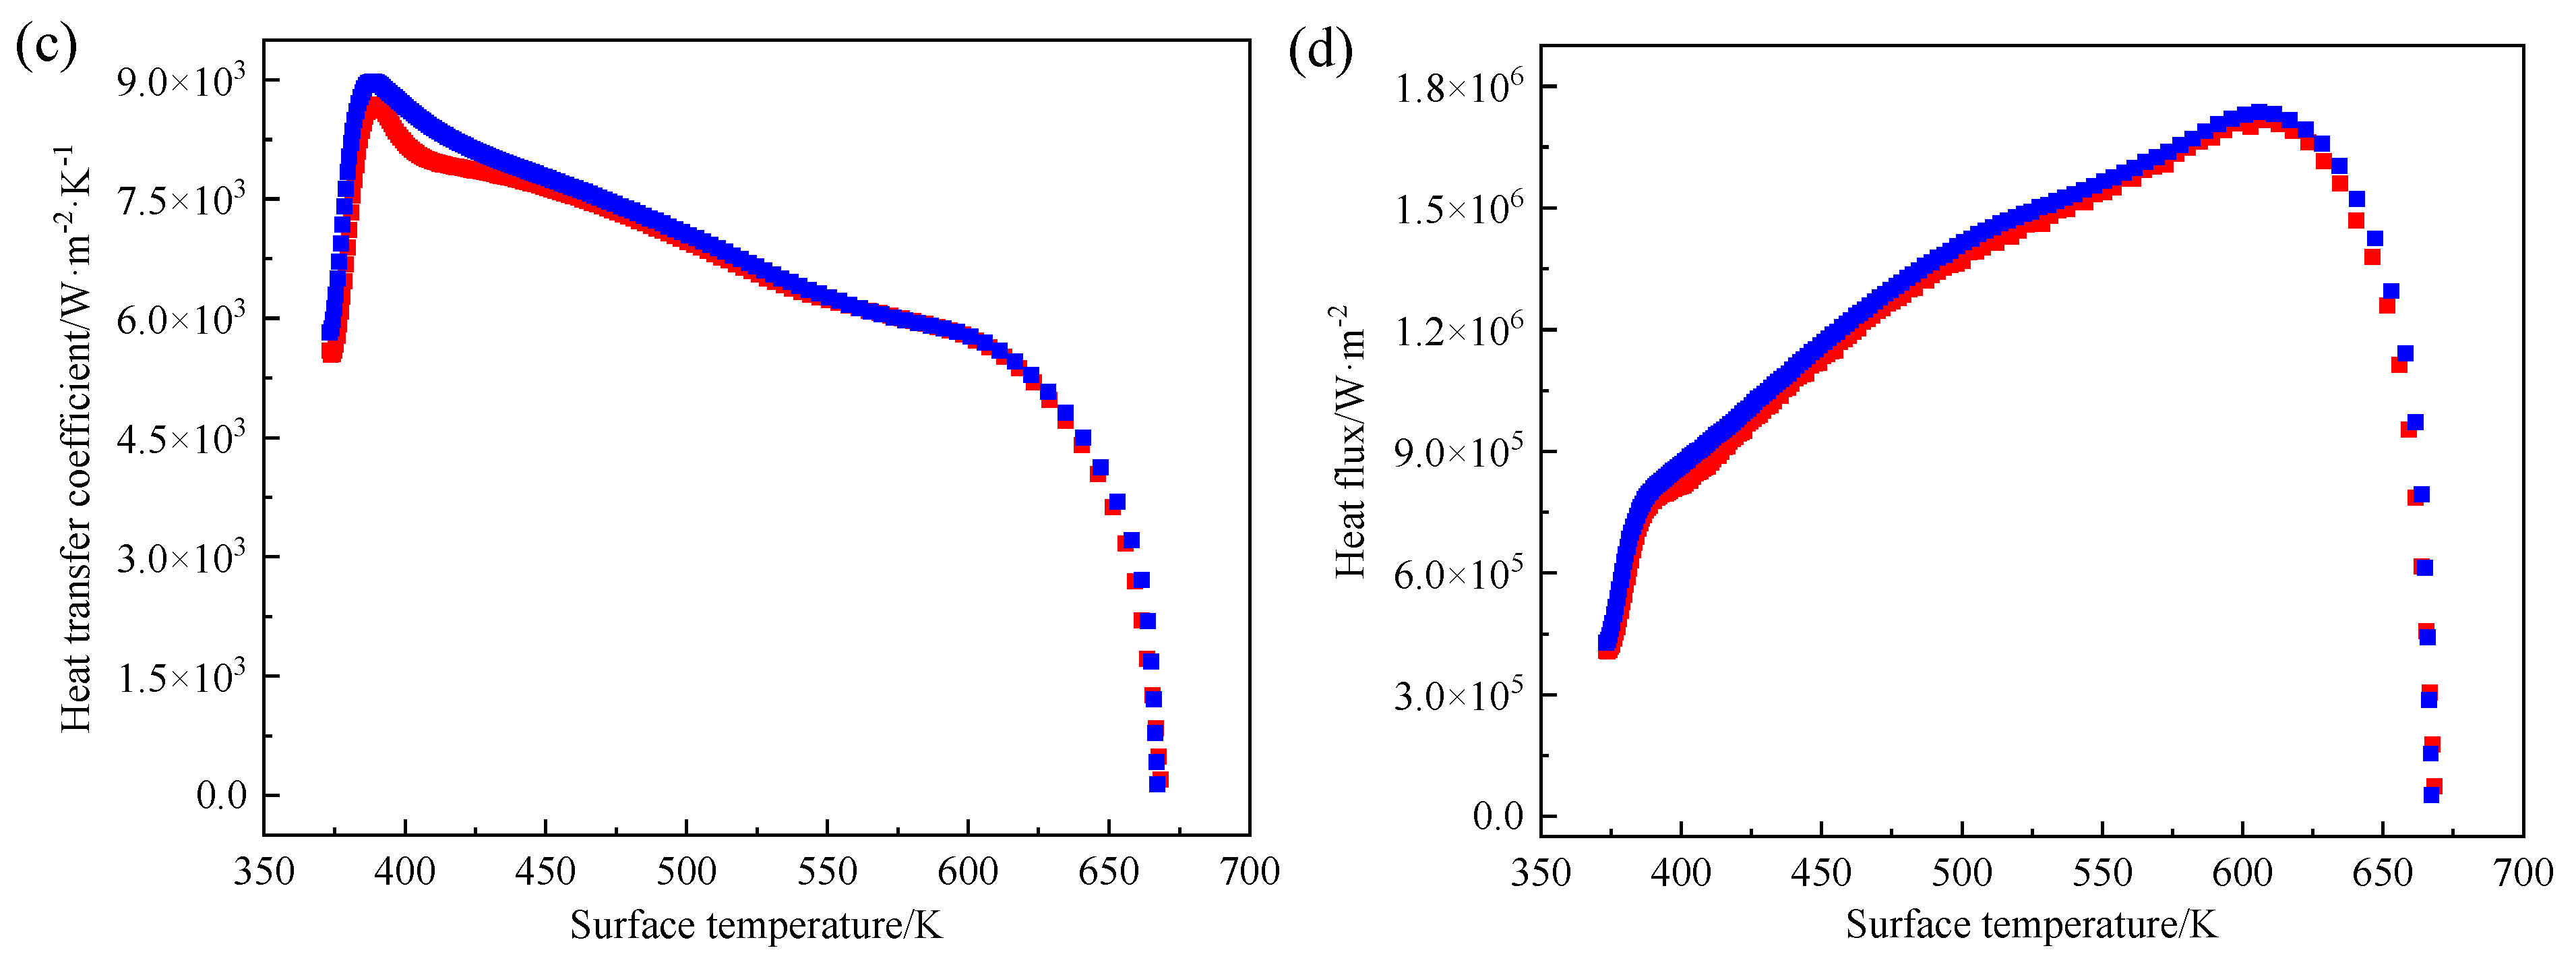
To verify the repeatability of the experiment, four groups of experiments were carried out under the same condition. The boiling curves of the HTC and the heat flux were obtained by an inverse calculation and the error was analyzed. Figure 4 shows two groups of equivalent boiling curves obtained for the AZ80 alloy ingot with a diameter of 100 mm under the conditions of a water flow of 4 m3/h, a cooling water temperature of 298 K, an initial ingot temperature of 673 K, and a surface roughness of 1.08 μm. The results show that the maximum relative errors of the HTC and the heat flux in the impingement zone are 4.24% and 3.47%, respectively. The maximum relative errors of the HTC and the heat flux in the free−falling zone are 5.51% and 6.65%, respectively. The results of the two experiments are in a good agreement.

4. Results and Discussion

4.1. Comparison of HTC with Different Alloys

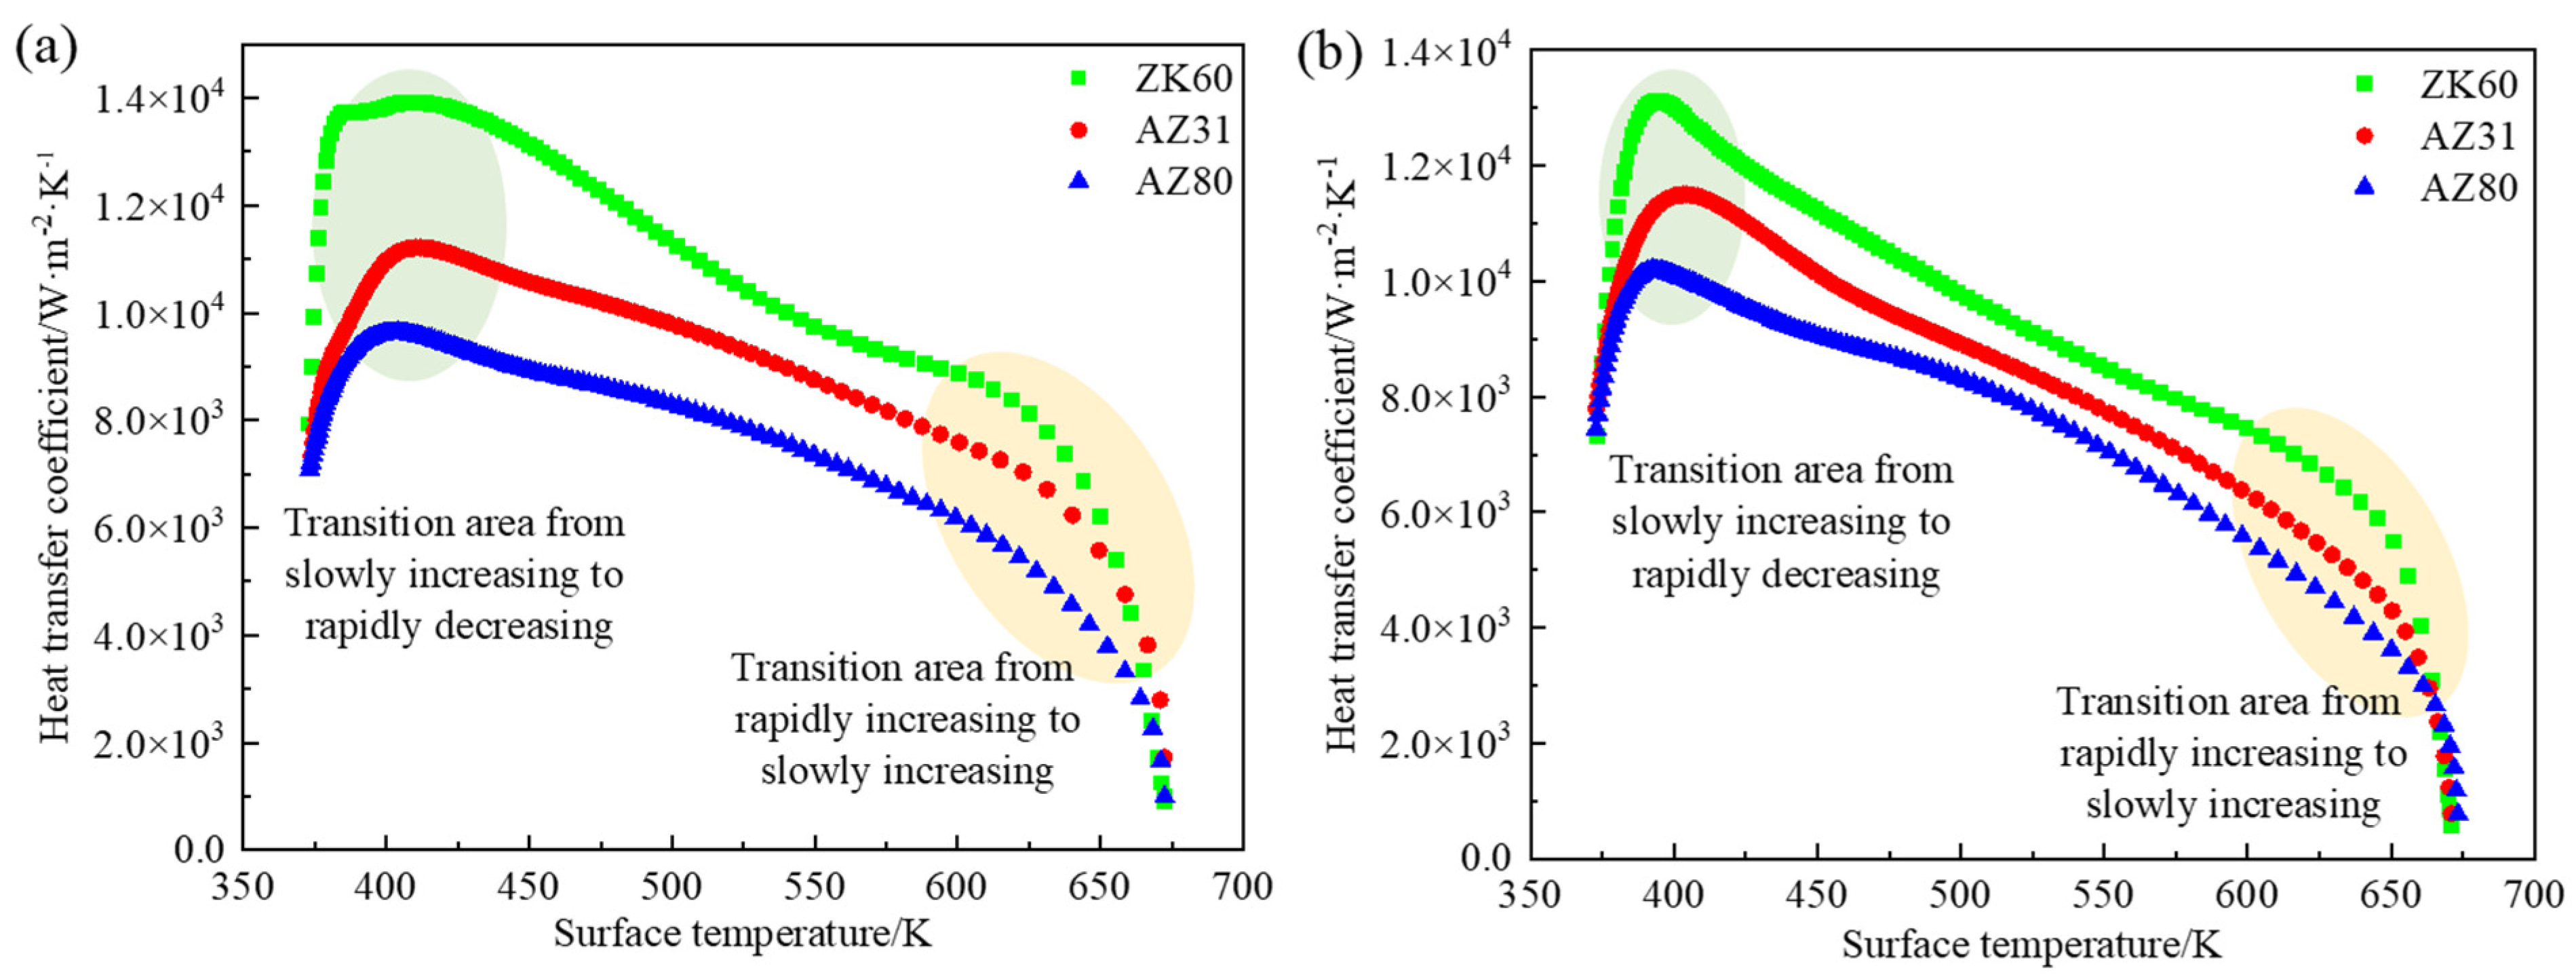
Figure 5 shows the HTC variations of the different magnesium alloys in the impingement zone and the free-falling zone as a function of the ingot surface temperature (Ts). It can be found that whether in the impingement zone or the free-falling zone, the HTC is roughly divided into three sections. As the surface temperature of the ingot decreases, it increases rapidly in the high-temperature section, then slowly increases to the peak value, and finally decreases rapidly. The impingement zone, shown in Figure 5a, and the free-falling zone, shown in Figure 5b, both show that the HTC corresponding to the ZK60 magnesium alloy is the largest, followed by the AZ31 magnesium alloy, and finally the AZ80 magnesium alloy.
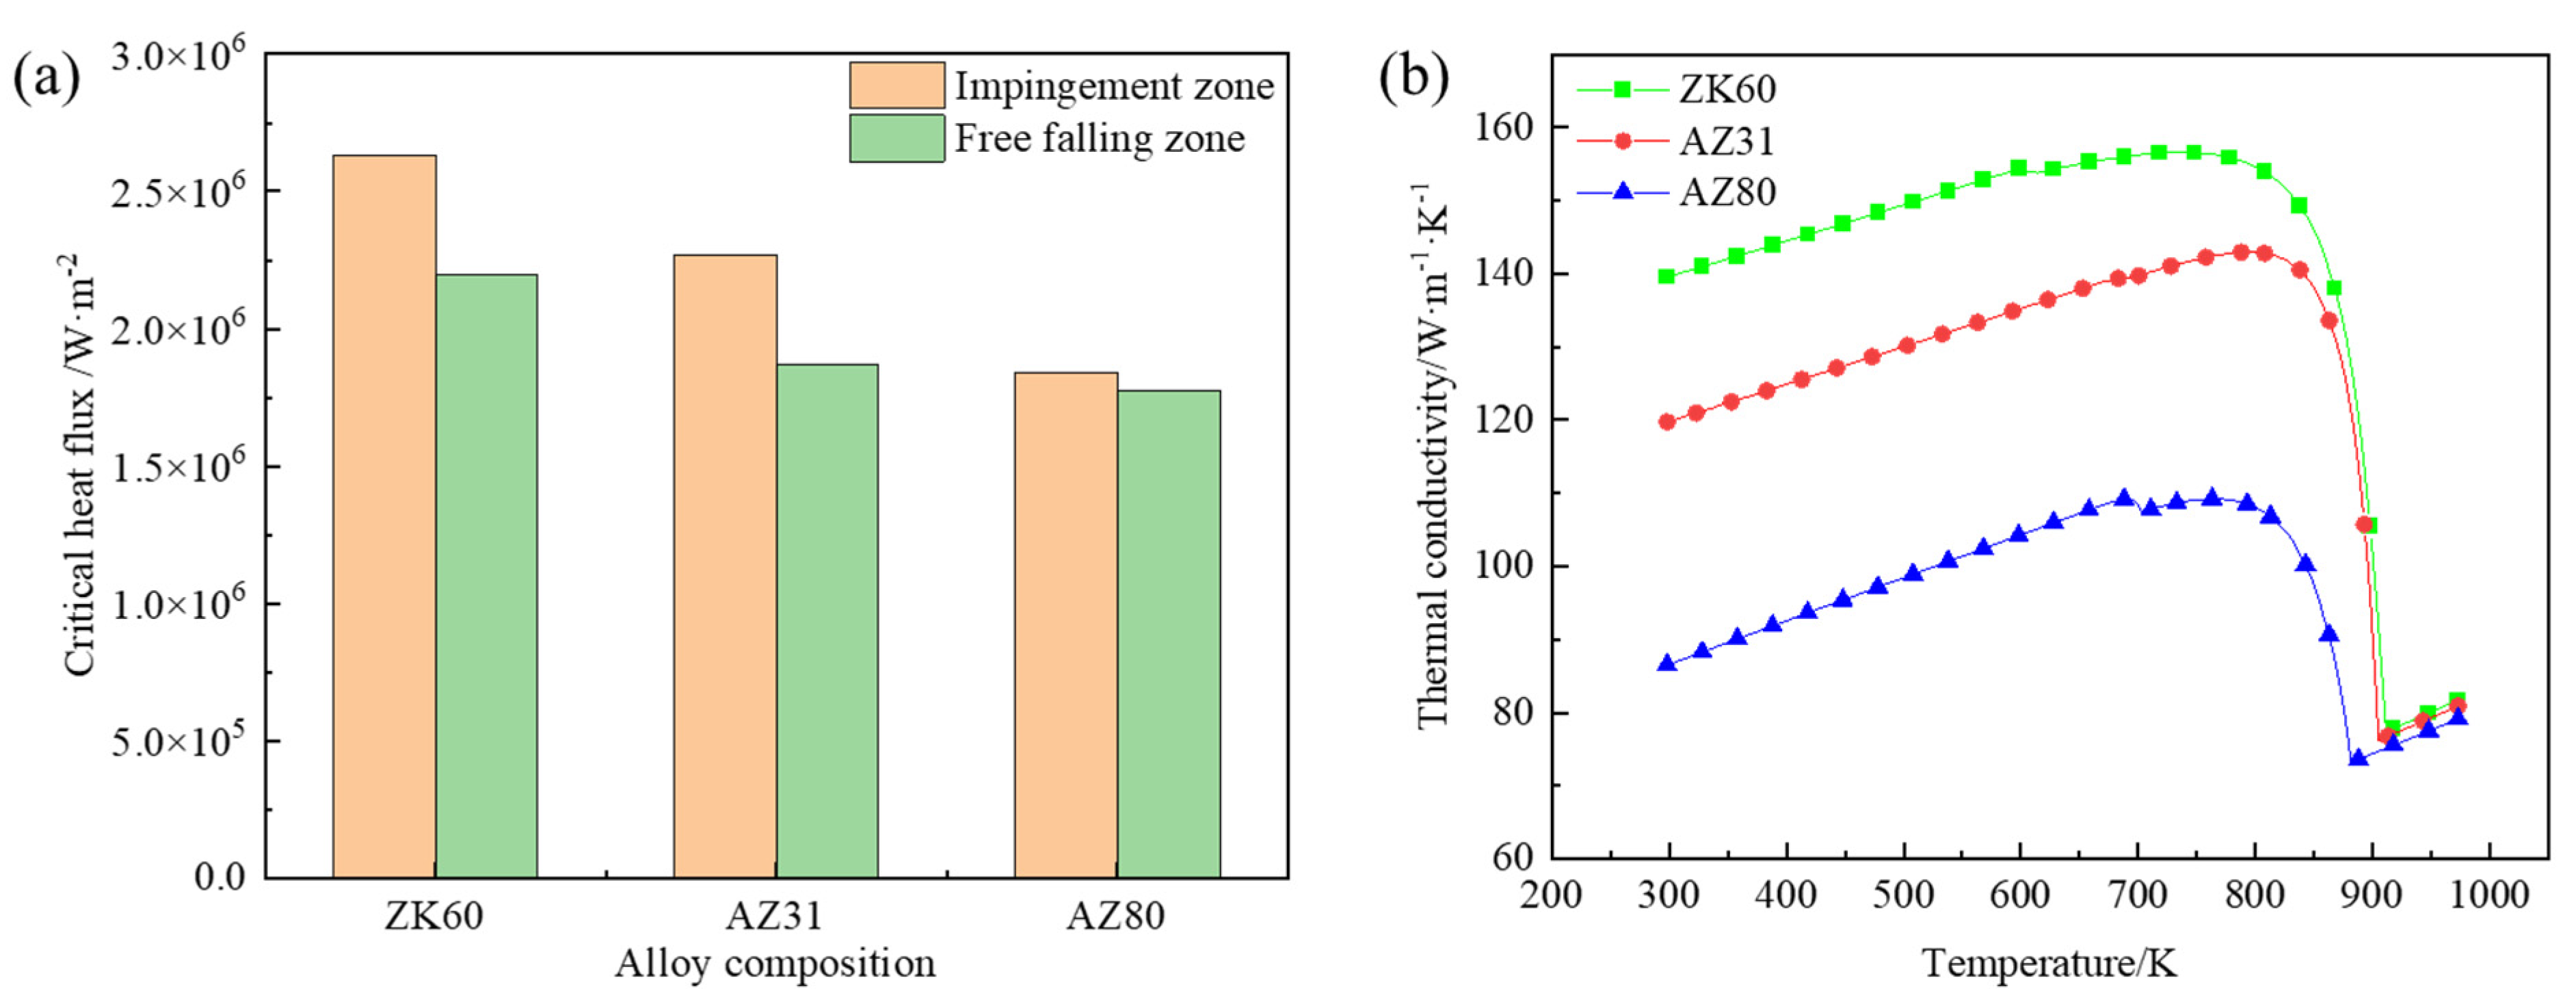
The solute elements in the matrix can dissipate the heat as phonons in the scattering center. Therefore, the more elements in the alloy, the lower its thermal conductivity. In the Mg-Al alloy, the electrons are strongly scattered because of the lattice distortion caused by the solid solution of Al and the large amount of Mg17Al12 phase at the grain boundary, which leads to the decrease in the electron heat transfer ability. In addition, the scattering effect enhances with the increase in the aluminum content, so the thermal conductivity of the AZ80 alloy is significantly lower than that of the AZ31 alloy. Comparatively, for the Mg-Zn-Zr alloy, Zn as the solid solution element has little influence on the Mg matrix, and the amount of Mg-Zn phase formed in the Mg matrix is also small, which makes the thermal conductivity of the Mg–Zn alloy high. Moreover, the addition of Zr does not significantly increase the probability of the electron and the phonon scattering, thus it reduces the thermal conductivity of the alloy because Zr is also a non-solid solution element that has little influence on the Mg matrix. Therefore, the thermal conductivity of ZK60 is higher than that of AZ31 and AZ80.
In conclusion, the thermal conductivity of ZK60, AZ31, AZ80 are significantly reduced in turn. Under the same temperature gradient, the heat transferred to the ingot surface increases with the increase in the thermal conductivity, which continuously promotes the nucleation, growth, and vibration of bubbles, and then its detachment from the cast ingots. The thermal conductivity of the ZK60, AZ31, and AZ80 alloys decreases successively, and their heat transfer coefficient also decreases correspondingly.
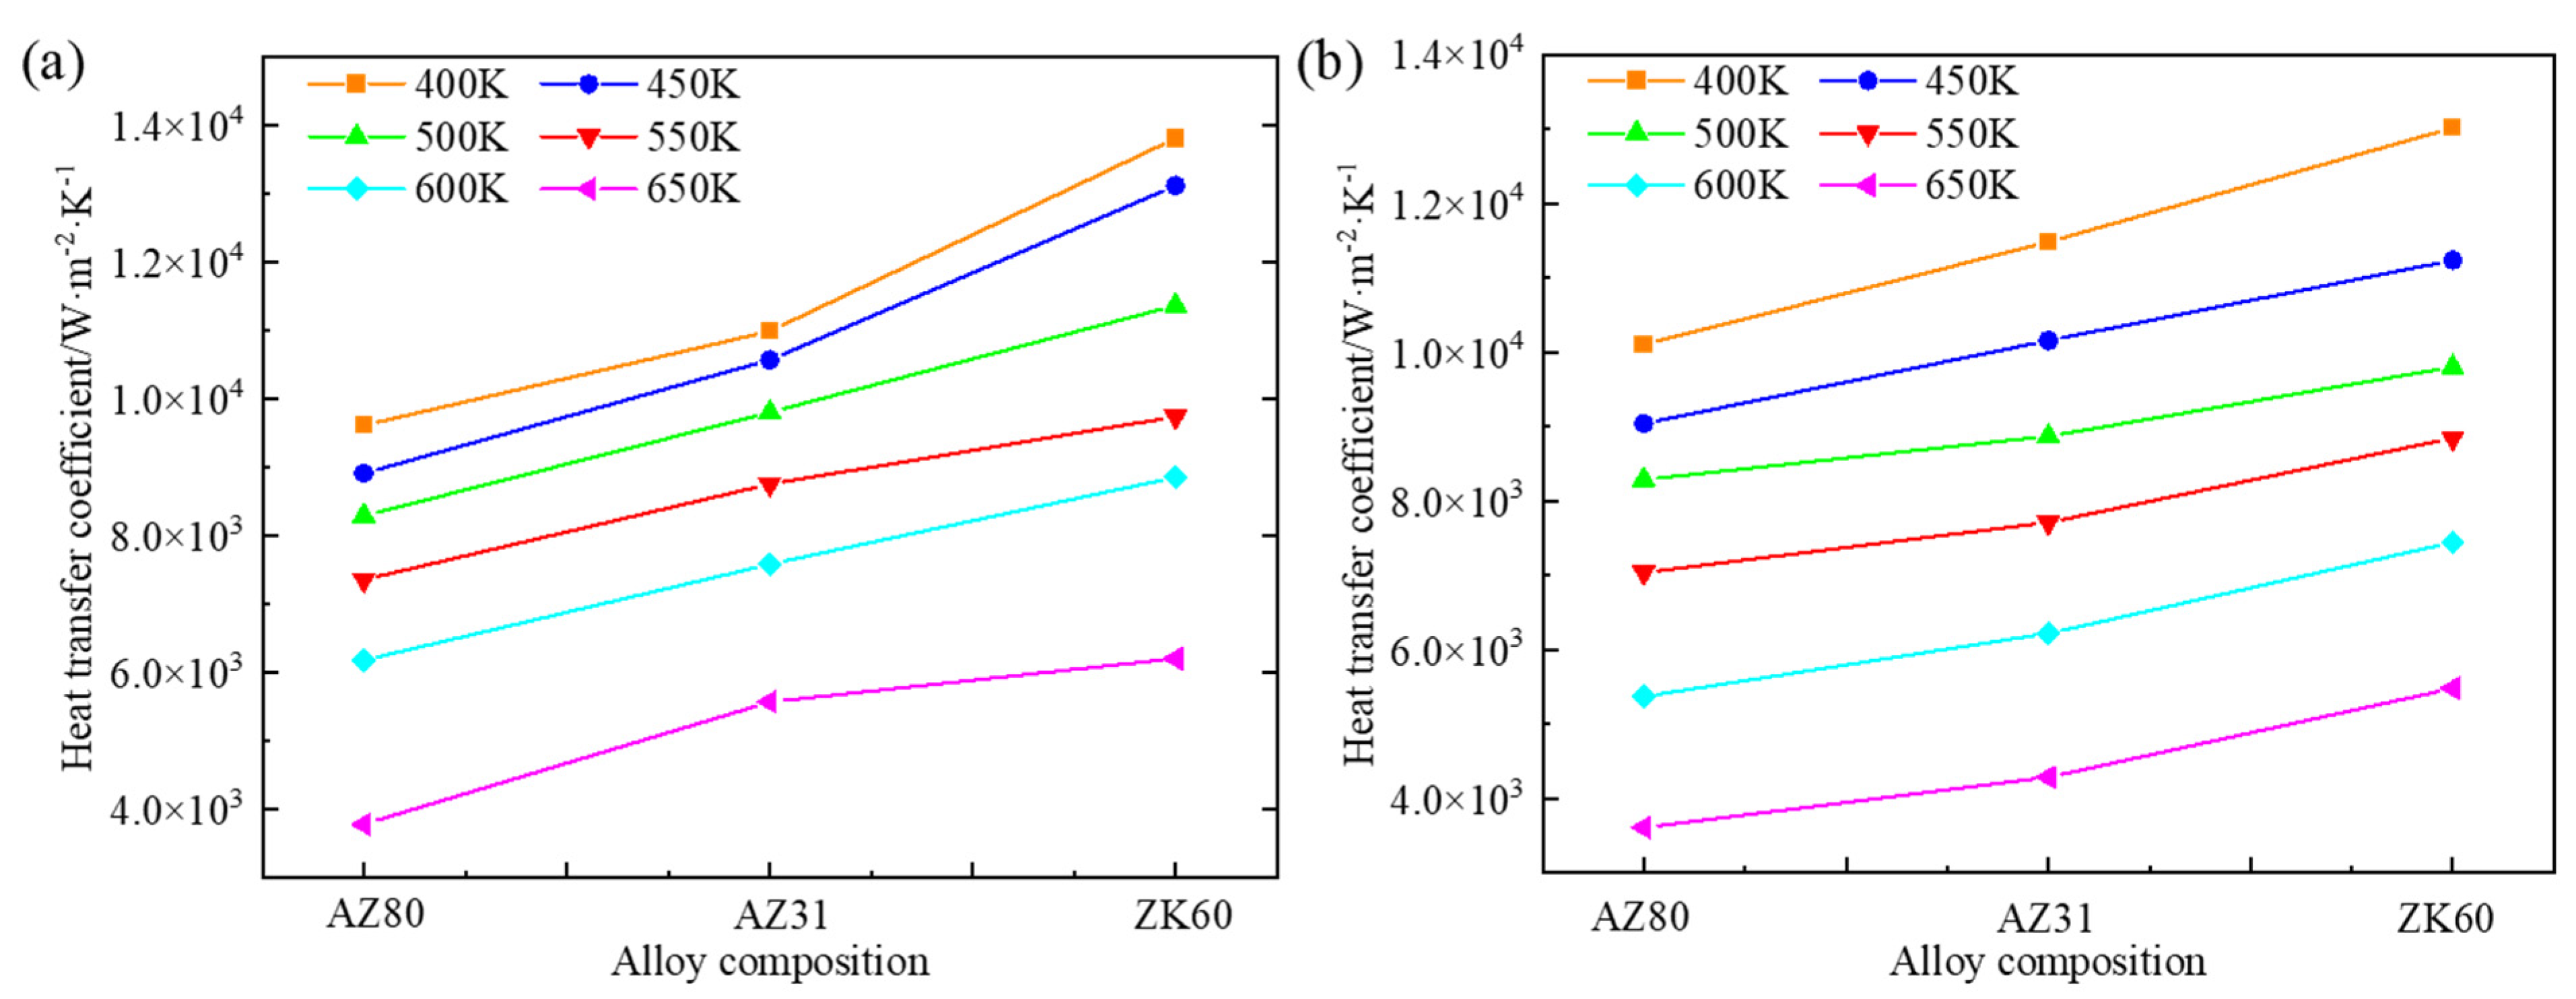
As shown in Figure 6, under the same conditions, the HTCs of the AZ80, AZ31, and ZK60 alloys increase successively. In the lower temperature range (400~450 K), the HTCs of the impingement zone change significantly, and the increasing slope of the free-falling zone is larger, indicating that the influence of the alloy type on the HTC is more sensitive at a lower temperature.
In the impingement zone, the temperature at which the maximum value of the HTC occurs is about 400 K, and the HTC maximum values of ZK60, AZ31, and AZ80 are 13,899.6 W/(m2·K), 11,212.3 W/(m2·K), and 9626.6 W/(m2·K), respectively. During the cooling process of the ingot, when the temperature drops from 673 K to about 625 K, the HTC increases sharply with the temperature drop, and then when the temperature drops from 625 K to about 400 K, the HTC increases slowly until it reaches its peak value at about 400 K. The HTC drops sharply until the boiling water saturates at 373 K. As shown in Figure 5, for different alloys, the transition point of the increasing rate of HTC tends to shift to the left at high temperatures, that is, the transition from a rapid increase to a slow increase in the HTC occurs at a lower temperature.
Similarly, the temperature at which the maximum value of the HTC appears is about 400 K, and the HTC maximum values of ZK60, AZ31, and AZ80 are 13,119.6 W/(m2·K), 11,503.9 W/(m2·K), and 10,194.2 W/(m2·K), respectively. When the temperature drops from 673 K to about 625 K, the HTC also increases sharply with the temperature. When the temperature drops from 625 K to 400 K, it increases slowly compared with the above high-temperature range, but it is higher than the impingement zone. In addition, it is found that the temperature range in which the HTC increases rapidly is wider in the impingement zone than in the free-falling zone, because in the high-temperature range, the water flow rate in the impingement zone is large, and the heat transfer is stronger than in the free-falling zone.
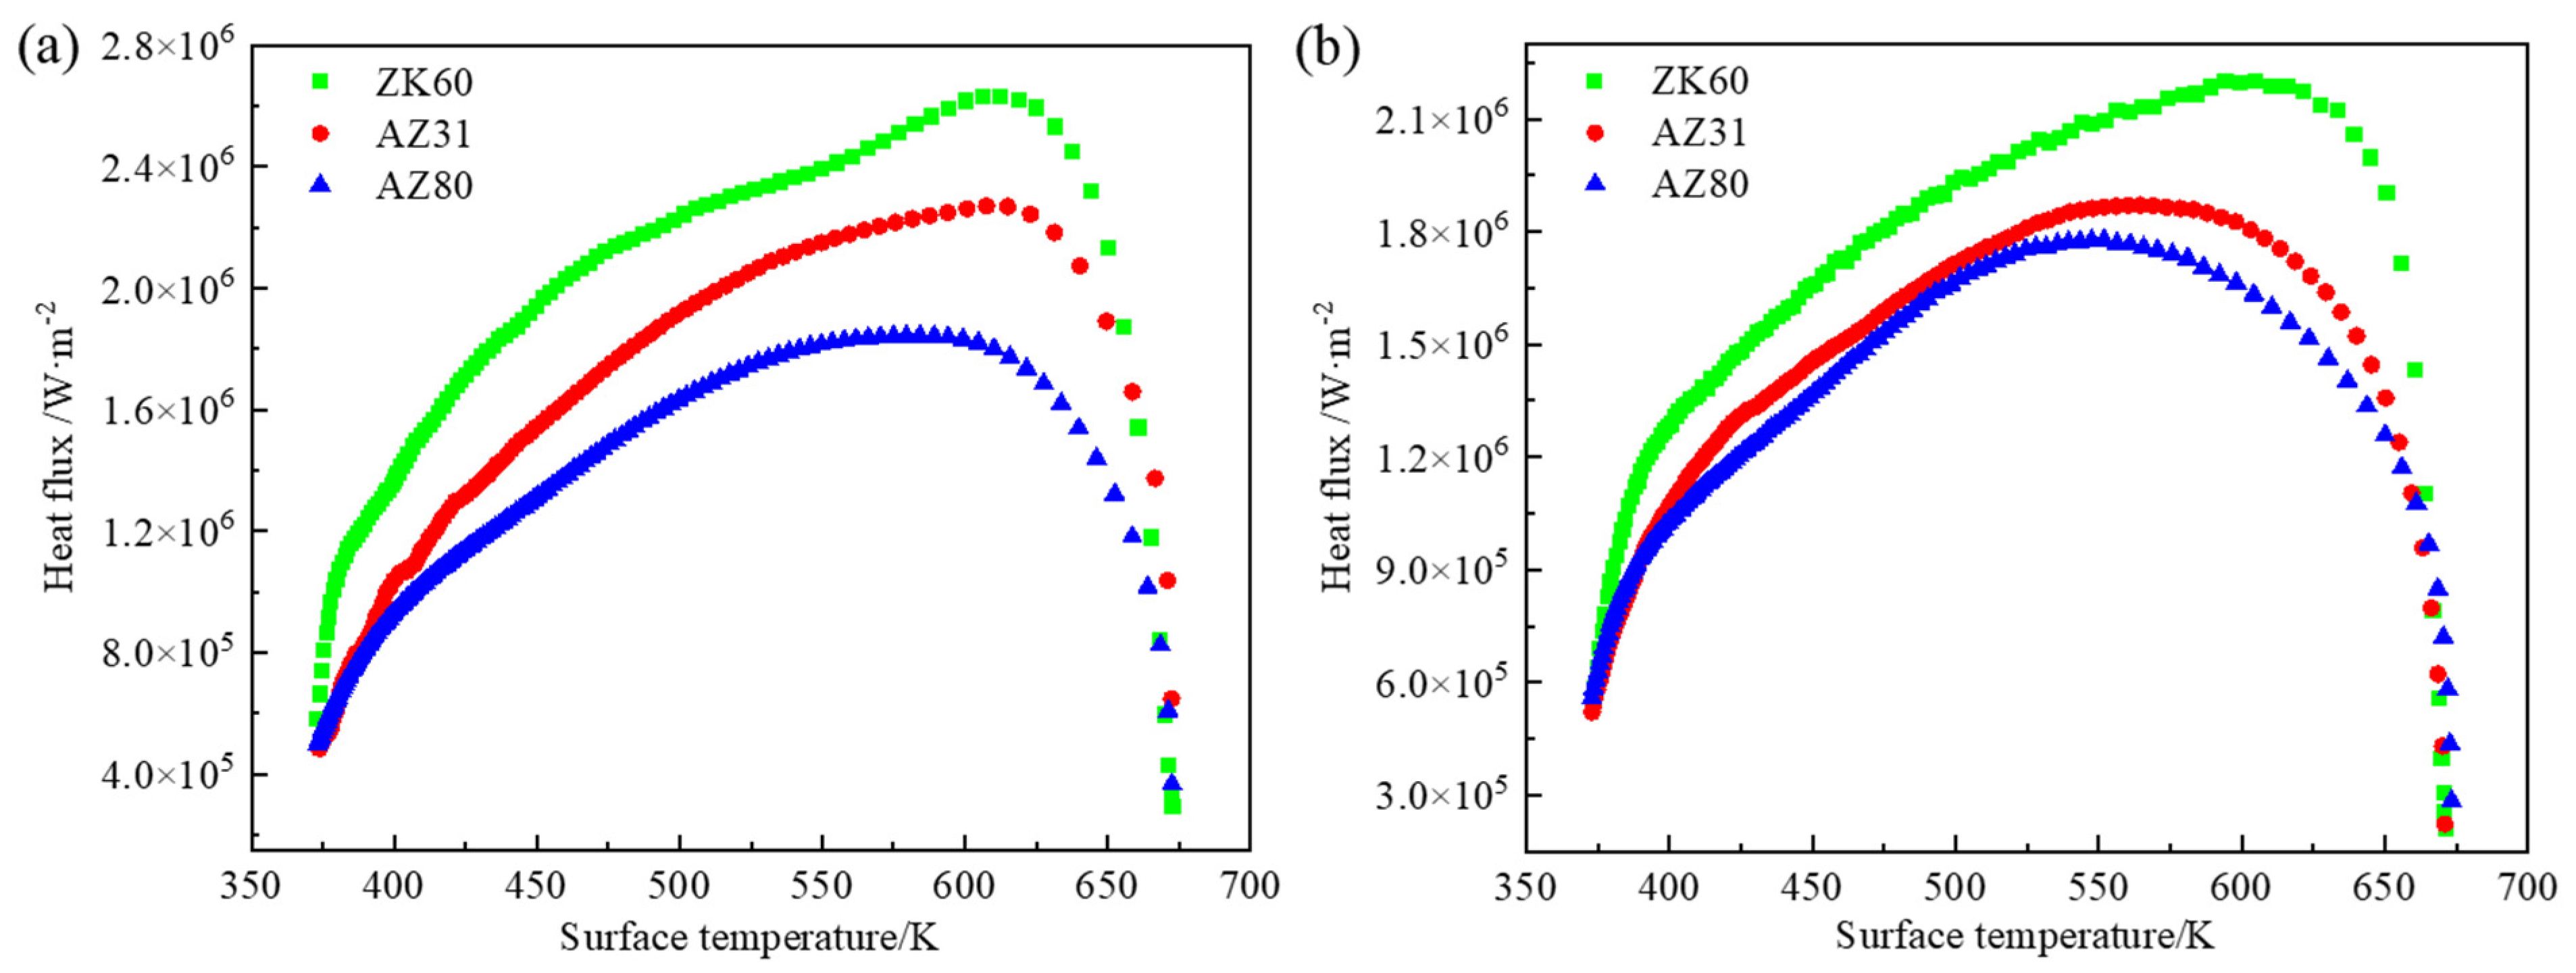
Figure 7 shows the boiling curves of the heat flux of the three alloys as a function of the temperature. The boiling curves in the impingement region and the free-falling region are parabolic, which increase first and then decrease. The core boiling is the main boiling mode, accounting for about 2/3 of the temperature drop range, followed by the transition boiling, and finally the single-phase forced convection. The variations in the heat flux are the same as the HTC. Whether in the impingement zone or the free-falling zone, the heat flux of ZK60 is the largest, followed by AZ31, and the smallest is AZ80.
Figure 8a shows the critical heat flux of the three magnesium alloys in different cooling regions. Combined with Figure 6, it can be seen that the critical heat flux of ZK60, AZ31, and AZ80 in the impingement zone is 2,630,712.2 W/m2, 2,270,348.2 W/m2, and 1,842,520.8 W/m2, respectively, and the corresponding surface temperature is 612.7 K, 607.6 K, and 584.2 K. In the free-falling zone, the critical heat flux of ZK60, AZ31, and AZ80 are 2,199,422.2 W/m2, 1,871,074.2 W/m2, and 1,777,296.6 W/m2, respectively, and the corresponding surface temperatures are 594.4 K, 564.7 K, and 547.5 K. Compared with the impingement zone, the critical heat flux decreases by 16.3%, 17.6%, and 3.4%, respectively. Combined with the thermophysical property parameters of the material in Figure 8b, it can be seen that the temperature corresponding to the critical heat flux gradually shifts to the left with the decrease in the thermal conductivity, that is, the temperature of the transition from the nuclear boiling to the transition boiling gradually decreases. For three kinds of alloy, the impact of the critical heat flux and surface temperature is higher than the critical heat flux and surface temperature of the free-falling area; this is due to the impact velocity being larger and the water pressure being strong. The latter can accelerate the bubble nucleation and growth, and can thus rupture, thereby promoting the ingot surface wettability, strengthening the effect of the cooling capacity.

4.2. Effect of Surface Morphology of Ingot on HTC

In the DC casting of the magnesium alloy, due to the influence of the alloy’s characteristics or the casting process parameters, the surface of the ingot often produces cold isolation, segregation nodular, and/or surface oxidation defects, which not only greatly increase the surface turning thickness of the ingot, reducing the yield, but this also affects the heat transfer behavior between the surface of the ingot and the secondary cooling water, and further affects the internal metallurgical quality of the ingot.
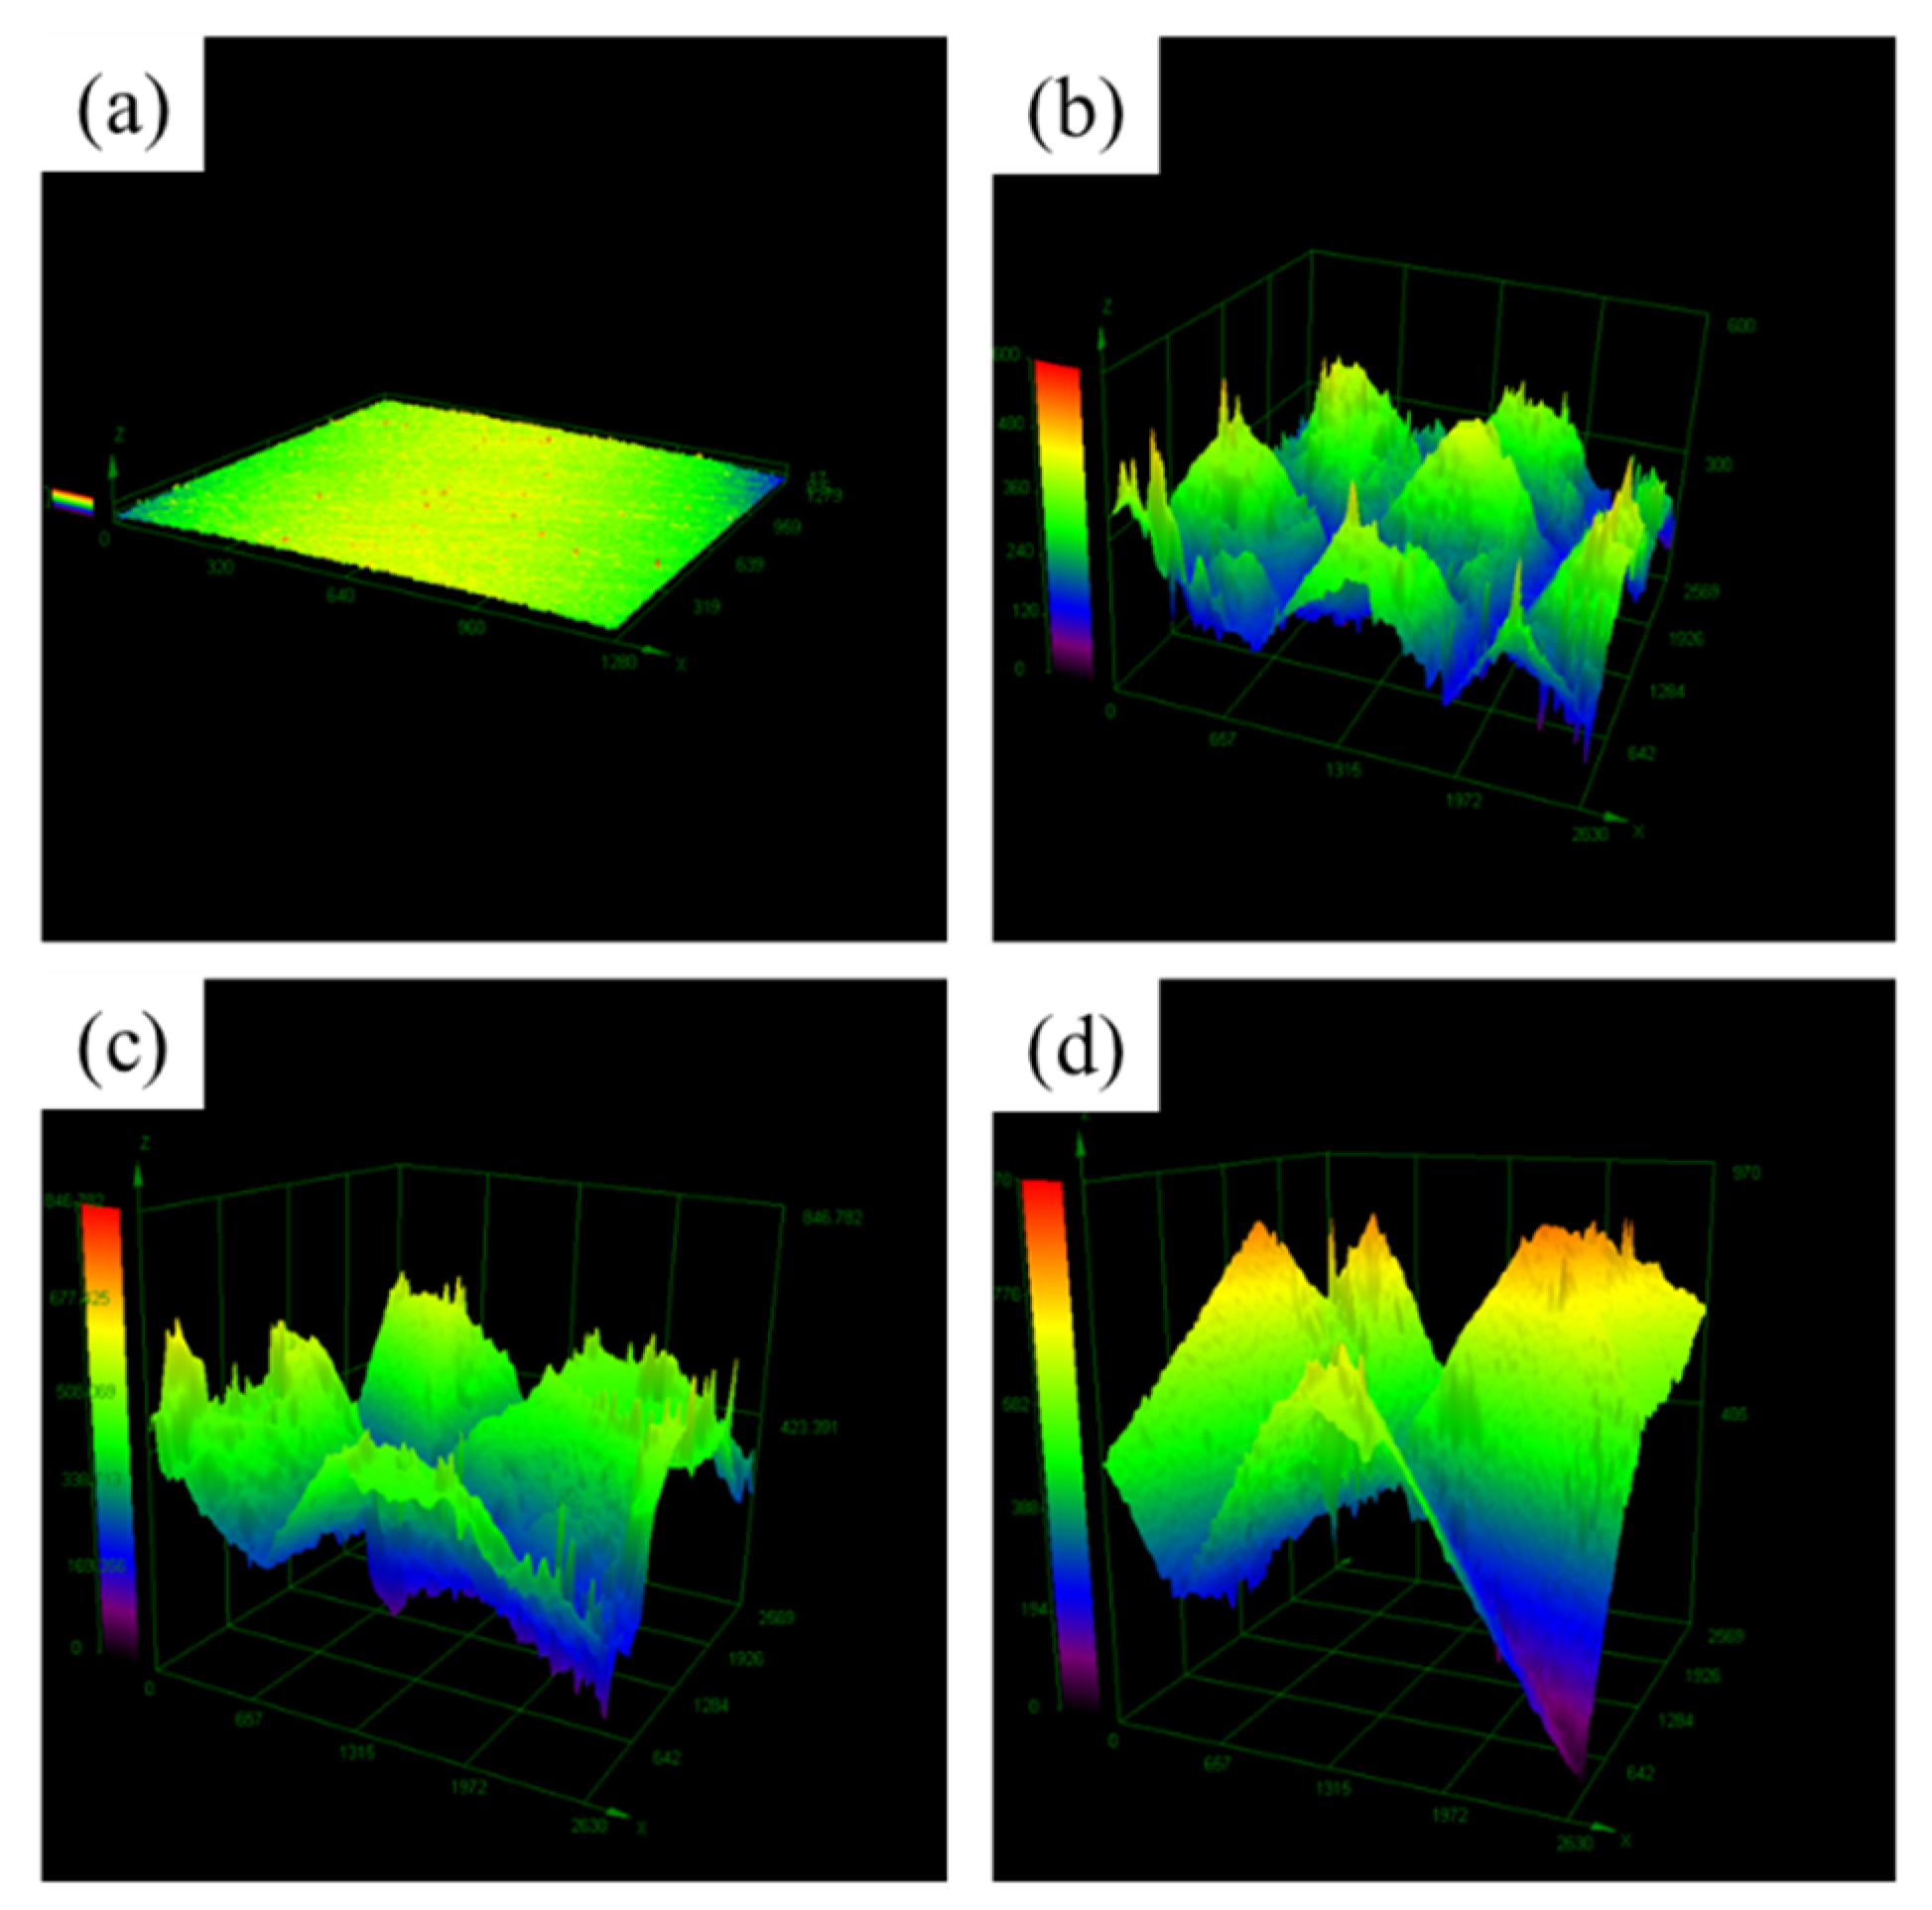
To investigate the influence of the different surface morphology of ingot on the HTC of the secondary cooling zone, four ingots with a different surface roughness were selected to quantitatively characterize the surface characteristics of an ingot with a different morphology and compare with the original ingot surface. The surface morphology of the ingot was quantitatively analyzed by a 3D measurement laser microscope, as shown in Figure 9, and the roughness values of the different morphologies were recorded, as shown in Table 1, where sample five is the surface of the original ingot and is used as the reference value. Different roughness parameters (including the arithmetical mean height, root mean square height, skewness, kurtosis, fractal dimension, Hurst coefficient, topographical entropy, etc.) were quantified in these analyses for the comparison of the surface morphology of the different samples. Arithmetic means height (Sa) is a commonly used parameter for evaluating a three-dimensional surface roughness, which refers to the arithmetic mean or geometric mean of the distance between the points in the contour surface and the center surface. Therefore, this value is used to characterize the numerical size of the surface roughness of each sample.
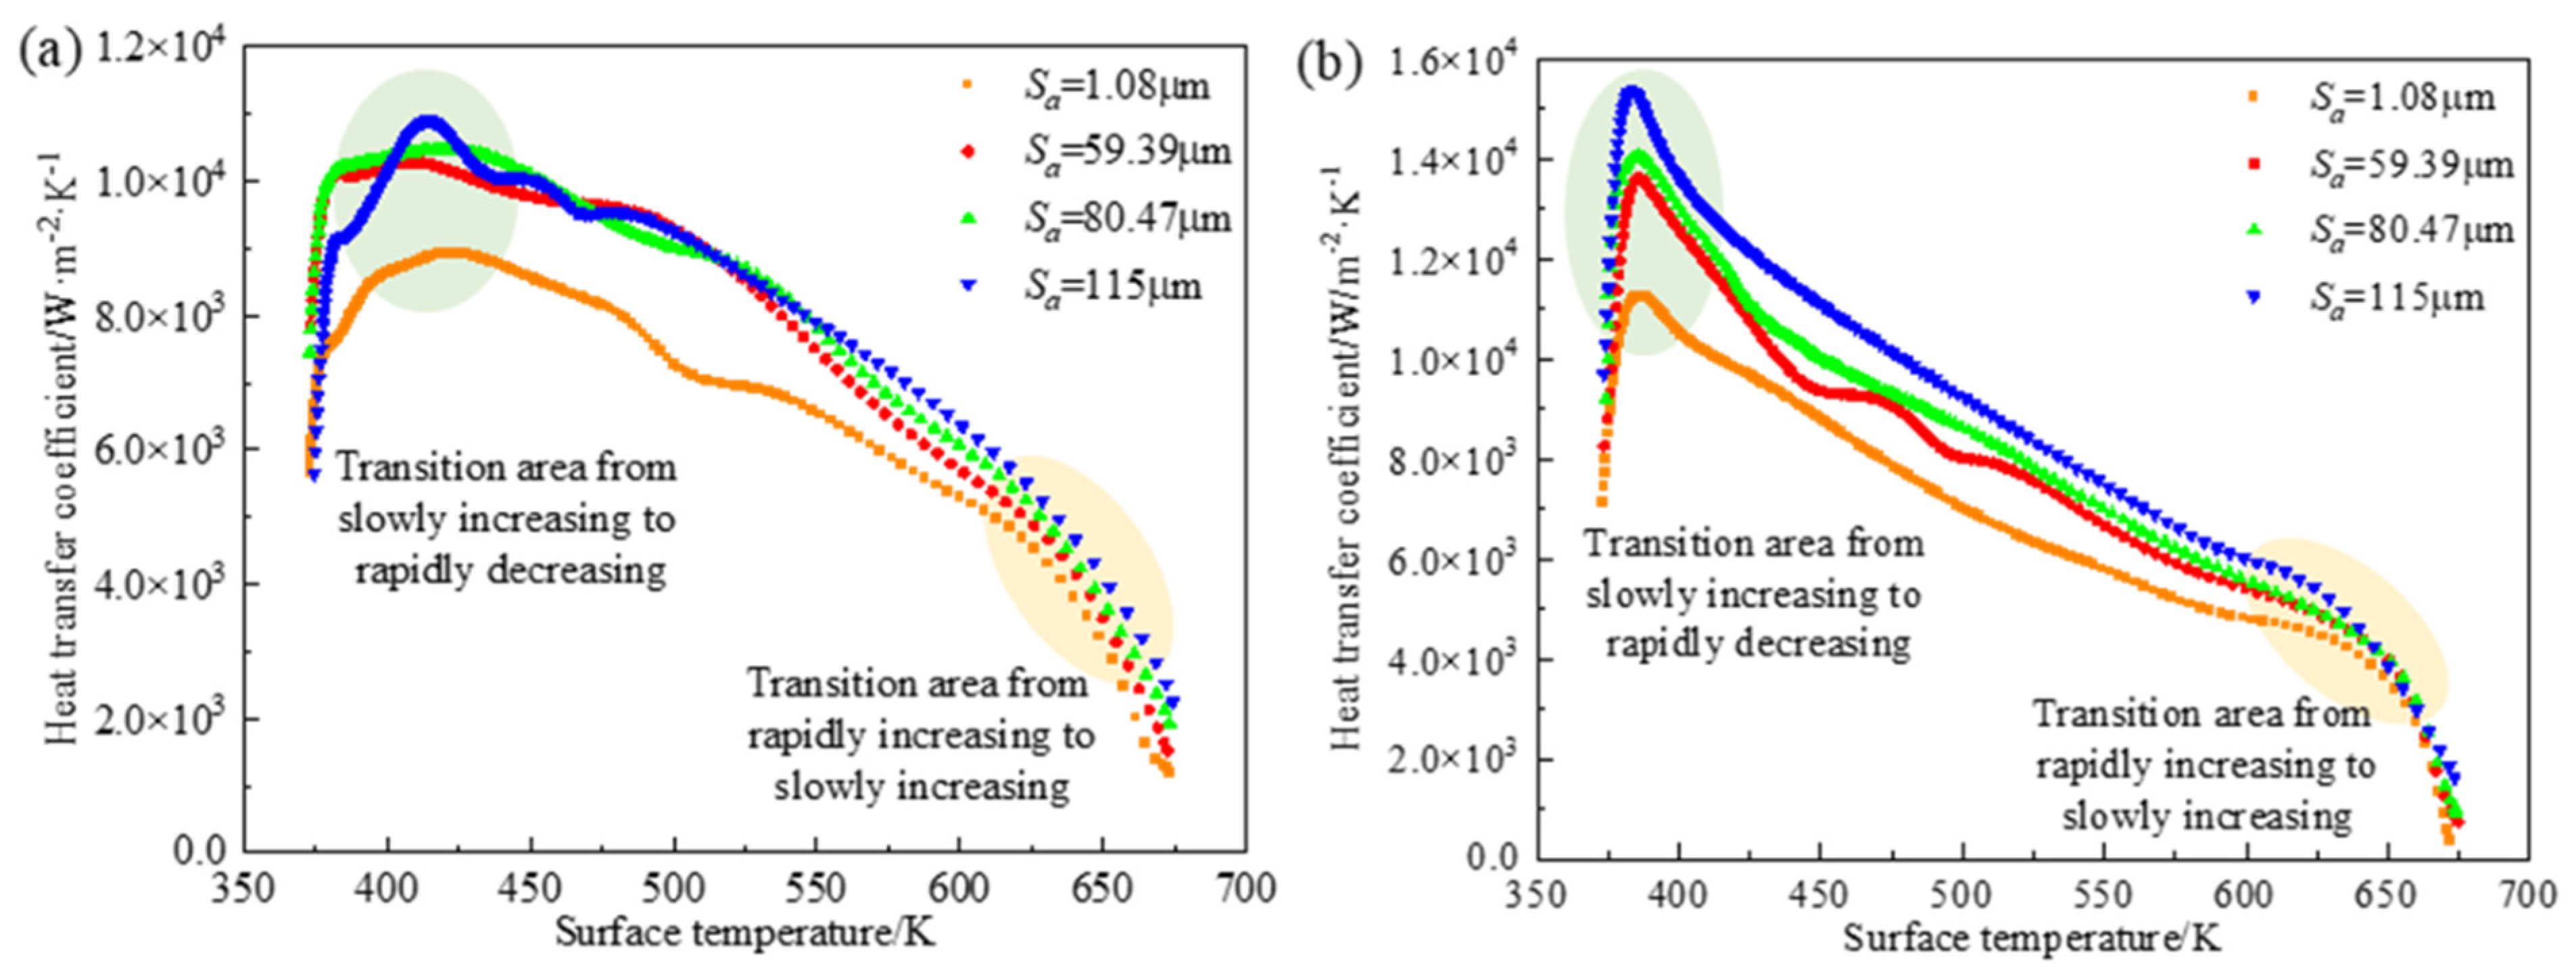
The experimental material was an AZ80 magnesium alloy ingot with a diameter of 160 mm. The initial temperature was 673 K, the water flow rate was 4 m3/h, and the cooling water temperature was about 298 K. As shown in Figure 10, the HTC of the ingot surfaces with a different roughness varies with the temperature in the impingement zone and the free-fall zone. It can be found that the curve is also roughly divided into three parts. The first part is the rapid increase stage at a higher temperature range. At this stage, the temperature transition region tends to shift to the left as the roughness increases, as the area marked yellow in the figure. Then, it slowly increases until the HTC reaches its peak value. The temperature range corresponding to the peak value of the HTC is narrow, that is, the sensitivity of the roughness to the peak value of the HTC is low. Finally, the HTC decreases sharply at the lower temperatures (T < 400 K).
The HTC in both the impingement zone and the free-falling zone increases with the increase in the roughness, which is mainly because the surface area of the ingot contacting with cooling water increases with the increase in the surface roughness [16]. As shown in Figure 11, from the bubble nucleation theory, within a unit length, the increase in the roughness leads to the increase in the contact area between the cooling water and the ingot, which increases the density of the nucleation position. Therefore, the increase in the HTC with the increase in the roughness is essentially attributed to the increase in the density of the bubble nucleation position [21].
When the roughness is 1.08 µm, 59.39 µm, 80.47 µm, and 115 µm, the HTC maximum values are 8936.4 W/(m2·K), 10,290.82 W/(m2·K), 10,473.4 W/(m2·K), and 10,907.5 W/(m2·K), respectively. Then, when the temperature drops from 673 K to 525 K, it is obvious that the HTC increases with the increase in the roughness. However, when the roughness exceeds 59.39 µm and the temperature is lower than 525 K, the HTC is no longer significantly affected by the roughness. In the experimental and statistical studies of the surface roughness changes associated with the spray quenching, Bernardin et al. found that the effect of the roughness on the boiling heat transfer was mainly related to the ability of the liquid to enter the surface of the sample [21]. When the temperature is lower than 525 K, the heat transfer mode is core boiling, and the cooling water is in direct contact with the surface of the ingot. The contact area of the rough surface is larger than that of the smooth surface, so the HTC of the rough surface is significantly higher than that of the smooth surface. However, due to the fast water flow and the strong impact force in the impingement area, the influence of the roughness on the HTC is smaller than that of the water spraying pressure, so the sensitivity of the roughness to the HTC is low, and the HTC of the rough surface has little difference in the nuclear boiling mode. When the temperature is higher than 525 K, the heat transfer mode is in the transition boiling phase, and the nucleation density will increase with the increase in the roughness, but it is difficult to form a continuous bubble film under the action of the water flow impact. Therefore, the larger the roughness is in the high-temperature range, the higher the bubble nucleation density is. Due to the instability of the bubble film, bubbles are constantly generated and separated from the ingot surface. In the case of the repeated impact of cooling water, the HTC increases with the increase in the roughness.
When the roughness is 1.08 µm, 59.39 µm, 80.47 µm, and 115 µm, the HTC maximum value is 11,271.2 W/(m2·K), 13,632.5 W/(m2·K), 14,061.6 W/(m2·K), and 15,364.3 W/(m2·K), respectively. As can be seen from Figure 10, the peak value of the HTC in the free−falling zone is significantly higher than that in the impingement zone, and the HTC in the free−falling zone increases more obviously with the increase in the roughness. The above phenomena are related to the cooling intensity. The water flow rate in the free−falling zone is lower than that in the impingement zone, so the cooling intensity in the impingement zone is higher than that in the free−falling zone, especially the HTC in the high-temperature range is significantly higher than that in the free−falling zone.

4.3. Determination of HTC in Different Roughness

4.3.1. Impingement Zone

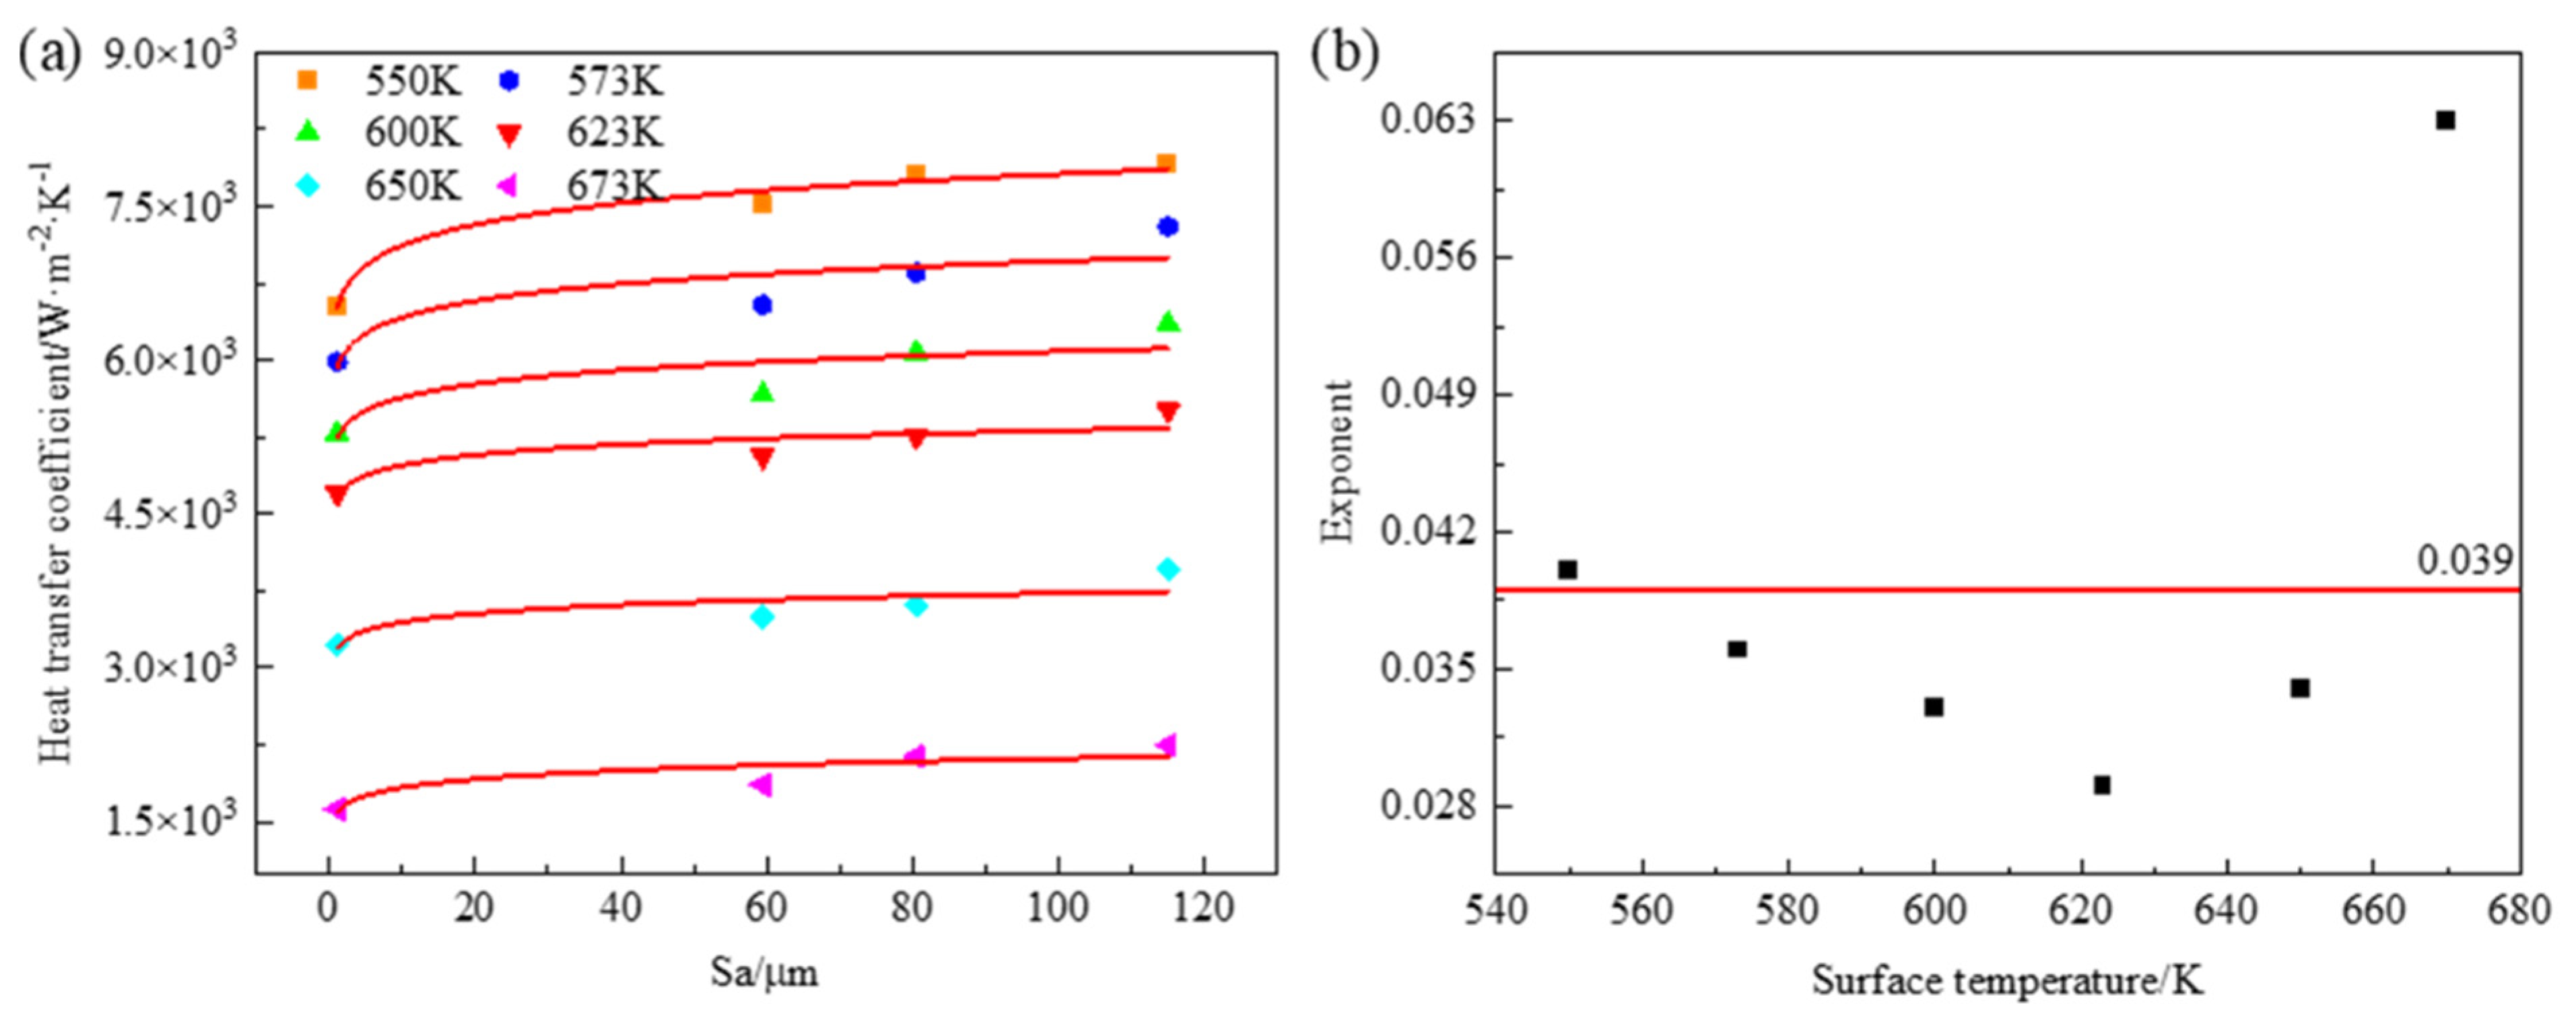
As shown in Figure 12, the HTC of each interval is regression analyzed according to the roughness, and the influence of the roughness on the HTC is positive exponential. With the increase in the roughness, the HTC increases rapidly at first and then tends to increase slowly. The transition point is about 20 µm, that is, when the roughness is less than 20 µm, the HTC is more sensitive to the change in the roughness, and when the roughness is greater than 20 µm, the sensitivity gradually decreases. As shown in Figure 12b, in the temperature range of 550~673 K, the value of n is 0.039.
When the surface temperature is 550~673 K and the roughness is 1.08 µm, the relationship between the HTC and the ingot surface temperature can be obtained by mathematic fitting, as shown in Equation (3).
h ( I Z 1.08 ) = 0.336 T s 2 + 370 T s 95 , 666
Considering the surface temperature and the surface roughness of the ingot, the following mathematical relation of the HTC can be obtained by (Equation (4)):
h = C h S a n
When h = h ( I Z 1.08 )  h and n are known, C is an undetermined constant. According to the above conditions, the value of C is one. Therefore, under different roughness conditions, when the surface temperature of the ingot is between 550 K and 673 K, the relationship between the HTC and the surface temperature and roughness is as follows:
h = ( 0.336 T s 2 + 370 T s 95 , 666 ) S a 0.039
When the surface temperature of the ingot is lower than 550 K, the HTC of an ingot with a roughness of 59.39 µm, 80.47 µm, and 115 µm is a little different, but the HTC of an ingot with a smooth ingot (Sa = 1.08 µm) is much different. Therefore, the average values of the first three HTCs were fitted according to the surface temperature, and when the roughness Sa = 1.08 µm, the HTCs were fitted separately to obtain the HTCs of the rough (hr) and the smooth surfaces (hs) with the temperature from 373 K to 550 K, as shown in Equations (6) and (7), respectively.
h r = 0.14 T s 2 + 114.1 T s 13 , 541.2
h s = 0.004 T s 3 5.49 T s 2 + 2595.8 T s 395 , 974.1

4.3.2. Free−Falling Zone

In the free−falling zone, the HTC is solved the same way as in the impingement zone. As shown in Figure 13a, six characteristic temperatures were selected in the temperature range of 373~673 K, and the HTC was regression analyzed according to the roughness at each characteristic temperature. It can be seen that the roughness has a positive exponential effect on the HTC, and its change law is similar to that of the impingement zone. The roughness is also about 20 µm, which is regarded as the transition point of the sensitivity of the HTC to the change in the roughness. The value of the index n at different temperatures is shown in Figure 13b, and its average value is 0.045, which is taken as the effective value.
When the roughness Sa is 1.08 µm, the relationship between the HTC and the surface temperature is fitted as follows:
h ( F F Z 1.08 ) = 0.02 T s 2 4.62 T s + 15 , 699.46
According to the undetermined coefficient method, the roughness of 1.08 µm in the free−falling zone was substituted into Equation (4), and the constant C = 1 was solved. Therefore, the relationship between the free-fall zone HTC and the surface temperature and the roughness of the ingot can be obtained as follows:
h = ( 0.02 T s 2 4.62 T s + 15 , 699.46 ) S a 0.045

5. Conclusions

(1) For the AZ80, AZ31, and ZK60 alloys, under the same cooling conditions, the variations in the HTC and the heat flux are mainly related to thermal conductivity. The greater the thermal conductivity of the alloy, the greater the HTC. The HTCs of the AZ80, AZ31, and ZK60 alloys increase successively.
(2) With the decrease in the surface temperature, the HTCs in both the impingement zone and free−falling zone show a trend of a rapid increase at first, then they slowly increase to the maximum value, and finally show a rapid decrease, with the peak value appearing at about 400 K. At the lower surface temperature of the ingot, the heat transfer behavior is close to the stage of the single forced convection and the initial stage of nuclear boiling, and the HTC in this stage is more sensitive to the alloy type.
(3) Under different surface roughness conditions, the HTC increases with the increase in the roughness. When the surface roughness of the ingot is small (Sa < 20 µm), the HTC is more sensitive to the change in the surface roughness. When the surface roughness of the ingot is larger than 20 µm, the surface roughness has little effect on the HTC. Considering the influence of the ingot surface temperature and the surface roughness on the HTC, the mathematical relationships between them are established as follows:
The impingement zone:
{ h = ( 0.336 T s 2 + 370 T s 95 , 666 ) S a 0.039 h r = 0.14 T s 2 + 114.1 T s 13 , 541.2 h s = 0.004 T s 3 5.49 T s 2 + 2595.8 T s 395 , 974.1 550   K   <   T   <   673   K 373   K   <   T   <   550   K   and   S a   >   59 . 39   μ m   373   K   <   T   <   550   K
The free−falling zone:
h = ( 0.02 T s 2 4.62 T s + 15 , 699.46 ) S a 0.045 373   K   <   T   <   673   K

Author Contributions

Resources, methodology, validation, writing—original draft preparation, W.H.; methodology, software, formal analysis, Y.J.; writing—review and editing, X.C.; project administration, Q.L.; validation, data curation L.C.; investigation, S.C. All authors have read and agreed to the published version of the manuscript.

Funding

This study was funded by the National Natural Science Foundation of China (No. 51904151); the Natural Science Foundation of Fujian Province (No. 2021J05232); and the Open fund of Key Laboratory of Electromagnetic Processing of Materials (No. NEUEPM023).

Institutional Review Board Statement

Not applicable.

Informed Consent Statement

Not applicable.

Data Availability Statement

The data presented in this study are available on request from the corresponding author.

Conflicts of Interest

The authors declare no conflict of interest.

References

  1. Mordike, B.L.; Ebert, T. Magnesium: Properties–Applications–Potential. Mater. Sci. Eng. A 2001, 302, 37–45. [Google Scholar] [CrossRef]
  2. Karanpreet, S.; Suri, N.M. Magnesium Alloys and Its Machining: A Review. Int. Res. J. Eng. Technol. 2016, 3, 9. [Google Scholar]
  3. Chen, X.; Jia, Y.; Shi, Z.; Le, Q.; Li, J.; Zhang, M.; Liu, M.; Atrens, A. Understanding the discharge behavior of an ultra-high-purity Mg anode for Mg–air primary batteries. J. Mater. Chem. A 2021, 9, 21387–21401. [Google Scholar] [CrossRef]
  4. Chen, X.; Liu, X.; Le, Q.; Hang, M.; Liu, M.; Atrens, A. A comprehensive review of the development of magnesium anodes for primary batteries. J. Mater. Chem. A 2021, 9, 12367–12399. [Google Scholar] [CrossRef]
  5. Lalpoor, M.; Eskin, D.G.; Ruvalcaba, D.; Fjær, H.G.; Ten Cate, A.; Ontijt, N.; Katgerman, L. Cold Cracking in DC-Cast High Strength Aluminum Alloy Ingots: An Intrinsic Problem Intensified by Casting Process Parameters. Mater. Sci. Eng. A 2011, 528, 2831–2842. [Google Scholar] [CrossRef] [Green Version]
  6. Cui, J.; Zhang, Z.; Le, Q. DC Casting of Light Alloys under Magnetic Fields. Trans. Nonferrous Met. Soc. China 2010, 20, 2046–2050. [Google Scholar] [CrossRef]
  7. Chen, X.; Jia, Y.; Liao, Q.; Le, Q.; Ning, S.; Yu, F. The simultaneous application of variable frequency ultrasonic and low frequency electromagnetic fields in semi continuous casting of AZ80 magnesium alloy. J. Alloy. Compd. 2019, 774, 710–720. [Google Scholar] [CrossRef]
  8. Grandfield, J.F.; Eskin, D.G.; Bainbridge, I.F. Direct-Chill Casting of Light Alloys: Science and Technology; John Wiley and Sons: Hoboken, NJ, USA, 2013. [Google Scholar]
  9. Grandfield, J.F.; Hoadley, A.; Instone, S. Water Cooling in Direct Chill Casting: Part 1, Boiling Theory and Control. In Essential Readings in Light Metals: Volume 3 Cast Shop for Aluminum Production; Grandfield, J.F., Eskin, D.G., Eds.; Springer International Publishing: Cham, Switzerland, 2016; pp. 681–689. ISBN 978-3-319-48228-6. [Google Scholar]
  10. Weckman, D.C.; Niessen, P. A Numerical Simulation of the D.C. Continuous Casting Process Including Nucleate Boiling Heat Transfer. Metall. Trans. B 1982, 13, 593–602. [Google Scholar] [CrossRef]
  11. Zhang, H.; Nagaumi, H.; Zuo, Y.; Cui, J. Coupled Modeling of Electromagnetic Field, Fluid Flow, Heat Transfer and Solidification during Low Frequency Electromagnetic Casting of 7XXX Aluminum Alloys. Mater. Sci. Eng. A 2007, 448, 189–203. [Google Scholar] [CrossRef]
  12. Hao, H.; Maijer, D.M.; Wells, M.A.; Cockcroft, S.L.; Sediako, D.; Hibbins, S. Development and Validation of a Thermal Model of the Direct Chill Casting of AZ31 Magnesium Billets. Metall. Mater. Trans. A 2004, 35, 3843–3854. [Google Scholar] [CrossRef]
  13. Chen, L.; Le, Q.; Zhao, D.; Jia, Y.; Bao, L.; Yan, J.; Hu, W. Study on Boiling Heat Transfer in Secondary Cooling Zone of DC Casting of Magnesium Alloy Based on Inverse Heat Conduction Method. Foundry 2022, 71, 432–436. [Google Scholar]
  14. Pioro, I.L.; Rohsenow, W.; Doerffer, S.S. Nucleate Pool-Boiling Heat Transfer. I: Review of Parametric Effects of Boiling Surface. Int. J. Heat Mass Transf. 2004, 47, 5033–5044. [Google Scholar] [CrossRef]
  15. Ali, K.; Amna, R.; Rashid, M.U.; Malik, M.I.; Kim, K. An Investigation of the Influence of Surface Roughness, Water Quality and Nozzle on Spray Cooling of Aluminum Alloy 6082. Therm. Sci. Eng. Prog. 2019, 10, 280–286. [Google Scholar] [CrossRef]
  16. Lee, J. Effects of Surface Roughness on Stagnation Heat Transfer of Impinging Liquid Jet on Metal Surface. J. Fluid Sci. Technol. 2010, 5, 64–74. [Google Scholar] [CrossRef] [Green Version]
  17. Park, C.W.; Cho, H.C.; Kang, Y.T. The Effect of Heat Transfer Additive and Surface Roughness of Micro-Scale Hatched Tubes on Absorption Performance. Int. J. Refrig.-Rev. Int. Froid 2004, 27, 264–270. [Google Scholar] [CrossRef]
  18. Liu, X.; Liu, J.; Xue, R.; Chen, L.; Hou, Y. Heat Transfer Optimization of R134a Phase Change Spray Cooling in a Closed Loop System. Exp. Therm. Fluid Sci. 2018, 92, 248–258. [Google Scholar] [CrossRef]
  19. Pais, M.; Chow, L.; Mahefkey, E. Surface-Roughness and Its Effects on the Heat-Transfer Mechanism in Spray Cooling. J. Heat Transf.-Trans. ASME 1992, 114, 211–219. [Google Scholar] [CrossRef]
  20. Zhang, L.Q.; Li, L.X.; Tan, W.F.; Xu, R. Inverse Heat Conduction Model for Determining Interfacial Heat Transfer Coefficient during Casting Solidification. Chin. J. Nonferrous Met. 2014, 24, 82–90. [Google Scholar]
  21. Bernardin, J.D.; Mudawar, I. Experimental and Statistical Investigation of Changes in Surface Roughness Associated with Spray Quenching. Int. J. Heat Mass Transf. 1996, 39, 2023–2037. [Google Scholar] [CrossRef]
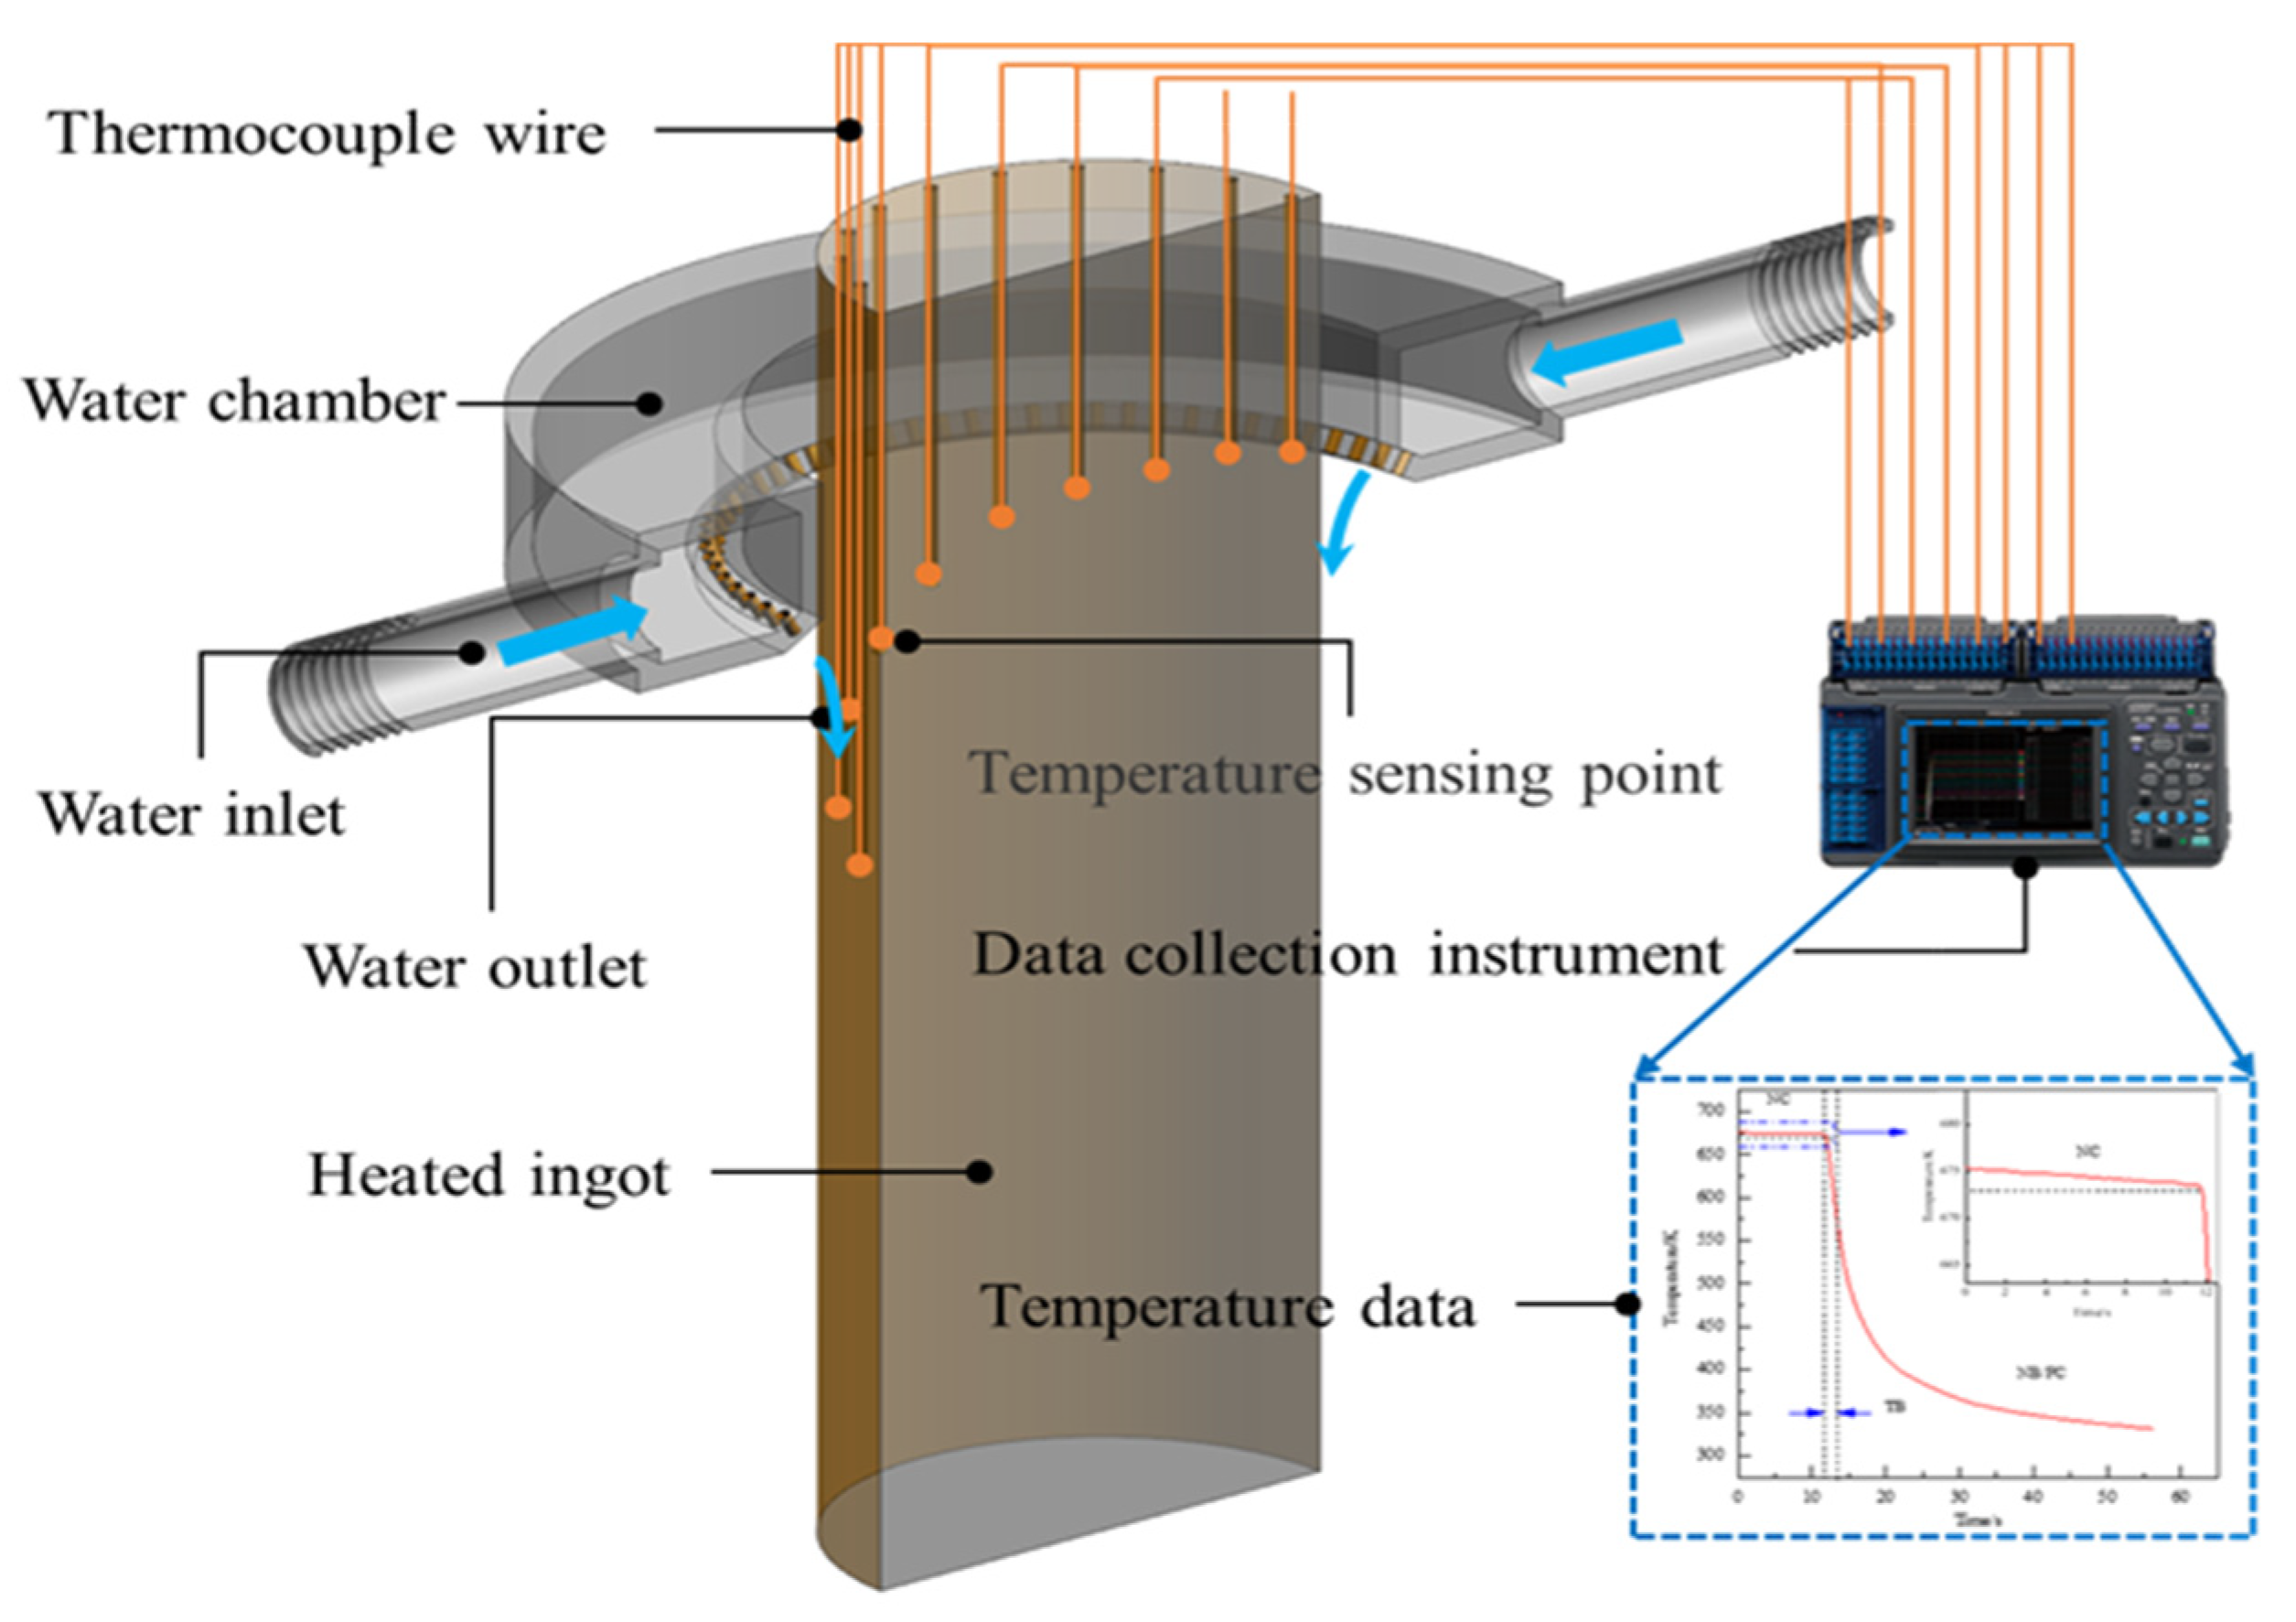
Figure 1. Schematic of DC spray rig and position of thermocouples.
Crystals 12 01571 g001
Figure 2. Flow chart of inverse heat conduction algorithm.
Crystals 12 01571 g002
Figure 3. Comparison between simulated temperature and experimental temperature in impingement zone (a) and free−falling zone (b).
Crystals 12 01571 g003
Figure 4. Comparison of boiling curves under the same condition, including HTC and heat flux in impingement zone (a,b) and free-falling zone (c,d).
Crystals 12 01571 g004aCrystals 12 01571 g004b
Figure 5. The relationship between HTC and surface temperature of ingot under different alloy types in the impingement zone (a) and the free−falling zone (b).
Crystals 12 01571 g005
Figure 6. Effect of alloy type on HTC in the impingement zone (a) and the free-falling zone (b).
Crystals 12 01571 g006
Figure 7. Effect of alloy type on heat flux in the impingement zone (a) and the free-falling zone (b).
Crystals 12 01571 g007
Figure 8. Critical heat flux (a) and thermal conductivity (b) of different alloys.
Crystals 12 01571 g008
Figure 9. 3D surface topography with different roughness: 1.08 μm (a), 59.39 μm (b), 80.47 μm (c), and 115 μm (d).
Crystals 12 01571 g009
Figure 10. The relationship between HTC and surface temperature of the ingot with different surface roughness in the impingement zone (a) and the free-falling zone (b).
Crystals 12 01571 g010
Figure 11. Effect of roughness ((a) < (b) < (c) < (d)) on density at bubble nucleation position.
Crystals 12 01571 g011
Figure 12. The relationship between HTC and roughness at the impingement zone, including regression analysis (a) and exponential mean value (b).
Crystals 12 01571 g012
Figure 13. The relationship between HTC and roughness at free−falling zone, including regression analysis (a) and exponential mean value (b).
Crystals 12 01571 g013
Table 1. Surface roughness parameters of AZ80 magnesium alloy.
RoughnessSample 1Sample 2Sample 3Sample 4Sample 5
Sa/μm1.0859.3980.4711555.31
Publisher’s Note: MDPI stays neutral with regard to jurisdictional claims in published maps and institutional affiliations.