Abstract
To investigate the melt flow field and inclusions movement in the cold hearth for the Ti-0.3Mo-0.8Ni alloy during electron-beam cold-hearth melting, a three-dimensional numerical model was established. By using solidification and discrete phase models, the information on the melt flow field and inclusions movement in the cold hearth were obtained. As the casting velocity increased, the melt flow velocity increased, the solid–liquid interface moved down. Inclusions with a density of 4.5 g/cm3 were the most difficult to remove. When the density of the inclusions was 3.5 g/cm3, the number of inclusions that escaped decreased with an increase in the inclusion diameter; these inclusions easily floated on the pool surface and remained in the cold hearth. Inclusions with a density of 5.5 g/cm3 have a similar escaping trend to the inclusions with a density of 3.5 g/cm3; as the diameter of these inclusions increased, gravity on these inclusions had a larger effect and caused them to sink more easily. Generally, for high and low density inclusions with a large diameter, the effect of density can be eliminated; the most effective method to remove inclusions in the metallurgical industry is to promote the polymerization and growth of the inclusions.
1. Introduction
Titanium is the fourth most abundant structural metal on Earth, with a content of about 0.6 % in the crust [1]. The most common forms found in nature are rutile (TiO2) and ilmenite (FeTiO3). The density of titanium and its alloys is about 60% of that of nickel or iron alloys, but their tensile strength is comparable; they also have great corrosion resistance in different environments [2].
The main problem limiting the wider use of titanium and its alloys is the high cost of its production. In the metallurgical industry, electron beam cold hearth melting (EBHM) is often used to produce titanium and titanium alloy ingots; this has an excellent ability to remove high and low density inclusions [3]. This device uses high-energy electron beams to scan the feedstock. The feedstock melts and flows into a cold hearth for refining and then into a crystallizer, where it solidifies and is removed under a high vacuum (Figure 1). Refining is a very important process. Some of the inclusions floating on the surface of the molten pool are melted by the high-energy electron beams and evaporated; some flow into the crystallizer, while others settle on the solidification shell during the cold hearth.
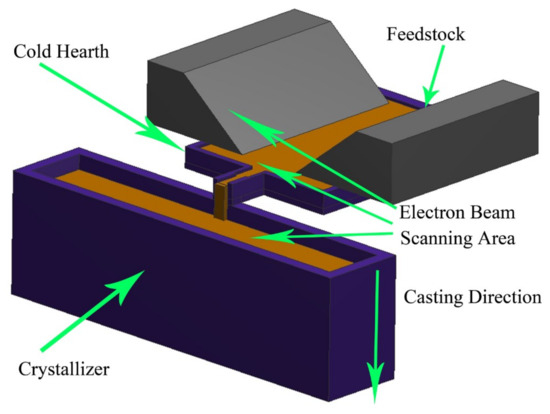
Figure 1.
Schematic of electron beam cold hearth melting (EBCHM).
The inclusions with their size, locations, and sources often affect the quality of titanium and its alloy products. With the development of computer technology, many scholars have gradually started using numerical simulations to study the behavior of the inclusions in the mold [4]. Li et al. [5] simulated the fractal profile of two-dimensional and three-dimensional inclusions by using the diffusion-limited aggregation (DLA) model of inclusion growth. Yu et al. [6] calculated the heat transfer, flow, solidification, and movement behavior of the inclusions in molds with different corner structures using mathematical models; they found that inclusions larger than 100 μm were removed easily. Lei et al. [7] used a solidification model and fluid flow coupled with the discrete phase model (DPM) to predict inclusions trapped in the solidification front of high-speed continuous casting slab and their distribution in the inner surface layer. Liu et al. [8,9] developed a DPM and used a Euler–Euler model to predict the quasi-four phases of argon-steel slag-air in a slab mold.
The Ti-0.3Mo-0.8Ni alloy is a near α alloy and has great properties, such as good welding property, crevice corrosion resistance, and excellent processing plasticity [10]. It is widely used in the chemical industry; its applications include being a crystallizer for salt production, plate brine coolers, heaters in the chlor-alkali industry, tubular reactors for the oxidizing acid tank, a reactor for the treatment of wastewater with high-chlorine content by using wet oxidation, and heat exchanger in treating strong corrosive and thermally concentrated chlorides [11]. Li et al. [12] studied the flow field motion and segregation of the Ti-0.3Mo-0.8Ni alloy in a crystallizer at different casting processes during EBCHM. Truong et al. [13] studied the effect of the electron beam scanning strategy in aluminum volatilization of Ti-6Al-4V during the cold hearth. Bellot et al. [14] used mathematical models to simulate the melting process of titanium in EBCHM and simulated the behavior of hard α inclusions in the melting process, including the dissolution trajectory and kinetics. Kroll-Rabotin et al. [15] investigated inclusion interactions in the plane shear flow, computing the fully resolved hydrodynamics at finite Reynolds numbers, using a lattice Boltzmann method with an immersed boundary method. In order to determine the collision efficiency, different initial conditions, different shear values, and different sizes of inclusions were studied.
The main research focus is the movement of inclusions during the cold hearth; the removal mechanism of different specifications of inclusions by cold hearth can be theoretically modeled and understood. A literature review found that the current study on the movement of inclusions and melt flow in cold hearth is still not involved for the Ti-0.3Mo-0.8Ni alloy during EBCHM; this study will systematically research the movement of inclusions in the cold hearth. The three-dimensional numerical model considers the melt flow field, solidification process, and inclusions movement of the Ti-0.3Mo-0.8Ni alloy; the DPM in ANSYS was used to quantitatively analyze the movement of inclusions in the cold hearth.
The purpose of this study was to analyze the melt flow field and inclusions movement in the cold hearth. Two main aspects were studied in detail: (1) the movement of different inclusions in the cold hearth and (2) the melt flow field of the cold hearth.
2. Mathematical Model
2.1. Assumptions
The conditions of the three-dimensional numerical model are simplified as follows:
- (1)
- All inclusions were treated as spheres.
- (2)
- The density and size of the inclusions were assumed to be constant.
- (3)
- The agglomeration, cracking, chemical reaction, and growth of the inclusions in the cold hearth were not considered.
- (4)
- Marangoni flow was neglected.
- (5)
- The density of the melt is a constant of 4.5 g/cm3.
2.2. Boundary Conditions and Computational Domain
To improve the calculation efficiency, only a half-symmetrical part of the cold hearth was selected for calculation [16]. A region of the cold hearth with a width of 200 mm and a length of 1570 mm was established. The computational domain consisted of 1.1 million hexahedron cells. In the previous work, the cell parameters of different sizes have been verified and found that the cell parameters in this work have met the requirements. For this model, the perfect 90° hexahedron cell is achieved, with an aspect ratio of 0.95, determinant value of 0.97, and cell quality value of 0.98. The boundary conditions of the model (Figure 2a) were the pool surface, sidewall, symmetry plane, inlet, and outlet. The type of inlet is “velocity inlet” with different casting velocities, and outlet is “outflow”; the value is obtained from the actual production experience of the factory and the setting of incompressible fluid in the model.
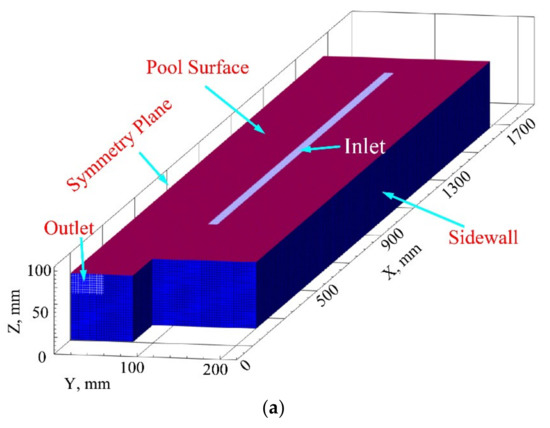
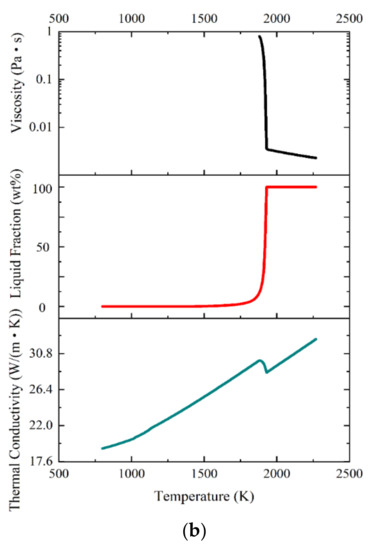
Figure 2.
(a) Boundary conditions of the numerical model and (b) physical properties of the Ti-0.3Mo-0.8Ni alloy used in the model.
The molten Ti-0.3Mo-0.8Ni alloy with inclusions flowed into the cold hearth from the inlet and flowed out of the calculation domain from the outlet. Due to the different sizes and densities of the inclusions, they potentially floated on the surface, flowed into the crystallizer, or were captured by the solidification shell of the cold hearth. The heat transfer coefficient of the water-cooled copper mold (the cold hearth) attached to the sidewall was 2000 W/(m2K) [12], and other forms of heat transfer are not considered.
The solution method in the software includes these components: the SIMPLEC scheme; the pressure–velocity coupling algorithm; and the discretization model with PRESTO pressure, third-order MUSCL, and Green-Gaussian cell-based gradients.
The iteration time step was 1 s until the calculation reached the steady state; streamlines of the inclusions in the cold hearth that tended to be in a stable state were selected for this study. By default, the software used a residual value to determine the convergence of the calculations.
2.3. Governing Equations
This model was coupled with the solidification of Ti-0.3Mo-0.8Ni alloy and DPM. Previous research [17,18] explained the necessity of the governing equations of mass conservation, energy conservation, and momentum conservation in the model, as shown by Equations (1)–(6). The mushy zone flow followed the enthalpy–porosity method for simulation [19]. The exact details regarding the models are found in the literature [20,21,22,23,24,25].
2.3.1. Mass Conservation
2.3.2. Momentum Conservation
Here, , and is the turbulent Reynolds stress.
Here, is the thermo-solutal buoyancy, represents the stress-tensor, is the static pressure, and is gravity. is the velocity components on three axes, is the coordinate value components on three coordinate axes, and is the unit tensor.
Here, represents the thermal-expansion coefficient, is the temperature, is the solutal-expansion coefficient, is the locally averaged concentration of the solute element in the melt, and is the momentum sink in the mushy zone, which has the following form:
where is the mushy zone constant, and represents the casting velocity.
2.3.3. Energy Equations
These are the basic equations of fluid mechanics above. Fluid mechanics studies the moving and static states of the fluid itself under the action of various forces, along with the interaction and flow when there is relative movement between the fluid and the solid boundary wall.
Additionally, a realistic model of Equations (7 and 8) was adopted, which was recommended in another study [26]; so far, this model has been widely used in engineering and accumulated the most experience. It has achieved basic success in many aspects. It is widely used for viscous simulations, compressible and incompressible fluid problems, and the external flow of complex geometry.
The turbulence kinetic energy is given by:
The turbulence energy dissipation rate is given by:
where is the generation of turbulence kinetic energy, is the turbulent dissipation rate, represents the generation of turbulence kinetic energy because of buoyancy, and is the contribution of fluctuating expansion to the total dissipation rate in the compressible turbulent flow. The turbulence model constants are:
2.3.4. Equations of Motion for Inclusions
The trajectory of the discrete inclusions was calculated by integrating the force balance; this is written in a Lagrangian reference frame. This kind of force balance equates the inclusion inertia with forces acting on the inclusions and is expressed as the following Equations (9)–(11):
where is an additional mass-force, is the drag force per unit inclusion mass, and
Here, is the inclusion relaxation time; is the inclusion velocity; is the viscosity of the melt; and represent the densities of the inclusion and melt, respectively; is the inclusion diameter; is the drag coefficient of inclusions; and is the inclusion Reynolds number, which was reported in other studies [27,28].
2.4. Physical Properties
The solidus and liquidus temperatures of the Ti-0.3Mo-0.8Ni alloy are 1860 and 1930 K. Figure 2b shows the thermophysical properties of Ti-0.3Mo-0.8Ni alloy; these include the thermal conductivity, liquid fraction, and viscosity. Combined with the actual production experience in the factory, normal inclusions have a diameter below 100 μm. For a quantitative analysis, the diameters of 10, 40, 70, and 100 μm and the densities of 3.5, 4.5, and 5.5 g/cm3 were studied. The casting process parameters used casting velocities of 2×10⁻⁴, 2.5 × 10⁻⁴, 3 × 10⁻⁴, and 3.5 × 10⁻⁴ m/s with a pouring temperature of 2273 K.
3. Results and Discussion
To study the movement of the inclusions in the cold hearth, the molten pool morphology was calculated. As shown in Figure 3a, the left side is the surface of the molten pool, and the right side is the internal slice of the molten pool, which shows the solid–liquid interface and the streamline of the melt. The streamline entered the cold hearth from the inlet, extended around, and then flowed out of the outlet. The farthest melt from the outlet had fewer streamlines and poor melt fluidity. Combined with Figure 3b, it can best reflect the characteristics of a molten pool and can also visually compare the differences of molten pool morphology under different casting process parameters, as can be seen from the cross-section of the molten pool, two parts below the inlet were the deepest, and the symmetry plane was relatively shallow; this caused the molten pool to appear W-shaped. The velocity field of the melt is analyzed in detail below. These factors affected the movement of the inclusions.
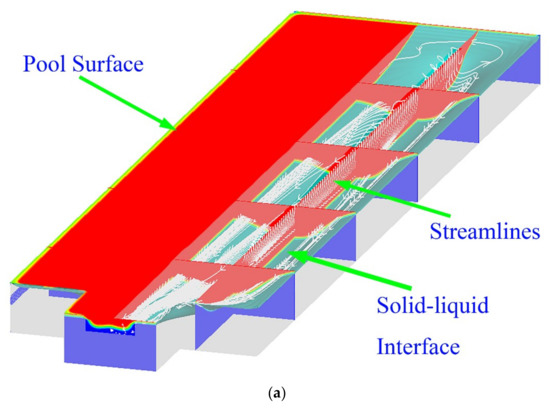
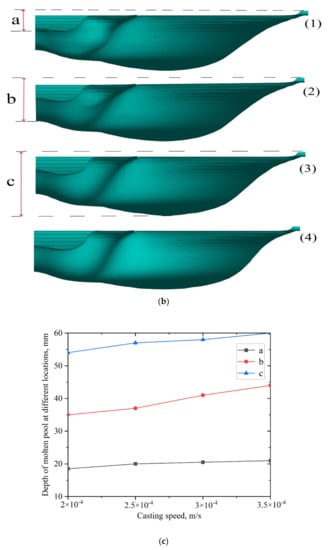
Figure 3.
(a) Diagram of cold hearth for the pool surface, solid–liquid interface, and streamlines. (b) Contours of the solid–liquid interface at casting velocities of (1) 2 × 10⁻⁴ m/s, (2) 2.5 × 10⁻⁴ m/s, (3) 3 × 10⁻⁴ m/s, and (4) 3.5 × 10⁻⁴ m/s with a pouring temperature of 2273 K. Here, (a) is the deepest location below the inlet, (b) is the deepest location on the symmetry plane, and (c) is the deepest location on the outlet. (c) Depth of the molten pool at (a) the deepest location below the inlet, (b) the deepest location on the symmetry plane, and (c) the deepest location on the outlet.
3.1. Effect of Casting Velocities on the Solid–Liquid Interface
The influence of different casting velocities on the profile of the molten pool was studied. Figure 3b shows the molten pool morphology in four states using casting velocities of 2 × 10⁻⁴, 2.5 × 10⁻⁴, 3 × 10⁻⁴, and 3.5 × 10⁻⁴ m/s with a pouring temperature of 2273 K. The depth values of the three characteristic positions were studied to quantitatively analyze and determine the influence of casting velocity on the molten pool. These three characteristic positions are the deepest locations below the inlet, on the symmetry plane, and on the outlet (Figure 3b). The specific values for these depths are shown in Figure 3c. The depth of the molten pool increased with an increase in the casting velocity, and the solid–liquid interface gradually moved down.
3.2. Effect of Casting Velocities on the Flow Field
By studying the influence of casting velocity on the profile of the molten pool, it was determined that the cold hearth was sensitive to velocity. To study the effect of the flow field on the cold hearth, the state of the cold hearth’s velocity field was varied using casting velocities of 2 × 10⁻⁴, 2.5 × 10⁻⁴, 3 × 10⁻⁴, and 3.5 × 10⁻⁴ m/s with a pouring temperature of 2273 K (Figure 4a). With an increase in the casting velocity, the surface velocity and the velocity inside the molten pool gradually increased. The velocity magnitude near the outlet was noticeably higher than those of the other positions in the cold hearth. A lower velocity magnitude with poorer fluidity and stirring effect of the melt was observed as the distance from the outlet increased; this was more likely to produce defects such as segregation.
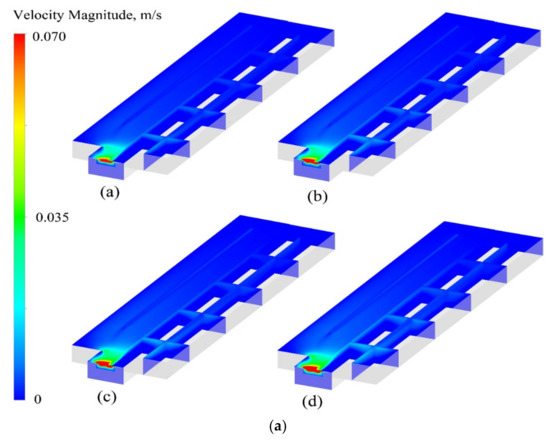
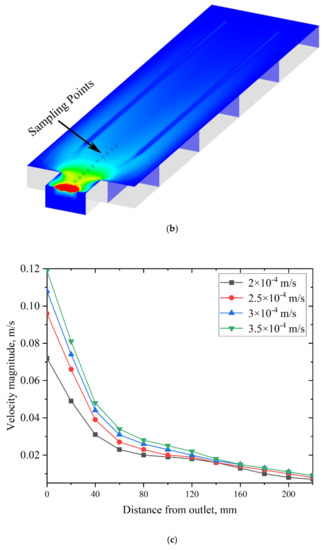
Figure 4.
(a) Contours of the velocity magnitude at casting velocities of (a) 2 × 10⁻⁴, (b) 2.5 × 10⁻⁴, (c) 3 × 10⁻⁴, and (d) 3.5 × 10⁻⁴ m/s with a pouring temperature of 2273 K. (b) The sampling points at the symcenter on the contour of the velocity magnitude. (c) Velocity magnitudes of sampling points at casting velocities of 2 × 10⁻⁴, 2.5 × 10⁻⁴, 3 × 10⁻⁴, and 3.5 × 10⁻⁴ m/s with a pouring temperature of 2273 K.
To show the trend of the velocity magnitude more intuitively (Figure 4b), an area with a length of 220 mm was selected on the surface of the cold hearth, and 12 sampling points were evenly selected. A line chart was created showing the relationship between the velocity magnitude and the distance of these sampling points (Figure 4c). As the cast velocity increased, the velocity on the surface of the cold hearth increased. When the distance was between 0 and 60 mm away from the outlet, the velocity dropped rapidly. When the distance was between 60 to 120 mm away from the outlet, the velocity decreased more slowly.
3.3. Influence of Different Casting Velocities and Inclusion Specifications on the Trajectory of Inclusions
The trajectory of inclusions with densities of 3.5, 4.5, and 5.5 g/cm3, and diameters of 10, 40, 70, and 100 μm at different casting velocities with a pouring temperature of 2273 K are shown in Figure 5. All these inclusions were enumerated and then classified according to different statistical methods. To study the movement behavior of the inclusions in the cold hearth, 20 inclusions were selected and flowed evenly into the cold hearth from the entrance; the reason why 20 inclusions were selected to be injected into the melt here is that this number of inclusions can fully reflect the movement law, and the trajectory is also clear, which is convenient for statistics. If the number of inclusions is higher, there will be a large number of trajectory coincidence, which is not conducive to statistics. By obtaining the flow trajectory of the inclusions, the trends of removing various inclusions in the cold hearth were shown, providing theoretical guidance for the actual production of the Ti-0.3Mo-0.8Ni alloy.
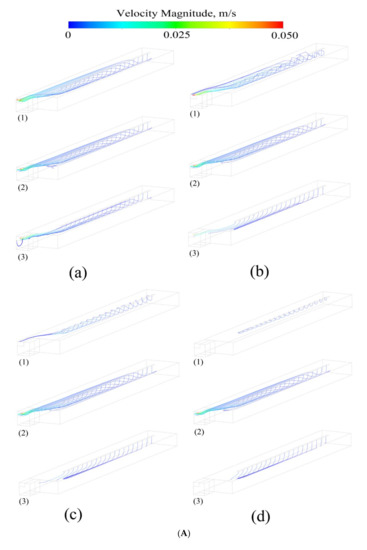
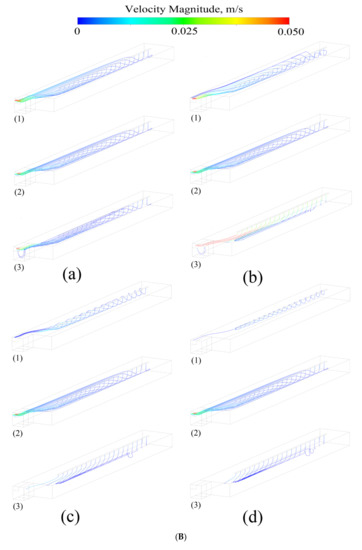
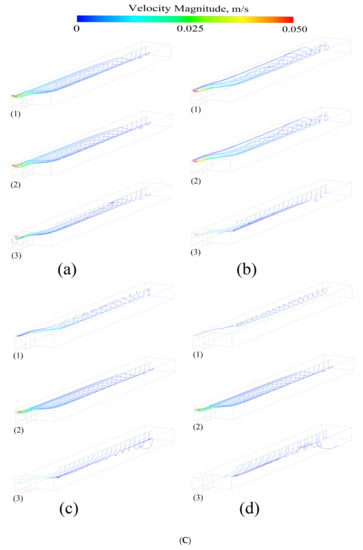
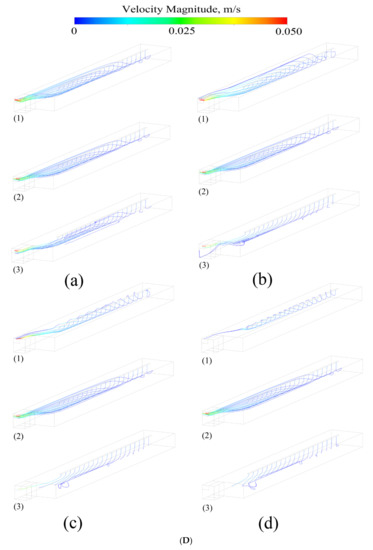
Figure 5.
(A) The trajectory of inclusions with densities of (1) 3.5, (2) 4.5, and (3) 5.5 g/cm3 and diameters of (a) 10, (b) 40, (c) 70, and (d) 100 μm at a casting velocity of 2 × 10⁻⁴ m/s with a pouring temperature of 2273 K. (B) The trajectory of inclusions with densities of (1) 3.5, (2) 4.5, and (3) 5.5 g/cm3 and diameters of (a) 10, (b) 40, (c) 70, and (d) 100 μm at a casting velocity of 2.5 × 10⁻⁴ m/s with a pouring temperature of 2273 K. (C) The trajectory of inclusions with densities of (1) 3.5, (2) 4.5, and (3) 5.5 g/cm3 and diameters of (a) 10, (b) 40, (c) 70, and (d) 100 μm at a casting velocity of 3 × 10⁻⁴ m/s with a pouring temperature of 2273 K. (D) The trajectory of inclusions with densities of (1) 3.5, (2) 4.5, and (3) 5.5 g/cm3 and diameters of (a) 10, (b) 40, (c) 70, and (d) 100 μm at a casting velocity of 3.5 × 10⁻⁴ m/s with a pouring temperature of 2273 K.
The velocity information of the different types of inclusions is shown in Figure 5. Except those floating on the surface or deposited on the cold hearth, almost all other inclusions will increase their moving velocity with the melt flow. The trajectory of these inclusions was counted, the number of inclusions escaping from the outlet was quantitatively analyzed and compared, and the movement trend of inclusions was obtained.
3.4. The Escape Trend of Inclusions under Different Influencing Factors
To study the movement of different types of inclusions in the cold hearth, the escape quantity of inclusions was quantitatively analyzed. Figure 6A shows the number of inclusions escaping from the outlet with different diameters and densities at casting velocities of 2 × 10⁻⁴ m/s, 2.5 × 10⁻⁴, 3 × 10⁻⁴, and 3.5 × 10⁻⁴ m/s with a pouring temperature of 2273 K. The inclusions with a density of 4.5 g/cm3 were very difficult to remove, because this density was close to that of the Ti-0.3Mo-0.8Ni alloy; therefore, it was easy to suspend in the melt and drift with the current. As the diameter of the inclusions with a density of 3.5 g/cm3 increased, the number of escaped inclusions decreased and remained in the cold hearth; since the density was lower, the larger diameter inclusions tended to float on the surface of the cold hearth. The inclusions with a density of 5.5 g/cm3 had a similar escaping trend to those with a density of 3.5 g/cm3. Due to the increase in the diameter of the inclusions with a density of 5.5 g/cm3, the gravity on these inclusions had a larger effect and caused them to sink more easily. As the casting velocity increased, the same trends were shown.
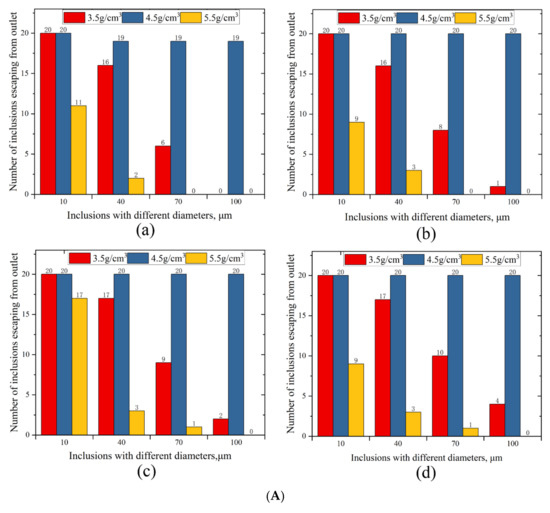
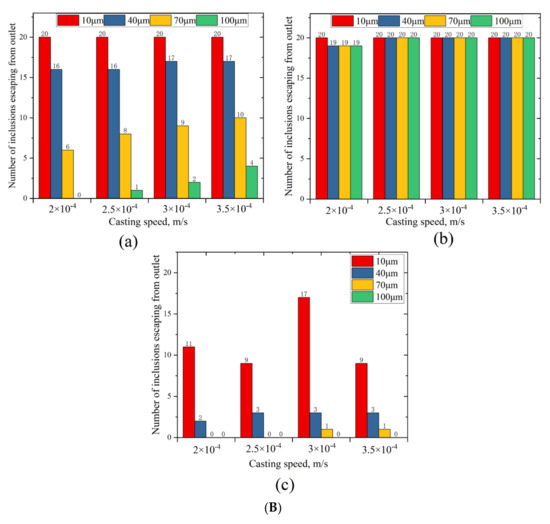
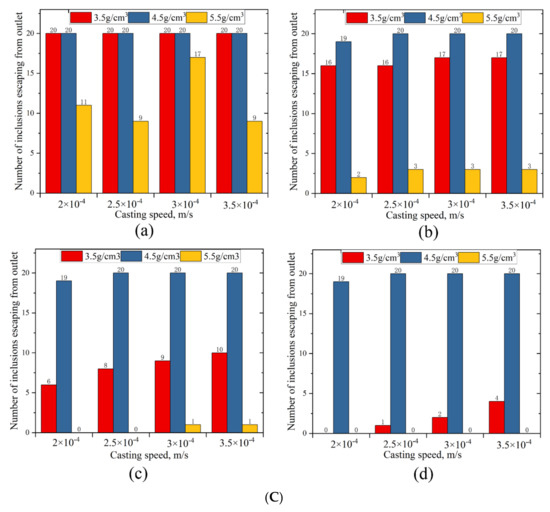
Figure 6.
(A) Number of inclusions escaping from the outlet with different diameters and densities at casting velocities of (a) 2 × 10⁻⁴, (b) 2.5 × 10⁻⁴, (c) 3 × 10⁻⁴, and (d) 3.5 × 10⁻⁴ m/s with a pouring temperature of 2273 K. (B) Number of inclusions escaping from the outlet with different diameters and casting velocities at densities of (a) 3.5, (b) 4.5, and (c) 5.5 g/cm3 with a pouring temperature of 2273 K. (C) Number of inclusions escaping from the outlet with different densities and casting velocities at diameters of (a) 10, (b) 40, (c) 70, and (d) 100 μm with a pouring temperature of 2273 K.
The number of inclusions at a density of 3.5 g/cm3 escaping the outlet with different casting velocities and diameters is shown in Figure 6B(a). As the diameter of the inclusions increased, the number of inclusions escaping gradually decreased; since the density was lower, the larger diameter inclusions tended to float on the surface of the cold hearth. However, as the casting velocity was increased, the number of escaped inclusions with diameters of 40, 70, and 100 μm showed a slight increase; as both the diameter of the inclusion and the casting velocity were increased, the flow force on the inclusion increased weakly causing this slight increase. The inclusions with a density of 4.5 g/cm3 were difficult to remove at all diameters and casting velocities (Figure 6B(b)). When the density was 5.5 g/cm3, the removal effect for inclusions with a diameter of 10 μm was typical; the removal of the inclusions with diameters of 40, 70, and 100 μm was optimal, because as the diameter increased, the gravity effect was greater, and they tended to sink.
Almost all of the inclusions with a diameter of 10 μm and a density of 3.5 g/cm3 escaped. For inclusions with a density of 3.5 g/cm3 and diameters of 40, 70, and 100 μm, as the casting velocity increased, the number of inclusions that escaped gradually increased, and the removal effect gradually became worse. With the increase in the diameter of the inclusion, the number of inclusions with densities of 3.5 and 5.5 g/cm3 that escaped continuously decreased. The large diameter inclusions were removed more effectively, especially for the inclusions with a large diameter and large density.
4. Conclusions
The melt flow field and inclusions movement in the cold hearth for the Ti-0.3Mo-0.8Ni alloy were investigated by a three-dimensional model. The results of this study have highly significant outcomes for the production of a high-quality Ti-0.3Mo-0.8Ni alloy.
According to our calculations, the solid–liquid interface of the cold hearth appeared W-shaped. The depth of the molten pool increased with an increase in casting velocity, and the solid–liquid interface gradually moved down.
With an increase in the casting velocity, the melt velocity inside and the velocity on the surface of the cold hearth increased. From the outlet to about 60 mm away from the outlet, the velocity decreased rapidly, and then, after 60 mm, it decreased more slowly. The solidification shell collected the inclusions precipitated in the melt.
The moving trajectories of the various inclusions in the cold hearth were obtained and used to determine the removal effect of the inclusions. The study found that the inclusions with densities of 4.5 g/cm3 were exceedingly difficult to remove at all diameters and casting velocities. As the diameter of the inclusions with a density of 3.5 g/cm3 increased, the number of inclusions that escaped decreased; they floated on the pool surface and remained in the cold hearth. Almost all of the inclusions with a diameter of 10 μm and a density of 3.5 g/cm3 escaped. As the casting velocity increased for the inclusions with a density of 3.5 g/cm3 and diameters of 40, 70, and 100 μm, the removal effect gradually became worse.
The inclusions with a density of 5.5 g/cm3 have a similar escaping trend as inclusions with a density of 3.5 g/cm3; as the diameters increased, the gravity of inclusions became larger and caused them to sink more easily. For inclusions with a diameter of 10 μm, the removal effect was typical; the removal effect for inclusions with diameters of 40, 70, and 100 μm was optimal at the various casting velocities. In general, high- and low-density inclusions with large diameters were easier to remove and improved the removal efficiency of the inclusions. Suitable measures should be taken to promote the growth and polymerization of inclusions in metallurgical production.
Author Contributions
Methodology, X.L.; formal analysis, W.X.; writing—original draft preparation, Z.Z.; writing—review and editing, R.Z.; project administration, Z.L.; funding acquisition, R.Z. All authors have read and agreed to the published version of the manuscript.
Funding
This work was supported by the Major Science and Technology Projects of Yunnan Science and Technology Plan (No. 202002AB080001) and Science and Technology Major Project of Yunnan Province (No. 202202AG050007).
Data Availability Statement
Not applicable.
Conflicts of Interest
The authors declare no conflict of interest.
References
- Lutjering, G.; Williams, J.C. Titanium; Springer: New York, NY, USA, 2003. [Google Scholar]
- Shuster, R.E. Modeling of Aluminum Evaporation during Electron Beam Cold Hearth Melting of Titanium Alloy Ingots; University of British Columbia: Vancouver, BC, Cannada, 2017. [Google Scholar]
- Harker, H.R. Experience with large scale electron beam cold hearth melting (EBCHM). Vacuum 1990, 41, 2154–2156. [Google Scholar] [CrossRef]
- Santis, M.D.; Ferretti, A. Thermo-fluid-dynamics modeling of the solidification process and behaviour of nonmetallic inclusions in the continuous casting slabs. ISIJ Intern. 1996, 36, 673–680. [Google Scholar] [CrossRef][Green Version]
- Li, H.; Wen, J.; Zhang, J.M.; Wang, X.H.; Yasushi, S.; Mitsutaka, H. Simulation on cluster-agglomeration of inclusions in molten steel with DLA model. J. Univ. Sci. Technol. Beijing 2006, 28, 343–347. [Google Scholar]
- Yu, S.; Long, M.J.; Zhang, M.Y.; Chen, D.F.; Xu, P.; Duan, H.M.; Yang, J. Effect of mold corner structures on the fluid flow, heat transfer and inclusion motion in slab continuous casting molds. J. Manuf. Process. 2021, 68, 1784–1802. [Google Scholar] [CrossRef]
- Lei, S.W.; Zhang, J.M.; Zhao, X.K.; Dong, Q.P. Study of molten steel flow and inclusions motion behavior in the solidification processes for high speed continuous casting slab by numerical simulation. Trans. Indian Inst. Met. 2016, 69, 1193–1207. [Google Scholar] [CrossRef]
- Liu, Z.Q.; Sun, Z.B.; Li, B.K. Modeling of quasi-four-phase flow in continuous casting mold using hybrid Eulerian and Lagrangian approach. Metall. Mater. Trans. B Process Metall. Mater. Process. Sci. 2017, 48, 1248–1267. [Google Scholar] [CrossRef]
- Liu, Z.Q.; Li, B.K.; Jiang, M.F.; Tsukihashi, F. Euler-Euler-Lagrangian modeling for two-phase flow and particle transport in continuous casting mold. ISIJ Int. 2014, 54, 1314–1323. [Google Scholar] [CrossRef]
- Yuan, X.L. Editorial Board of China Aeronautical Materials Manual; Standards Press of China: Beijing, China, 2002. [Google Scholar]
- Li, Z.C. Research, Production and Application of Ti-0.3Mo-0.8Ni Alloy Abroad. Rare Met. Mater. Eng. 1984, 5, 75–81. [Google Scholar]
- Zhu, Z.Z.; Li, X.M.; Zhou, R.F.; Huang, H.G.; Xiong, W.T.; Li, Z.L. Numerical simulation of molybdenum and nickel distribution in large-scale slab ingots of Ti-0.3 wt.% Mo-0.8 wt.% Ni alloys during electron beam cold hearth melting. JOM 2022, 74, 3811–3820. [Google Scholar] [CrossRef]
- Truong, V.D.; Hyun, Y.T.; Won, J.W.; Lee, W.J.; Yoon, J.H. Numerical Simulation of the Effects of Scanning Strategies on the Aluminum Evaporation of Titanium Alloy in the Electron Beam Cold Hearth Melting Process. Materials 2022, 15, 820. [Google Scholar] [CrossRef]
- Bellot, J.P.; Ablitzer, D.; Hess, E. Aluminum volatilization and inclusion removal in the electron beam cold hearth melting of Ti alloys. Metall. Mater. Trans. B 2000, 31, 845–854. [Google Scholar] [CrossRef]
- Kroll-Rabotin, J.S.; Gisselbrecht, M.; Ott, B.; May, R.; Fröhlich, J.; Bellot, J.P. Multiscale simulation of non-metallic inclusion aggregation in a fully resolved bubble swarm in liquid steel. Metals 2020, 10, 517. [Google Scholar] [CrossRef]
- Li, J.; Wu, M.H.; Ludwig, A. Simulation of macrosegregation in a 2.45-ton steel ingot using a three-phase mixed columnar-equiaxed model. Int. J. Heat Mass Transf. 2014, 72, 668–679. [Google Scholar] [CrossRef]
- Chen, H.B.; Long, M.J.; Chen, D.F.; Liu, T.; Duan, H.M. Numerical study on the characteristics of solute distribution and the formation of centerline segregation in continuous casting slab. Int. J. Heat Mass Transf. 2018, 126, 843–853. [Google Scholar] [CrossRef]
- Bennon, W.D.; Incropera, F.P. A continuum model for momentum, heat and species transport in binary solid-liquidphase change systems. Int. J. Heat Mass Transf. 1987, 30, 2161–2170. [Google Scholar] [CrossRef]
- Brent, A.D.; Voller, V.R.; Reid, K.J. Enthalpy-porosity technique for modeling convection-diffusion phase change: Application to the melting of a pure metal. Numer. Heat Transf. 1988, 13, 297–318. [Google Scholar]
- Hirt, C.W.; Nichols, B.D.; Hotchkiss, R.S. Volume of fluid (VOF) method for the dynamics of free boundaries. J. Comput. Phys. 1981, 39, 201–225. [Google Scholar] [CrossRef]
- Launder, B.E.; Spalding, D.B. The numerical computation of turbulent flows. Comput. Methods Appl. Mech. Eng. 1974, 3, 269–289. [Google Scholar] [CrossRef]
- Voller, V.R.; Prakash, C. A fixed-grid numerical modeling methodology for convection-diffusion mushy region phase change problems. Int. J. Heat Mass Transf. 1987, 30, 1709–1720. [Google Scholar] [CrossRef]
- Thomas, B.G.; Yuan, Q.; Sivaramakrishnan, S.; Shi, T.B.; Vanka, S.P.; Assar, M.B. Comparison of four methods to evaluate fluid velocities in a continuous Slab casting mold. ISIJ Int. 2001, 41, 1262–1271. [Google Scholar] [CrossRef]
- Waheed, M.A.; Nzebuka, G.C. Investigation of macrosegregation for different dendritic arm spacing, casting temperature, and thermal boundary conditions in a direct-chill casting. Appl. Phys. A 2020, 126, 725. [Google Scholar] [CrossRef]
- Zhao, X.K.; Reilly, C.; Yao, L.; Maijer, D.M.; Cockcroft, S.L.; Zhu, J. A three-dimensional steady state thermal fluid model of jumbo ingot casting during electron beam re-melting of Ti-6Al-4V. Appl. Math. Model. 2014, 38, 3607–3623. [Google Scholar] [CrossRef]
- Nzebuka, G.C.; Ufodike, C.O.; Egole, C.P. Influence of various aspects of low-Reynolds number turbulence models on predicting flow characteristics and transport variables in a horizontal direct-chill casting. Int. J. Heat Mass Transf. 2021, 179. [Google Scholar] [CrossRef]
- Zhao, J.J. Numerical simulation of inclusion movement in the continuous casting slab mold. In Proceedings of the International Symposium On Clean Steel, Beijing, China, 17 September 2008. [Google Scholar]
- Li, A.; Ahmadi, G. Dispersion and deposition of spherical particles from point sources in a turbulent channel flow. Aerosol Sci. Technol. 1992, 16, 209–226. [Google Scholar] [CrossRef]
Publisher’s Note: MDPI stays neutral with regard to jurisdictional claims in published maps and institutional affiliations. |
© 2022 by the authors. Licensee MDPI, Basel, Switzerland. This article is an open access article distributed under the terms and conditions of the Creative Commons Attribution (CC BY) license (https://creativecommons.org/licenses/by/4.0/).