Abstract
Under quasi-steady particle pushing conditions in an alloy, fresh liquid has to flow to the gap separating a particle and an advancing solid–liquid interface of a crystal to feed the volume change associated with the liquid–solid phase transformation. In the meantime, solute rejected by the growing crystal has to diffuse out of the gap against the physical feeding flow. An inequality equation was derived to estimate the pushing-to-engulfment transition (PET) velocity of the crystal under which the particle is pushed by the growing crystal. Experiments were performed in an Al-4.5 wt.%Cu-2 wt.% TiB2 composite under isothermal coarsening conditions. TiB2 particles were indeed engulfed by the growing aluminum dendrites as predicted using the inequality equation. Predictions of the inequality equation also agreed reasonably well with literature data from the solidification of distilled water containing particles obtained under minimal convection conditions. The inequality equation suggests that the PET velocity is much smaller in a binary alloy than that in a pure material. Without the influence of fluid flow or other factors that put a particle in motion in the liquid, the particle should be engulfed by the growing crystal in alloys solidified under normal cooling rates associated with convectional casting conditions.
1. Introduction
A great deal of work has been published concerning the interaction of insoluble particles with an advancing solid–liquid interface [1,2,3,4,5,6,7] owing to its importance in various fields, including the processing of composites (metal matrix or polymer matrix) [8,9], preservation of biological materials [10], and freezing of soils [11,12]. It has been generally recognized that certain types of particles are pushed by the solid–liquid interface advancing at small velocities. There is a critical growth velocity, VC, or pushing-to-engulfment transition (PET) velocity, above which a particle ceases to be pushed but is engulfed in the growing crystal. Engulfment likely leads to a uniform distribution of particles within a solid crystal, while pushing results in particle segregation in the solidified material.
The PET velocity has been defined in various forms [1,2,3,4,5,6,7], but generally, it is proportional to the difference in interfacial energies, Δσ, of the particle/material system, the minimum separation between the particle and the advancing solid–liquid interface, h, and the reciprocal of particle radius, R. For discussion purpose, VC can be written as:
where α is a constant with a value of 1, 3/2, or 4/3 from various models [1,2,4], and Δσ is defined as:
Equation (2) is proposed based on interfacial energy interactions [1,2,4], suggesting that when the solid–particle interfacial energy, σSP, is greater than the sum of the solid–liquid interfacial energy, σSL, and the particle–liquid interfacial energy, σPL, a repulsive force arises that acts on the particle as the solid–liquid interface approaches the particle within h. Analytical models in the form of Equation (1) predict that, for a 2-µm particle satisfying Equation (2) in a pure material, VC is in the order of a few micrometers per second, which is in general agreement with experimental observation, but the h value has to be altered in order to fit experimental data [13].
In an alloy or in a pure material where impurity has to be considered, the boundary conditions at the advancing solid–liquid interface become too complicated to obtain simple analytical solutions on VC. Pötschke and Rogge [6] developed a numerical model to describe the influence of solute content on VC. Kao et al. [6] presented a more rigorous numerical model for the capturing of a foreign particle by an advancing solid–liquid interface in binary alloys. These models predict that VC is in the form:
where G is the temperature gradient, C0 is the alloy composition, and β and ε are positive constants in the range of 0–1 [4,6,7]. The values of α, β, and ε are affected by Δσ [7]. VC in a binary alloy can be orders of magnitude smaller than that in a pure material [7]. One issue with the numerical models is the lack of accurate data for Δσ, especially when a solute is enriched in the thin gap between the particle and the advancing solid–liquid interface. Interface interactions related to Δσ define the morphology of the solid–liquid interface beneath the particle and the resultant h, which, in turn, affects the force balance during particle pushing.
A major drawback in the numerical models is associated with the length scales of h and that of interface morphology. The repulsive force is related to the van der Waals forces, which become substantial when h is in the order of a few atomic diameters. In most binary alloys, the first solid crystal precipitating from a liquid usually consists of a non-faceted phase. The solid–liquid interface of such a non-faceted crystal is only a few atoms thick and is zigzag at the nanoscale. This means that the minimum separation, h, is in the same order of interface roughness at the nanoscale level and should vary from atom to atom substantially. However, numerical models so far developed have been focusing on calculating a macroscopically smooth solid–liquid interface and a resultant constant h using rigorous macroscopic boundary conditions. Consequently, these models may not be meaningful in describing the van der Walls forces since the h value cannot be obtained simply by solving the macroscopic diffusion equations. It is noted that numerical models predict that particle pushing occurs when the depth of a depression on the solid–liquid interface is around 0.8–1.2R [7]. Such s deep depression on the advancing solid–liquid interface during steady-state particle pushing has not yet been observed experimentally. Much sophisticated theoretical work involving multi-length scale modeling is required to describe particle pushing.
Experimental validation of model prediction yielded conflicting results. The predicted VC is in the order of a few micrometers per second in a pure material [1,2,3,4,5,6,7] and orders of magnitude smaller than that in alloys [6,7]. Such a VC is much smaller than the average growth rates of solid solidified under normal casting conditions. As a result, particles should have been engulfed by the growing solid during the normal solidification of composite materials. Experimental data on particle pushing during dendritic solidification in metal matrix composites do not support theoretical predictions [14,15,16,17,18]. Instead of being engulfed, particles are actually pushed by dendrites growing at rates a few orders of magnitude greater than predicted [14,15,16,17,18,19]. In fact, except for particles that nucleate the growing solid phase, i.e., a particle that exists in the center of a growing grain, there is a lack of convincing experimental observation conforming that particles being actually engulfed within a dendrite arm under cooling conditions, so far tested regardless of Δσ being positive [14,15] or negative [17,18,19]. Obviously, convection in liquid plays a significant role in particle pushing [20,21,22]. However, convection or mechanical disturbance in the melt has been difficult to avoid in most of the experiments performed so far.
Engulfment of insoluble particles by advancing solid–liquid interface is still not fully understood owing to the deficiencies both in modeling and in experiments described above. The purpose of this work was to examine the effect of solute on particle pushing/engulfment in an alloy under convection-less conditions. Simple analytical equations were derived considering only the first-order phenomena governing particle pushing so that the boundary conditions do not need to be as rigorous as that used in numerical modeling [6,7,23,24]. A unique experimental method, which minimized convection and mechanical disturbance, was designed to capture particles within dendrite arms. These simple equations can be used for estimating VC in binary alloys without using interfacial energies. The method can be used for observing the capturing of particles by an advancing solid–liquid interface under convection-less conditions.
2. Analysis on the Pet Velocity
As shown in Figure 1, a depression should be gradually formed on a growing dendrite arm as the arm approaches an insoluble foreign particle. The existence of the particle in the vicinity of the dendrite arm will certainly affect solute diffusion ahead of the advancing solid–liquid interface of the arm. In the gap between the particle and the solid–liquid interface, solute rejected by the growing dendrite arm is difficult to be transferred out of the gap. The enrichment of solute in the gap decreases the local melting temperature if the partition coefficient of the solute element, k, is smaller than one. As a result, the solid–liquid interface under the gap will be concave, forming a depression on the dendrite arm to allow the particle to dwell. Such type of depression formation has been confirmed by Sen et al. [25] in molten aluminum by means of X-ray imaging.
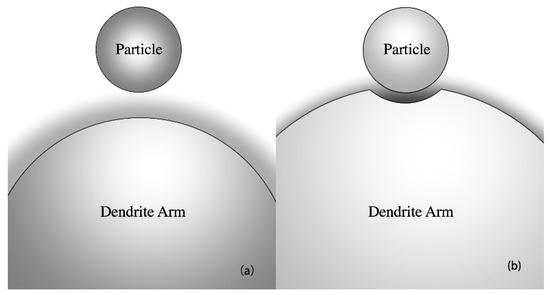
Figure 1.
Schematic illustration showing (a) as a particle is approached by an advancing solid–liquid interface of a dendrite arm, (b) a depression is formed on the growing dendrite arm if k < 1. The shade indicates the solute field ahead of the solid–liquid interface of the dendrite arm. The solute concentration is illustrated as proportional to the darkness of the shade.
Consider the condition of quasi-steady particle pushing, i.e., a particle that dwells on an advancing solid–liquid interface advancing at a constant rate is pushed steadily by the solid–liquid interface over a certain distance [1]. In order to push the particle under such conditions, fresh liquid has to constantly flow into the gap and freeze on the growing solid. At the same time, in an alloy, the solute must diffuse against this physical flow at a rate sufficient to prevent being built up in the gap.
Figure 2 depicts the temperature and solute fields in the vicinity of the solid–liquid interface. Following Pötschke and Rogge [6], the balance of mass and solute under steady-state conditions in the gap region can be described. At any point in the gap shown in Figure 2, the mass of liquid, ML, flowing into the gap per unit of time is:
where VL is the flow rate, ρL is the density of the liquid, and θ is the angle shown in Figure 2.
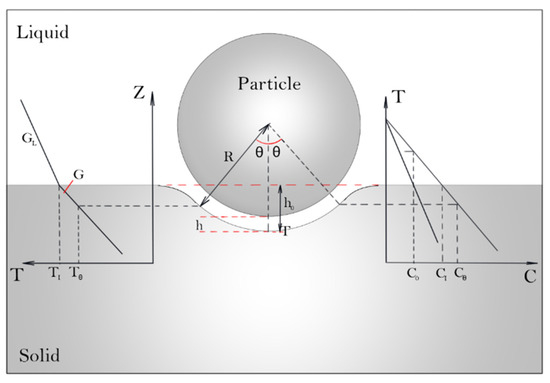
Figure 2.
Schematic illustration of the temperature and solute fields in the gap between a particle and an advancing solid–liquid interface.
The mass of liquid, ML, which is transformed into solid growing at a velocity, VS, per unit of time in the region defined by any θ is:
where ρS is the density of the solid. Mass balance defined by equating Equations (4) and (5) gives:
Ignoring the solute entering the growing solid, one can write the solute balance equation at any location in the gap as [5]:
Under directional solidification conditions, the temperature field is fixed so the temperature distribution can be estimated using:
where G is the temperature gradient in the solid, TI is the temperature at the planar solid–liquid interface far away from the particle, and Z is the vertical distance from any point in the solid to the planar solid–liquid interface.
The relationship between solute and temperature on a phase diagram is described by the phase diagram of the alloy system. For an alloy with a diluted solute content, the liquidus slope, m, on the phase diagram is usually a constant. The change in temperature is related to the change in composition by:
Under steady-state growth conditions and ignoring the kinetic growth undercooling, the temperature, TI, at the planar solid–liquid interface far away from the particle is:
where C0 is the bulk solute content, T0 is the liquidus temperature of the alloy, and k is the partition coefficient. The composition at the liquid side of the planar solid–liquid interface is:
Assuming that the depression shown in Figure 2 has a constant radius, a, the temperature at any given θ is:
where ∆Ta is curvature undercooling and ∆TK is kinetic undercooling. Under the assumption of a constant gap radius, ∆Ta and ∆TK are constants in the gap region. The temperature difference between θ0 and θ in the gap region can be calculated in the following equation by either using Equation (9) or Equation (12).
Combining Equations (8) and (12), one can write the vertical distance, ∆Z, between θ0 and θ in the gap as:
i.e.,
Let the depth of the depression be h0, the vertical distance from the planar solid–liquid interface to the center of the particle is R-h0, as shown in Figure 2, and the edge of the planar interface neighboring the gap is the location corresponding to θ0. At any given θ, the vertical distance from the point corresponding to θ in the gap to the planar interface is given by:
Combining Equations (15) and (16) gives:
where
Differentiating Equation (17) gives:
Substituting Equations (17) and (19) into Equation (7) yields:
Combining Equations (6), (11) and (20) gives:
Considering mass balance at the entrance of the gap where:
and ignoring h in the R + h and R + h/2 terms since h is only a few atomic layers thick [1,2,3,4,5,6] and is much smaller than R, one can rewrite Equation (21) as:
Rearranging Equation (23) gives:
In deriving Equation (6), solute entering the growing solid is ignored. To account for this amount of solute, the PET velocity, VC, of the solid has to be smaller than VS described in Equation (24) in order to maintain the particle being pushed under steady-state, i.e.,
Similar to Equation (2), the PET velocity in Equation (25) is proportional to h and the reciprocal of R. The uniqueness of Equation (25) is that the PET velocity is a linear function of composition, diffusion coefficient, and temperature gradient as well. Compared to Equation (3), the values of α, β, and ε in Equation (25) are different, and the term of interfacial energies is not included because of the assumption that the radius of the gap is a constant. Still, the minimum separation between the particle and solid–liquid interface has to be determined by the forces acting on the particle. Furthermore, m and k in Equation (25) should not be zero because of the division operations performed in obtaining these equations. When m = 0, no depression will form on the growing solid behind the particle because TI = T0 and CL = C0. Thus, the solute should have no effect on particle pushing. This is also held true for C0 = 0 and k = 1. Under such conditions, solute diffusion is not a dominant factor during the engulfment of a particle, so particle pushing is governed by surface energy interactions when this is no convection in the liquid.
3. Validation
3.1. G vs. VC
Equations (24) and (25) predict that the PET velocity, VC, is zero when the temperature gradient, G, is zero, meaning that particles should be engulfed by a growing crystal/solid at any growth rate when G = 0 under no convection conditions. Unfortunately, no data on particle pushing is available in the open literature on conditions of G = 0 and no convection in the liquid. Such conditions can only be achieved during isothermal coarsening of an alloy at a semisolid state where (1) the liquid film between dendrites is so thin that convection in the liquid film is inhibited by the friction of the solid–liquid interfaces to fluid flow, (2) the slow growth of larger solid grains at the expense of smaller grains is spontaneous at G = 0 due to the Ostwald ripening phenomenon, and (3) the fraction solid does not change, so that macro-scale flow (across a few grains) due to shrinkage feeding is prevented.
Isothermal coarsening experiments on particle pushing by globular grains were performed in Al-4.5 wt. %Cu-2 wt.%TiB2. Globular grains were intentionally used in order to illustrate clearly than TiB2 particles could be entrapped with the grains. The alloy was prepared using pure copper (99.9% purity), pure aluminum (99.7% purity), and an Al-10 wt.% TiB2 master alloy containing TiB2 particles in a size range of 0.1 to 3 µm. Around 400 g of raw materials with a composition of Al-4.5 wt.%Cu-2 wt.%TiB2 were melted in a graphite crucible in an electrical resistance furnace. When the temperature of the melt reached and remained stable at 730 °C, ultrasound was introduced into the melt through an Nb probe for 5 min in order to (1) disperse TiB2 particles in the matrix and (2) cleanse the surfaces of the particles for improved grain refining efficiency. The ultrasonically treated melt was then poured into a steel mold to form an ingot. Specimens of 25 mm by 6 mm were cut from the ingot, heated up from room temperatures to 635 °C, and held at that temperature for various times up to 4 hrs before being cooled in air to room temperature. The microstructure of the specimens was examined using a scanning electron microscope (SEM). In order to observe α-Al grains evolution, specimens were anodized with a Baker’s reagent (10 mL HBF4 (40%)+200 mL distilled water) applying 20V DC for 90–120 s and then were observed by polarized light using ZEISS OM. The grain size of the specimens was measured as a function of isothermal coarsening times to determine the average growth rates of the aluminum phase.
Figure 3 illustrates globular aluminum grains and the distribution of TiB2 particles in Al-4.5 wt.%Cu-2 wt.%TiB2 alloy before and after isothermal heat treatment. The size of the globular aluminum grains increases with increasing isothermal coarsening times, as shown in Figure 4.
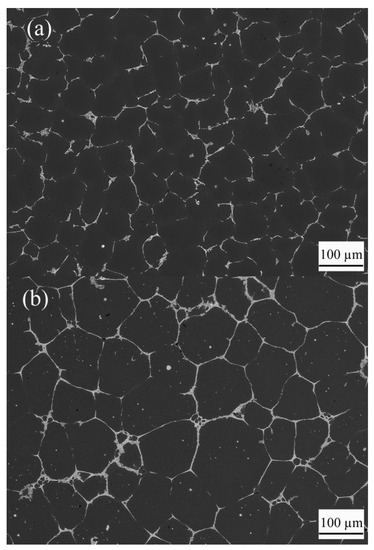
Figure 3.
SEM images of the microstructure in Al-4.5 wt.%Cu-2 wt.%TiB2 alloy under (a) as-cast conditions and (b) after isothermal coarsening for 1 h (3600 s). The dark globular phase is the aluminum grains. The bright regions surrounding the aluminum grains consist of eutectic phases and TiB2 particles.
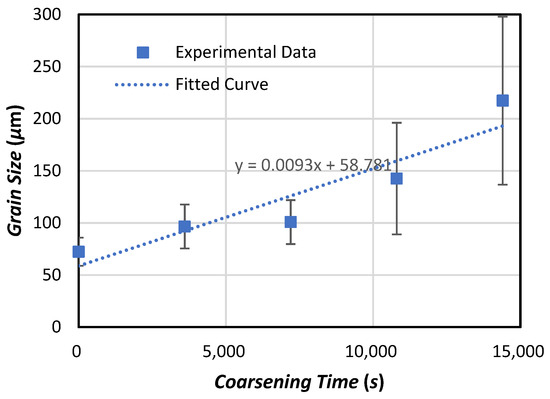
Figure 4.
Relationship between dendrite arm size and times during isothermal coarsening of Al-4.5 wt.%Cu-2 wt.%TiB2 alloy.
In the as-cast specimen where convection existed during its solidification, TiB2 particles were all pushed by the aluminum grains/dendrites and were distributed in the eutectic regions where solidification was completed last. As a result, no small TiB2 particles are found within the dark aluminum dendrites shown in Figure 3a. Such results are in agreement with experimental results reported in Refs. [17,18,19].
In the specimen subjected to isothermal coarsening shown in Figure 3b, two types of particles exist within every aluminum dendrite arm: Al2Cu and TiB2. The large and bright ones are eutectic Al2Cu particles, and the small but less bright ones are TiB2 particles. Al2Cu particles existed at the original grain boundaries or interdendritic regions in the as-cast samples. During isothermal coarsening, the eutectic Al2Cu particles remelted, became part of the liquid films or spherical droplets that were entrapped at the grooves of grain boundaries as the globular aluminum grains grew. The size of Al2Cu particles was much greater than the TiB2 particles. Most TiB2 particles also existed in the grain boundaries. Still, some particles that happened to rest on top of aluminum grains could be engulfed. Indeed, there are numerous small particles in the periphery of aluminum grains shown in Figure 3b. Some of them are TiB2 particles that were engulfed when aluminum grains grow during the isothermal coarsening process. We believe that Figure 3b is the first SEM image showing that small TiB2 particles are indeed engulfed within aluminum grains.
The average coarsening rate of the globular aluminum grains during isothermal coarsening was about 0.0093 µm/s, which is the slope of the linear curve that fits with the experimental data shown in Figure 4. TiB2 particles that rested on the coarsening grains were indeed engulfed at such a small average growth rate. It is important to note that although the average coarsening rate is about two orders of magnitude smaller than the VC predicted by models for pure materials [1,2,4,5,6,25], it is still not the VC for this particle/alloy system. The PET velocity, VC, below which a TiB2 particle is pushed by a growing aluminum crystal/grain in this alloy, could be much smaller than that shown in Figure 4. In fact, during isothermal coarsening, small grains shown in Figure 3b initially grow at the expense of smaller ones. They then start to dissolve after the smaller ones are totally dissolved because larger grains exist nearby. As a result, the small grains shown in Figure 3b could grow at various rates below the average growth rates, including zero. Therefore, particle engulfment in grains of various sizes during isothermal coarsening does suggest that the PET velocity is zero when G = 0, as predicted by Equation (25).
When G > 0, VC increases with increasing G linearly, as predicted by Equation (25). Such a linearly relationship was supported by Körber et al. [26], as shown in Figure 5 but was not supported by Cissé and Bolling [27], who performed experiments at two gradient levels but admitted that they did not have good control of the temperature gradient. More experimental data are needed to validate model predictions.
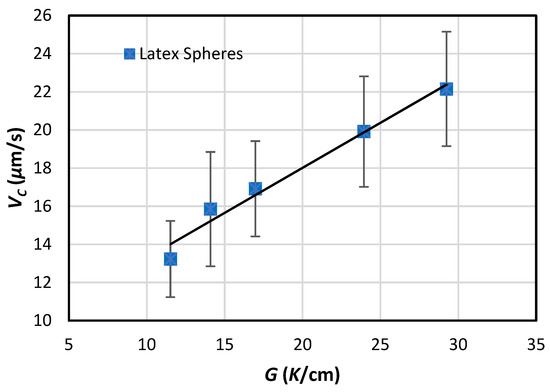
Figure 5.
Relationship between PET velocity, VC, and temperature gradient for latex particles of 5.7 µm mean diameter in distilled water solidified horizontally in thin specimens [26].
3.2. R vs. VC
Validation of Equations (24) and (25) was performed using experimental data obtained in distilled water and degassed water solidified both vertically [27] and horizontally [26]. The vertical solidification was carried out in a large container freezing from the bottom to the top [27]. Convection in such a large container was unavoidable, so data on heavy particles (silica, copper, and tungsten) were used, and data on hollow carbon spheres were discounted. The horizontal solidification experiments of the latex/water were performed in a thin tube [26]. The density of latex was 1.05 g/cm3 and was only slightly denser than water. The specimen hosted in a thin tube was withdrawn using a mechanical translation system [26]. It is unclear if the solid–liquid interface was free from mechanical disturbance or vibration from the mechanical translation system.
Figure 6 illustrates the relationship between PET velocity, VC, and particle radius, R. Experimental data are marked with dots, squares, triangles, and diamonds for various particles. The curves are calculated using Equation (25). Data used in Equation (25) are D = 10−9 m2/s, G = 103 K/m, and ρL/ρS = 1. Impurities in the distilled and degassed water are not provided in the literature, so we have to assume that mC0/k = 0.001 K. Given the value of mC0/k, the h values, shown in Figure 6, can be determined by fitting Equation (25) with experimental data.
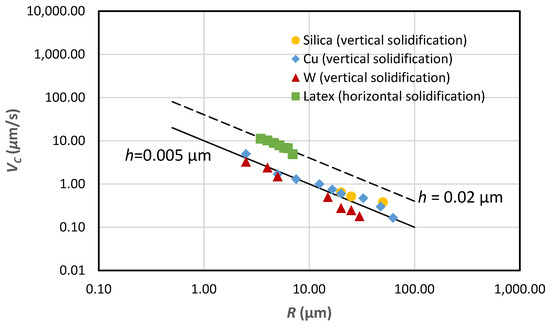
Figure 6.
Critical growth rate, VC, vs. particle radius, R, in distilled water solidified vertically or horizontally. Equation (25) is used to calculate the dash line assuming h = 0.02 µm and the solid line assuming h = 0.005 µm. The solid markers are experimental data from literature. ● Silica (vertical solidification) [27],♦ Cu (vertical solidification) [27], ▲ W (vertical solidification) [27], and ■ (horizontal solidification) [26].
Generally, predictions using Equation (25) fit experimental data quite well in terms of the trend of VC vs. particle radius, R, indicating that VC is proportional to 1/R as described by Equation (25). The good agreement of the predicted VC with experimental data may not mean much since such a good agreement is achieved by assuming values for mC0/k and h. Still, it is interesting to note that the h value associated with the denser particles under vertical solidification conditions is much smaller than that associated with the neutrally-buoyant latex particles under horizontal solidification conditions. Such results are reasonable according to the force balance during steady-state particle pushing.
The driving force, Fσ, for particle pushing is given by [2,6]:
where a0 is the interatomic distance of the solid. The force resisting to the motion of the particle is a viscous force, FD, given by [2,6]:
where µ is the viscosity of the liquid. Under horizontal solidification conditions, the driving force is balanced by the viscous force, giving rise to:
Equation (28) indicates that the minimum separation is a function of the viscosity of the liquid and the difference in interfacial energy. The minimum separation decreases with the increasing viscosity of the liquid. The PET velocity described in Equation (25) should decrease with the increasing viscosity of the liquid. Indeed, Uhlmann et al. [1] reported that the critical growth velocities in liquids of higher viscosity were higher than that of lower viscosity.
Under vertical solidification conditions, the gravitational force, FW, is given by:
where ρP is the density of the particle. For a particle denser than the liquid and the solid growing against gravity, force balance gives:
Substituting Equations (26), (27) and (29) into (30) and rearranging the equation yield:
To differentiate Equation (31) against (ρP-ρL) yields dh/d(ρP-ρL) < 0, indicating that an increase in the density of the particle would lead to a decrease in h. The gravitational force acting on the particle seems to push the particle closer to the solid–liquid interface, resulting in a smaller h and resultant lower VC under vertical solidification conditions than that under horizontal solidification conditions. The slightly large scatter in data obtained under vertical solidification conditions shown in Figure 6 seems to be related to the densities of the particles tested as well. The densities of the particles are 2250, 8960, and 19,360 kg/m3 for silica, copper, and tungsten, respectively [2]. The PET velocity for tungsten particles is lower than that of the silica and copper particles, as shown in Figure 6.
4. Discussion
The analytical models of this work are derived under simplified boundary conditions in order to obtain analytical solutions. The macroscopic morphology of the solid–liquid interface is not solved because it cannot represent the morphologies of the solid–liquid interface and the resultant separation, h, at the atomic scale. As a result, the curvature undercooling of the interface has to be estimated, assuming a constant radius for the solid–liquid interface in the gap region. Another simplification in obtaining the analytical models is that the solute composition at the edges of the gap is assumed to be that at the planar solid–liquid interface, i.e., Equation (18). In spite of these oversimplified assumptions and less rigorous boundary conditions, results shown in Figure 3, Figure 4, Figure 5 and Figure 6 indicate that the predictions made by Equation (25) are generally in agreement with experimental observations in distilled water during directional solidification and in an aluminum alloy during isothermal coarsening.
Data shown in Figure 6 include only those obtained in distilled water. Experimental data in other particle/matrix systems [1,3,28] are not plotted because each system would require its unique h and mC0/k data in order to use Equation (25). Still, for a particle of 1 µm in radius, the PET velocities are in the range of between a few micrometers per second to a few tens of micrometers per second. Such growth rates are comparable to our model predictions since the viscosity and the interfacial energies are quite different from that of the particle/distilled water system. Experimental data in systems containing sub-millimeter-sized particles [29,30] are not considered in this study because the thermal conductivities of the materials in the systems are not included in our study. These physical properties have less effect on particle pushing for small particles [1,2,5] but could have a significant effect on large particles [6,25,29,30,31].
In comparison with experimental data in particle/distilled water systems, the h value used in Equation (21) is in the range of 0.005 to 0.02 µm, which is one to two orders of magnitude greater than an interatomic spacing [32]. Such a minimum separation between the particle and the solid–liquid interface is in agreement with what is reported in the literature [1,2,3]. PET velocity increases with increasing h because it would be less difficult for solute elements or impurities to diffuse out of a thicker gap than a thinner one. Solute or impurity elements have to diffuse out of the gap, against the feeding current, to maintain steady-state particle pushing. Otherwise, the particle should be engulfed by the growing solid.
The dependence of the PET velocity on particle size is also related to the diffusion of solutes/impurities out of the gap between the particle and the growing solid crystal. The length of the gap and the resultant diffusion length are proportional to the particle size. Thus, it would be more difficult for the solutes/impurities to diffuse out of a longer gap than a shorter one, given a minimum separation, h. Our diffusion model, i.e., Equation (25), indicates that VC is proportional to 1/R. This is quite different from the models based on interface interactions where VC is proportional to 1/Rα and α > 1 [6,7]. The dependence of VC to 1/R seems to fit with experimental data better than VC to 1/Rα where α > 1.
The solute content has a major effect on VC. Unfortunately, experiments carried out in alloys on particle pushing under diffusion-only conditions, i.e., no convection, are scarce. The purity of matrix material used is usually of high purity (about 99.999 wt. %). One experiment by Körber et al. [28] indicates that the addition of 0.56% NaMnO4 in water does not alter the PET velocity of water containing latex particles. However, no phase diagram of the water/NaMnO4 system is available, so it would be impossible to determine the values of m and k using Equation (25). A solute element should have no effect on VC if m = 0 or k = 1.
The PET velocity for a 2-µm particle is around a few micron meters per second for a particle in the pure matrix, usually of 99.999 wt.% purity. When the impurity or solute content is increased by a few orders of magnitude, the PET velocity should decrease by a few orders of magnitude according to Equation (25). For an alloy containing 1 wt. % of solute, the PET velocity for pushing a 2-µm particle could be in the nanometer per second range, which is a few orders of magnitude smaller than the average growth velocity of solids during normal cooling conditions for normal gravity casting. This would mean that particles should be engulfed during dendritic solidification in a casting. Experimental results in alloys suggest otherwise. Particles are pushed by the growing dendrites under casting conditions so far tested [14,15,18]. Clearly, the fluid flow has a major effect on particle pushing during solidification. A particle traveling in the melt can bounce off the solid–liquid interface and thus is prevented from being engulfed by the growing solid [18,22]. A particle resting on a depression can be dislodged from the depression on the growing solid crystal by a rolling/sliding mechanism [18,20,21]. Vibration or other mechanical disturbance is also capable of dislodging a particle from a depression [18,20]. As long as the particle is dislodged from a depression and starts motion, it should not be engulfed until it settles on a depression again.
Without convection and other mechanical disturbance in the liquid, a small particle (large enough than what is subjected to Brownian motion) should be engulfed by the growing solid in an alloy if it rests on a depression on a growing crystal under normal casting conditions. Convection can be suppressed in an alloy during isothermal coarsening or during the late stage of solidification when the growth rates of the solid are slow, and the fraction solid is relatively large. Indeed, we have found that particles are engulfed during isothermal coarsening of Al-4.5 wt. %Cu alloy in this study.
5. Conclusions
An analytical inequality equation has been derived for describing particle pushing by a planar advancing solid–liquid interface in an alloy. The PET velocity at which the pushing-to-engulfment transition occurs is proportional to the minimum separation between the particle and the solid–liquid interface and the temperature gradient at the interface and is inversely proportional to the particle radius and the solute content of the alloy. The PET velocities in alloys are much smaller than that in pure materials. Without fluid flow in the liquid, a particle that dwells on an advancing solid–liquid interface should be engulfed by the growing solid crystal under normal casting conditions. The fact that particles are pushed by dendrites in casting is due to fluid flow in the mushy zone. Engulfment of small TiB2 particles by growing grains/dendrites is observed in Al-4.5 wt. %-2 wt.%TiB2 alloy during isothermal coarsening at 0.5 fraction solid where convection in the remaining liquid in the mushy zone is suppressed.
Author Contributions
Investigation: C.P., Y.L., Z.L. and Q.H.; resources: Z.L. and Q.H.; writing—original draft preparation: Y.L. and Q.H.; writing—review and editing: Z.L., Y.L. and Q.H.; supervision: Q.H. and Z.L. All authors have read and agreed to the published version of the manuscript.
Funding
This research was funded by the Center for Materials Processing Research at Purdue University (W. Lafayette, IN, USA); and the National Natural Science Foundation of China (Nos. 51974224 and 52174372, Beijing, China).
Acknowledgments
The authors would like to thanks Purdue Center for Materials Processing Research for supporting the work of Yanfei Liu while he was a graduate student in the School of Engineering Technology, Purdue University. The authors would also like to thank the National Natural Science Foundation of China (Grant Nos. 51974224 and 52174372) for supporting the work at Xi’an Jiaotong University.
Conflicts of Interest
The authors declare that they have no known competing financial interests of personal relationships that could have appeared to influence the work reported in this paper.
References
- Uhlmann, D.R.; Chalmers, B.; Jackson, K.A. Interaction Between Particles and a Solid-Liquid Interface. J. Appl. Phys. 1964, 35, 2986–2993. [Google Scholar] [CrossRef]
- Bolling, G.F.; Cissé, J. A Theory for the Interaction of Particles with a Solidifying Front. J. Cryst. Growth 1971, 10, 56–66. [Google Scholar] [CrossRef]
- Omenyi, S.N.; Neumann, A.W. Thermodynamic Aspect of particle Engulfment by Solidifying Melts. J. Appl. Phys. 1976, 47, 3956–3962. [Google Scholar] [CrossRef]
- Chernov, A.A.; Temkin, D.E.; Melnikova, A.M. Theory of the Capture of Solid Inclusions during the Growth of Crystals from the Melts. Sov. Phys.-Cryst. 1976, 21, 369–373. [Google Scholar]
- Shangguan, D.; Ahuja, S.; Stefanescu, D.M. An analytical model for the interaction between an insoluble particle and an advancing solid/liquid interface. Met. Mater. Trans. A 1992, 23, 669–680. [Google Scholar] [CrossRef]
- Pötschke, J.; Rogge, V. On the behaviour of foreign particles at an advancing solid-liquid interface. J. Cryst. Growth 1989, 94, 726–738. [Google Scholar] [CrossRef]
- Kao, J.C.T.; Golovin, A.A.; Davis, S.H. Particle capture in binary solidification. J. Fluid Mech. 2009, 625, 299–320. [Google Scholar] [CrossRef]
- Chen, L.-Y.; Xu, J.-Q.; Choi, H.; Pozuelo, M.; Ma, X.; Bhowmick, S.; Yang, J.-M.; Mathaudhu, S.; Li, X.-C. Processing and properties of magnesium containing a dense uniform dispersion of nanoparticles. Nature 2015, 528, 539–543. [Google Scholar] [CrossRef]
- Zhang, H.; Hussain, I.; Brust, M.; Butler, M.F.; Rannard, S.; Cooper, A.I. Aligned two- and three-dimensional structures by directional freezing of polymers and nanoparticles. Nat. Mater. 2005, 4, 787–793. [Google Scholar] [CrossRef] [PubMed]
- Ishiguro, H.; Rubinsky, B. Mechanical Interactions between Ice Crystals and Red Blood Cells during Directional Solidification. Cryobiology 1994, 31, 483–500. [Google Scholar] [CrossRef]
- Corte, A.E. Particle Sorting by Repeated Freezing and Thawing. Science 1963, 142, 499–501. [Google Scholar] [CrossRef]
- Corte, A.E. Vertical Migration of Particles in Front of a Moving Freezing Plane. J. Geogr. Res. 1962, 67, 1085–1090. [Google Scholar] [CrossRef]
- Kaptay, G. Discussion of “Particle Engulfment and Pushing by Solidifying Interfaces: Part II. Microgravity Experiments and Theoretical Analysis”. Metall. Mater. Trans. A 1999, 30, 1887–1894. [Google Scholar] [CrossRef]
- Mortensen, A.; Jin, I. Solidification processing of metal matrix composites. Int. Mater. Rev. 1992, 37, 101–128. [Google Scholar] [CrossRef]
- Wilde, G.; Perepezko, J.H. Experimental study of particle incorporation during dendritic solidification. Mater. Sci. Eng. A 2000, 283, 25–37. [Google Scholar] [CrossRef]
- Han, Q.; Lindsay, J.P.; Hunt, J.D. The Effects of Fluid Flow on Particle Pushing. Cast Met. 1994, 6, 237–239. [Google Scholar] [CrossRef]
- Wang, M.; Han, Q. Particle Pushing during Solidification of Metals and Alloys. Mater. Forum 2014, 783, 155–160. [Google Scholar] [CrossRef]
- Liu, Y.; Han, Q. Interaction between nucleant particles and a solid-liquid interface in Al-4.5Cu alloy. Acta Mater. 2021, 213, 116956. [Google Scholar] [CrossRef]
- Youssef, Y.M.; Dashwood, R.J.; Lee, P.D. Effect of Clustering on Particle Pushing and Solidification Behaviour in TiB2 Reinforced Aluminum PMMCs. Compos. Part A 2005, 36, 747–763. [Google Scholar] [CrossRef]
- Han, Q.; Hunt, J.D. Redistribution of Particles during Solidification. ISIJ Int. 1995, 35, 693–699. [Google Scholar] [CrossRef]
- Han, Q.; Hunt, J. Particle pushing: Critical flow rate required to put particles into motion. J. Cryst. Growth 1995, 152, 221–227. [Google Scholar] [CrossRef]
- Han, Q.; Hunt, J. Particle pushing: The attachment of particles on the solid-liquid interface during fluid flow. J. Cryst. Growth 1994, 140, 406–413. [Google Scholar] [CrossRef]
- Chang, A.; Dantzig, J.A.; Darr, B.T.; Hubel, A. Modeling the interaction of biological cells with a solidifying interface. J. Comput. Phys. 2007, 226, 1808–1829. [Google Scholar] [CrossRef]
- Yang, Y.; Garvin, J.; Udaykumar, H. Sharp interface numerical simulation of directional solidification of binary alloy in the presence of a ceramic particle. Int. J. Heat Mass Transf. 2008, 51, 155–168. [Google Scholar] [CrossRef]
- Sen, S.; Curreri, P.; Kaukler, W.F.; Stefanescu, D.M. Dynamics of solid/liquid interface shape evolution near an insoluble particle—An X-ray transmission microscopy investigation. Met. Mater. Trans. A 1997, 28, 2129–2135. [Google Scholar] [CrossRef]
- Körber, C.; Rau, G.; Cosman, M.; Cravalho, E. Interaction of particles and a moving ice-liquid interface. J. Cryst. Growth 1985, 72, 649–662. [Google Scholar] [CrossRef]
- Cissé, J.; Bolling, G. A study of the trapping and rejection of insoluble particles during the freezing of water. J. Cryst. Growth 1971, 10, 67–76. [Google Scholar] [CrossRef]
- Sen, S.; Dhindaw, B.K.; Stefanescu, D.M.; Catalina, A.; Curreri, P. Melt convection effects on the critical velocity of particle engulfment. J. Cryst. Growth 1997, 173, 574–584. [Google Scholar] [CrossRef]
- Juretzko, F.R.; Dhindaw, B.K.; Stefanescu, D.M.; Sen, S.; Curreri, P.A. Particle Engulfment and Pushing by Solidifying Interfac-es: Part I. Ground Experiments. Metall. Mater. Trans. A 1998, 29, 1691–1696. [Google Scholar] [CrossRef]
- Stefanescu, D.M.; Juretzko, F.R.; Catalina, A.; Dhindaw, B.K.; Sen, S.; Curreri, P.A. Particle engulfment and pushing by solidifying interfaces: Part II. Microgravity experiments and theoretical analysis. Met. Mater. Trans. A 1998, 29, 1697–1706. [Google Scholar] [CrossRef]
- Surappa, M.K.; Rohatgi, P.K. Heat diffusivity criterion for the entrapment of particles by a moving solid-liquid interface. J. Mater. Sci. 1981, 16, 562–564. [Google Scholar] [CrossRef]
- Gilpin, R. Theoretical studies of particle engulfment. J. Colloid Interface Sci. 1980, 74, 44–63. [Google Scholar] [CrossRef]
Publisher’s Note: MDPI stays neutral with regard to jurisdictional claims in published maps and institutional affiliations. |
© 2022 by the authors. Licensee MDPI, Basel, Switzerland. This article is an open access article distributed under the terms and conditions of the Creative Commons Attribution (CC BY) license (https://creativecommons.org/licenses/by/4.0/).