Article

Acoustic Sensor Based on a Cylindrical Resonator for Monitoring a Liquid Flow

by
Abdellatif Gueddida
1,*,
Yan Pennec
1,
Ana Luiza Silveira Fiates
2,
Michael Johannes Vellekoop
2,
Bernard Bonello
3 and
Bahram Djafari-Rouhani
1
1
Institut d’Electronique, Microélectronique et Nanotechnologie, UMR CNRS 8520, Université de Lille, 59650 Villeneuve d’Ascq, France
2
Institute for Microsensors, -Actuators and -Systems (IMSAS), Microsystems Center Bremen (MCB), University of Bremen, D-28359 Bremen, Germany
3
CNRS, Institut des NanoSciences de Paris (INSP), Sorbonne Universités, CEDEX 05, 75252 Paris, France
*
Author to whom correspondence should be addressed.
Crystals 2022, 12(10), 1398; https://doi.org/10.3390/cryst12101398
Submission received: 24 August 2022 / Revised: 27 September 2022 / Accepted: 28 September 2022 / Published: 2 October 2022
(This article belongs to the Special Issue Recent Research on Engineering Acoustic Metamaterials)

Abstract

:
We present a numerical investigation of an acoustic sensor based on a cylindrical resonator to monitor the acoustic properties of liquids flowing in a tube. The sensor design consists of a hollow cylindrical washer surrounding the tube, which carries the liquid, and which can be filled during the sensing process. Due to the impedance mismatch between the liquid and the solid washer, we demonstrate the presence of high-quality factor resonances associated with the acoustic properties of the liquid (such as velocity, density, or viscosity) appearing as sharp spectral features in the transmission and detection measurements. An appropriate choice of geometrical parameters allows either to obtain two distinct resonances associated with the liquid and the surrounding washer or to overlap the narrow resonance of the liquid with the broad resonance of the washer and achieve a Fano-type resonance from their interaction. The sensitivity of the resonances to the acoustic properties of the liquid are investigated as a function of the geometrical parameters. We show that for highly viscous fluids, the vanishing of very narrow peaks can be avoided by increasing the thickness of the washer and, therefore, decreasing the quality factors. The calculations are performed in the framework of a finite element method. Our design provides a promising platform for sensing several acoustic characteristics of liquids flowing in tubes.

1. Introduction

A mechanical resonator can be considered as a spring-mass system whose resonance frequencies depend on its effective mass and stiffness coefficient [1,2,3]. The relationship between the resonance frequency and the effective mass of the mechanical resonator has been the focus of various works devoted to mass sensing applications, which considered such a mechanical resonator as a mass balance [4,5,6]. Indeed, when the analyte (mass) is adsorbed at the surface of the mechanical resonator, the resonance frequency is shifted. In other words, measurement of the added mass is obtained from the shift of the resonance frequency of the mechanical resonator. The need for the detection of small mass changes has led to the miniaturization of mechanical resonators [7], and the application of both micro-electromechanical systems (MEMS) and nano-electromechanical systems (NEMS) technologies in this field has allowed the realization of miniaturized mechanical sensors able to detect small masses with high accuracy, including the detection of single nanoparticles, biological cells [1,5], and single viruses [8]. Many researchers have highlighted this concept using a variety of micro- and nanostructures, such as a quartz crystal microbalance (QCM) [9,10,11,12], nanotube resonator [13], micro-disk resonator [14], and cantilevers [15].
But beyond mass determination, the characterization of the liquid properties is of interest in various fields such as the automotive, petroleum, food, medical, and pharmaceutical industries. In that context, the concept of a mechanical resonator sensor has been extended to monitor physical parameters, such as density and the viscosity, by using a variety of structures such as a tuning fork [16], a microplate [17], and cantilevers [18,19,20]. When a device is immersed in a liquid, the resonance peak is usually affected by broadening and frequency shift. Both the quality factor and the sensitivity of the sensor are thus key parameters for the accurate measurement of the viscosity and density of a liquid. Indeed, the sensitivity defines the ability of the device to bend or vibrate and the Q-factor represents the ratio of losses over the stored energy [3,19,21]. However, in contrast to the mass sensing applications mentioned above, such resonators immersed in a liquid see their performances drastically altered. In order to reduce the effect of viscosity and improve sensing efficiency, vibrational modes can be properly chosen, allowing the achievement of high Q-factor devices [17,22,23]. Cantilever-type mechanical resonators, fundamental in-plane vibration modes, length extensional modes, and roof-tile-shaped vibration modes have been proposed to improve the quality factor as compared to devices based on out-of-plane vibration modes [24,25,26].
In addition to the standard concept of a mechanical resonator sensor, other approaches have been proposed for sensing, including a surface acoustic waves (SAW) sensor [27,28], a Lamb wave resonator [29], and phononic crystals [30,31]. Thanks to their outstanding properties in the manipulation of acoustic/elastic waves, it has been demonstrated both theoretically and experimentally that phononic crystals can be exploited as a new platform for sensing liquid properties in small cavities [32]. A phononic crystal is obtained either by the periodic structuration of a material or by considering the periodic alternation of at least two materials. The ability of the phononic crystals to be used as sensors derives from the occurrence of one or several band gaps in their transmission curves, i.e., the frequency regions where no elastic wave can propagate. The sensing feature can be carried out through the insertion of a cavity inside the phononic crystal in such a way that the cavity resonance modes fall inside the band gap of the perfect structure. The inserted cavity thus acts as a measurement chamber of the analyte. A small change in the acoustic properties of the analyte leads to a frequency shift of the cavity modes, which allows for the estimation of the acoustic properties responsible for this shift. The analyte can be either used as a component of the perfect phononic crystal [33,34,35] or introduced as a defect inside the phononic crystal [36,37,38]. The sensing of the acoustic properties of a liquid can also be achieved by exploiting the so-called extraordinary acoustic transmission mechanism through a perfect two-dimensional phononic crystal plate [39]. The realization of both phononic and photonic properties in a same device, known as a phoxonic crystal, has also been demonstrated to simultaneously detect the optical and acoustic properties of liquids [31,40,41].
In most cases, liquids are transported by tubular structures such as pipes, tubes, or capillaries, and the design of liquid sensors with tubular shape presents advantages with respect to the above-mentioned phononic crystals-based sensors. As they can be easily integrated as a part of the piping system, they provide the possibility for the in-line monitoring of liquids [42]. Tubular phononic crystals (TPCs) were firstly introduced in 2015 [43], changing the phononic crystal geometry from 2D planar or 3D Cartesian to 3D cylindrical, with both translational and rotational symmetries. Recently, we presented a numerical analysis of a TPC consisting of a periodic arrangement of cylindrical washers regularly arranged on a hollow tube filled with a liquid to be monitored. We have shown that the introduction of a Fabry–Perot cavity in the middle of the TPC gives rise to peaks (inside the band gap) and dips (outside the band gap) in the transmission curves. The choice of a polymer as the pipe material allows for a similar or even higher sensitivity to density variations than to sound velocity. We also revealed the dramatic effect of the liquid shear viscosity and solid damping on the performance of the TPC sensor [44]. In order to reduce the shear viscosity effects, N. Mukhin et al. [45] proposed a combination of a 1D and 2D phononic crystals approach for the excitation, detection, and confinement of a radial mode where both the excitation and the detection of the cavity mode are performed inside the cavity.
In this paper, we present an acoustic sensor for liquids based on the excitation and detection of the resonance modes of a hollow cylindrical washer grafted in the middle of a hollow tube (Figure 1). The hollow parts of both the washer and the tube are filled with the liquid to be monitored. The solid material is chosen to be stainless steel in order to avoid dissipation losses in the solid parts and also to achieve a high impedance mismatch between the solid and the liquid parts of the washer. From the transmission curves analysis, we identify the washer modes which can be exploited for sensing the acoustic properties of the liquid. Such a structure has the advantage of dealing with the accurate eigenmodes of the washer, as well as to limit the effect of the viscosity as compared to other more complex phononic crystal structures. By changing either the mass density or the sound velocity, we determine the sensitivity of the washer modes to each property of the liquid. Then, as an illustration, the sensing performance of the proposed acoustic liquid sensor is tested to detect the concentration of sucrose concentration in an aqueous sugar solution.

2. Materials and Methods

Figure 1 shows a schematic view of the sensor. It consists of a hollow cylindrical washer surrounding a hollow tube. Both the washer and the tube are filled with the liquid to be monitored. The solid parts are made of stainless steel with a Young’s modulus E of 200 GPa, a Poisson’s ratio υ of 0.3, and a mass density ρ of 7850 kg/m3. The geometric parameters of the structure are given by the outer R = 0.5 mm and inner r = 0.2 mm radii of the tube and the width w = 2 mm and height h = 0.6 mm of the washer. The thickness hL of the solid wall of the washer is 0.15 mm and the total length L of the tube is 12 mm. In the Supplementary Material, we use a scaling factor by assuming geometrical parameters 10 times larger than those used here, thus dividing the working frequencies by 10. In the following, we shall focus only on the axysymmetric modes which can be less affected by the viscous effect. We apply a constant force to the inlet solid section of the tube, where the direction of the applied force is parallel to the tube’s axis. The transmission curve of the propagating elastic waves is obtained from the evaluation of the displacement field at the outlet solid section of the tube and normalized with respect to that of the tube without the washer. PML (perfectly matched layer) conditions are applied at both ends of the tube to avoid possible reflections of the propagating elastic waves. All the simulations in this work are performed by using the COMSOL Multiphysics® 5.5 software (Stockholm, Sweden) and are based on the finite element method (FEM). The elastic waves in the solid part of the system and the acoustic waves in the liquid filling the washer are simulated by using the solid mechanics module and the thermoviscous acoustic module of COMSOL Multiphysics, respectively. Therefore, the viscous losses in the liquid are taken into consideration. Concerning the liquid filling the very long tube with a constant diameter, we use the Narrow Region Acoustics (NRA) domain feature, which is available in the pressure acoustic interface of COMSOL Multiphysics. Indeed, the NRA allows us to resolve the viscous losses of the liquid without requiring a very high number of mesh elements. To solve the associated equations, a triangular mesh is applied to the structure, except in the PML regions, which are meshed using mapped mesh. To correcly use the thermoviscous module and take into acount the viscous effect within the so-called viscous boundary layer, an additional boundary layer mesh is applied to the interface liquid/solid. The details of the governing equations are reported in Section S1 of the Supplementary Material.

3. Result and Discussions

Figure 2a displays the transmission curve using an axisymmetric model of the sensor where the red and black curves correspond to the structure with an empty washer and to the washer filled with water (with a longitudinal velocity of cl = 1490 m/s and a mass density of ρ = 1000 kg/m3), respectively. From the comparison of these two curves, one can observe that the first broad dip A (fA = 183 kHz) is present in both cases, whereas the second narrow dip B (fB = 425 kHz) appears only when the washer is filled with the liquid. Figure 2b displays the displacement field maps of the two dips (A and B). The displacement field associated with the first dip A is localized in both the solid and the liquid parts of the washer, with a maximum in the solid part, while the displacement field at dip B shows a high confinement in the liquid inside the washer, with a negligible motion inside the backbone tube. To give further support to this finding, we present an analysis of the eigenmodes of the system in Section S2 of the Supplementary Materials, and we find the same axisymmetric modes as above. In Figure 2, dips A and B are two distinct features that appear independently of each other. Below, we shall show that a tuning of the geometrical parameters allows us to shift and overlap both resonances and achieve a Fano-type resonance resulting from their interaction.
We also show in Section S3 of the Supplementary Materials (Figure S2) that exactly the same features are present whether the central tube is solid or hollow, and in the latter case, whether it is empty or filled with water. This demonstrates that the sensing capabilities of the design remain valid in all three cases.
Therefore, probing the evolution of the narrow dip frequency by changing the filling fluid will provide us with information about the acoustic properties of the liquids, i.e., the velocity cl, the mass density ρ, and, possibly, the viscosity μ. The performance of the proposed liquid sensor compared to other sensor concepts [46,47,48,49] can be evaluated through parameters like the quality factor Q, the sensitivity S, and the figure of merit FoM. The quality factor Q corresponds to the ratio of the resonance frequency fr to the full width frequency at half-maximum ∆f1,2 of the resonance peak:
Q = f r Δ f 1 , 2
The sensitivity defines the ability of the resonance frequency to change in response to sound velocity cl or mass density ρ variations:
S c l = Δ f r Δ c l   Hz m · s 1 S ρ = Δ f r Δ ρ   Hz kg · m 3
The figure of merit (FoM) measures the resolution associated with the resonance frequency fr of the sensor:
F o M c l = Q × S c l f r   ( m / s ) 1 F o M ρ = Q × S ρ f r   kg · m 3 1
Altogether, these three quantities quantify the capability of the sensor to detect small variations in the acoustic properties of the considered liquid. As we demonstrated in our previous work [44,50], the quality factor can be dramatically reduced by the losses due to the mechanical damping in the solid, the viscosity in the liquid, and, in particular, the shear viscosity inside the viscous boundary layer at the solid–liquid interface. In this work, we assume that the solid material is stainless steel, with a low dissipation. Thus, only the losses due to the viscosity of the liquid will be considered in the simulation.
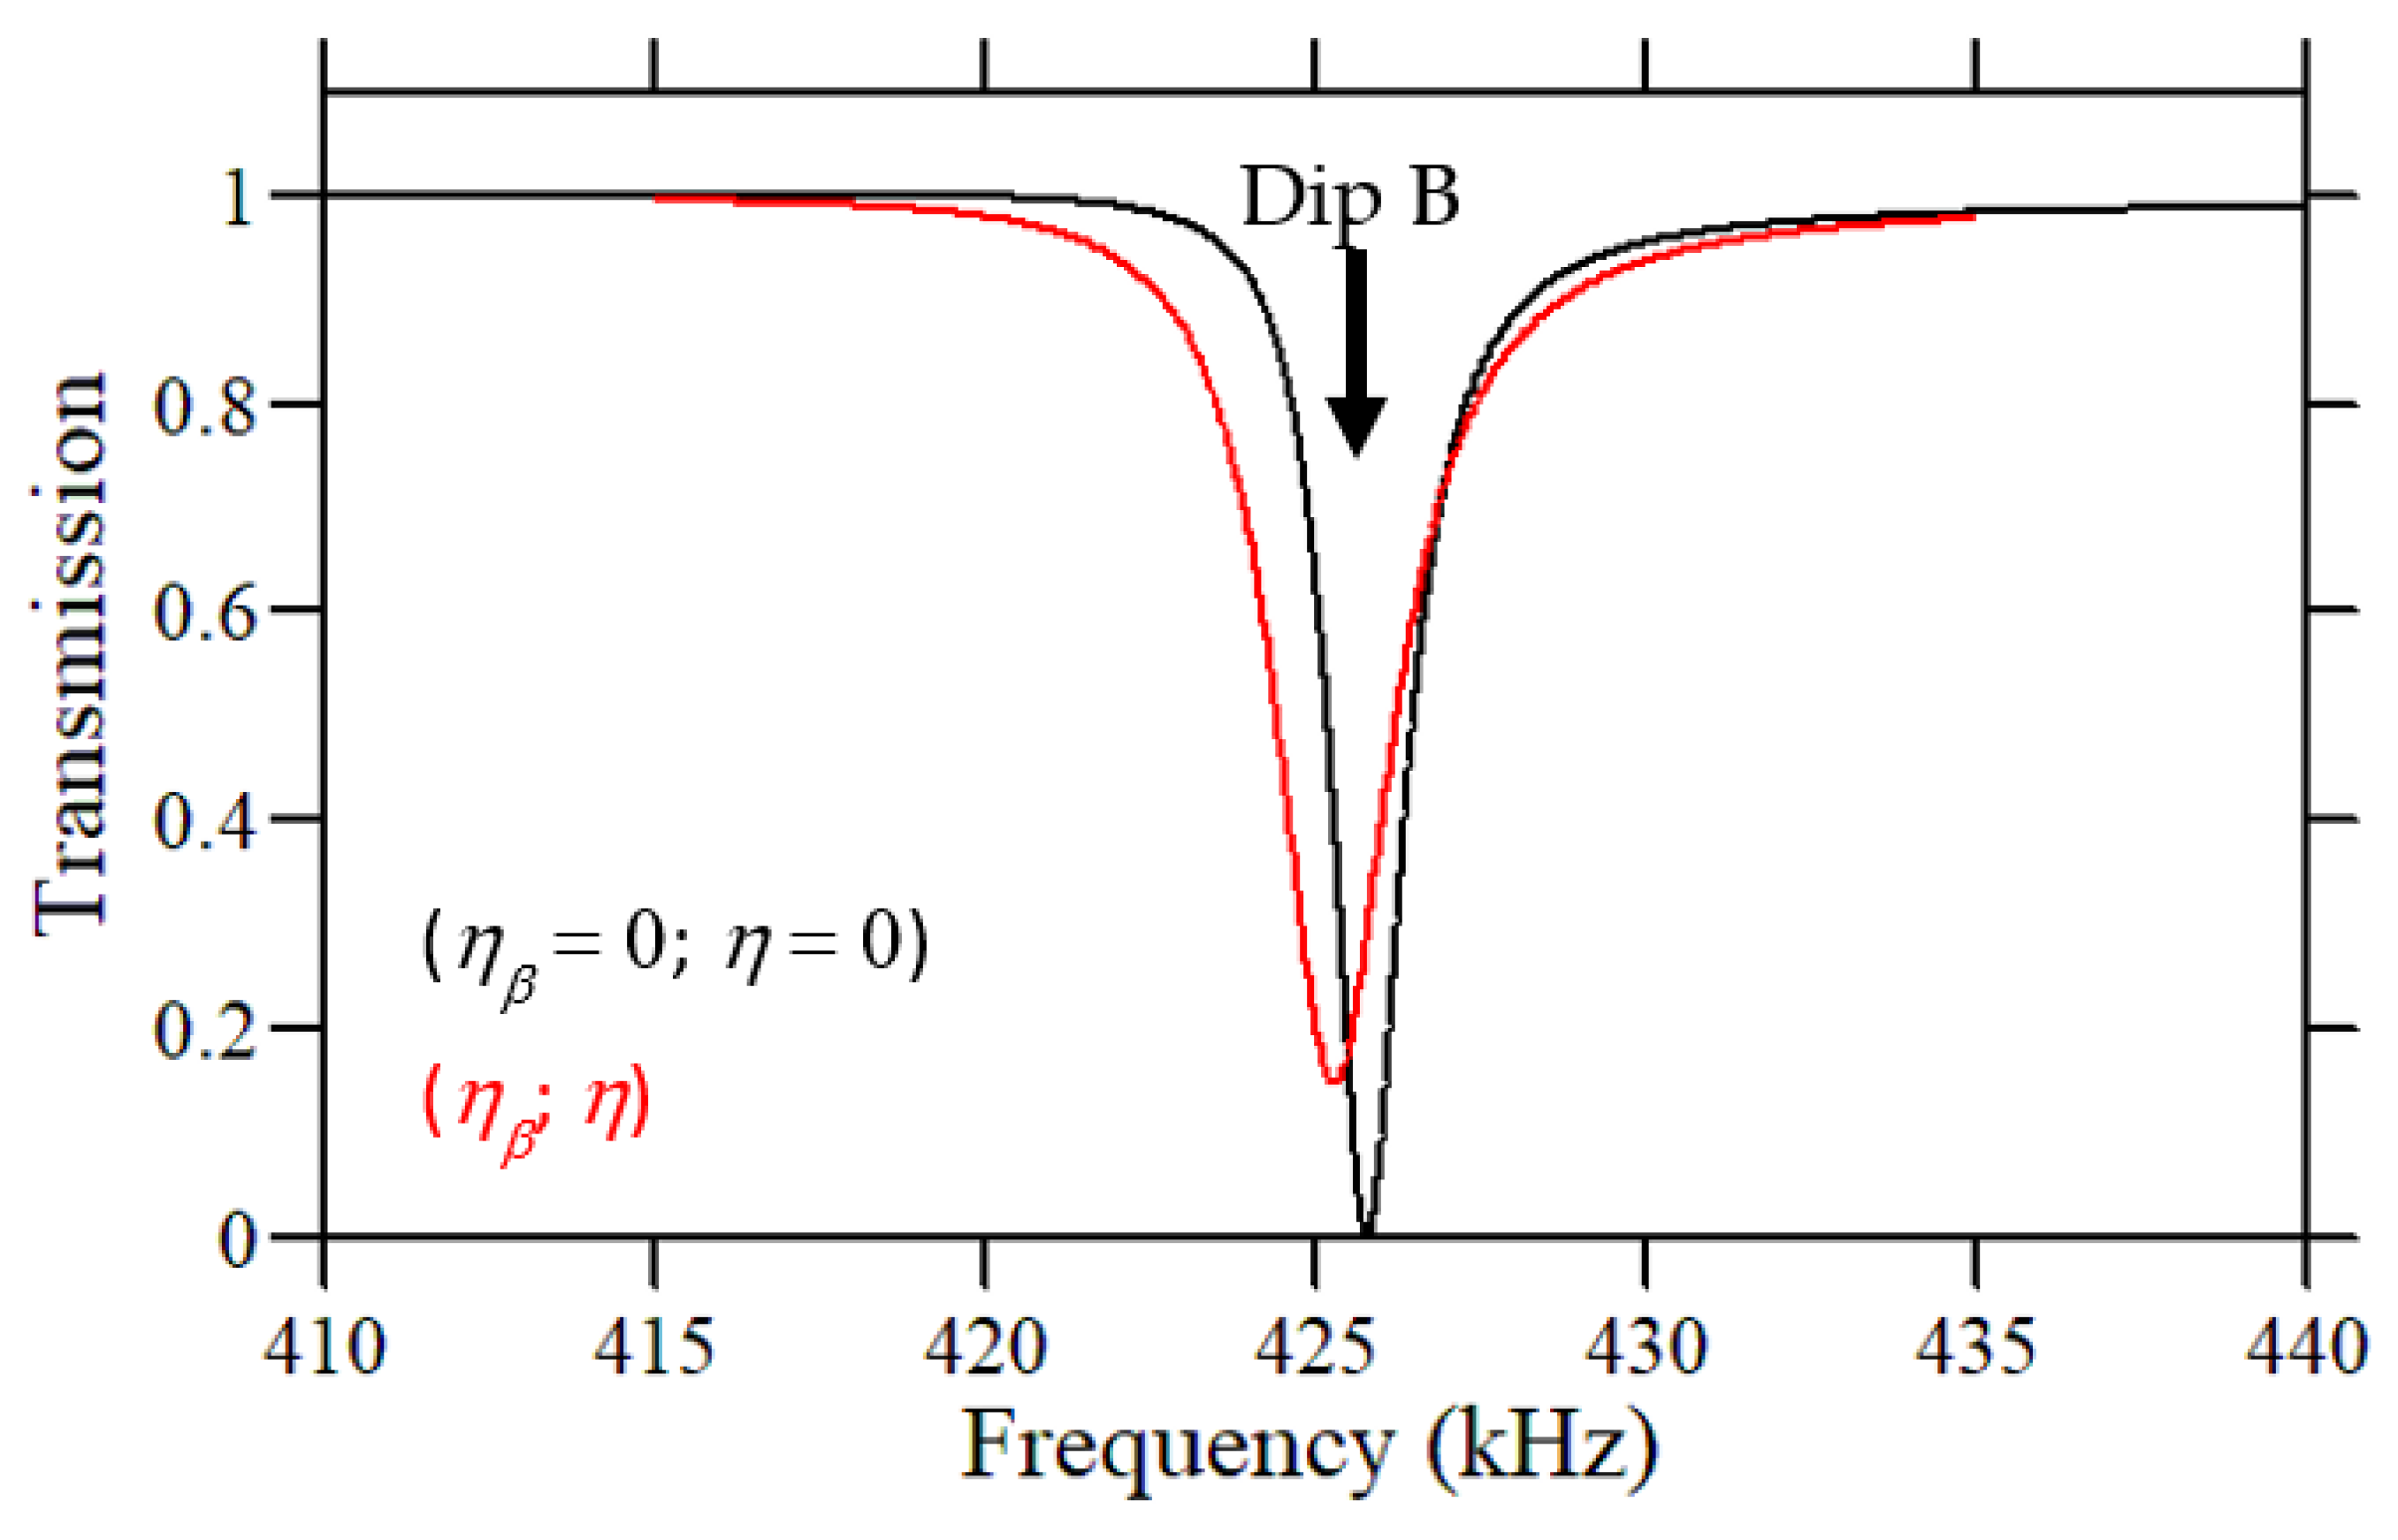
Our calculations are performed for water, with the viscosity parameters μ B = 2.4 × 10 3   Pa · s and μ = 8.9 × 10 4   Pa · s [51]. We found that only dip B is sensitive to the viscosity, as shown in Figure 3. One can remark that there is a slight shift in frequency and a clear decrease in its amplitude. Both changes are mainly associated with the dynamic viscosity [44,50], whereas the effect of bulk viscosity remains very weak.
In order to evaluate the sensitivity of the washer modes to the variation of the acoustic properties of the liquid, we separately varied the mass density ρ and sound velocity cl of the water by 1%, keeping the viscosity coefficients constant. Figure 4a presents the calculated transmission curves of dip B, where the black curve corresponds to pure water, and the red and green curves are obtained with a decrease of 1% in the sound velocity and mass density, respectively. We obtained a redshift and blueshift of 3.6 kHz and 0.1 kHz, respectively. Moreover, we studied this shift for a variation in the sound velocity or mass density of up to 10% and found a linear trend (Figure S3, Section S4 of the Supplementary Materials). This sensor can be efficient at detecting the variation in acoustic velocity while being almost unsensitive to the mass density. This behavior may result from the high contrast in density between the solid (steel) and the liquid. Indeed, conversely, we found a high sensitivity to the mass density of the liquid in a previous work dealing with a tubular phononic sensor [44] made of a polymer with a density and impedance comparable to that of a liquid. However, the drawback was the high damping in the polymer, which could become even more detrimental than the viscosity of the liquid. From these results, we summarize in Table 1 the characteristics (Q, S, and FoM) of the sensor, including (or excluding) the liquid viscosity. One can see that the viscosity reduces the performance of the sensor by decreasing the quality factor, and thus the FoM, while the sensitivity remains almost independent of the viscosity.
In addition to the transmission spectrum, we also investigated the detection of the resonance B when the measurement of the vibration is taken at the surface of the washer, for instance, by a transducer or a laser vibrometry technique. The results are shown in Figure 4b, where the resonance in the liquid appears as a peak rather than a dip. The colors in the figure have the same meanings as those in Figure 4a.
One can note that when considering a structure with geometrical parameters 10 times larger, both the resonance frequency and the sensitivity are divided by 10, whereas the effects of the viscosity on the resonant peak and dip are reduced due to the frequency dependence of the viscosity (see Figure S4, Section S5 of the Supplementary Materials).
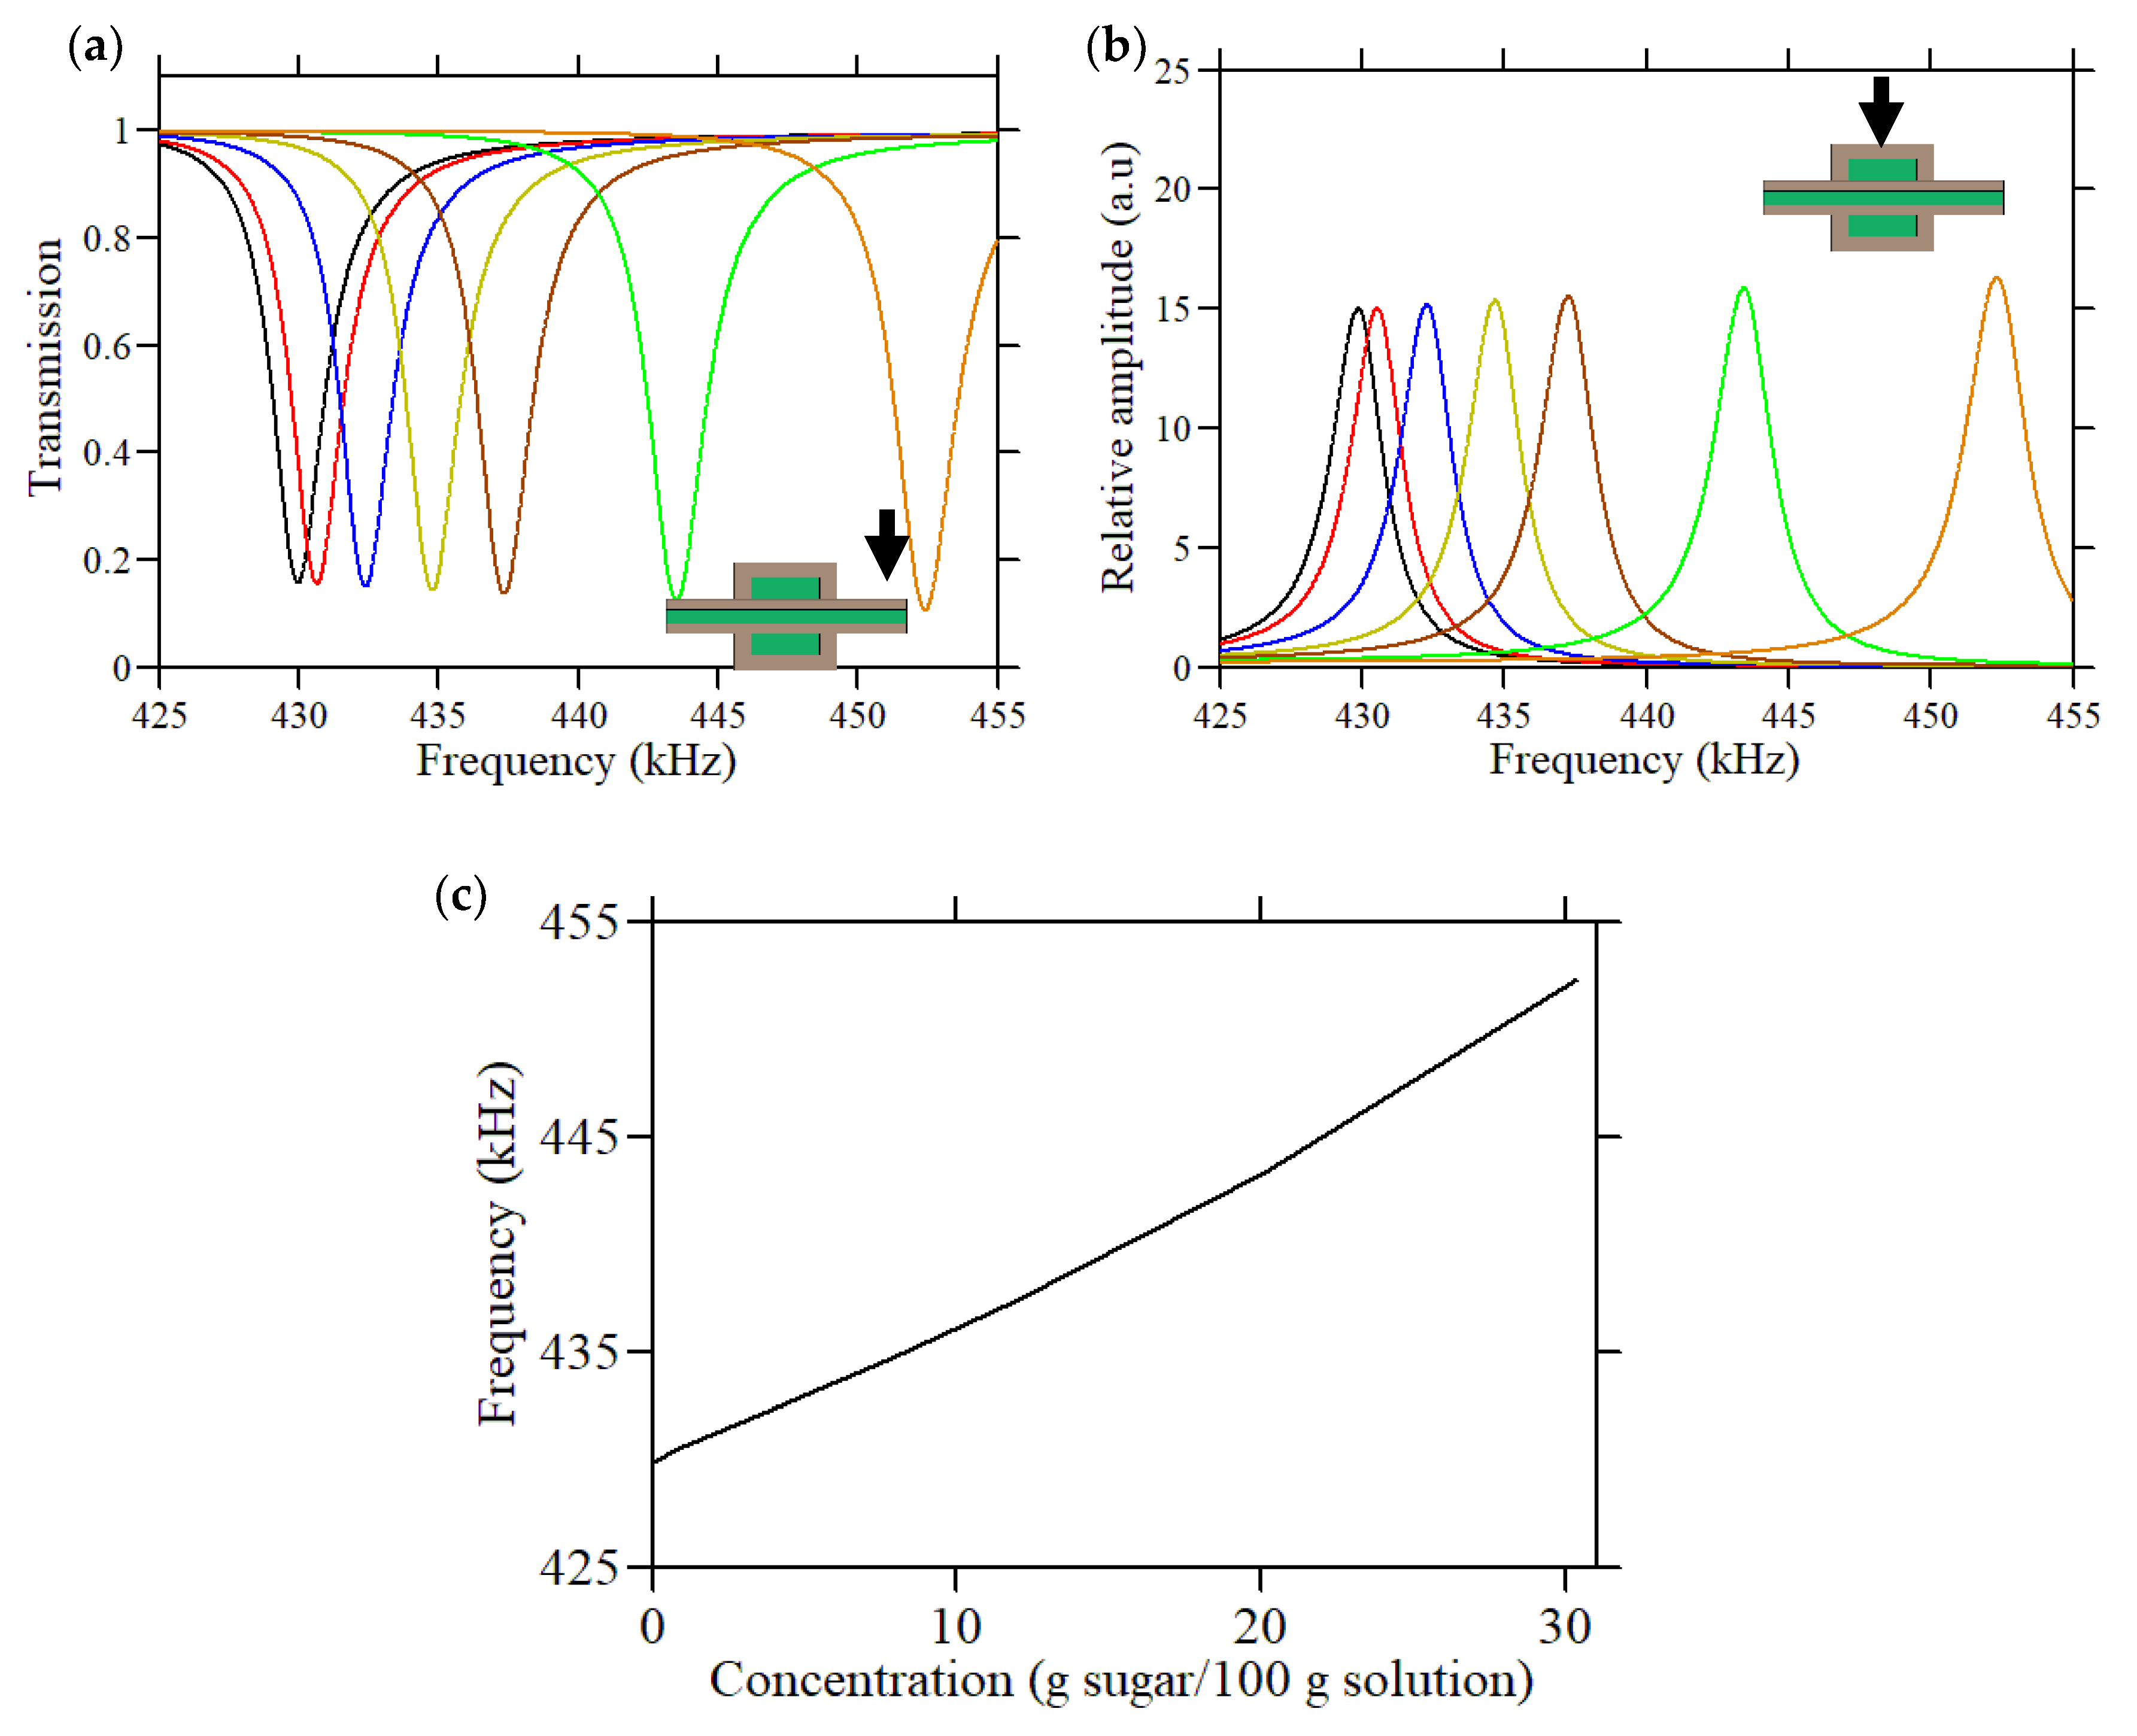
In Figure 5, we present another illustration of the performance of the proposed sensor, focusing on the detection of the sucrose concentration in an aqueous sugar solution. The parameters are given in Table 2 [52] as functions of the concentration, while the viscosity is kept constant and equal to its value in the water. The detected amplitudes at the exit (transmission) or at the surface of the washer are presented in Figure 5a,b, respectively, showing the possibility of probing the resonant feature at each concentration. Of course, in such a practical application where one of the parameters is the liquid concentration, both the acoustic velocity and mass density are subject to variations and contribute to the shift of the dip frequency. Their relative contributions can be evaluated based on the linear trends shown in Figure S3 of the Supplementary Materials. In Figure 5c, we present the frequencies of the dips as functions of the associated concentrations, and the obtained curve shows an almost-linear relation of the transmission dip (or peak) to the concentration.
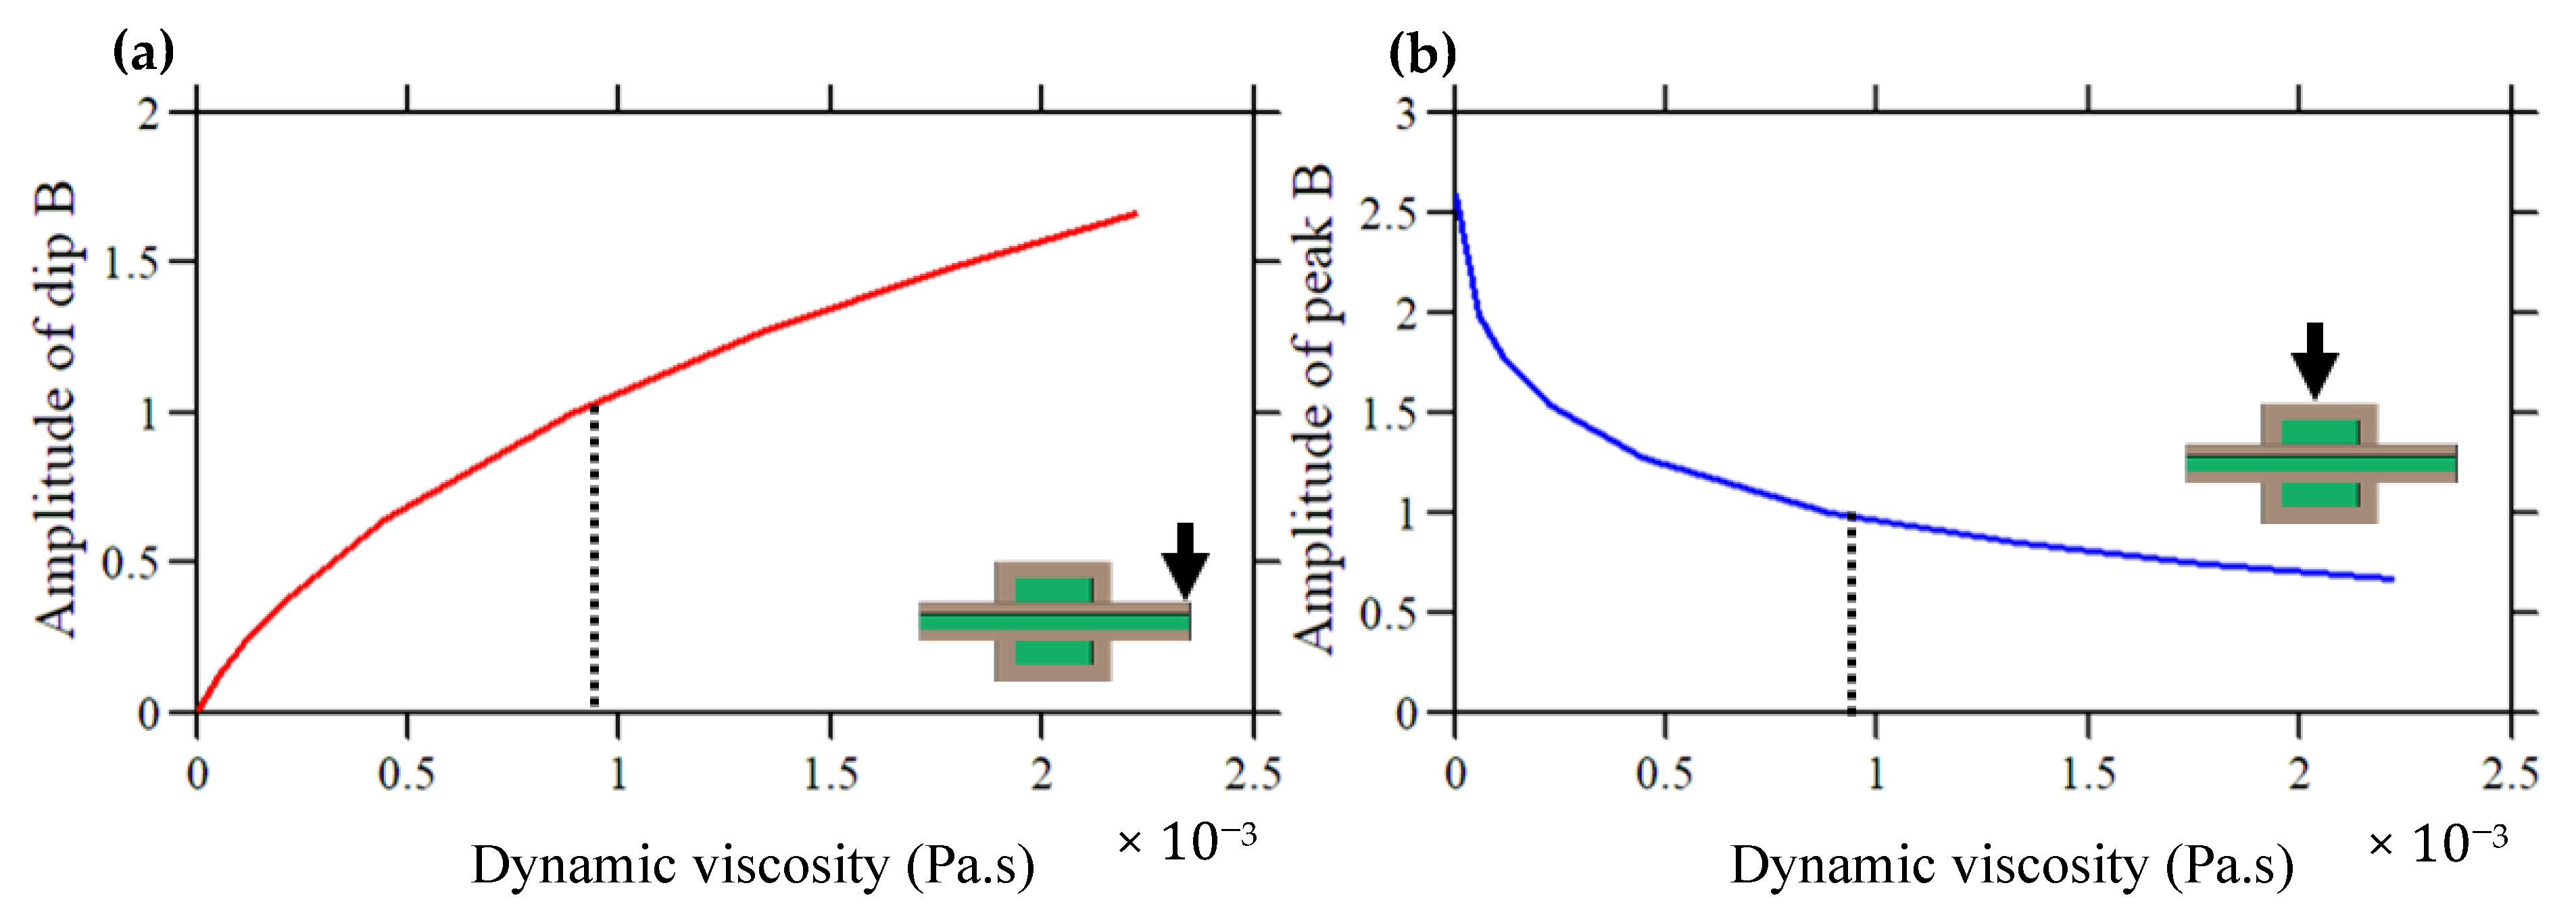
To further evaluate the effects of the viscosity, either from the zero of transmission or from the resonant peak recorded on the surface of the washer, we present the calculated amplitudes for a set of values of the dynamic viscosity in Figure 6. In addition, this representation allows us to estimate the viscosity of the probed liquid from the measurement of the amplitude.
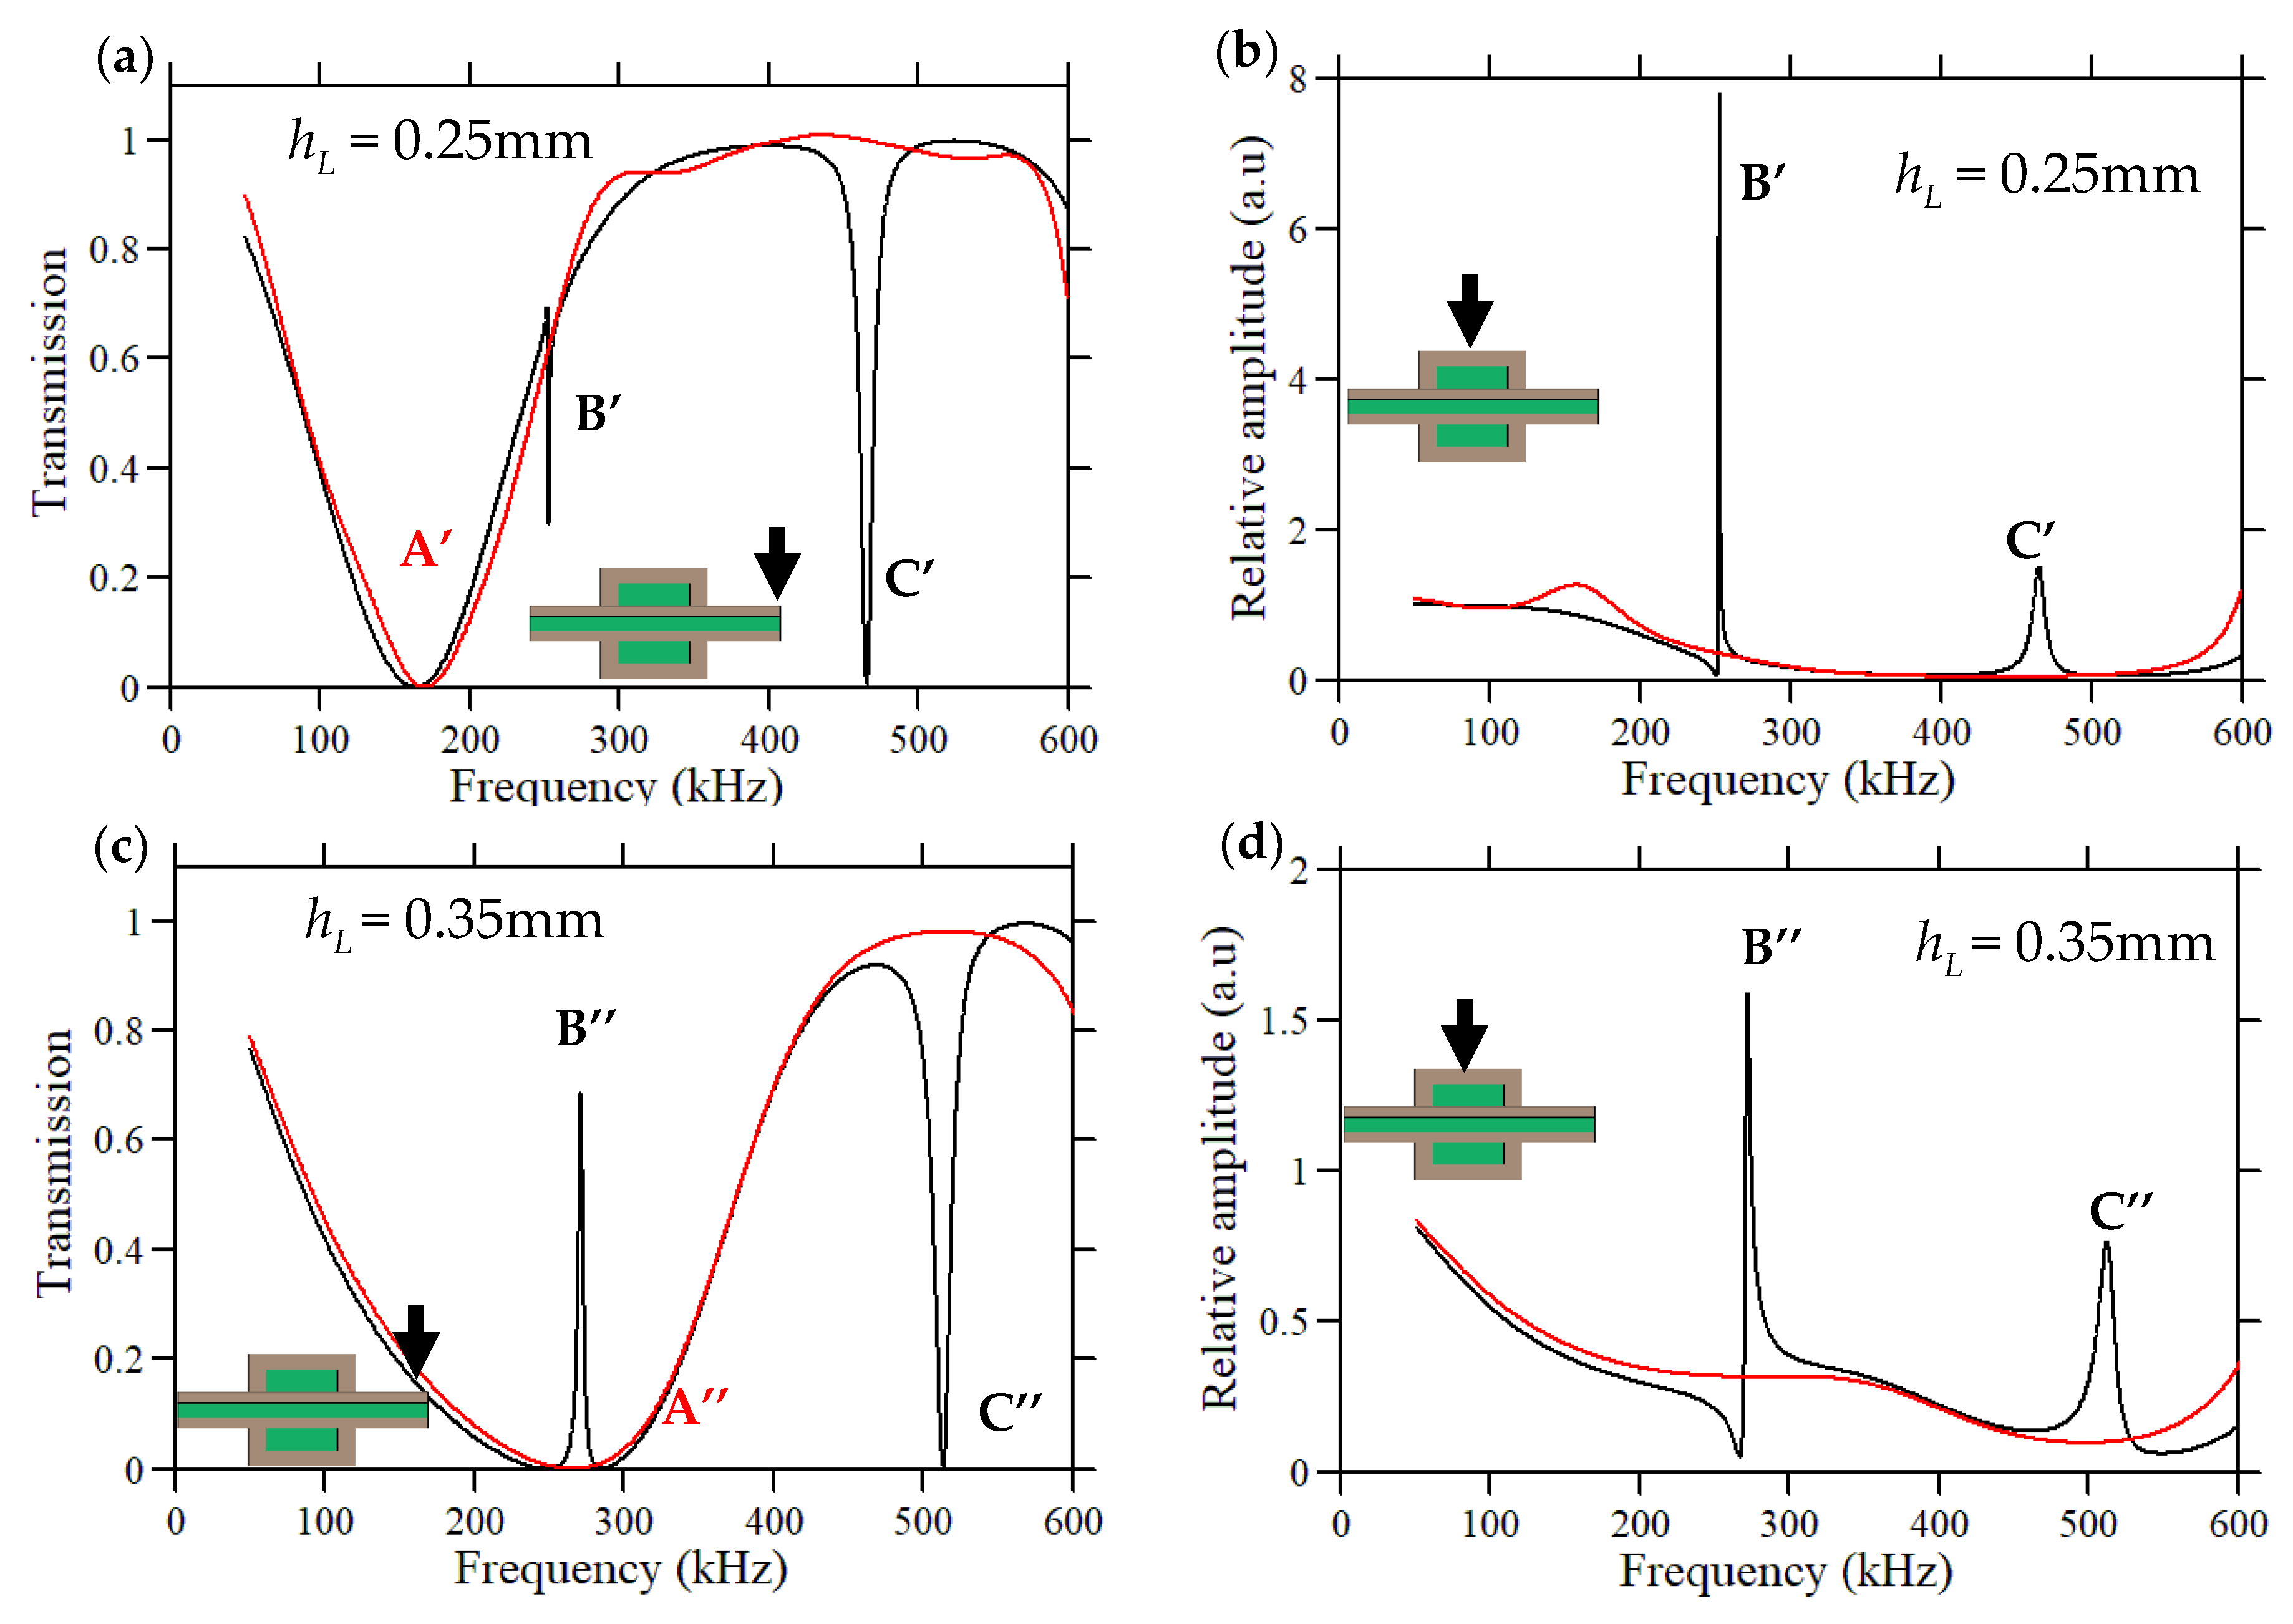
As reported previously (Figure 1), the transmission curve of the proposed design leads to two distinct dips, labelled A and B, corresponding to the solid part of the washer and to the liquid filling the washer, respectively. We demonstrate that with a suitable tuning of the geometric parameters, it becomes possible to move the narrow dip B in the frequency range of the broad dip A. Consequently, the interference between the two discrete states (the narrow dip B and the broad dip A) and the continuum associated with the tube gives rise to a Fano-type resonance, B’ (or B”), as illustrated in Figure 7, with the geometric parameters of the washer being w = 3.4 mm and h = 0.8 mm. Figure 7 represents the transmission and the resonant curve (recorded on the washer surface) for two thicknesses of the solid steel wall of the washer, i.e., hL = 0.25 mm (Figure 7a,b) and 0.35 mm (Figure 7c,d). The black curves correspond to the case where the washer is filled with water, while to the empty case is reported in red. In both cases, the resonance induced by the liquid cavity falls in the frequency range of the broad dip associated with the washer. Indeed, by changing the thickness of the washer, it becomes possible to shift the dip B and slightly widen and shift the dip A so that they overlap. One can then observe either a very high quality asymmetric Fano shape resonance B’ on the side of the broad dip or a symmetric resonance B” at the center of the dip, which is the analogue of an acoustic-induced transparency. This phenomenon of a strong coupling between a broad and a narrow resonance (also called bright and dark modes) to achieve a sharp Fano resonance has also been reported in other contexts (see, for example, [53]).
In addition to dips A and B, one can also see the occurrence of a second resonance, C, at approximately 500 kHz, which is highly confined in the liquid and, therefore, useful for sensing the acoustic properties of the liquid. Table 3 summarizes the sensing characteristics of the washer modes B, B’, B”, C’, and C”, similar to what was presented in Table 1. The FoM considers the dual performance of the sensor in relation to the quality factor and the sensitivity. Considering that criteria, the mode B’ receives the higher score, primarily based on the large Q-factor of this resonance, whereas the resonances C’ and C” exhibit higher sensitivities.
Nevertheless, if the viscosity of the liquid is increased, a high Q-factor can be a handicap in an experimental demonstration (e.g., in the case of a low signal-to-noise ratio) and a compromise may be necessary, considering the lower quality factor with a high sensitivity (see C’, for example). As a consequence, in the case of highly viscous fluids, the vanishing of very narrow peaks can be avoided by increasing the thickness of the washer and, therefore, decreasing the Q-factor. Another way is to increase the inner diameter of the main hollow tube, thus increasing the interaction between the liquids contained in the washer and those in the hollow tube (see Figure S5, supplementary information).

4. Conclusions

We have studied an acoustic liquid sensor made of a hollow cylindrical washer grafted in the middle of a hollow tube, where both the washer and the tube are filled with the liquid to be monitored. Such a device is appropriate in many circumstances where liquids need to be transported in tubular pipes and by canalization. From the transmission curves and displacement field maps analysis, we have determined the nature of the different features present in the transmission spectrum. The latter displays dips associated with the liquid inside the washer, which are highly sensitive to the sound velocity, and thus make the proposed structure relevant for an acoustic liquid sensor. The sensor has been tested successfully on a range of sucrose concentrations in aqueous sugar solutions. We have shown that the dynamic viscosity of a liquid can also be estimated from the amplitude of the dip associated with the liquid. We have also demonstrated that, by adapting the geometric parameters of the washer, it is possible to change the shape of the washer modes in the transmission curves and achieve a Fano-type resonance by superposing the narrow dip associated with the liquid with the broad dip resulting from the solid washer. Finally, the relevant dips can appear as peaks when the associated displacement field is evaluated from the washer surface.

Supplementary Materials

The following supporting information can be downloaded at: https://www.mdpi.com/article/10.3390/cryst12101398/s1, The SI contains six sections, organized as follows: Section S1 presents the COMSOL Multiphysics modules used in the simulation. Section S2 displays the eigenmodes analysis of the proposed structure. In Section S3, we explain that the origin of the dips derives from the excitation of the eigenmodes of the washer, and they are independent of the shape of the main tube. Section S4 shows that both the sound velocity and the mass density are linear to the frequency dip B. Section S5 shows that increasing the structure to a larger scale decreases both the operating frequency range and the viscosity effect. In Section S6, we show that a variation in the Q-factor can be obtained by a variation in the inner radius of the main tube. Figure S1: Eigenmodes of (a) Solid empty washer, (b) Liquid part of the washer, (c) Full system where the total length of the tube is 4 mm. Figure S2: Transmission curve of the acoustic liquid sensor when the tube is (a) solid, (b) hollow and (c) filled with liquid. Figure S3: Frequency of the dip B as a function of (a) the sound velocity (b) the mass density variation. Figure S4: (a) Transmission curve of the acoustic liquid sensor with (red solid line) and without (black solid line) viscosity. (b) Transmission curves around dip B obtained from (b) the transmission, and (b) the recording at the washer surface. Figure S5: (a) Transmission curves of the acoustic liquid sensor, (b) relative amplitude of the displacement field evaluated at the washer surface. The blue, black and red curves correspond respectively to the values of the inner radius of the hollow tube r = 0.1 mm, 0.2 mm and 0.35 mm; Table S1: Sensor quantitative parameters of the acoustic liquid sensor calculated with and without liquid viscosity.

Author Contributions

Conceptualization, Y.P., M.J.V. and B.D.-R.; software, A.G.; validation, A.G., Y.P. and A.L.S.F.; investigation, A.G.; resources, Y.P. and B.D.-R.; writing—original draft preparation, A.G., Y.P. and B.D.-R.; writing—review and editing, Y.P., A.L.S.F., M.J.V., B.B. and B.D.-R.; visualization, M.J.V., and B.B.; supervision, Y.P. and B.D.-R. All authors have read and agreed to the published version of the manuscript.

Funding

This work was performed in the framework of the project ‘Tubular Bell’ supported by the National French Agency ANR-18-CE92-0023 and by the Deutsche Forschungsgemeinschaft (DFG, German Research Foundation) under grants VE 483/2-1 and LU 605/22-1.

Institutional Review Board Statement

Not applicable.

Informed Consent Statement

Not applicable.

Data Availability Statement

The data that support the findings of this study are available from the corresponding author upon reasonable request.

Acknowledgments

The authors acknowledge the support by the nNational French aAgency ANR-18-CE92-0023 and by the Deutsche Forschungsgemeinschaft (DFG, German Research Foundation) under grants VE 483/2-1 and LU 605/22-1.

Conflicts of Interest

The authors declare no conflict of interest.

References

  1. Pujol-Vila, F.; Villa, R.; Alvarez, M. Nanomechanical Sensors as a Tool for Bacteria Detection and Antibiotic Susceptibility Testing. Front. Mech. Eng. 2020, 6, 44. [Google Scholar] [CrossRef]
  2. Alunda, B.O.; Lee, Y.J. Review: Cantilever-Based Sensors for High Speed Atomic Force Microscopy. Sensors 2020, 20, 4784. [Google Scholar] [CrossRef] [PubMed]
  3. Wilson, T.L.; Campbell, G.A.; Mutharasan, R. Viscosity and Density Values from Excitation Level Response of Piezoelectric-Excited Cantilever Sensors. Sens. Actuators Phys. 2007, 138, 44. [Google Scholar] [CrossRef]
  4. Jensen, K.H.; Kim, K.; Zettl, A. An atomic-resolution nanomechanical mass sensor. Nat. Nanotechnol. 2008, 3, 9. [Google Scholar] [CrossRef] [PubMed]
  5. Burg, T.P.; Godin, M.; Knudsen, S.M.; Shen, W.; Carlson, G.; Foster, J.S.; Babcock, K.; Manalis, S.R. Weighing of biomolecules, single cells and single nanoparticles in fluid. Nature 2007, 446, 7139. [Google Scholar] [CrossRef] [Green Version]
  6. Sauerbrey, G. Verwendung von Schwingquarzen zur Wägung Dünner Schichten und zur Mikrowägung. Z. Phys. 1959, 155, 206. [Google Scholar] [CrossRef]
  7. Li, G.; Wu, Y.; Zhang, Y.L.; He, B.; Lin, Q. Ultra-high resolution mass sensing based on an optomechanical nonlinearity. Opt. Express 2022, 30, 15858. [Google Scholar] [CrossRef]
  8. Gupta, A.; Akin, D.; Bashir, R. Single virus particle mass detection using microresonators with nanoscale thickness. Appl. Phys. Lett. 2004, 84, 1976. [Google Scholar] [CrossRef]
  9. Migoń, D.; Wasilewski, T.; Suchy, D. Application of QCM in Peptide and Protein-Based Drug Product Development. Molecules 2020, 25, 3950. [Google Scholar] [CrossRef]
  10. Pohanka, M. Overview of Piezoelectric Biosensors, Immunosensors and DNA Sensors and Their Applications. Materials 2018, 11, 448. [Google Scholar] [CrossRef]
  11. Seed, C.M.; Acharya, B.; Krim, J. Continuum Model Analysis of QCM Nanotribological Data to Obtain Friction Coefficients for 304SS Contacts Lubricated by Water and TiO2 Nanoparticle Suspensions. Front. Mech. Eng. 2020, 6, 72. [Google Scholar] [CrossRef]
  12. Dirri, F.; Palomba, E.; Longobardo, A.; Zampetti, E.; Saggin, B.; Scaccabarozzi, D. A review of quartz crystal microbalances for space applications. Sens. Actuators A Phys. 2019, 287, 48. [Google Scholar] [CrossRef]
  13. Chaste, J.; Eichler, A.; Moser, J.; Ceballos, G.; Rurali, R.; Bachtold, A. A nanomechanical mass sensor with yoctogram resolution. Nat. Nanotechnol. 2012, 7, 5. [Google Scholar] [CrossRef] [PubMed]
  14. Mehdizadeh, E.; Chapin, J.C.; Gonzales, J.M.; Rahafrooz, A.; Abdolvand, R.; Purse, B.W.; Pourkamali, S. Microelectromechanical Disk Resonators for Direct Detection of Liquid-Phase Analytes. Sens. Actuators Phys. 2014, 216, 136. [Google Scholar] [CrossRef]
  15. Mouro, J.; Pinto, R.; Paoletti, P.; Tiribilli, B. Microcantilever: Dynamical Response for Mass Sensing and Fluid Characterization. Sensors 2021, 21, 115. [Google Scholar] [CrossRef]
  16. Zhang, M.; Chen, D.; He, X.; Wang, X. A Hydrodynamic Model for Measuring Fluid Density and Viscosity by Using Quartz Tuning Forks. Sensors 2020, 20, 198. [Google Scholar] [CrossRef] [Green Version]
  17. Manzaneque, T.; Ruiz, V.; Hernando-García, J.; Ababneh, A.; Seidel, H.; Sánchez-Rojas, J.L. Characterization and simulation of the first extensional mode of rectangular micro-plates in liquid media. Appl. Phys. Lett. 2012, 101, 151904. [Google Scholar] [CrossRef]
  18. Cakmak, O.; Ermek, E.; Kilinc, N.; Yaralioglu, G.G.; Urey, H. Precision Density and Viscosity Measurement Using Two Canti-levers with Different Widths. Sens. Actuators Phys. 2015, 232, 141. [Google Scholar] [CrossRef]
  19. Ghatkesar, M.K.; Rakhmatullina, E.; Lang, H.-P.; Gerber, C.; Hegner, M.; Braun, T. Multi-parameter microcantilever sensor for comprehensive characterization of Newtonian fluids. Sens. Actuators B Chem. 2008, 135, 133. [Google Scholar] [CrossRef]
  20. Khan, M.; Schmid, S.; Larsen, P.; Davis, Z.; Yan, W.; Stenby, E.; Boisen, A. Online measurement of mass density and viscosity of pL fluid samples with suspended microchannel resonator. Sens. Actuators B Chem. 2013, 185, 456. [Google Scholar] [CrossRef]
  21. Rust, P.; Cereghetti, D.; Dual, J. A micro-liter viscosity and density sensor for the rheological characterization of DNA solutions in the kilo-hertz range. Lab Chip 2013, 13, 4794. [Google Scholar] [CrossRef]
  22. Ruiz-Díez, V.; Hernando-García, J.; Manzaneque, T.; Kucera, M.; Schmid, U.; Sánchez-Rojas, J.L. Viscous and acoustic losses in length-extensional microplate resonators in liquid media. Appl. Phys. Lett. 2015, 106, 083510. [Google Scholar] [CrossRef]
  23. Kucera, M.; Wistrela, E.; Pfusterschmied, G.; Ruiz-Díez, V.; Manzaneque, T.; Sánchez-Rojas, J.L.; Schalko, J.; Bittner, A.; Schmid, U. Characterization of a Roof Tile-Shaped out-of-Plane Vibrational Mode in Aluminum-Nitride-Actuated Self-Sensing Micro-Resonators for Liquid Monitoring Purposes. Appl. Phys. Lett. 2014, 104, 233501. [Google Scholar] [CrossRef]
  24. Manzaneque, T.; Hernando, J.; Rodríguez-Aragón, L.; Ababneh, A.; Seidel, H.; Schmid, U.; Sánchez-Rojas, J.L. Analysis of the Quality Factor of AlN-Actuated Micro-Resonators in Air and Liquid. Microsyst. Technol. 2010, 16, 837. [Google Scholar] [CrossRef]
  25. Cox, R.; Josse, F.; Heinrich, S.M.; Brand, O.; Dufour, I. Characteristics of laterally vibrating resonant microcantilevers in viscous liquid media. J. Appl. Phys. 2012, 111, 014907. [Google Scholar] [CrossRef] [Green Version]
  26. Kucera, M.; Wistrela, E.; Pfusterschmied, G.; Ruiz-Díez, V.; Sánchez-Rojas, J.L.; Schalko, J.; Bittner, A.; Schmid, U. Characterisation of Multi Roof Tile-Shaped out-of-Plane Vibrational Modes in Aluminium-Nitride-Actuated Self-Sensing Micro-Resonators in Liquid Media. Appl. Phys. Lett. 2015, 107, 053506. [Google Scholar] [CrossRef]
  27. Ten, S.; Hashim, U.; Gopinath, S.; Liu, W.; Foo, K.; Sam, S.; Rahman, S.; Voon, C.; Nordin, A. Highly sensitive Escherichia coli shear horizontal surface acoustic wave biosensor with silicon dioxide nanostructures. Biosens. Bioelectron. 2017, 93, 146. [Google Scholar] [CrossRef]
  28. Di Pietrantonio, F.; Benetti, M.; Cannatà, D.; Verona, E.; Girasole, M.; Fosca, M.; Dinarelli, S.; Staiano, M.; Marzullo, V.; Capo, A.; et al. A Shear horizontal surface acoustic wave biosensor for a rapid and specific detection of d-serine. Sens. Actuators B Chem. 2016, 226, 1–6. [Google Scholar] [CrossRef]
  29. Gao, F.; Al-Qahtani, A.M.; Khelif, A.; Boussaid, F.; Benchabane, S.; Cheng, Y.; El Agnaf, O.; Bermak, A. Towards Acoustic Radiation Free Lamb Wave Resonators for High-Resolution Gravimetric Biosensing. IEEE Sens. J. 2021, 21, 2725. [Google Scholar] [CrossRef]
  30. Lucklum, R.; Mukhin, N.; Rouhani, B.D.; Pennec, Y. Phononic Crystal Sensors: A New Class of Resonant Sensors—Chances and Challenges for the Determination of Liquid Properties. Front. Mech. Eng. 2021, 7, 705194. [Google Scholar] [CrossRef]
  31. Pennec, Y.; Jin, Y.; Djafari-Rouhani, B. Chapter Two—Phononic and Photonic Crystals for Sensing Applications. In Advances in Applied Mechanics; Hussein, M.I., Ed.; Elsevier: Amsterdam, The Netherlands, 2019; Volume 52, pp. 105–145. [Google Scholar]
  32. Lucklum, R.; Li, J. Phononic crystals for liquid sensor applications. Meas. Sci. Technol. 2009, 20, 124014. [Google Scholar] [CrossRef]
  33. Oseev, A.; Zubtsov, M.; Lucklum, R. Gasoline properties determination with phononic crystal cavity sensor. Sens. Actuators B Chem. 2013, 189, 208. [Google Scholar] [CrossRef]
  34. Gharibi, H.; Mehaney, A.; Bahrami, A. High performance design for detecting NaI–water concentrations using a two-dimensional phononic crystal biosensor. J. Phys. D Appl. Phys. 2020, 54, 015304. [Google Scholar] [CrossRef]
  35. Oseev, A.; Mukhin, N.; Lucklum, R.; Zubtsov, M.; Schmidt, M.-P.; Steinmann, U.; Fomin, A.; Kozyrev, A.; Hirsch, S. Study of liquid resonances in solid-liquid composite periodic structures (phononic crystals)—Theoretical investigations and practical application for in-line analysis of conventional petroleum products. Sens. Actuators B Chem. 2018, 257, 469. [Google Scholar] [CrossRef]
  36. Salman, A.; Kaya, O.A.; Cicek, A.; Ulug, B. Low-Concentration Liquid Sensing by an Acoustic Mach–Zehnder Interferometer in a Two-Dimensional Phononic Crystal. J. Phys. Appl. Phys. 2015, 48, 255301. [Google Scholar] [CrossRef]
  37. Mehaney, A.; Shehatah, A.A.; Ahmed, A.M. Modeling of phononic crystal cavity for sensing different biodiesel fuels with high sensitivity. Mater. Chem. Phys. 2021, 257, 123774. [Google Scholar] [CrossRef]
  38. Mukhin, N.; Kutia, M.; Oseev, A.; Steinmann, U.; Palis, S.; Lucklum, R. Narrow Band Solid-Liquid Composite Arrangements: Alternative Solutions for Phononic Crystal-Based Liquid Sensors. Sensors 2019, 19, 3743. [Google Scholar] [CrossRef] [PubMed] [Green Version]
  39. Ke, M.; Zubtsov, M.; Lucklum, R. Sub-wavelength phononic crystal liquid sensor. J. Appl. Phys. 2011, 110, 026101. [Google Scholar] [CrossRef] [Green Version]
  40. Lucklum, R.; Zubtsov, M.; Oseev, A. Phoxonic crystals—A new platform for chemical and biochemical sensors. Anal. Bioanal. Chem. 2013, 405, 6497. [Google Scholar] [CrossRef]
  41. Amoudache, S.; Moiseyenko, R.; Pennec, Y.; Rouhani, B.D.; Khater, A.; Lucklum, R.; Tigrine, R. Optical and acoustic sensing using Fano-like resonances in dual phononic and photonic crystal plate. J. Appl. Phys. 2016, 119, 114502. [Google Scholar] [CrossRef]
  42. Wasmer, P.; Bulling, J.; Prager, J. Ultrasonic Sensor Based on Phononic Crystals; University Library of RWTH: Aachen, Germany, 2019; pp. 969–976. [Google Scholar]
  43. Lucklum, R.; Zubtsov, M.; Pennec, Y. Tubular Bell—New Class of (Bio)Chemical Microsensors. Procedia Eng. 2015, 120, 520. [Google Scholar] [CrossRef] [Green Version]
  44. Gueddida, A.; Pennec, Y.; Zhang, V.; Lucklum, F.; Vellekoop, M.; Mukhin, N.; Bonello, B.; Rouhani, B.D. Tubular phononic crystal sensor. J. Appl. Phys. 2021, 130, 105103. [Google Scholar] [CrossRef]
  45. Mukhin, N.; Lucklum, R. Periodic Tubular Structures and Phononic Crystals towards High-Q Liquid Ultrasonic Inline Sensors for Pipes. Sensors 2021, 21, 5982. [Google Scholar] [CrossRef] [PubMed]
  46. Kanazawa, K.K.; Gordon, J.G. Frequency of a quartz microbalance in contact with liquid. Anal. Chem. 1985, 57, 1770. [Google Scholar] [CrossRef]
  47. Kazys, R.; Sliteris, R.; Raisutis, R.; Zukauskas, E.; Vladisauskas, A.; Mazeika, L. Waveguide sensor for measurement of viscosity of highly viscous fluids. Appl. Phys. Lett. 2013, 103, 204102. [Google Scholar] [CrossRef]
  48. Jakoby, B.; Vellekoop, M.J. Physical Sensors for Liquid Properties. IEEE Sens. J. 2011, 11, 3076. [Google Scholar] [CrossRef]
  49. Weber, J.; Albers, W.M.; Tuppurainen, J.; Link, M.; Gabl, R.; Wersing, W.; Schreiter, M. Shear mode FBARs as highly sensitive liquid biosensors. Sens. Actuators A Phys. 2006, 128, 84. [Google Scholar] [CrossRef]
  50. Zaremanesh, M.; Carpentier, L.; Gharibi, H.; Bahrami, A.; Mehaney, A.; Gueddida, A.; Lucklum, R.; Djafari-Rouhani, B.; Pennec, Y. Temperature biosensor based on triangular lattice phononic crystals. APL Mater. 2021, 9, 061114. [Google Scholar] [CrossRef]
  51. Dukhin, A.S.; Goetz, P.J. Bulk viscosity and compressibility measurement using acoustic spectroscopy. J. Chem. Phys. 2009, 130, 124519. [Google Scholar] [CrossRef]
  52. Randall, C. Ultrasonic measurements of the compressibility of solutions and of solid particles in suspension. Bur. Stand. J. Res. 1932, 8, 79. [Google Scholar] [CrossRef]
  53. Oudich, M.; Djafari-Rouhani, B.; Bonello, B.; Pennec, Y.; Hemaidia, S.; Sarry, F.; Beyssen, D. Rayleigh Waves in Phononic Crystal Made of Multilayered Pillars: Confined Modes, Fano Resonances, and Acoustically Induced Transparency. Phys. Rev. Appl. 2018, 9, 034013. [Google Scholar] [CrossRef]
Figure 1. 2D cross-section view of the acoustic liquid sensor composed of a hollow cylindrical washer surrounding a hollow tube. The green and grey parts, respectively, represent the liquid and solid materials.
Crystals 12 01398 g001
Figure 2. (a) Transmission curves of the acoustic liquid sensor when the washer is filled with water (black curve) and when it is empty (red curve). (b) Maps of the displacement fields of dips A and B.
Crystals 12 01398 g002
Figure 3. Transmission curves calculated in the vicinity of dip B. The black and red curves correspond to the transmission curves without and with the water viscosity, respectively.
Crystals 12 01398 g003
Figure 4. Transmission curves of the acoustic liquid sensor evaluated on (a) the transmission region and (b) the washer. The black curve corresponds to water, while the red and the green curves correspond to a change of 1% in the sound velocity cl and the mass density ρ of the water, respectively.
Crystals 12 01398 g004
Figure 5. (a) Transmission curves calculated for a set of sucrose concentrations in an aqueous sugar solution, with (b) the same as (a) for a measurement on the surface of the washer. (c) Dip frequencies as functions of the associated sugar concentration.
Crystals 12 01398 g005
Figure 6. Amplitude of mode B of the washer as a function of the dynamic viscosity of the liquid, evaluated from (a) the transmission and (b) the surface of the washer. The dotted line indicates the value of the dynamic viscosity of the water ( μ = 8.9 × 10 4   Pa · s ) . The curves are normalized to their values at the water’s viscosity.
Crystals 12 01398 g006
Figure 7. Spectra representation evaluated from (a,c) the transmission region at the outside and (b,d) on the washer surface.
Crystals 12 01398 g007
Table 1. Quality factor, sensitivity, and figure of merit of the sensor, including or excluding the viscosity.
Washer Mode BQuality FactorSensitivityFoM (m/s)−1
B(η and ηβ)193241 Hz/(m/s)0.11
(η = 0 and ηβ = 0)328230 Hz/(m/s)0.18
Table 2. Mass density and sound velocity of the different concentrations of the sucrose aqueous sugar solution [52].
Concentration
(g Sucrose/100 g Solution)
Mass Density (kg/m3)Sound Velocity (m/s)
09951509
0.879991512
3.9510111520
7.8810261531
11.9110431543
20.1310781572
30.4211251615
Table 3. Quantitative characteristics of the acoustic liquid sensor.
Washer ModeQuality FactorSensitivity (Hz/(m/s))FoM
B (from Table 1)193241 0.11
B’3161450.18
C’502210.023
B”451730.029
C”342840.019
Publisher’s Note: MDPI stays neutral with regard to jurisdictional claims in published maps and institutional affiliations.