
High Thermal Stability and Color Purity of Y2SrAl4SiO12: Eu3+ Garnet-Variant-Structured Phosphor for Warm White Light LED-Lamp


 ,
,  ,
, 
 and
and 
Abstract
:1. Introduction
2. Experimental Procedures
3. Results and Discussion
4. Conclusions
Supplementary Materials
Author Contributions
Funding
Institutional Review Board Statement
Informed Consent Statement
Data Availability Statement
Acknowledgments
Conflicts of Interest
References
- Qian, Y.; Zhu, D.; Pu, Y. A Zero-Thermal-Quenching Phosphor Sr3La(AlO)3(BO3)4: Dy3+ for Near Ultraviolet Excitation white-LEDs. J. Lumin. 2022, 243, 118610. [Google Scholar] [CrossRef]
- Wang, J.; Guo, J.; Lv, Q.; Ma, Z.; Feng, X.; Lu, Y.; Gao, J.; Chen, W.; Deng, B.; Yu, R. Spectroscopic Investigation of the Novel Orange-Red Phosphor Ca3La2W2O12: Sm3+ with the High Color Purity for w-LED Applications. J. Lumin. 2022, 241, 118459. [Google Scholar] [CrossRef]
- Shim, S.; Park, W.B.; Kim, M.; Lee, J.W.; Singh, S.P.; Sohn, K.S. Cyan-Light-Emitting Chalcogenometallate Phosphor, KGaS2: Eu2+, for Phosphor-Converted White Light-Emitting Diodes. Inorg. Chem. 2021, 60, 6047–6056. [Google Scholar] [CrossRef]
- Huang, X.; Liang, J.; Rtimi, S.; Devakumar, B.; Zhang, Z. Ultra-High Color Rendering Warm-White Light-Emitting Diodes Based On an Efficient Green-Emitting Garnet Phosphor for Solid-State Lighting. Chem. Eng. J. 2021, 405, 126950. [Google Scholar] [CrossRef]
- Liang, J.; Devakumar, B.; Sun, L.; Wang, S.; Sun, Q.; Huang, X. Full-Visible-Spectrum Lighting Enabled by an Excellent Cyan-Emitting Garnet Phosphor. J. Mater. Chem. C 2020, 8, 4934–4943. [Google Scholar] [CrossRef]
- Yang, Z.; Yang, Y.; Li, X.; Li, X. Combustion synthesis of Y2O2S: Eu3+ phosphors. ICO20 Mater. Nanostruct. SPIE 2006, 6029, 441–446. [Google Scholar]
- Yang, X.; Xing, X.J.; Liu, Y.F.; Mu, C.H.; Van Bui, H.; Zhang, Z.W.; Agathopoulos, S.; Xu, X.; Yin, L.J. A new thermal degradation mechanism of red Sr2Si5N8: Eu phosphor: From the view of microstructural evolution. Opt. Mater. 2021, 121, 111506. [Google Scholar] [CrossRef]
- Uheda, K.; Hirosaki, N.; Yamamoto, Y.; Naito, A.; Nakajima, T.; Yamamoto, H. Luminescence properties of a red phosphor, CaAlSiN3: Eu2+, for white light-emitting diodes. Electrochem. Solid-State Lett. 2006, 9, H22. [Google Scholar] [CrossRef]
- Wang, M.; Cheng, T.; Dou, R.; Zhang, Q.; Jiang, H. Superior performance of a 2 kHz pulse Nd: YAG laser based on a gradient-doped crystal. Photonics Res. 2021, 9, 1191–1196. [Google Scholar]
- Pan, Y.; Wu, M.; Su, Q. Tailored photoluminescence of YAG: Ce phosphor through various methods. J. Phys. Chem. Solids 2004, 65, 845–850. [Google Scholar] [CrossRef]
- Tian, Y.; Chen, J.; Yi, X.; Jiang, R.; Lin, H.; Chen, L.; Zhou, S. Unravel the effect of lattice distortion on the 4f-5d excitation of Ce3+ in garnet phosphors. J. Alloys Compd. 2022, 907, 164412. [Google Scholar] [CrossRef]
- Onishi, Y.; Nakamura, T.; Sone, H.; Adachi, S. Synthesis and properties of Tb3Al5O12: Eu3+ garnet phosphor. J. Lumin. 2018, 197, 242–247. [Google Scholar] [CrossRef]
- Ye, S.; Xiao, F.; Pan, Y.X.; Ma, Y.Y.; Zhang, Q.Y. Phosphors in phosphor-converted white light-emitting diodes: Recent advances in materials, techniques and properties. Mater. Sci. Eng. R Rep. 2010, 71, 1–34. [Google Scholar] [CrossRef]
- Raju, G.S.R.; Jung, H.C.; Park, J.Y.; Chung, J.W.; Moon, B.K.; Jeong, J.H.; Son, S.M.; Kim, J.H. Sintering temperature effect and luminescent properties of Dy3+: YAG nanophosphor. J. Optoelectron. Adv. Mater. 2010, 12, 1273–1278. [Google Scholar]
- Chen, D.; Zhou, Y.; Xu, W.; Zhong, J.; Ji, Z.; Xiang, W. Enhanced luminescence of Mn4+: Y3Al5O12 red phosphor via impurity doping. J. Mater. Chem. C 2016, 4, 1704–1712. [Google Scholar] [CrossRef]
- Wang, X.; Zhao, Z.; Wu, Q.; Li, Y.; Wang, Y. A Garnet-Based Ca2YZr2Al3O12: Eu3+ Red-Emitting Phosphor for n-UV Light Emitting Diodes and Field Emission Displays: Electronic Structure and Luminescence Properties. Inorg. Chem. 2016, 55, 11072–11077. [Google Scholar] [CrossRef]
- Li, Y.; Wei, Q.; Chen, H.; Wang, Y. A Novel Red-Emitting Ca2GdHf2Al3O12: Eu3+ Phosphor for Light-Emitting Didoes and Field Emission Display. J. Alloys Compd. 2021, 864, 158840. [Google Scholar] [CrossRef]
- Hussain, F.; Khesro, A.; Lu, Z.; Alotaibi, N.; Mohamad, A.A.; Wang, G.; Wang, D.; Zhou, D. Acceptor and donor dopants in potassium sodium niobate based ceramics. Front. Mater. 2020, 7, 160. [Google Scholar] [CrossRef]
- Xia, Z.; Meijerink, A. Ce3+-Doped garnet phosphors: Composition modification, luminescence properties and applications. Chem. Soc. Rev. 2017, 46, 275–299. [Google Scholar] [CrossRef]
- Kadam, A.R.; Kohale, R.L.; Mishra, G.C.; Dhoble, S.J. Eu(III)-Doped Tri-Calcium Ca3(1−X−Z)MZ(PO4)2AX: X Host Array: Optical Investigations of Down-Conversion Red Phosphor for Boosting Display Intensity and High Color Purity. New J. Chem. 2021, 45, 7285–7307. [Google Scholar] [CrossRef]
- Gu, F.; Li, C.Z.; Jiang, H.B. Combustion synthesis and photoluminescence of MgO: Eu3+ nanocrystals with Li+ addition. J. Cryst. Growth 2006, 289, 400–404. [Google Scholar] [CrossRef]
- Wen, H.; Jia, G.; Duan, C.-K.; Tanner, P.A. Understanding Eu3+ emission spectra in glass. Phys. Chem. Chem. Phys. 2010, 12, 9933–9937. [Google Scholar] [CrossRef] [PubMed]
- Ma, N.; Li, W.; Devakumar, B.; Huang, X. Dazzling Red-Emitting Europium (III) Ion-Doped Ca2LaHf2Al3O12 Garnet-Type Phosphor Materials with Potential Application in Solid-State White Lighting. Inorg. Chem. 2022, 61, 6898–6909. [Google Scholar] [CrossRef] [PubMed]
- Yun, X.; Zhou, J.; Zhu, Y.; Li, X.; Liu, S.; Xu, D. A Potentially Multifunctional Double-Perovskite Sr2ScTaO6: Mn4+, Eu3+ Phosphor for Optical Temperature Sensing and Indoor Plant Growth Lighting. J. Lumin. 2022, 244, 118724. [Google Scholar] [CrossRef]
- Blasse, G. Energy transfer in oxidic phosphors. Philips Res. Rep. 1969, 24, 131. [Google Scholar] [CrossRef]
- Van Uitert, L.G. Characterization of energy transfer interactions between rare earth ions. J. Electrochem. Soc. 1967, 114, 1048. [Google Scholar] [CrossRef]
- Dexter, D.L. A theory of sensitized luminescence in solids. J. Chem. Phys. 1953, 21, 836–850. [Google Scholar] [CrossRef]
- Laidler, K.J. The development of the Arrhenius equation. J. Chem. Educ. 1984, 61, 494. [Google Scholar] [CrossRef]
- Chen, Y.; Shen, Y.; Zhou, L.; Lin, J.; Fu, J.; Fang, Q.; Ye, R.; Shen, Y.; Xu, S.; Lei, L.; et al. Temperature-dependent luminescence of Bi3+, Eu3+ co-activated La2MgGeO6 phosphor for dual-mode optical thermometry. J. Lumin. 2022, 249, 118995. [Google Scholar] [CrossRef]
- Yao, J.; Zhu, Q.; Li, J.G. Garnet transparent ceramic film of Y3Al5O12: Eu3+ fabricated through an interface reaction of layered rare-earth hydroxide nanosheets on amorphous alumina. Appl. Surf. Sci. 2022, 579, 152226. [Google Scholar] [CrossRef]
- Zhang, S.; Zhang, P.; Liu, X.; Yang, Z.; Huang, Y.; Seo, H.J. A red-emitting phosphor of Li5La3Ti2O12: Eu3+ with garnet-like structure and near-UV/blue light excitation. J. Lumin. 2018, 203, 152–159. [Google Scholar] [CrossRef]
- Wu, Y.; Zhao, F.; Ruan, K.; Zhang, H.; Piao, X. Synthesis of (Ca, Zn) TiO3: Eu3+ red phosphors via the sol–gel method and their luminescence properties. Chem. Phys. Lett. 2015, 633, 234–240. [Google Scholar] [CrossRef]
- Liu, B.; Wang, K.; Li, J.; Liu, Z. The synthesis and luminescent properties of Eu3+ doped Li5La3Ta2O12 garnet phosphor with enhanced red emission and thermally stable. J. Solid State Chem. 2022, 305, 122658. [Google Scholar] [CrossRef]
- Hua, Y.; Ran, W.; Yu, J.S. Excellent photoluminescence and cathodoluminescence properties in Eu3+-activated Sr2LaNbO6 materials for multifunctional applications. Chem. Eng. J. 2021, 406, 127154. [Google Scholar] [CrossRef]
- Huang, X.; Wang, S.; Liang, J.; Devakumar, B. Eu3+-activated Ca2YTaO6 double-perovskite compound: A novel highly efficient red-esmitting phosphor for near-UV-excited warm w-LEDs. J. Lumin. 2020, 226, 117408. [Google Scholar] [CrossRef]
- Wyszecki, G.; Stiles, W.S. Color Science; Wiley: New York, NY, USA, 1982. [Google Scholar]
- McCamy, C.S. Correlated color temperature as an explicit function of chromaticity coordinates. Color Res. Appl. 1992, 17, 142–144. [Google Scholar] [CrossRef]


| Materials | Thermal Decay Ratio (%) | Temperature (K) | ΔE (eV) | Ref |
|---|---|---|---|---|
| Y3Al5O12 | 85.2 | 303→423 | 0.207 | [30] |
| Li5La3Ti2O12 | 75 | 293→423 | 0.42 | [31] |
| CaTiO3 | 70 | 293→423 | 0.28452 | [32] |
| Li5La3Ta2O12 | 63 | 293→423 | 0.20 | [33] |
| Sr2LaNbO6 | 62.99 | 303→423 | 0.25 | [34] |
| Ca2YTaO6 | 61 | 303→423 | 0.13 | [35] |
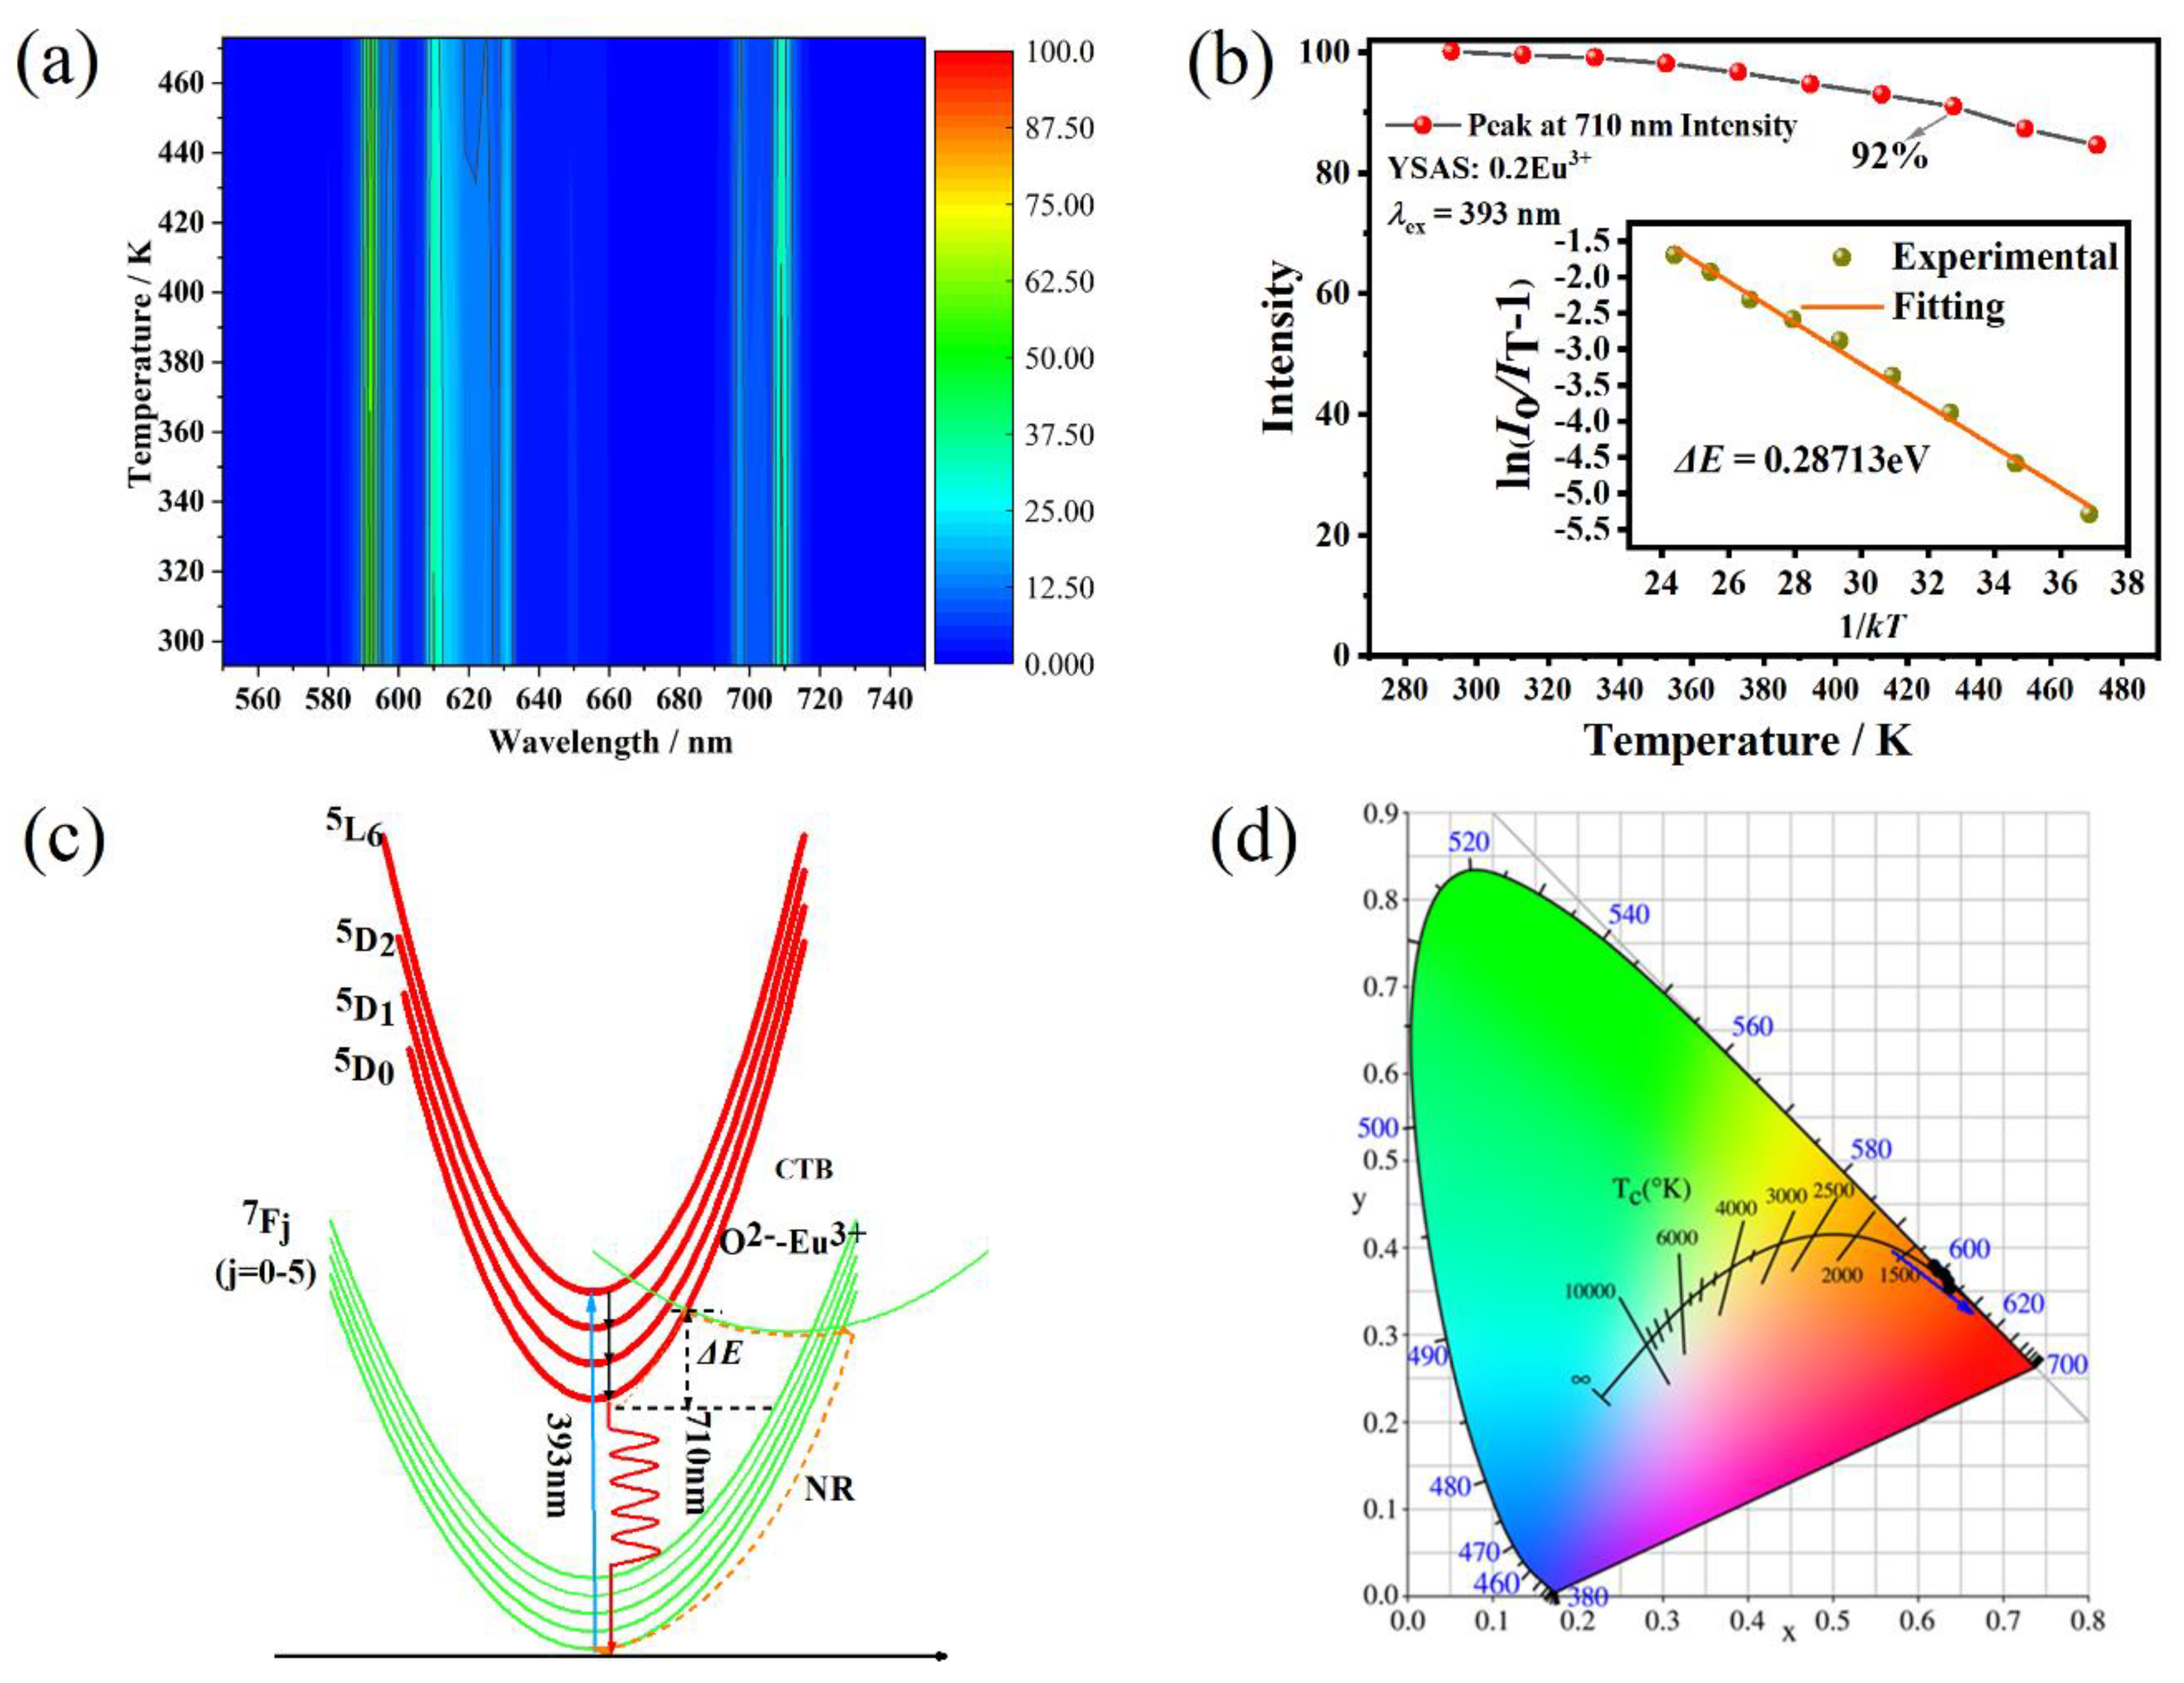
| YSAS | 92 | 293→433 | 0.28713 | This work |
| x | CIE (x, y) | Color Purity (%) | CCT (K) |
|---|---|---|---|
| 0.05 | (0.6247, 0.3748) | 87.8 | 1902 |
| 0.1 | (0.6289, 0.3706) | 88.7 | 1974 |
| 0.15 | (0.6318, 0.3678) | 89.4 | 2030 |
| 0.2 | (0.6346, 0.3650) | 90.0 | 2092 |
| 0.25 | (0.6359, 0.3637) | 90.1 | 2123 |
| 0.35 | (0.6390, 0.3606) | 91.0 | 2204 |
Publisher’s Note: MDPI stays neutral with regard to jurisdictional claims in published maps and institutional affiliations. |
© 2022 by the authors. Licensee MDPI, Basel, Switzerland. This article is an open access article distributed under the terms and conditions of the Creative Commons Attribution (CC BY) license (https://creativecommons.org/licenses/by/4.0/).
Share and Cite
Chen, X.; Xu, Q.; Hussain, F.; Yang, C.; Sheng, W.; Luo, X.; Liu, B.; Sun, S.; Wang, D.; Song, K. High Thermal Stability and Color Purity of Y2SrAl4SiO12: Eu3+ Garnet-Variant-Structured Phosphor for Warm White Light LED-Lamp. Crystals 2022, 12, 1382. https://doi.org/10.3390/cryst12101382
Chen X, Xu Q, Hussain F, Yang C, Sheng W, Luo X, Liu B, Sun S, Wang D, Song K. High Thermal Stability and Color Purity of Y2SrAl4SiO12: Eu3+ Garnet-Variant-Structured Phosphor for Warm White Light LED-Lamp. Crystals. 2022; 12(10):1382. https://doi.org/10.3390/cryst12101382
Chicago/Turabian StyleChen, Xinhua, Qingliang Xu, Fayaz Hussain, Chen Yang, Weiqin Sheng, Xinjiang Luo, Bing Liu, Shikuan Sun, Dawei Wang, and Kaixin Song. 2022. "High Thermal Stability and Color Purity of Y2SrAl4SiO12: Eu3+ Garnet-Variant-Structured Phosphor for Warm White Light LED-Lamp" Crystals 12, no. 10: 1382. https://doi.org/10.3390/cryst12101382
APA StyleChen, X., Xu, Q., Hussain, F., Yang, C., Sheng, W., Luo, X., Liu, B., Sun, S., Wang, D., & Song, K. (2022). High Thermal Stability and Color Purity of Y2SrAl4SiO12: Eu3+ Garnet-Variant-Structured Phosphor for Warm White Light LED-Lamp. Crystals, 12(10), 1382. https://doi.org/10.3390/cryst12101382