Article

Study on Precipitation Processes and Phase Transformation Kinetics of Iron Phosphate Dihydrate

1
State Key Laboratory of Chemical Engineering, School of Chemical Engineering and Technology, Tianjin University, Tianjin 300072, China
2
Department of Chemical Engineering, South Kensington Campus, Imperial College London, London SW7 2AZ, UK
3
The Co-Innovation Center of Chemistry and Chemical Engineering of Tianjin, Tianjin University, Tianjin 300072, China
*
Author to whom correspondence should be addressed.
Crystals 2022, 12(10), 1369; https://doi.org/10.3390/cryst12101369
Submission received: 5 September 2022 / Revised: 21 September 2022 / Accepted: 22 September 2022 / Published: 27 September 2022
(This article belongs to the Special Issue Polymorphism in Crystals)

Abstract

:
The process of the phase transformation from amorphous to crystalline FePO4·2H2O was studied in this research. It was found that Fe and P are predominantly present as FeHPO4+ and FeH2PO42+ and an induction period exists during the transition from amorphous to monoclinic form. The induction period and the time required for phase transformation were shortened with the increased temperature. Phase transformation could be kinetically described by the Johnson–Mehl–Avrami (JMA) dynamics model. The dissolution rate of amorphous FePO4·2H2O is the rate-limiting step of this process. the activation energy of phase transformation is calculated to be 9.619 kJ/mol. The results in this study provided more guidelines for the regulation of FePO4·2H2O precursors by precipitation method.

1. Introduction

At present, the demand for rechargeable lithium batteries for electric vehicles is growing with increased energy efficiency requirements. Creating composite electrode materials with the required properties is a promising direction in battery technology and engineering [1,2,3,4]. Researchers have proposed numerous techniques for fabricating the positive electrode LiFePO4 of reversible lithium batteries [5]. So far, the precursor of LiFePO4―FePO4 was mainly prepared by the: (1) solvent gel method [6], (2) hydrothermal method [7], (3) coprecipitation method [8], and others. Zhang et al. [9] synthesized nano-sized FePO4 by a modified sol–gel method, which is convenient for controlling the carbon content and size of LiFePO4. Chen et al. [10] produced FePO4 microspheres with carbon nanotube embedded (FePO4/CNT), which enhanced their electronic conductivity by a hydrothermal process. Tong et al. [11] prepared iron phosphate with various morphologies and crystalline structures by coupling precipitation and aging. Coprecipitation is the most advantageous method for synthesizing iron phosphate owing to its simple operation, economic efficiency, and environmental friendliness among these methods [5].
FePO4·2H2O acts as a transient precursor in the coprecipitation method to obtain FePO4. Many researchers have reported the preparation of FePO4·2H2O with various structures and morphologies, which were achieved by altering the sources of Fe and P as well as reaction conditions [11,12]. For example, Guo et al. [13] found that iron phosphate precursor with different morphologies can be obtained at low temperature using Fe2(SO4)3, H3PO4 and different additives. Jiang et al. [14] synthesized irregular polygon shapes of amorphous FePO4·2H2O, and elongated sticks of crystalline FePO4·2H2O by refluxing amorphous FePO4·2H2O at 100 °C for 2 h using Fe(NH4)2(SO4)2·6H2O, NH4H2PO4, and H2O2 as raw materials. As the important precursor of LiFePO4 cathode material, the properties of FePO4 have to be controlled in the preparation process, such as the specific amount of iron–phosphorus ratio, high specific surface area, and tap density [15]. By understanding the mechanism and kinetics of the preparation process, the properties of FePO4·2H2O can be better controlled and the quality of FePO4 can be further improved. Many studies have demonstrated that the crystal structure of FePO4 significantly impacts the morphology of FePO4 [16,17,18]. However, insufficient literature exists regarding the phase transformation on this process.
This paper studied the precipitating process of FePO4·2H2O using ferrous sulfate heptahydrate, phosphoric acid, and hydrogen peroxide as reactants, and the morphology and phase transformation kinetics of FePO4·2H2O from amorphous to monoclinic in acidic solution (pH < 1) were investigated. The changes in the morphology, structure, and composition of the precipitate during the phase transformation were also tracked. These studies provide ideas and a basis for further improvement in the properties of iron phosphate as a potential electrode material precursor.

2. Materials and Methods

2.1. Chemicals

All the reagents used in experiments containing ferric sulfate septihydrate (FeSO4·7H2O), hydrogen peroxide (H2O2), monoclinic iron phosphate dihydrate (FePO4·2H2O), and phosphoric acid (H3PO4) were of analytical reagent grade. Deionized water was used throughout the process. All these chemicals were purchased from Kaimart Tianjin Chemical Technology Co., Ltd (Tianjin, China). and were used directly without further purification. Detailed information could be seen in Table 1.

2.2. Experimental Procedure

Ferrous sulfate septihydrate and phosphoric acid at a molar ratio of 1:1.05 were dissolved with deionized water in a 500 mL jacketed glass reactor coupled with a thermostatic bath. Excess phosphorus was used to make sure the iron precipitated completely during the reaction. The mixture was then stirred by a stirrer module until ferrous sulfate septihydrate dissolved completely. The peristaltic pump added a certain amount of hydrogen peroxide, the mole of which was round 0.6 time the ferrous, to make Fe2+ iron oxidized completely. When the solution temperature was raised to 60 °C the precipitation was generated from the solution. The solution temperature was kept at 90 °C for 8 h and a phase transformation occurred during this process. The precipitation was filtered out at the end of the experiment. The experimental setup is shown in Figure 1 and detailed information of the solution can be seen in Table 2.

2.3. Preparation of Standard Solution for RAMAN Analysis

The difference of the two polymorphs in solution can be shown by Raman spectra through the characteristic peaks. Constructing a standard line using Raman spectra of the prepared polymorphic mixtures to quantitatively analyze changes of monoclinic FePO4·2H2O during the phase transformation process: the standard solution was a mixture of amorphous and monoclinic FePO4·2H2O at a predetermined concentration of H2SO4. The mole fraction of monoclinic FePO4·2H2O ranged from 25% to 75%. The temperature of solution was raised to 90 °C. Each measurement was carried out in three times. There was no polymorphic transformation that occurred for 1–3 min during detection, which can be indicated by Raman spectra. The function that connected the corresponding peak intensity to the mass fraction of monoclinic FePO4·2H2O could then be determined.

2.4. Characterization

2.4.1. Powder X-ray Diffraction (PXRD) Analysis

The samples collected during the process were analyzed by X-ray diffraction (Rigaku D/MAX-2500) with Cu Kα radiation (λ = 1.5405 Å) by Ni filter. The scanning angle ranged from 2° to 40° at a rate of 8°/min. The characterization was carried out at a voltage of 45 kV and a current of 40 mA. The melting properties of FePO4·2H2O are measured by thermal gravimetric analyzer (TG, MettlerToledo, Zurich, Switzerland). The sample (5−10 mg) was heated at a rate of 10 K/min from 303.15 K to 1073.15 K under a nitrogen atmosphere.

2.4.2. Morphology Characterization

The morphologies of products were observed by scanning electron microscopy (SEM; JSM-7401F, 3 kV) after being sputter-coated with Au/Pd and transmission electron microscopy (TEM; JEM-2010, 120 kV) using an accelerating voltage of 100 kV.

2.4.3. Spectra Characterization

The changes of functional groups in precipitation during the reaction were detected by FTIR (Bio-rad FTS 6000), which scanned with wavenumber from 400 to 4000 cm−1; Raman analysis (RFS 100/S) used a 1064 nm Nd-YAG laser and the scanning step was 2 cm−1 with a 50 kHz scanning frequency, utilizing fiber-coupled probe optic technology for in situ monitoring. This system was equipped with a probe head for direct insertion or non-contact sampling.

3. Results and Discussion

3.1. The Involved Precipitation Reactions Analysis

The complexation of Fe3+ with phosphate is complicated in solution [19,20]. In this work, complexation ions such as Fe(PO4)23−, Fe(OH)PO4, FeH3(PO4)33−, Fe(PO4)23−, Fe2PO43+, etc., were not taken into account owing to small equilibrium constants (<10−8). The possible reactions in solution and corresponding equilibrium constants are listed in Table 3 [21,22,23]. On the basis of mass conservation and reactions in Table 3, the mass balance of Fe and P can be expressed, as given in formulas (1) and (2). The total concentration of Fe and P was measured by redox titration of potassium dichromate and the gravimetric method. According to pH and the equilibrium constants of possible reactions, the corresponding concentration of complexation ions can be represented by free Fe3+ ion and H3PO4 molecules.
[Fe]T = [Fe3+] + [FeHPO4+] + [FeH2PO42+] + [FeH2(PO4)2−)] + [FeH4(PO4)2+] + [FeH8(PO4)4] + 2 × [Fe2HPO44+] + 2 × [Fe2H3(PO4)23+] + 3 × [Fe3H6(PO4)43+]
[P]T = [H3PO4] + [H2PO4] + [HPO42−] + [PO43−] + [FeHPO4+] + [FeH2PO42+] + 2 × [FeH2(PO4)22−)] + 2 × [FeH4 (PO4)2+)] + 4 × [FeH8 (PO4)4] + [Fe2H(PO4)4+)] + 2 × [Fe2H3 (PO4)23+] + 4 × [Fe3H6(PO4)43+]
where [Fe]T and [P]T is the total concentration of Fe and P in solution; [x] is the concentration of x; x is the species of complexation.
And the concentration of free Fe3+ ion and H3PO4 molecules, under pH ranging from 0.2 to 1.3, can be calculated by the total concentration and mass balance of Fe and P. The equations for the concentration of Fe3+ and H3PO
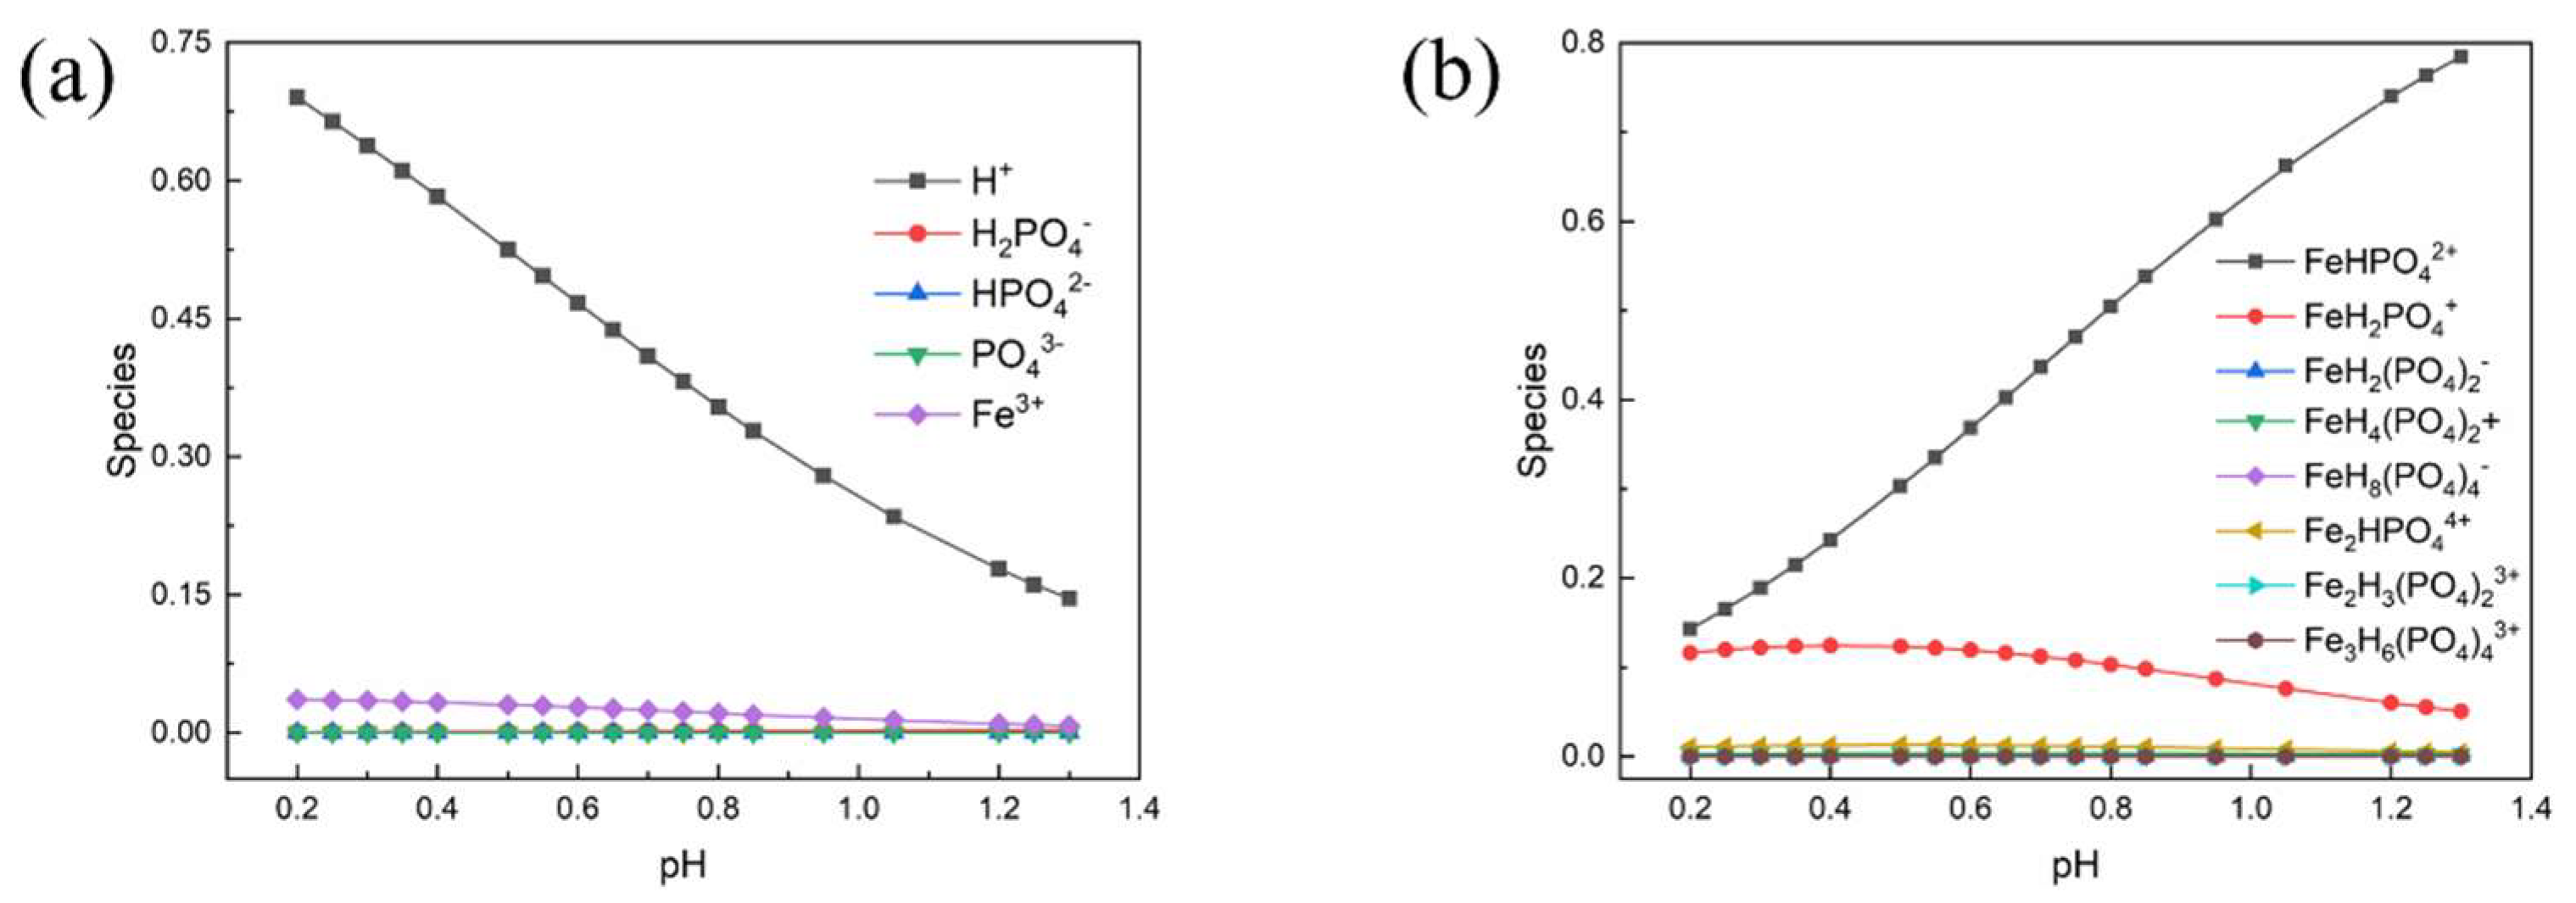
4 were presented in Formulas (3) and (4). In addition, the concentration of various complexation species with phosphate groups under different pH environments is listed in Tables S1–S4 (Supporting Information). The distribution of the various complexation species is presented in Figure 2.
  x + A + B x y + C + D x y 2 + E x y 4 + 2 F x 2 y + 2 G x 2 y 2 + 3 H x 3 y 4 = 0.293
1 + a + b y + A + B x y + 2 C + D x y 2 + 4 E x y 4 + F x 2 y + 2 G x 2 y 2 + 4 H x 3 y 4 = 0.2978
where x is the concentration of Fe3+ and y is the concentration of H3PO4; a, b, A, B, C, D, E, F, G, H are the constants in different pH environment based on the equilibrium constants of possible reactions respectively.
It can be found that Fe and P are predominantly presented as FeHPO4+ and FeH2PO42+ in the pH range. The pH of the mixture at room temperature in this work is around 0.85 and the proportion of main complexation ions are calculated to be 53.82% FeHPO4+, and 9.79% FeH2PO42+. Therefore, the main precipitation reactions, even during the process of raising the temperature, can be written as the following reactions in Table 4 (the pH decreased with the increase of temperature).

3.2. Insight into the Evolution of the Precipitate

3.2.1. The Change of Structure

The crystal structure and phase purity of the samples were analyzed by PXRD. The powder X-ray diffraction pattern was shown in Figure 3. There were not any intensive diffraction peaks detected before 235 min, indicating that the precipitation initially produced by the reaction was amorphous. After 235 min, new characteristic diffraction peaks appeared (17.18°, 18.88°, and 19.94°, respectively), and the intensity of these peaks increased with the evolution of time. The results demonstrated that there was a phase transition during the reaction and the crystallinity gradually increased over time. Since the PXRD pattern of samples after 235 min is consistent with standard data of JCPDS file No. 15-0390, it is found that the transformed product possessed monoclinic structure and a space group of P21/n [15,24,25,26]. The crystal structure of monoclinic FePO4·2H2O was shown in Figure 4.

3.2.2. Change of Morphology

The morphology during the reaction was studied by SEM and TEM as shown in Figure 5 and Figure 6. At the initial stage of the reaction, the sample mainly exists in the form of amorphous microsheet agglomeration and the average size is about 2 μm to 4 μm, as shown in Figure 5a and Figure 6a. The size of microsheets gradually decreased and the extent of agglomeration increased slightly. They grew and agglomerated together by continuous dissolution–recrystallization. Figure 5c shows that plentiful nanoparticles formed on the surface of agglomerates at 150 min, which were found to be a mixture of mostly amorphous and little crystalline FePO4·2H2O by selected area electron diffraction (SAED)—which shows an inconspicuous diffraction pattern, as shown in Figure 6b. But there is still no obvious diffraction peak of powder X-ray diffraction pattern at this time, at which the content of crystalline FePO4·2H2O is lower than the minimum content standard of powder X-ray diffraction analysis. The monoclinic FePO4·2H2O nuclei on the active surface of amorphous agglomerates gradually grew and agglomerated accompanying the dissolution of amorphous FePO4·2H2O into ions. Ultimately, dense spheroid-like monoclinic FePO4·2H2O particles were produced continuously by dissolution–recrystallization of agglomerates. It was proven that the spheroid-like particles are comprised of long flakes of monoclinic FePO4·2H2O as illustrated in Figure 6c.

3.2.3. Changes in the Process of Reaction

The samples in the different reaction stages were also analyzed by TG, as shown in Figure 7. The heating process was conducted in an N2 environment and the weight loss was on account of the dehydration [27,28], which was around 19.30%. With the increase of crystallinity, the endothermic peak for dehydration is shifting in the higher temperature direction gradually [29] (115.417 °C→135.063 °C→161.769 °C→176.833 °C), which proved that water molecules gradually enter into the lattice monoclinic FePO4·2H2O as the phase transformation progresses.
The reaction process was characterized by off-line FTIR, as shown in Figure 8. The characteristic peaks of the O-H stretching and bending vibrational mode are at 3500–3000 cm−1 and about 1600 cm−1 respectively [30,31]. The peak band at 513 cm−1 is attributed to the bending vibration mode and stretching band of O-P-O bonds. The P-O-P bonds are also reflected at 980 cm−1 to1100 cm−1, which corresponds to the tetrahedral PO43− anions.
After 180 min, a new peak at 750 cm−1 appeared, corresponding to the P-O vibration caused by the coupling effect between PO43− polyanion and Fe-O within the structure [32,33,34,35]. The symmetrical vibration characteristic peaks of PO43− anions at 997 cm−1 disappeared, and asymmetrical vibration peak at 1165 cm−1 appeared over time, as shown in Figure 8. These changes indicate that the FePO4·2H2O orderly rearranged and monoclinic FePO4·2H2O formed.
The result shown in Figure 9 demonstrated that the proportion of Fe in the precipitate increased at the early stage of phase transformation and then decreased with the increase of crystallization, which can also be proven by the energy dispersive spectrometer (EDS) information in Table 5. At the highest proportion of iron, the corresponding precipitation is amorphous, and the characteristic vibration peaks of iron binding with other functional groups are not found in the FTIR spectrum, indicating that there is not any intermediate during transformation.
The solubility of the amorphous form of FePO4·2H2O is higher than that of the monoclinic form [36]. During the rearrangement of iron phosphate dihydrate, the solution became supersaturated again with the dissolution of amorphous iron phosphate. The iron ions in solution adsorbed on the surface of the agglomerate (were partially neutralized by sulfate ions) or encased in the interior of the agglomerate, leading to a rise in the iron mass fraction (Supporting Information, Table S1). Then iron mass fraction decreased with the nucleation and growth of monoclinic FePO4·2H2O. The rise in mass fraction following transformation could be attributable to the impurity removal due to the decreased content of the S in precipitation.

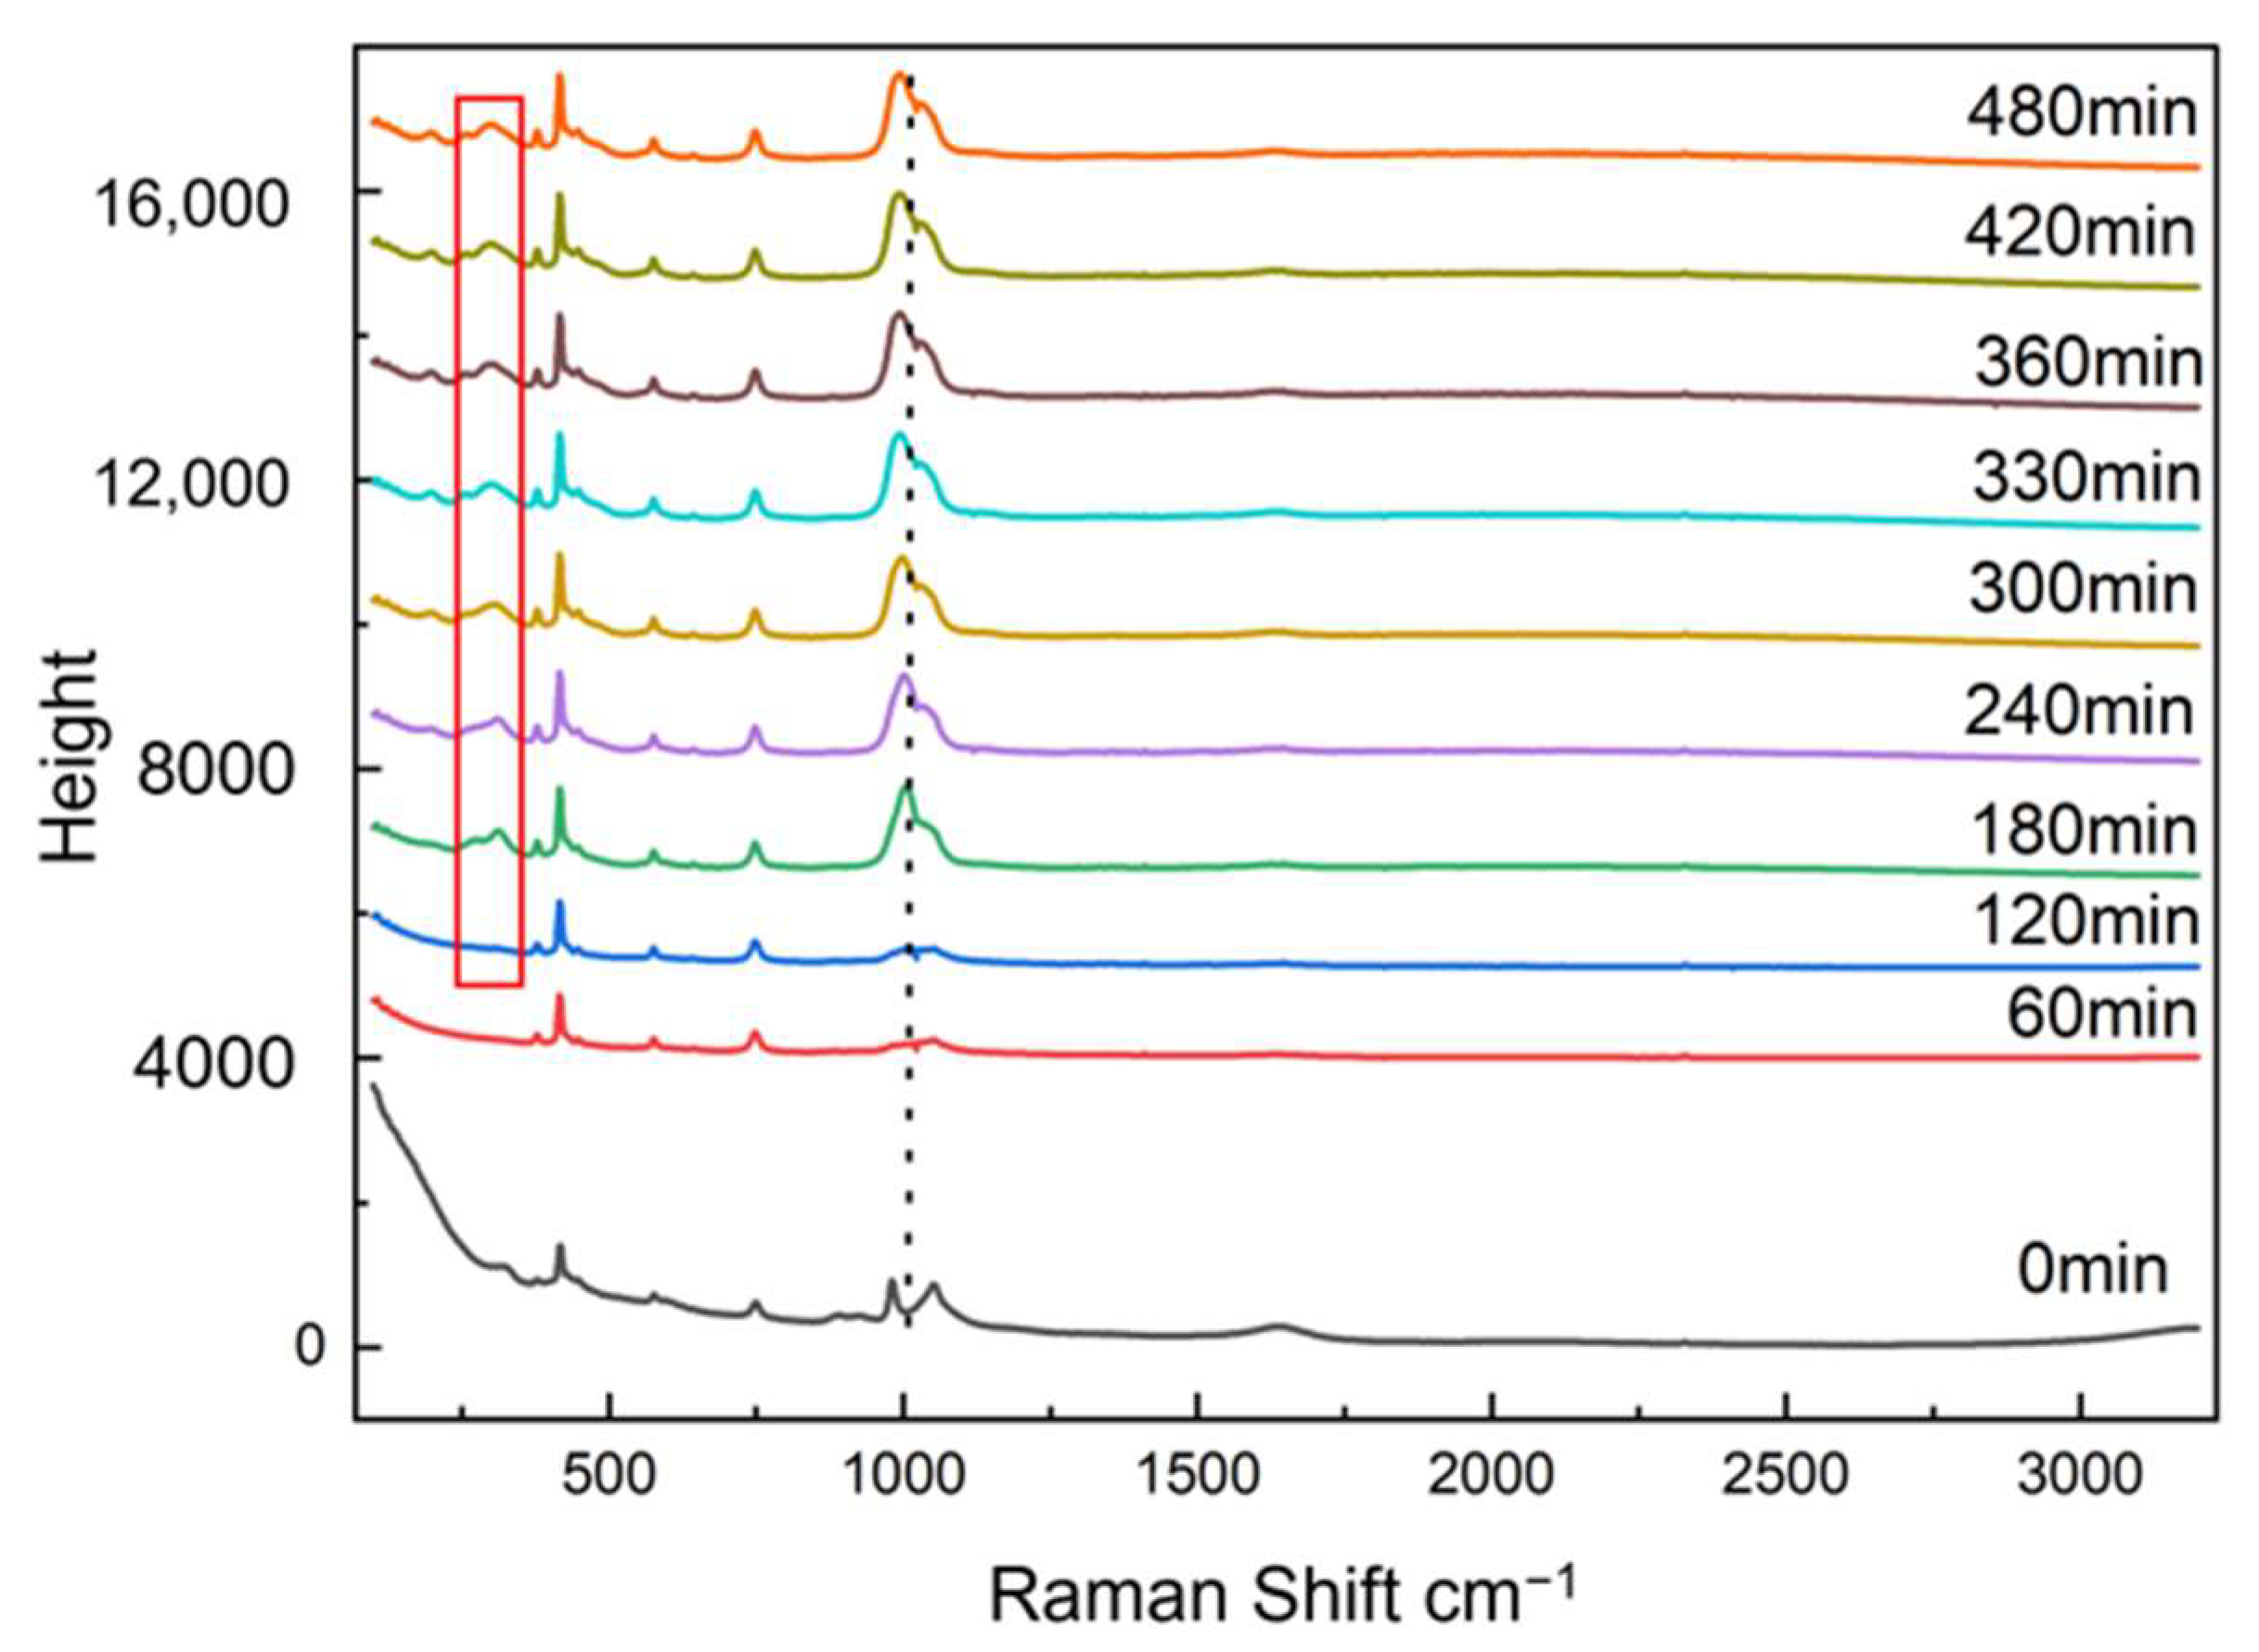
3.3. Kinetic of Phase Transformation

Raman was used to monitor the transformation of amorphous FePO4·2H2O, as shown in Figure 10. Transformation of amorphous FePO4·2H2O was followed by the appearance of monoclinic FePO4·2H2O characteristic peaks and the changes in height of the characteristic peaks: a new peak at 303 cm−1 appeared in the Raman spectra and its intensity increased gradually as the monoclinic FePO4·2H
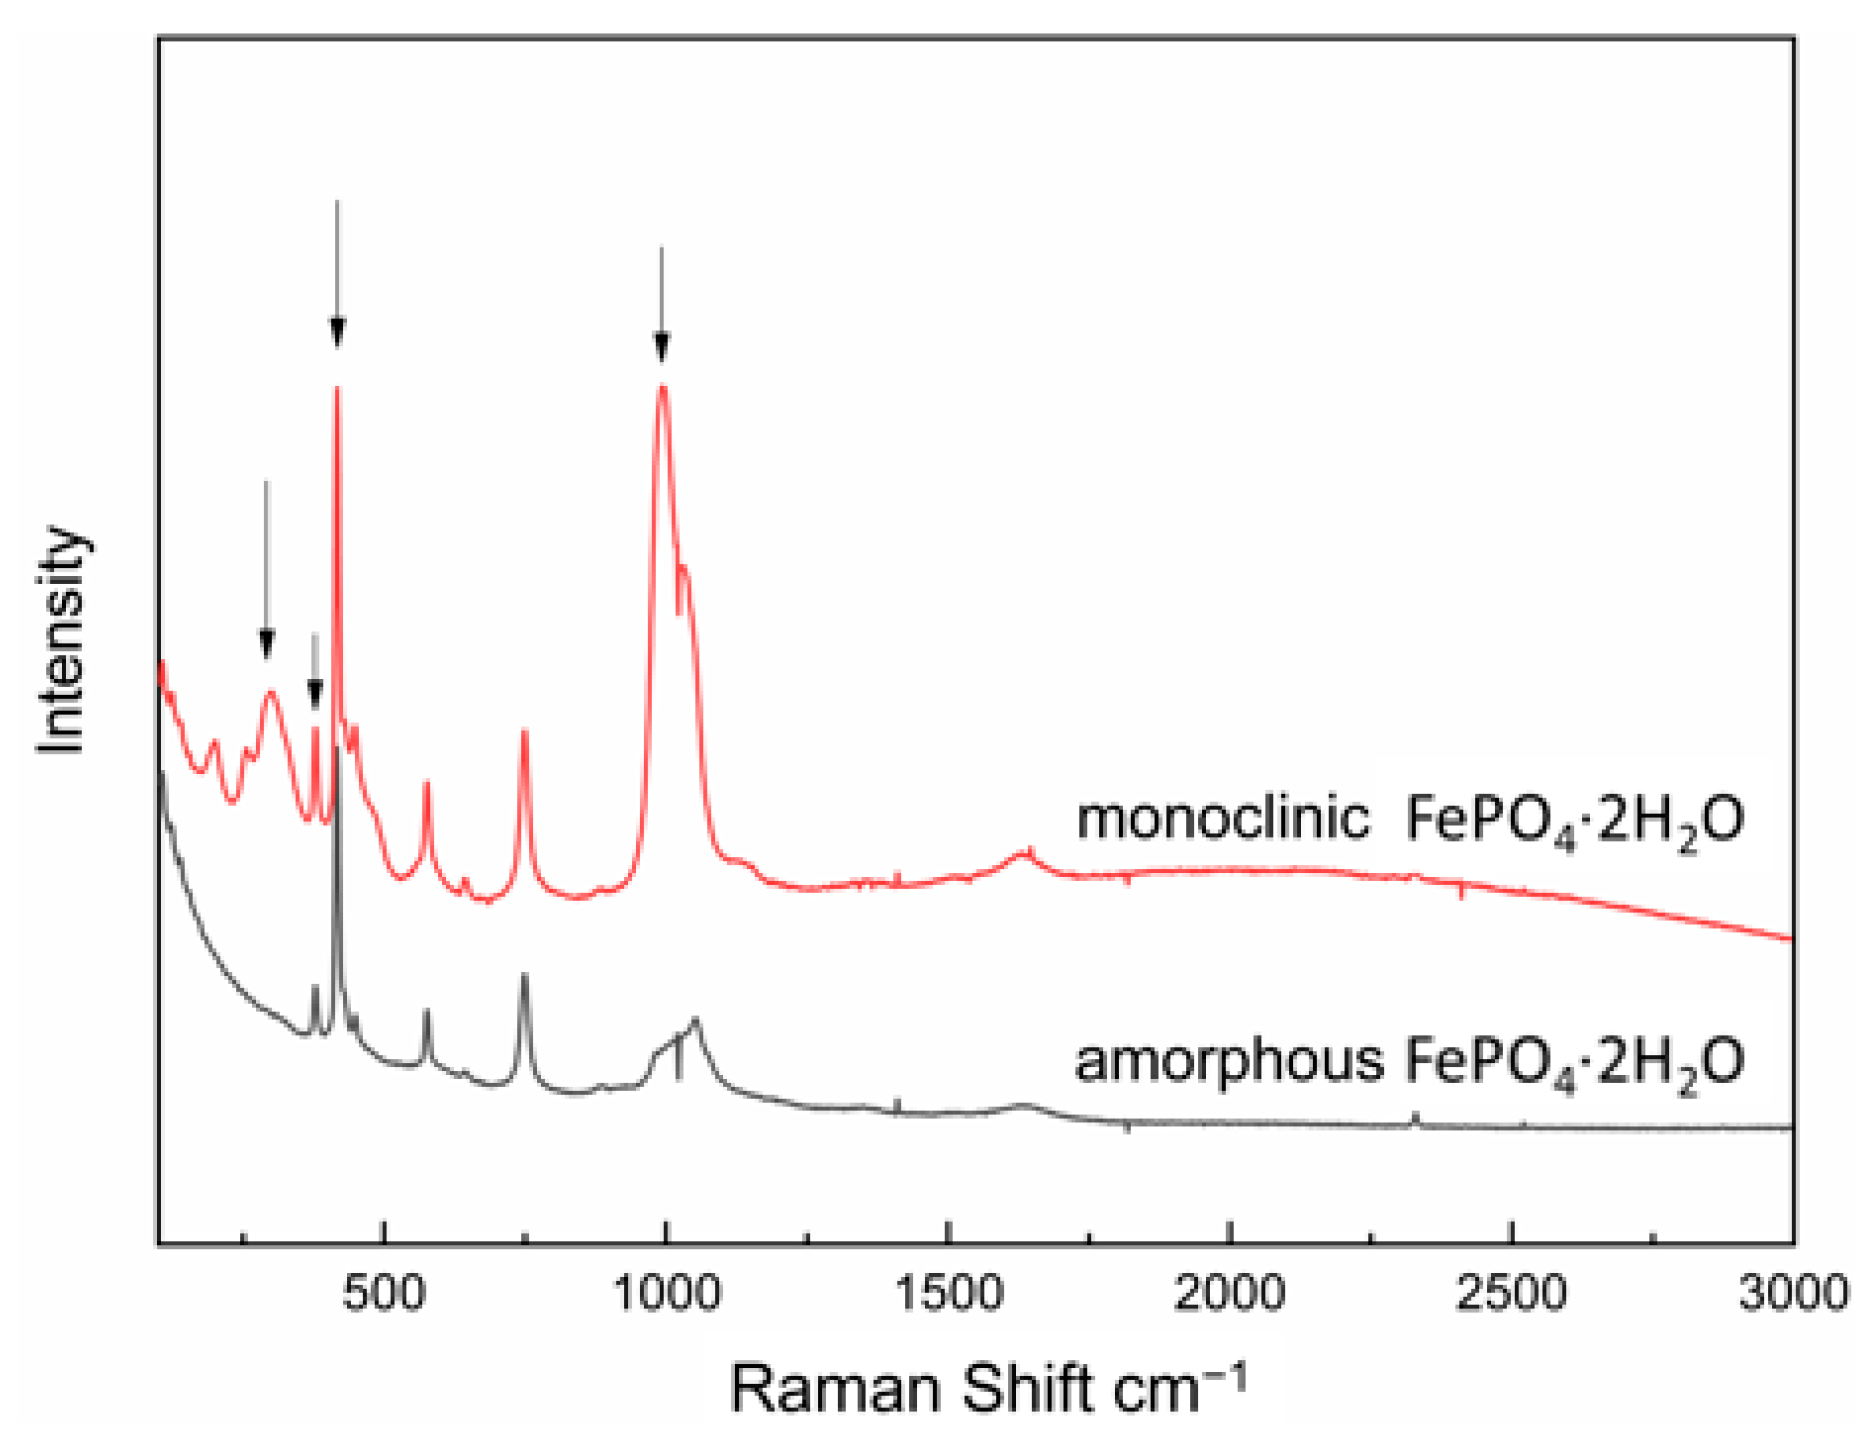
2O content increased during transformation.
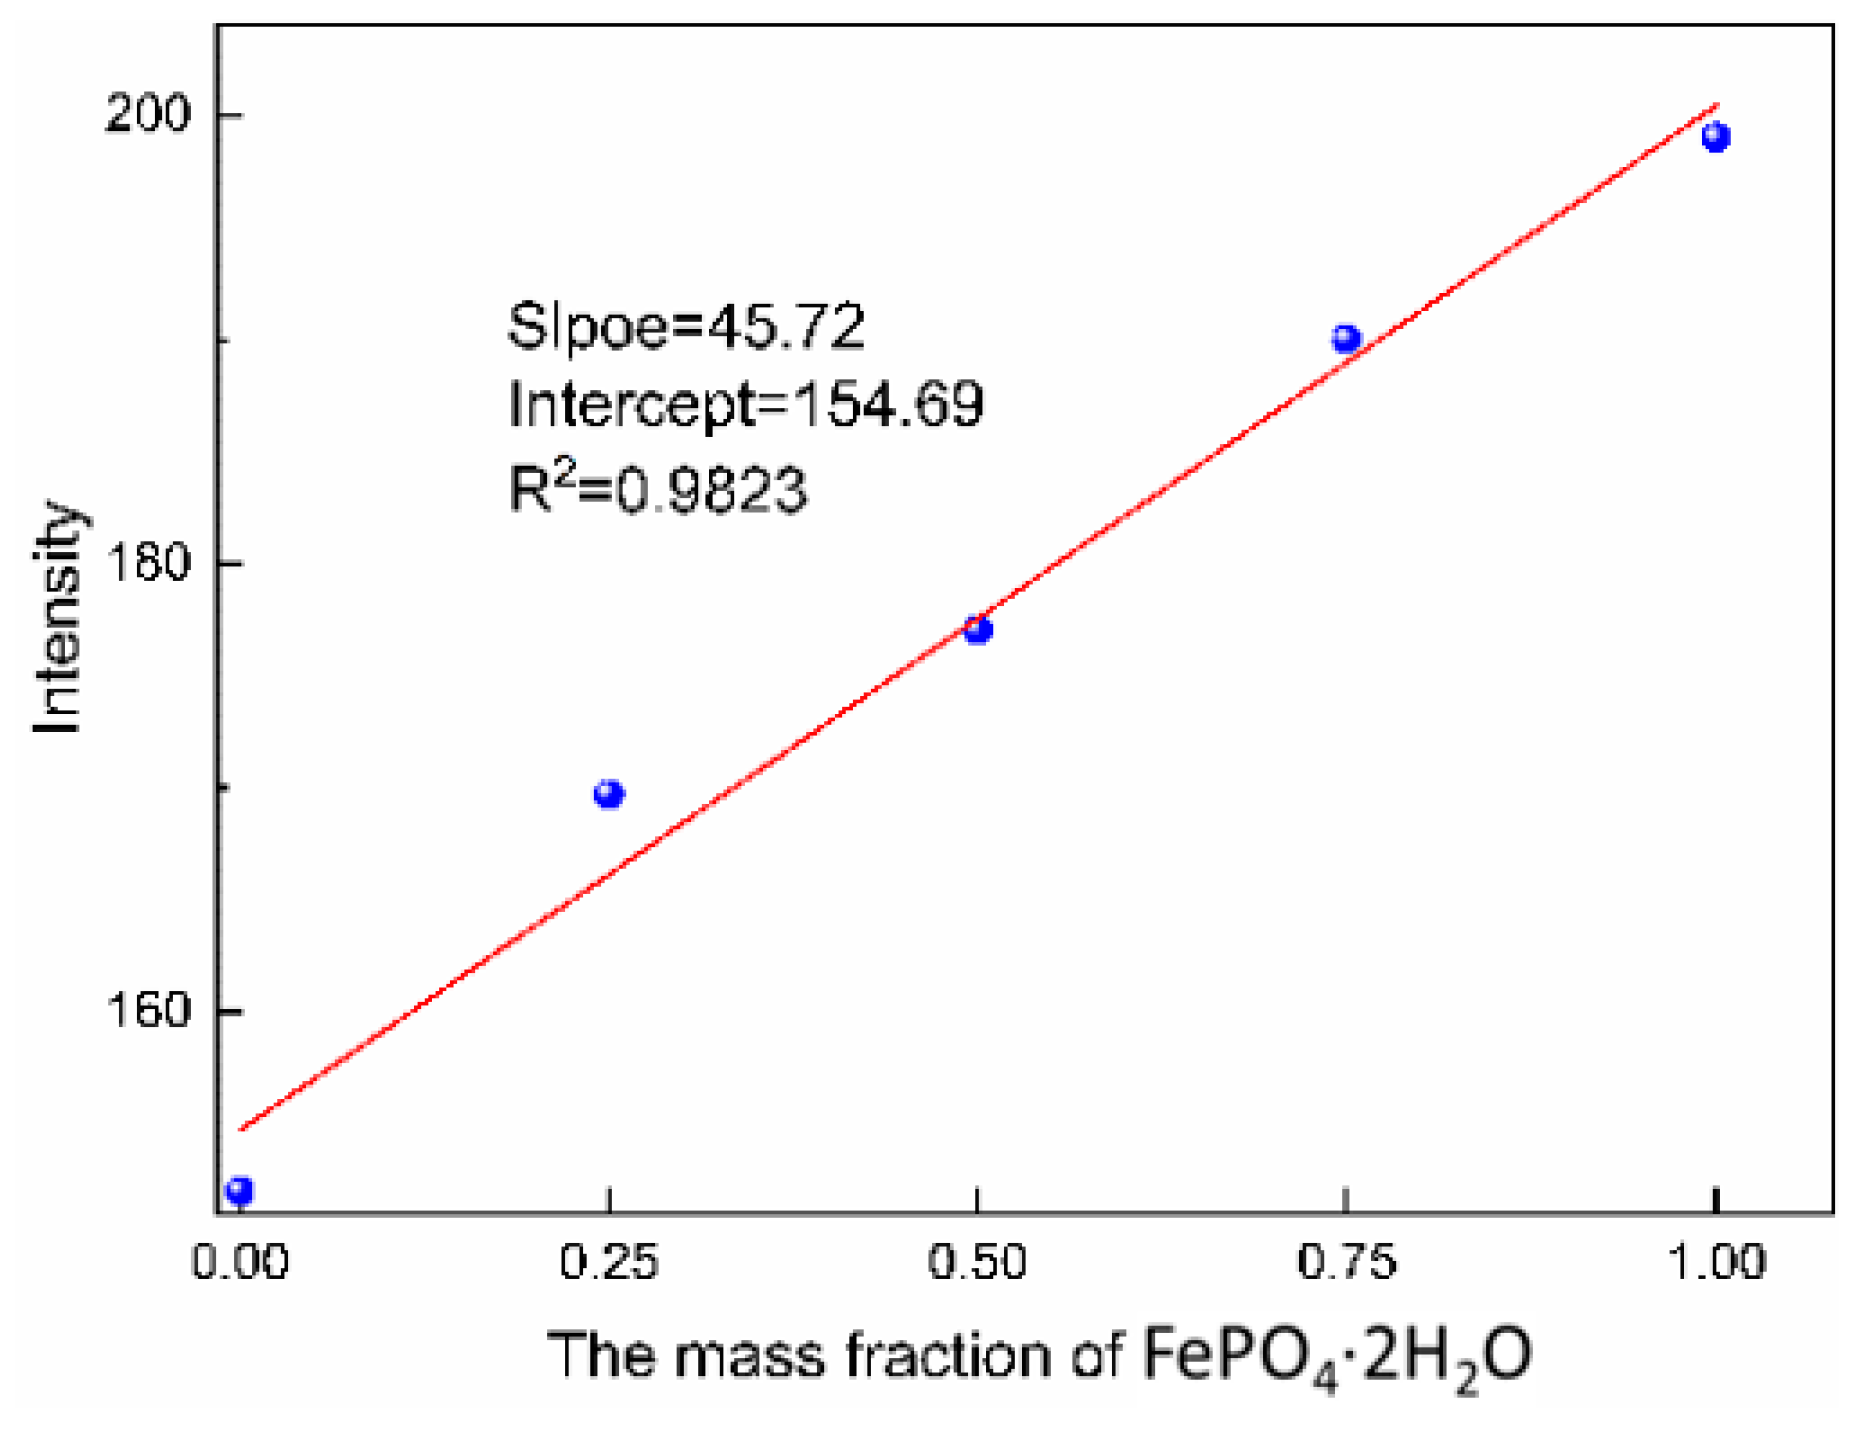
The corresponding characteristic peak intensity of the standard solution was measured by Raman spectroscopy (shown in Figure 11) and the standard curve could be obtained according to the relationship between intensity of characteristic peak and the mass fraction of monoclinic FePO4·2H2O, as shown in 
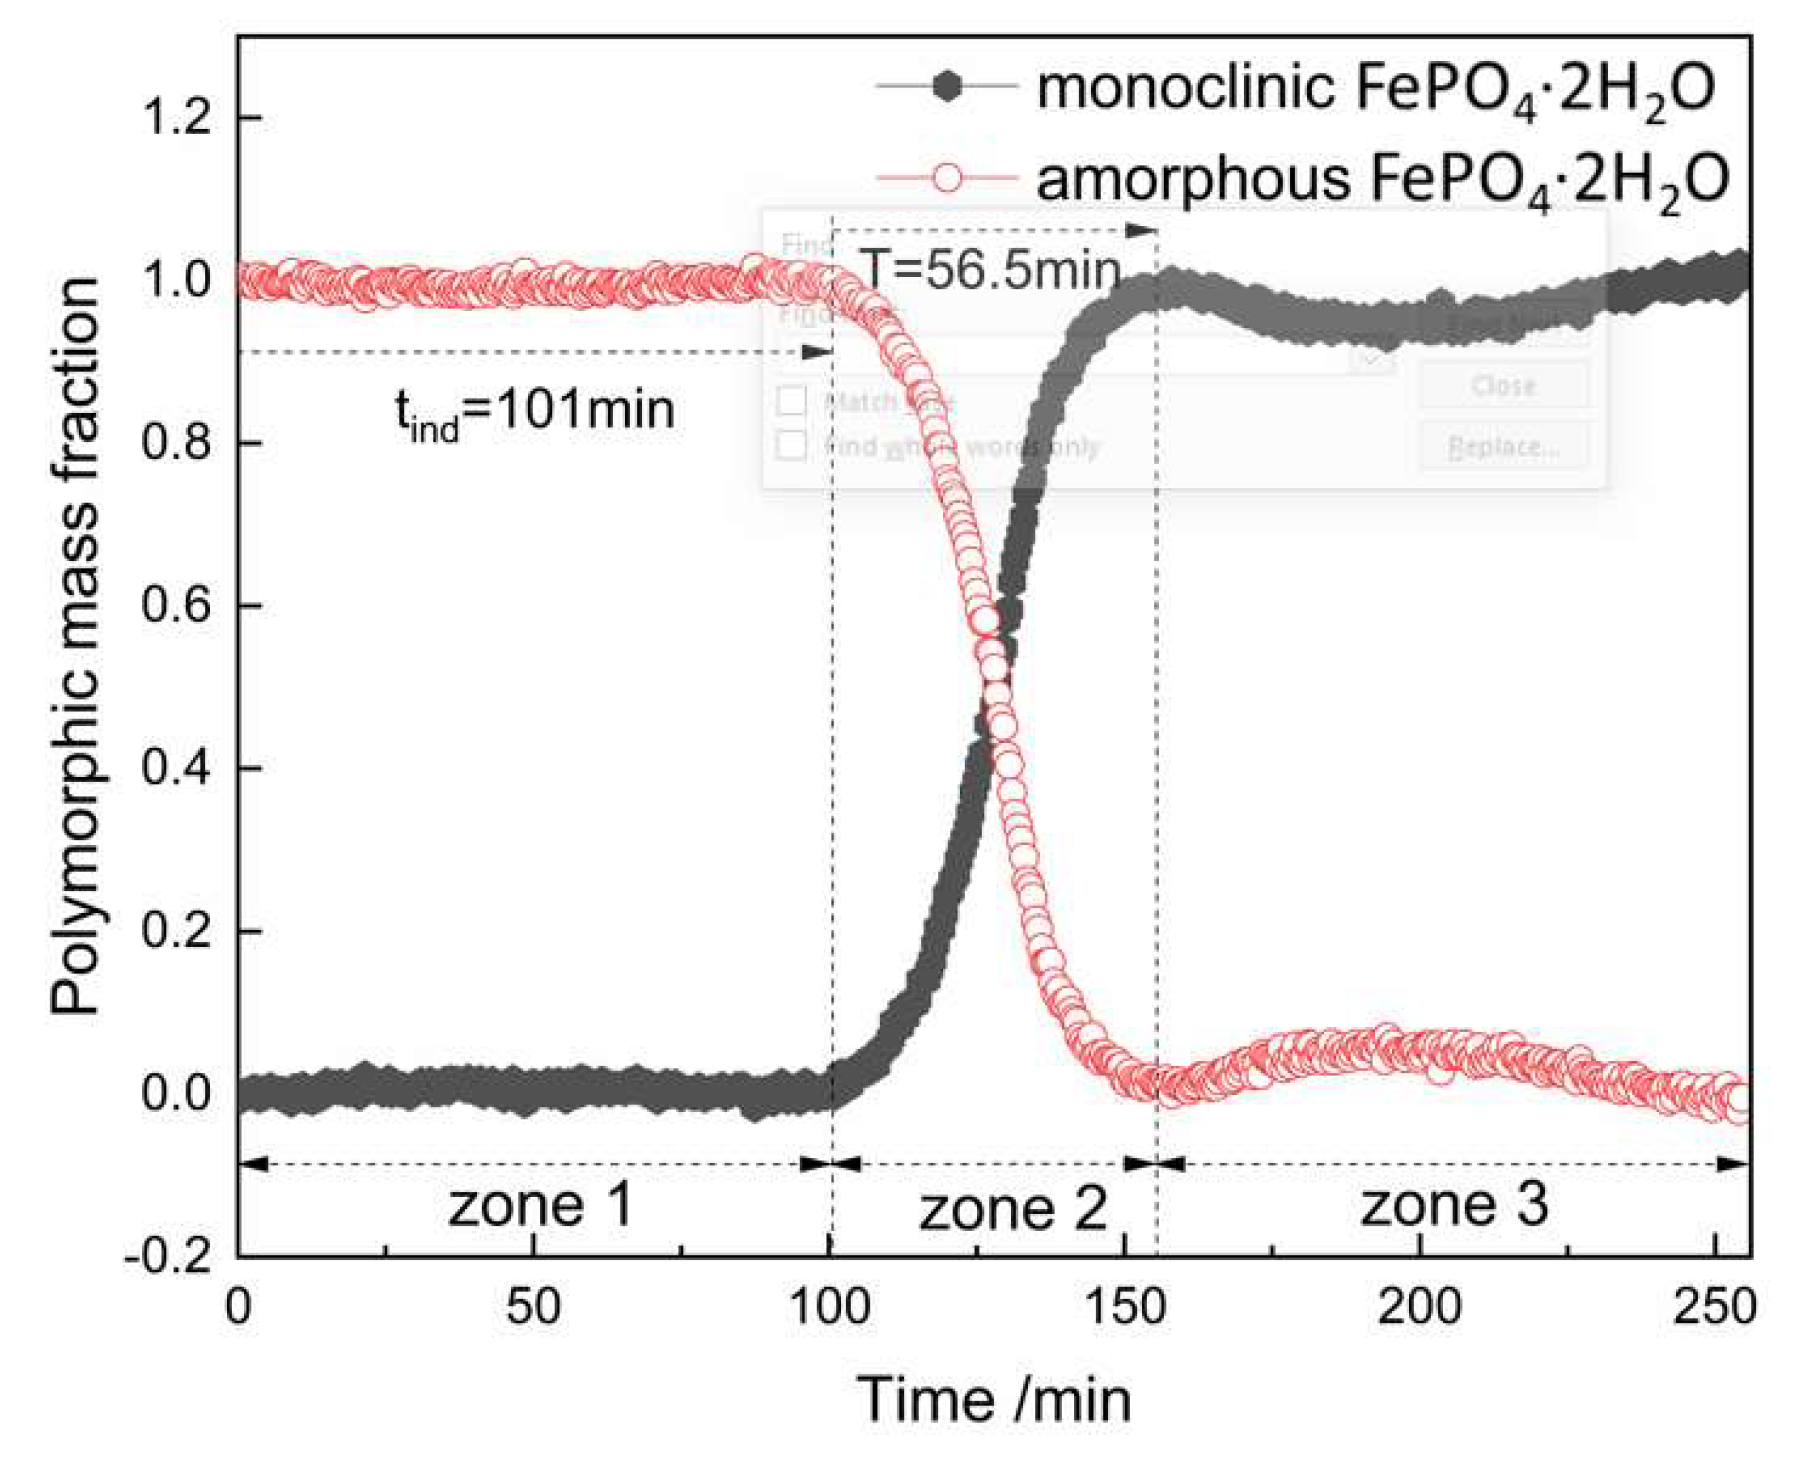
Figure 12. The transformation process was quantitatively evaluated by the relationship, which can be seen in Figure 13. It shows the changes of polymorphic composition during transformation. The mass fraction of the amorphous FePO4·2H2O decreased gradually after the induction time of 101 min, which could be attributed to the nucleation of monoclinic FePO4·2H2O and the transformation of the amorphous FePO4·2H2O. The curves are stable in zone 3 for the completion of transformation.
The Johnson–Mehl–Avrami (JMA) dynamics model was used for describing the phase transformation, as shown in equation 4. It was considered that the solution is well-mixed and the growth rate of crystals is independent of time. It assumed that the nucleation sites were located in the well-mixed reactant bases on solid-state reactions [37,38]. The calculated parameters were shown in the Table 6 and the fitting relevance value of R2 was over 0.97 indicating that the fitting result was great consistent with experimental results.
x t = 1 exp K × t t ind n
where x is the percentage content of monoclinic FePO4·2H2O at reaction time t; tind is the induction period of FePO4·2H2O transformation; K is the rate constant of transformation; n (called as Avrami exponent) is a constant related to the behaviors of nucleation and growth of FePO4·2H2O; if the value of n is over 1, the nucleation is the key factor for phase transformation or the migration of the chemicals to the nucleation point is dominant.
According to the spectra presented in Figure 13 and the Equation (5), the relationship of time and crystallinity and the parameters of JMA dynamics model were obtained, which were shown in Figure 14 and Table 6. The time required for transformation was 56.5 min and the induction period of this process was 101 min. Moreover, the concentration of Fe in the solution and the intensity of the corresponding characteristic peak at 303 cm−1 changed almost simultaneously: the concentration of Fe in solution decreased accompanying by the increase of the corresponding peak intensity with the time evolution (Supporting Information, Figure S2). It was indicated that the dissolution rate of amorphous FePO4·2H2O was slowest during phase transformation. Therefore, the dissolution rate of amorphous FePO4·2H2O is considered to be the control step of the transformation rate.
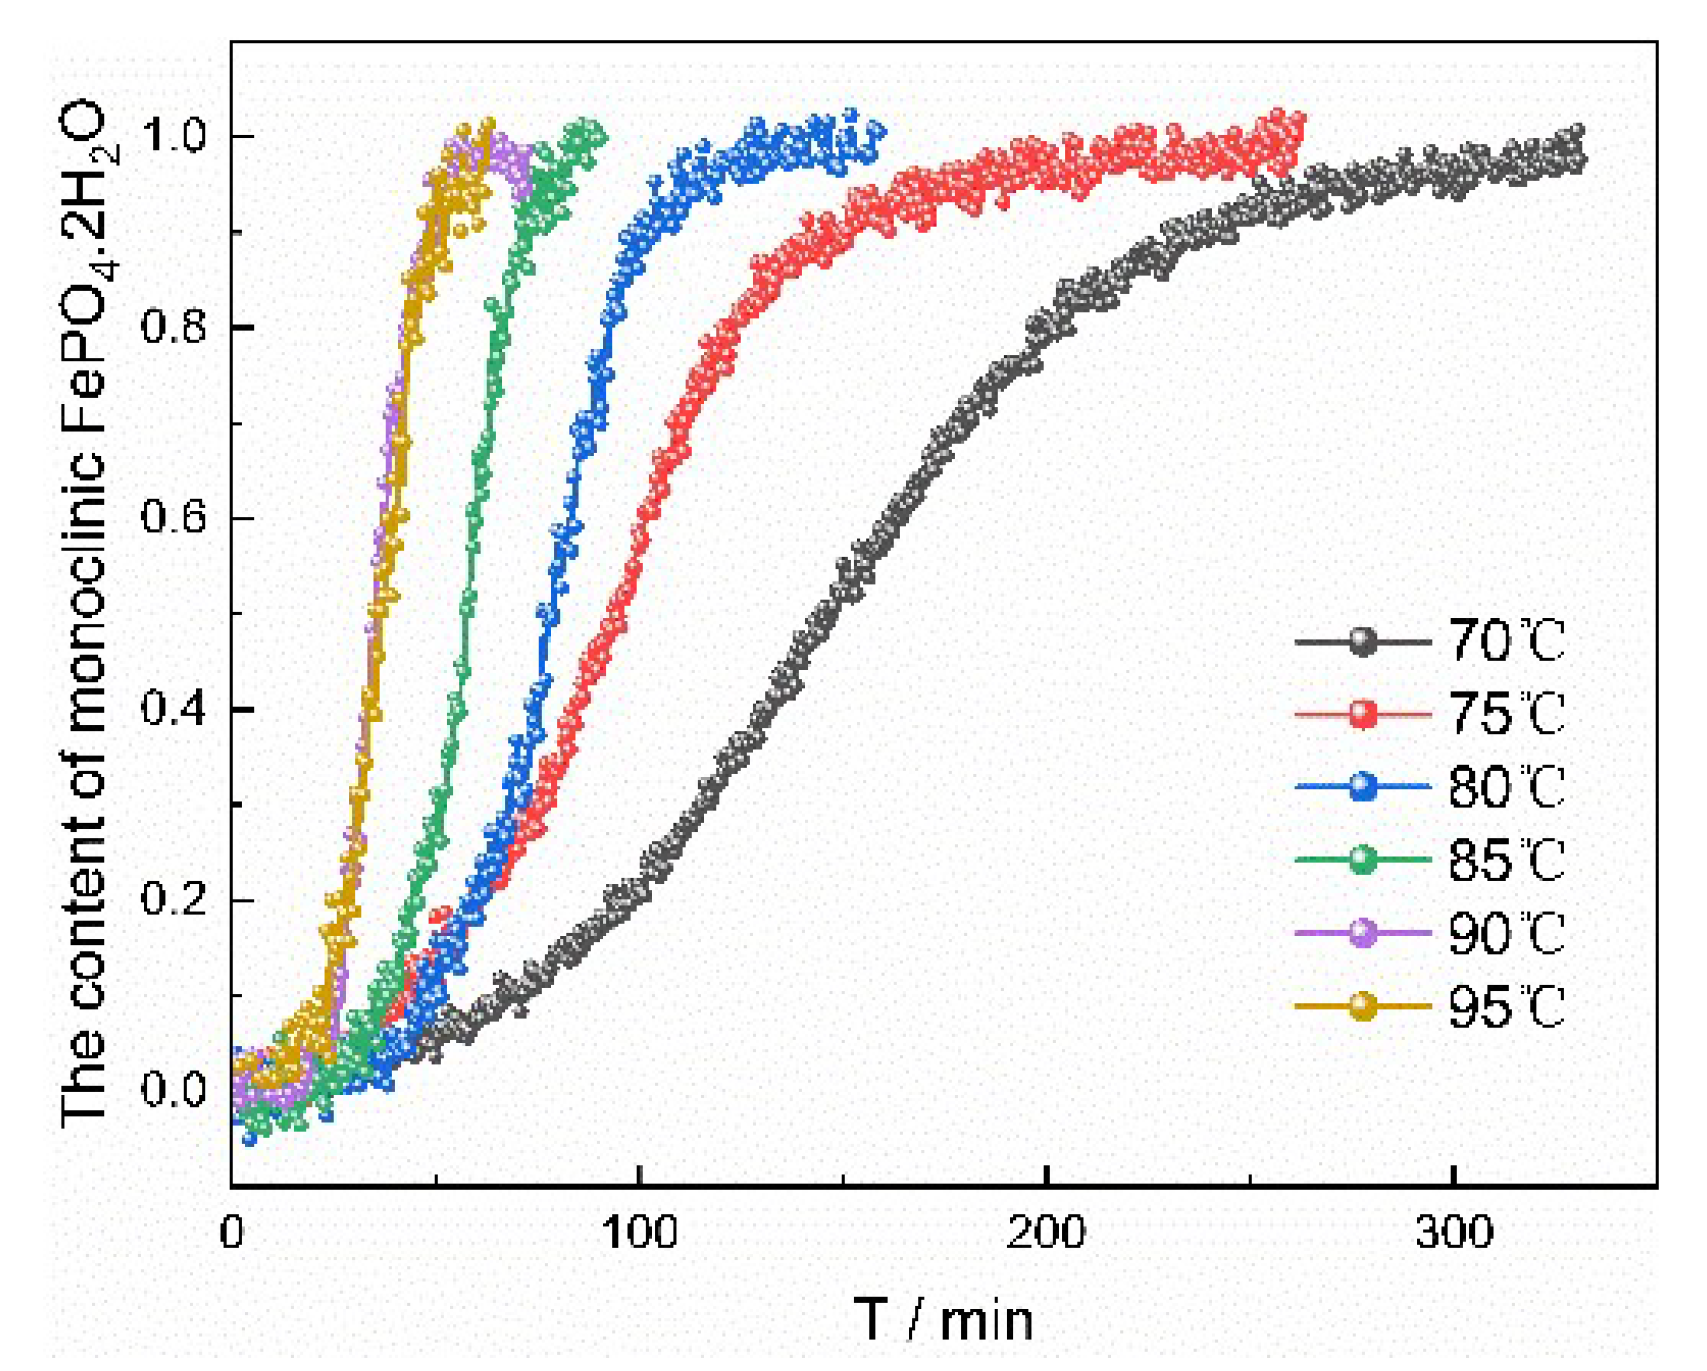
The experiments at different temperatures were carried out in order to evaluate the kinetics of the transformation process. The fitting results at different temperatures evaluated by the JMA model between temperature and the rate constant of transformation are shown in Table 7, and the changes trends of characteristic peak under different temperatures were presented in Figure S2 in Supporting Information. The activation energy of the transformation process was obtained by the Arrhenius equation, which was shown as Equation (6):
ln(K) = −Ea × (R × T)−1 + ln(A)
where K is the rate constant of transformation; R is the molar gas constant; T is the thermodynamic temperature; Ea is the apparent activation energy and A is the pre-exponential factor which is also called the frequency factor.
The parameters of reaction calculated by the JMA model are listed in Table 7. With the increase of reaction temperature, the induction period and the time required for transformation decreased, and rate constant of transformation increased. Increasing temperature can enhance molecular movement and reduce the interfacial energy of solid–liquid interface. Therefore, the nucleation rate of monoclinic FePO4·2H2O was accelerated and correspondingly the induction period and the time required for transformation was shortened. The value of the apparent activation energy Ea in the transformation process can be derived by plotting the logarithm of K against 1/T and analyzing the slope and intercept (Figure S3 in Supporting Information). The value of the activation energy was calculated to be 9.619 kJ/mol.

4. Conclusions

The phase transformation from amorphous to monoclinic FePO4·2H2O was investigated. It was found that Fe and P are predominantly present as FeHPO4+ and FeH2PO42+ and the transformation process of FePO4·2H2O from amorphous form to monoclinic form was determined by the nucleation rate of the monoclinic form. The corresponding Raman spectroscopy results indicated that the induction period and the time required for transformation reduced as the reaction temperature rose. The kinetic parameters of the FePO4·2H2O transformation were calculated by the JMA model and the findings demonstrated that the transformation reaction constant increased as the reaction temperature increased. The activation energy of the transformation was 9.619 kJ/mol. These studies were beneficial to controlling and improving properties of FePO4 for meeting the requirements as potential electrode material precursors.

Supplementary Materials

The following supporting information can be downloaded at: https://www.mdpi.com/article/10.3390/cryst12101369/s1, Table S1: The value of different parameter at pH range in equations; Table S2: The concentration of different ions at pH range; Table S3: The concentration of different ions at pH range; Table S4: The concentration of different ions at pH range; Table S5: The content of S and O in precipitation at different time; Figure S1: The mass fraction trend of Fe in solution at different time; Figure S2: Raman spectra of the precipitates at 70 ℃ (a), 75 °C (b), 80 °C (c), 85 °C (d), 95 °C (e); (f) the change of characteristic peak at 303 cm−1 over time under different temperature; Figure S3” The linear relationship between ln K and (1/T).

Author Contributions

Writing—original draft preparation, H.W.; writing—review and editing, H.W., M.G., Y.N., J.D. and L.Z.; visualization, H.W. and L.Z.; supervision, Q.Y. and L.Z. All authors have read and agreed to the published version of the manuscript.

Funding

This research was funded by Natural Science Foundation of Tianjin, grant number 21JCYBJC00600.

Institutional Review Board Statement

Not applicable.

Informed Consent Statement

Not applicable.

Data Availability Statement

Not applicable.

Acknowledgments

The authors are grateful for the financial support of the Special project for the transformation of major scientific and technological achievements of Guizhou Province.

Conflicts of Interest

The authors declare no conflict of interest.

References

  1. Allen, J.L.; Jow, T.R.; Wolfenstine, J. Analysis of the FePO4 to LiFePO4 Phase Transition. J. Solid State Electrochem. 2008, 12, 1031–1033. [Google Scholar] [CrossRef]
  2. Wang, Y.; Cao, G. Developments in Nanostructured Cathode Materials for High-Performance Lithium-Ion Batteries. Adv. Mater. 2008, 20, 2251–2269. [Google Scholar] [CrossRef]
  3. Padhi, A.K.; Nanjundaswamy, K.S.; Goodenough, J.B. Phospho-olivines as Positive-Electrode Materials for Rechargeable Lithium Batteries. J. Electrochem. Soc. 1997, 144, 1188–1194. [Google Scholar] [CrossRef]
  4. Zhang, H.; Zou, Z.; Zhang, S.; Liu, J.; Zhong, S. A review of the doping modification of LiFePO4 as a cathode material for lithium ion batteries. Int. J. Electrochem. Sci 2020, 15, 12041–12067. [Google Scholar] [CrossRef]
  5. Zhang, Y.; Huo, Q.; Du, P.; Wang, L.; Zhang, A.; Song, Y.; Lv, Y.; Li, G. Advances in New Cathode Material LiFePO4 for Lithium-Ion Batteries. Synth. Met. 2012, 162, 1315–1326. [Google Scholar] [CrossRef]
  6. Peng, W.; Jiao, L.; Gao, H.; Qi, Z.; Wang, Q.; Du, H.; Si, Y.; Wang, Y.; Yuan, H. A Novel Sol–Gel Method Based on FePO4·2H2O to Synthesize Submicrometer Structured LiFePO4/C Cathode Material. J. Power Sources 2011, 196, 2841–2847. [Google Scholar] [CrossRef]
  7. Prosini, P.P.; Lisi, M.; Scaccia, S.; Carewska, M.; Cardellini, F.; Pasquali, M. Synthesis and Characterization of Amorphous Hydrated FePO4 and Its Electrode Performance in Lithium Batteries. J. Electrochem. 2002, 149, A297–A301. [Google Scholar] [CrossRef]
  8. Zhan, T.T.; Jiang, W.F.; Li, C.; Luo, X.D.; Lin, G.; Li, Y.W.; Xiao, S.H. High Performed Composites of LiFePO4/3DG/C Based on FePO4 by Hydrothermal Method. Electrochim. Acta 2017, 246, 322–328. [Google Scholar] [CrossRef]
  9. Chen, M.; Du, C.; Song, B.; Xiong, K.; Yin, G.; Zuo, P.; Cheng, X. High-Performance LiFePO4 Cathode Material from FePO4 Microspheres with Carbon Nanotube Networks Embedded for Lithium Ion Batteries. J. Power Sources 2013, 223, 100–106. [Google Scholar] [CrossRef]
  10. Zhang, T.B.; Lu, Y.C.; Luo, G.S. Iron Phosphate Prepared by Coupling Precipitation and Aging: Morphology, Crystal Structure, and Cr (III) Adsorption. Cryst. Growth Des. 2013, 13, 1099–1109. [Google Scholar] [CrossRef]
  11. Bouamer, H.; El, M.; Lakhal, M.; Kaichouh, G.; Khalid, O.; Faqir, H.; Hourch, A.; Guessous, A. Growth and Characterization of Electrodeposited Orthorhombic FePO4.2H2O. J. Mater. Environ. Sci. 2018, 9, 1247–1254. [Google Scholar]
  12. Wang, Z.; Lu, Y. Facile Construction of High-Performance Amorphous FePO4/Carbon Nanomaterials as Cathodes of Lithium-Ion Batteries. ACS Appl. Mater. Interfaces 2019, 11, 13225–13233. [Google Scholar] [CrossRef]
  13. Guo, J.; Liang, C.; Cao, J.; Jia, S. Synthesis and Electrochemical Performance of Lithium Iron Phosphate/Carbon Composites Based on Controlling the Secondary Morphology of Precursors. Int. J. Hydrogen Energy 2020, 45, 33016–33027. [Google Scholar] [CrossRef]
  14. Jiang, D.; Zhang, X.; Zhao, T.; Liu, B.; Yang, R.; Zhang, H.; Fan, T.; Wang, F. An Improved Synthesis of Iron Phosphate as a Precursor to Synthesize Lithium Iron Phosphate. Bull. Mater. Sci. 2020, 43, 50. [Google Scholar] [CrossRef]
  15. Zhang, X.; Zhang, L.; Liu, H.; Cao, B.; Liu, L.; Gong, W. Structure, Morphology, Size and Application of Iron Phosphate. Rev. Adv. Mater. Sci. 2020, 59, 538–552. [Google Scholar] [CrossRef]
  16. Padhi, A.K.; Nanjundaswamy, K.S.; Masquelier, C.; Okada, S.; Goodenough, J.B. Effect of Structure on the Fe3+/Fe2+ Redox Couple in Iron Phosphates. J. Electrochem. Soc. 1997, 144, 1609–1613. [Google Scholar] [CrossRef]
  17. Song, Y.; Zavalij, P.Y.; Suzuki, M.; Whittingham, M.S. New Iron (III) Phosphate Phases: Crystal Structure and Electrochemical and Magnetic Properties. Inorg. Chem. 2002, 41, 5778–5786. [Google Scholar] [CrossRef]
  18. Zhang, T.; Lu, Y.; Luo, G. Size Adjustment of Iron Phosphate Nanoparticles by Using Mixed Acids. Ind. Eng. Chem. Res. 2013, 52, 6962–6968. [Google Scholar] [CrossRef]
  19. Lindsay, W.L.; Moreno, E.C. Phosphate Phase Equilibria in Soils. Soil Sci. Soc. Am. J. 1960, 24, 177–182. [Google Scholar] [CrossRef]
  20. Chang, S.C.; Jackson, M.L. Solubility Product of Iron Phosphate. Soil Sci. Soc. Am. J. 1957, 21, 265–269. [Google Scholar] [CrossRef]
  21. Lou, W.; Zhang, Y.; Zhang, Y.; Zheng, S.; Sun, P.; Wang, X.; Qiao, S.; Li, J.; Zhang, Y.; Liu, D.; et al. A Facile Way to Regenerate FePO4∙2H2O Precursor from Spent Lithium Iron Phosphate Cathode Powder: Spontaneous Precipitation and Phase Transformation in an Acidic Medium. J. Alloys Compd. 2021, 856, 158148. [Google Scholar] [CrossRef]
  22. Scholz, F.; Kahlert, H. Chemical Equilibria in Analytical Chemistry: The Theory of Acid–Base, Complex, Precipitation and Redox Equilibria; Springer International Publishing: Cham, Switzerland, 2019. [Google Scholar] [CrossRef]
  23. Iuliano, M.; Ciavatta, L.; De Tommaso, G. On the Solubility Constant of Strengite. Soil Sci. Soc. Am. J. 2007, 71, 1137–1140. [Google Scholar] [CrossRef]
  24. Lindsay, W.L.; Vlek, P.L.G.; Chien, S.H. Phosphate Minerals. In SSSA Book Series; Dixon, J.B., Weed, S.B., Eds.; Soil Science Society of America: Madison, WI, USA, 2018; pp. 1089–1130. [Google Scholar] [CrossRef]
  25. Gongyan, W.; Li, L.; Fang, H. Dehydration of FePO4·2H2O for the Synthesis of LiFePO4/C: Effect of Dehydration Temperature. Int. J. Electrochem. Sci. 2018, 13, 2498–2508. [Google Scholar] [CrossRef]
  26. Zaghib, K.; Julien, C.M. Structure and Electrochemistry of FePO4·2H2O Hydrate. J. Power Sources 2005, 142, 279–284. [Google Scholar] [CrossRef]
  27. Fan, E.; Li, L.; Zhang, X.; Bian, Y.; Xue, Q.; Wu, J.; Wu, F.; Chen, R. Selective Recovery of Li and Fe from Spent Lithium-Ion Batteries by an Environmentally Friendly Mechanochemical Approach. ACS Sustain. Chem. Eng. 2018, 6, 11029–11035. [Google Scholar] [CrossRef]
  28. Boonchom, B.; Puttawong, S. Thermodynamics and Kinetics of the Dehydration Reaction of FePO4·2H2O. Phys. B Condens. Matter. 2010, 405, 2350–2355. [Google Scholar] [CrossRef]
  29. Xia, S.; Li, F.; Chen, F.; Guo, H. Preparation of FePO4 by Liquid-Phase Method and Modification on the Surface of LiNi0.80Co0.15Al0.05O2 Cathode Material. J. Alloys Compd. 2018, 731, 428–436. [Google Scholar] [CrossRef]
  30. Ma, Y.; Shen, W.; Yao, Y. Preparation of Nanoscale Iron (III) Phosphate by Using Ferro-Phosphorus as Raw Material. IOP Conf. Ser. Earth Environ. Sci. 2019, 252, 022032. [Google Scholar] [CrossRef]
  31. Tejedor-Tejedor, M.I.; Anderson, M.A. The Protonation of Phosphate on the Surface of Goethite as Studied by CIR-FTIR and Electrophoretic Mobility. Langmuir 1990, 6, 602–611. [Google Scholar] [CrossRef]
  32. Arai, Y.; Sparks, D.L. ATR–FTIR Spectroscopic Investigation on Phosphate Adsorption Mechanisms at the Ferrihydrite–Water Interface. J. Colloid Interface Sci. 2001, 241, 317–326. [Google Scholar] [CrossRef]
  33. Infrared and Raman Spectra of Inorganic and Coordination Compounds, 1st ed.; John Wiley & Sons, Ltd.: London, UK, 2008. [CrossRef]
  34. Khachani, M.; El Hamidi, A.; Kacimi, M.; Halim, M.; Arsalane, S. Kinetic Approach of Multi-Step Thermal Decomposition Processes of Iron(III) Phosphate Dihydrate FePO4∙2H2O. Thermochim. Acta 2015, 610, 29–36. [Google Scholar] [CrossRef]
  35. Chapman, A.C.; Thirlwell, L.E. Spectra of Phosphorus Compounds—I the Infra-Red Spectra of Orthophosphates. Spectrochim. Acta 1964, 20, 937–947. [Google Scholar] [CrossRef]
  36. Roncal-Herrero, T.; Rodríguez-Blanco, J.D.; Benning, L.G.; Oelkers, E.H. Precipitation of Iron and Aluminum Phosphates Directly from Aqueous Solution as a Function of Temperature from 50 to 200 °C. Cryst. Growth Des. 2009, 9, 5197–5205. [Google Scholar] [CrossRef]
  37. Özen, M.; Mertens, M.; Snijkers, F.; Cool, P. Hydrothermal Synthesis and Formation Mechanism of Tetragonal Barium Titanate in a Highly Concentrated Alkaline Solution. Ceram. Int. 2016, 42, 10967–10975. [Google Scholar] [CrossRef]
  38. Málek, J. The Applicability of Johnson-Mehl-Avrami Model in the Thermal Analysis of the Crystallization Kinetics of Glasses. Thermochim. Acta 1995, 267, 61–73. [Google Scholar] [CrossRef]
Figure 1. Experimental apparatus utilized in the experiments.
Crystals 12 01369 g001
Figure 2. Distribution of the various complexation species under different pH environments: (a) shows distribution of H+, H2PO4, HPO42−, PO43− and Fe3+; (b) shows distribution of the rest of the ions.
Crystals 12 01369 g002
Figure 3. The Powder X-ray diffraction pattern of samples taken at 0 min (a), 180 min (b), 205 min (c), 225 min (d); 235 min (e), 245 min (f); 255 min (h), 450 min (g), respectively.
Crystals 12 01369 g003
Figure 4. Crystal structure of monoclinic FePO4·2H2O.
Crystals 12 01369 g004
Figure 5. SEM images of morphology evolvement of FePO4·2H2O during the experiment: (a) 0 min; (b) 30 min; (c) 150 min; (d) 450 min; (a’d’) are images with the higher magnification at the corresponding times (0 min, 30 min, 150 min, 450 min).
Crystals 12 01369 g005
Figure 6. TEM images of FePO4·2H2O at (a) initial, (b) 150 min and (c) end of reaction, respectively; (d) typical EDS spectrum of initially produced precipitate.
Crystals 12 01369 g006
Figure 7. Heat-flow and mass change of precipitation at different reaction time during heating.
Crystals 12 01369 g007
Figure 8. FTIR spectra of the precipitates at different reaction times.
Crystals 12 01369 g008
Figure 9. The mass fraction trend of Fe in precipitation at different reaction time.
Crystals 12 01369 g009
Figure 10. Raman spectra of the precipitates at different reaction times.
Crystals 12 01369 g010
Figure 11. Raman spectra of slurries of monoclinic and amorphous FePO4·2H2O during the transformation.
Crystals 12 01369 g011
Figure 12. The standard curve of monoclinic FePO4·2H2O.
Crystals 12 01369 g012
Figure 13. In situ polymorphic mass fraction profiles of monoclinic and amorphous FePO4·2H2O through the solvent-mediated transformation process.
Crystals 12 01369 g013
Figure 14. The percentage content of monoclinic FePO4·2H2O vs. time at different temperatures.
Crystals 12 01369 g014
Table 1. Detail of the materials specification.
ChemicalsCAS Registry No.Molecular Weight (g/mol)Mass Fraction Purity
FeSO4·7H2O7782-63-0278.01≥0.99
H2O27722-84-134.01≥0.30
FePO4·2H2O13463-10-0186.82≥0.99
H3PO47664-38-298.00≥0.85
Table 2. Compositions of the solution.
Concentration %
FeSO4·7H2O8.3
H3PO43.7
H2O22.4
H2O85.6
Table 3. Possible complexation reactions for Fe3+ and phosphate.
No.ReactionsLogK
1H3PO4 = H+ + H2PO4−2.12
2H2PO4 = H+ + HPO42−−7.20
3HPO42− = H+ + PO43−−12.36
4Fe3+ + H3PO4 = FeHPO4+ + 2H+1.55
5Fe3+ + H3PO4 = FeH2PO42+ + H+1.60
6Fe3+ + 2H3PO4 = FeH2(PO4)2 + 4H+−4.34
7Fe3+ + 2H3PO4 = FeH4(PO4)2+ + 2H+1.19
8Fe3+ + 4H3PO4 = FeH8(PO4)4 + 4H+1.73
92Fe3+ + H3PO4 = Fe2HPO44+ + 2H+1.92
102Fe3+ + 2H3PO4 = Fe2H3(PO4)23+ + 3H+0.18
113Fe3+ + 4H3PO4 = Fe3H6(PO4)23+ + 3H+0.23
The unit of equilibrium constants K is (mol·L−1)^Δν, Δν is sum of stoichiometric numbers in reaction.
Table 4. Possible reactions in solution with an initial pH value of 0.85.
No.Reactions
1FeHPO4+ + H2O = FePO4·2H2O↓ + H+
2FeH2PO42+ + 2H2O = FePO4·2H2O↓ + 2H+
Table 5. Composition of produced precipitate under different time.
Sampling Time/minFe (Atom %)P (Atom %)Molar Ratio of P/Fe
018.217.60.96
10019.018.30.96
32021.221.41.00
Table 6. Fitting parameters of JMA model at 90 °C.
ParametersValue
Temperature/°C90
tind/min101
T/min56.5
K/h−33.4348
n3.4381
R20.9798
T is the time required for transformation.
Table 7. Fitting parameters of JMA model at different temperature.
Temperature/°Ctind/minT/minK/h−3nR2
703163320.07422.530.995
752592260.20742.630.996
802241140.38454.340.995
85145760.97244.990.993
9575555.11573.870.983
T is the time required for transformation.
Publisher’s Note: MDPI stays neutral with regard to jurisdictional claims in published maps and institutional affiliations.

