Abstract
In this study, we synthesized a reduced form of graphene oxide/copper oxide (rGO/CuO) nanocompounds produced at rGO wt. of 0.125%, 0.25%, 0.5% and 1%. The crystallinity indexes for rGO and rGO/CuO increased, and that for CuO decreased as the test temperatures increases, while the crystallinity indexes of rGO, CuO and rGO/CuO decreases with test periods increment. Measurement by dynamic light scattering reported average crystallite sizes of 0.7, 8.8, 25.4, 38.5 nm for 0.125 wt.% rGO/CuO, 0.25 wt.% rGO/CuO, 0.50 wt.% rGO/CuO and 1.0 wt.% rGO/CuO respectively. The electrochemical properties of the nanocomposites were checked. The rGO/CuO XRD peaks were 18.114320 Å, 225.1856 Å, 321.41740 Å, and 365.98290 Å, with 11.051640%, 0.461075%, 0.280083%, and 0.174259% for 2ϴ of 22.2031°, 43.5865°, 50.7050°, and 74.3729°, respectively. FTIR spectroscopy identified the existence of vibrational frequencies with pseudo-capacitance at 458 cm−1 which confirmed the presence of rGO-CuO nanoparticles. The voltammetry of rGO-CuO indicated the increment of electrochemical activity, large capacitance, and conduction in the reduced rGO/CuO composite. For rGO wt. of 0.125%, 0.25%, 0.5%, and 1.0%, the rGO/CuO composite specific capacitance was 561 F/g, 582 F/g, 597 F/g, and 611 F/g, respectively, which indicated good electrochemical performance.
1. Introduction
For the production of electrochemical energy storage devices, different materials have been explored resulting in the decrement of fossil fuel consumption and deployment of green and ecofriendly energy. Chen et al. [1] deduced that carbon materials play a very important role in this development of a sustainable future. Ozbay et al. [2] mentioned that carbon foam is an extremely important for next-generation structural materials, since porous materials have several advantages over traditional materials for versatile applications, being light in weight and demonstrating superior properties. Jain et al. [3] have shown how activated carbon produced from hydro chars can conveniently and easily be used for energy storage purposes as well as environmental remediation.
Graphene-based nanomaterials are well known to have significant photocatalytic and antibacterial activities suitable for biomedical as well as environmental applications. Surwade et al. [4] concluded that due to graphene’s extraordinary mechanical stability and flexibility, it effectively served as a separation membrane. Abbasa et al. [5] successfully converted biomass waste into graphene through various easy and cost effective routes. Ahmed et al. [6] used wood to produce activated carbon with extremely low chemical consumption. Xu et al. [7] described a new meaningful approach using an ultrasonic cavitation mechanism for facile preparation of graphite materials. Wang et al. [8] presented and discussed certain recent developments in the field of energy-storage electrodes based on biomass-derived carbon materials. Ding et al. [9] produced large-scale high-quality graphene using synthetic processes. Das et al. [10] concluded that synthesizing biomass or its derivatives produces graphene that can be employed as an efficient catalyst. Zhang et al. [11] produced carbonaceous biomass materials. Ogale et al. [12] produced high-performance carbon fibers (CFs) from polyacrylonitrile (PAN). Mugadza et al. [13] explored the synthesizing of carbon-based nanostructured materials (CNMs) using biomass. Taer et al. [14] derived porous and activated carbon nanosheet from natural Syzygium oleana leaves through a single-stage integrated pyrolysis process. The derived material was used as supercapacitor electrode in an energy storage device. Haile et al. [15] explored the possibility of employing pulp and paper as raw materials for the production of valuable biomaterials through green routes. Yan et al. [16] used argon, hydrogen, CO2, methane, and natural gas atmospheres at 1000 °C to produce Kraft lignin as a graphitized iron catalytic. Li et al. [17] showed that the reaction time to obtain Kraft lignin graphite is shorter than that when using natural graphene oxide. Lin et al. [18] prepared few layer graphene (FLG) without adding any strong acids or oxidants, using the green jet cavitation (JC) artificial graphite method. Lekshmi et al. [19] used simple flame synthesis and edible sunflower oil for preparing reduced graphene oxide (FRGO). Azmi et al. [20] investigated incubation time and incubation temperature to assess the stability of rGO layers on the surface of modified electrodes.
Copper is an inexpensive and readily available metal, thus copper nanoparticles are not too costly. Copper nanoparticles are characterized by physiochemical stability in compounds and can mix with metals, ceramics, and polymers. In recent years, copper oxide (CuO) nanomaterials have been recognized as one of the most important nanomaterials due to their fascinating properties. Because of their eco-friendly and cost-effective nature they have attracted attention from researchers as potential next-generation antibiotics. Due to their expensive reagents and the environmental hazards associated with CuO NPs (nanoparticles), synthesis and preparation have become major challenges for scientists. Xu et al. [21] explored the applications of CuO nanoparticles in dentistry. Akintelu et al. [22] successfully demonstrated the synthesis of CuO NP at low cost. Prasad et al. [23] synthesized various sizes of copper oxide nanoparticles from S. indica leaves and water extract via an ecofriendly synthetic route. Mahendra et al. [24] prepared copper oxide (CuO) at a comparatively lower cost using radio-frequency (RF) magnetron sputtering. Farhad et al. [25] subtracted cuprous oxide (Cu2O) thin films on fluorine-doped tin oxide (FTO) using a modified SILAR technique. Aher et al. [26] fabricated copper oxide nanoparticles (CuONPs) from Leucaena leucocephala L. leaf extract at room temperature. Qamar et al. [27] successfully synthesized Momordica charantia fruit extract for preparing CuO nanorods (CuO NRs) using analytical techniques. Manjunatha et al. [28] successfully prepared copper oxide nanoparticles from cupric nitrate and glycine solutions, using a simple solution combustion technique. Bruno et al. [29] successfully synthesized CuO nanoparticles using a hydrothermal approach at different reaction temperatures (60–220 °C). Moralesa et al. [30] prepared nanostructured CuO thin films by using spray pyrolysis at 200–300 °C.
Pandian and Pandurangan [31] fabricated a solid-state supercapacitor (ASSC) negative electrode using graphene nanosheet coupled with copper and doped in boron (CuBG). In some cases, H2SO4/PVA has been used as the quasi-solid electrolyte. Shokouhi et al. [32] produced PANI–PGO using ultrasonicated polymerization at a low temperature (0 °C). Shokouhi et al. [33] explored the anticorrosion and antifouling properties of epoxy-based polyaniline (PANI)–graphene oxide nanosheets (GONs) as paint coatings. Selim et al. [34] synthesized cuprous oxide nanospheres (decorated by graphene oxide nanosheets) (GO/Cu2O) with silicon carbide nanowires (GO/SiC) for application as blade-like antibacterial agents. Haidaria et al. [35] synthesized continuously grown graphene sheets that were wrapped with copper nanoparticles (CuNPs). Di Bernardo et al. [36] synthesized graphene film that was assembled with Cu nanocrystals using CuO nanoparticle reduction. Li et al. [37] prepared Cu2O and Au nanoparticles and nitrogen-doped graphene (denoted as Cu2O-Au/NG) using a green facile method. Bhavyasree and Xavier [38] synthesized copper oxide and carbon (CuO/C) nanocomposites from Adhatoda vasica leaf extract via an ecofriendly synthetic method. Ansari et al. [39] coated ultrafine CuO nanosheets (Ag-rGO/CuO with silver (Ag)) for decorated reduced graphene oxide (rGO) using microwave-assisted hydrothermal synthesis and chemical synthesis. Folorunso et al. [40] prepared reduced graphene oxide nanocomposite loaded with copper oxide (rGO/CuO) for energy storage applications. Siddique et al. [41] reduced GO to rGO, deposited CuO on the rGO surface, and synthesized reduced graphene oxide/copper oxide (rGO/CuO) nanocomposite using the single-step simple chemical method. Pratheepa and Lawrence [42] prepared reduced graphene oxide (rGO) precipitated on copper oxide (CuO) nanocomposites using a modified Hummers method. Yadav et al. [43] used a simple, cost-effective, ultrasound-assisted hydrothermal method to synthesize tungsten trioxide (WO3) and tungsten trioxide/reduced graphene oxide (WO3/rGO) composite. The formation of the WO3/rGO composite was confirmed by XPS and Raman analyses. The rGO enhanced the dye degradation efficiency from 56 to 94%, and the hydrogen production activity from 424.5 to 825.8 µmol/h⋅g. Yadav et al. [44] successfully synthesized spongy ball-like CuO and CuO/rGO photocatalysts using a simple hydrothermal method and further studied the material’s photocatalytic hydrogen production activity. The CuO/rGO composite displayed superior photocatalytic hydrogen production activity in comparison with CuO, with a hydrogen production rate of 19.2 mmol h−1 g−1 nearly three times higher than that of the CuO photocatalyst (6.8 mmol h−1 g−1).
The present work aimed to produce and investigate rGO/CuO nanocompsite properties at different rGO wt.%. The effect of test temperature and time on the crystallinity index (Ic) was investigated and compared using two methods. The effect of rGO% on rGO/CuO characteristics was measured using dynamic light scattering, XRD, FT-IR, and cyclic voltammetry methods.
2. Experimental
2.1. Materials
Copper sulphate hexahaydrate (Cu(NO3)2·6H2O) analytical reagent (AR) was purchased with 99% purity, and used as received from the supplier without any further purification. The grass was collected from stadiums in Taif, Saudi Arabia.
2.2. Synthesis of Graphene Oxide Nano-Particles
The grass was collected, washed well, cut into small pieces, then heated and dried at 1000 °C. The product was milled for 1 h, washed and then centrifuged, so that the precipitate was obtained in the form of graphene. A mixture of water and methanol was first used dispersing the graphene powder, followed by slowly adding 10 mL of H2O2 at 30% concentration. To obtain rGO sheets, the mixture was centrifuged for one hour. Then, thermal reduction was carried out at 400 °C for 5 h.
2.3. Synthesis of rGO-CuO Nanoparticles
Grass plants were used as the reducing agent for preparing copper oxide nanoparticles. Deionized water was used for dissolving copper sulphate hexahydrate by stirring for 45 min. Then, aqueous grass extract was added drop by drop until the pH of the final solution was adjusted to pH 8, according to [45]. The four samples with respective rGO wt. of 0.125%, 0.25%, 0.50%, and 0.75% were dispersed separately in 5 mL methanol and added to thepH 8 final solution, followed by stirring for 2 hrs. The precipitate was centrifuged, carefully washed with the ethanol/water mixture to remove impurities, kept in the dark for 15 h for the purpose of ageing, and then dried at 100 °C using a hot air oven. Finally, the dried powder was calcined at 300 °C for 5 h producing rGO/CuO mixtures of 0.125 wt.% rGO/CuO, 0.25 wt.% rGO/CuO, 0.50 wt.% rGO/CuO and 0.75 wt.% rGO/CuO.
2.4. Measurements
RGO/CuO specimen properties were investigated using electrochemical impedance spectroscopy, FTIR spectroscopy, dynamic light scattering, and X-ray diffraction devices. The synthesized materials’ galvanostatic charge–discharge curve and the results of electrochemical impedance spectroscopy were obtained. Zeta potential was calculated for measuring dispersed system stability. The size distribution of rGO-CuO nanoparticles’ hydrodynamic diameters was explored using dynamic light scattering (DLS) measurements. The Nyquist plots of rGO-CuO were measured at 100 kHz to 10 MHz. The effect of rGO wt.%, test temperatures, and time were investigated using two methods.
2.5. Characterization Techniques
Fourier transform infrared (FT-IR) spectroscopy (Perkin-Elmer RX X2 Infrared spectrometer spectra, Waltham, MA, USA) was used for the rGO/CuO specimens, with 4500–500 cm−1 wave range, 1 cm−1 intervals, and 4 cm−1 scanning resolution. X-ray diffraction (XRD) (PANalytical, X’Pert-PRO MPD, Malvern, UK) with Cu Kα radiation (k = 0.154 nm) was employed, using Ni-filtered Cu Kα radiation (λ = 1.5406 Å) at 40 kV and 30 mA. Nanoparticle analysis was carried out using a dynamic light scattering (DLS) instrument for measuring the particle size of rGO/CuO nanoparticles. The Zetasizer Nano series was used for determining the electrophoretic mobility of the rGO/CuO composites.
3. Results and Discussions
3.1. rGO/CuO X-ray Diffraction
Figure 1 shows the XRD analysis of synthesized rGO-CuO at different rGO wt.% at room temperature. The reduced graphene oxide/copper oxide composites’ X-ray diffraction results are shown in Table 1. There were four diffraction peaks, at 22°, 20°, 43.58°, 50.70°, and 74.37°, related to planes (111), (200), (202), (220), and (102) of CuO, and two diffraction peaks at 22.20° and 43.58°, related to planes (002) and (100) of reduced graphene oxide. It can be observed that as 2ϴ increased, the rGO/CuO crystallite size increased, while the micro strain values decreased in agreement with previous investigations. The maximum real intensity and the peak height for the planes were found at 2ϴ = 43.58° that related to planes (220) of CuO and (100) of rGO were in agreement with previous investigators. Also, As 2ϴ increased, the d-spacing values decreased along with the crystallite size increment and the micro strain decrement, in agreement with Scherrer’s results and formula [46]:
where t is the crystallite size, K = 0.89 is Scherrer constant, λ = 1.54060 Å is the radiation wavelength, β1/2 equals full width at half maximum (FWHM) of the (200) diffraction peak in radians, and θ is the corresponding Bragg’s angle.
t = [Kλ/(β1/2 cos ϴ)]
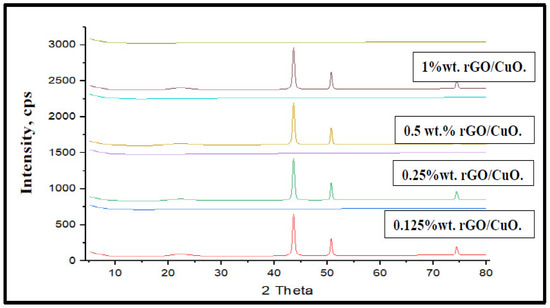
Figure 1.
XRD patterns rGO/CuO composites at different rGO wt.%, at room temperature.

Table 1.
XRD of rGO/CuO.
The (Ic) was calculated using two methods, the first (method A) according to the Segal empirical method [14] as in Equation (2):
where I200 is the crystallites’ peak intensity at 2θ = 22.5° and Iam is the amorphous cellulose intensity at 2θ = 18°–19°.
Ic%= CrI% = [(I200 − Iam)/I200] × 100
The second approach (method B) was calculated according to [47,48] as in Equation (3):
where Acryst is the calculated area under X-ray and Aamorph is the area under the X-ray pattern.
Ic% = [Acryst/(Acryst + Aamorph)] × 100
3.2. Effect of Additives on the Crystallinity Index (Ic) of rGO/CuO
Figure 2 and Table 2 illustrate the effect of rGO wt.% on the Ic of rGO. It is clear that as the rGO wt.% increased the Ic of rGO decreased, in agreement with Rashidian et al. [49], since the increment of rGO disturbed the rGO aggregation and crystallinity. Tienne et al. [50] concluded that low rGO wt% does not improve materials’ thermal resistance and does not accelerate the degradation process; however, with the rGO wt.% increment, the values of Ic, related to degradation temperature, also slowly increased. Hsieh and Liu [51] and Lin et al. [52] concluded that low rGO wt.% increased the matrix heat transfer, enhancing the activated thermal responses and increasing crystallinity, while El-Desoky et al. [53] found that higher rGO wt.% reduced the lattice distortion and both the particle size and the optical gap between particles increased. Dutta et al. [54] used different rGO% of 0, 20%, 50%, and 80% in CuO/rGO composites, but the increment of rGO wt.% showed no obvious influence on their morphology and size. However, Rashidian [49] found that direct incremental rGO wt.% addition increased the crystallinity index of the rGO/CuO composite. Dandia et al. [55] discussed the effect of CuO wt.% increments on rGO/CuO composites, they found the best results were obtained using 10.0 wt.% CuO. Dutta et al. [54] found that emission of CuO from rGO/CuO composites became more significant at lower rGO wt.%.
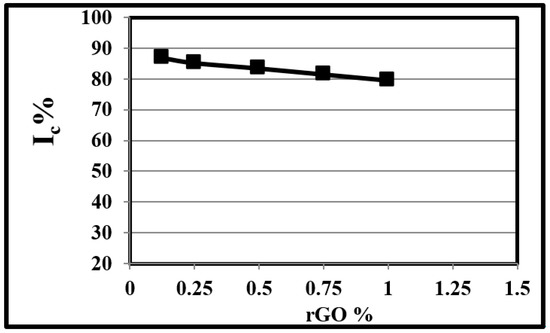
Figure 2.
Effect of rGO wt.% on the crystallinity index of rGO.

Table 2.
Effect of rGO wt.% on Ic of rGO at 20°C for 1 h.
3.3. Effect of Temperature on the Crystallinity Index (Ic) of rGO/CuO
Segal’s empirical method (method A) [48] and the sum of the area under the adjusted crystalline peaks [46,54] made use of the X-ray diffraction pattern to calculate the crystallinity index (Ic) at 1% rGO, 20 °C and 1 h, as given in Table 3 and shown in Figure 3, at various test temperatures. Table 4 and Figure 3 illustrate the effect of test periods on the Ic of rGO, CuO, and rGO/CuO at 1% rGO, 20 °C and 1 h.

Table 3.
Effect of temperature on Ic% values of rGO, CuO, and 1.0 Wt.% rGO/CuO at 1 h.
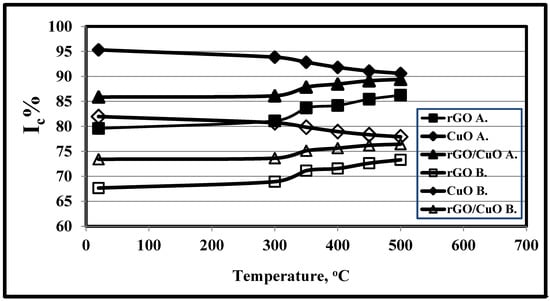
Figure 3.
Effects of test temperature on the crystallinity index values of rGO, CuO, and 1.0 wt.% rGO/CuO, using methods A and B at 1.0 h.

Table 4.
Effect of test time on Ic% values of rGO, CuO, and 1.0 wt.% rGO/CuO at 20 °C.
The CuO crystallinity index values in methods A and B were found to be higher than either the rGO/CuO or rGO values, due to the effect of the higher CuO crystallinity index and the CuO wt.% in the rGO/CuO composite. Also, the crystallinity index values of rGO, CuO, and rGO/CuO revealed by method A were higher than those from method B; the former were based on the sum of the area under the adjusted XRD peaks, not Acryst and Aamorph for the areas under the X-ray pattern in method B. It was observed that with the increase in temperature rGO/CuO Ic% increased from 85.88% to 89.42% and from 73.43% to 76.45% for methods A and B, respectively, and this observation is in agreement with Sahu et al. [55]. They suggested that rGO, CuO, and rGO/CuO crystallinity indexes increased with temperature increment due to particle collisions that resulting in a high level of agglomeration up to 550 °C and high values of Ic. Dandia et al. [53] found that 70 °C was optimal for maximum conversion to the rGO/CuO product. Also, it can be seen that as temperature increased, the Ic of rGO increased and that of CuO decreased, for both methods A and B. This was in agreement with Pratheepa and Lawrence [56], who concluded that rGO% increase significantly enhanced the yield of the photocatalytic reduction of CO2 to methanol, while Rashidian et al. [47] found that the Ic of rGO was 86.2%. Dutta et al. [54] showed that CuO content increment had no obvious influence on Ic, and Sahu et al. [55] concluded that with temperature increment, CuO Ic% decreased due to particle coalescence, as a result of which there was a decrease in the average crystallite size and Ic. Dandia et al. [53] found that the higher CuO IC% was 92%.
3.4. Effect of Test Period on Ic of rGO, CuO and rGO/CuO
Figure 4 and Table 4 illustrate that as the period of test time increased, the crystallinity index values of rGO, CuO and rGO/CuO decreased. The Ic% of CuO (A) values were found to be highest, followed by rGO/CuO (A) and rGO (A) respectively, as explored in Section 3.3. When the test period increased, Ic values decreased from 85.88% to 75.68% and 71.28% to 62.81% for rGO/CuO methods A and B, respectively, in agreement with [51,52,53,54,55,56,57,58,59,60,61,62,63,64], which proves that the temperature effect had a higher effect compared with the test time period, in agreement with [58,59,60,61,62]. Kargarzadeh et al. [65] and Kian et al. [66] proved that increasing the test time beyond 30 min decreased the crystallinity index values, among which the best values were achieved at 40 min at 45 °C and 65% sulfuric acid [63]. However, Al-Dulaimi et al. [67] found that the best crystallinity index values using hydrolysis reaction were achieved at 80 min with 58% sulfuric acid. Figure 3 and Table 4 illustrate that the crystallinity index values of CuO ranged from 95.33% to 84.23% and from 79.12% to 69.91% for methods A and B, respectively, and those for rGO ranged from 79.6% to 65.23% and from 66.07% to 54.14% for methods A and B, respectively.
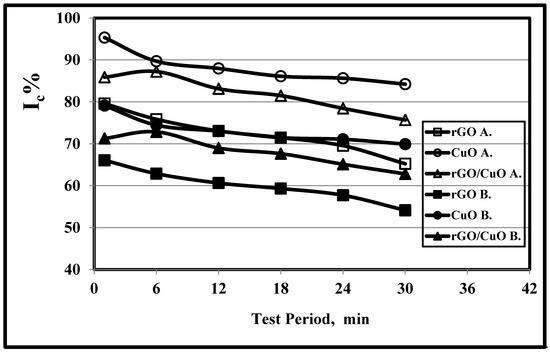
Figure 4.
Effect of test period on the on the crystallinity index values of rGO, CuO, and 1.0 wt.% rGO/CuO, using both methods A and B at 20 °C.
3.5. Dynamic Light Scattering (DLS) Analysis
The number of particles in the rGO/CuO composites and their size distribution are shown in Figure 5, using dynamic light scattering (DLS) measurements, at (a) 0.125 wt.% rGO, (b) 0.250 wt.% rGO, (c) 0.50 wt.% rGO, and (d) 1.0 wt.% rGO. DLS measurements of the rGO/CuO composites’ size (d.nm) at room temperature are were 80 nm, 35 nm, 7.5 nm, and 0.5 nm for 0.125 wt.% rGO, 0.250 wt.% rGO, 0.50 wt.% rGO and 1.0 wt.% rGO, respectively. So, as the wt.% of rGO in the rGO/CuO composites increased, the average size (d.nm) decreased, in agreement with previous investigators (53, 55–56). Sumedh et al. [4] found that CuO has an average size of 15–27 nm whereas rGO size varies from 15 to 80 nm for rGO/CuO composites, and Mahjouri et al. [68] showed that DLS analysis of rGO-CuO composites produces average size ranges from 43 to 86 nm. Hassan et al. [69] showed that 90% of CuNPs were less than 85.45 nm in size, and Yu et al. [70] found that the CuNP sizes ranged from 15 to 165 nm. Shinde et al. [71], Małolepszy et al. [72], and Muthuvel et al. [73] all found ranges of CuO NP particle size distribution between 55 and 78 nm.
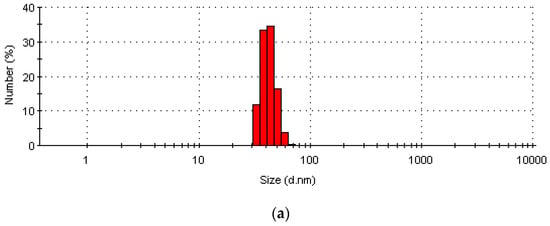
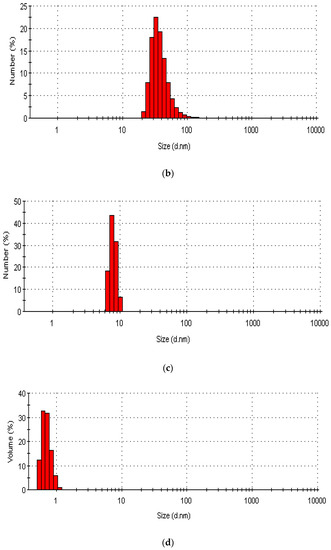
Figure 5.
DLS particles and size distribution of rGO/CuO composites at (a) 0.125 wt.% rGO, (b) 0.250 wt.% rGO, (c) 0.50 wt.% rGO, and (d) 1.0 wt.% rGO.
3.6. Zeta Potential
Zeta potential is the most important indicator for measurement of stability of a dispersed system; Figure 6 illustrates the effect of various rGO wt.% in rGO-CuO nanoparticles versus zeta potential. The composites contained negative charges of −32.5 mV, −44.8 mV, −53.4 mV, and −66.3 mV for rGO wt.% ranges of 0.125, 0.25, 0.5, and 1.0 (Y1, Y2, Y3 and Y4), respectively, indicating that as the rGO wt.% increased the electrostatic repulsive forces did also. Liu et al. [74] proved that the slight current separation between the anodic and cathodic currents was related to the poor electrochemical performance of the rGO wt.%. Gao et al. [75] indicated that 5.0 wt.% rGO, 10.0 wt.% rGO, and 15.0 wt.% rGO in rGO/CuO composites recorded −16.8, −14.3 and −10.1 mV, respectively. Sudhakar et al. [76] found that the stability of rGO/CuO decreased with increased rGO wt.% in the composite. According to our results and those of previous investigators, it is clear that rGO wt.% increases in the rGO/CuO composites imply negative charges. Also, Sarkar and Dolu [77] concluded that the efficiency and activity of the rGO/CuO depended on both CuO and rGO wt. percentages. They found that as CuO wt.% increased, the CuO/rGO composite activity increased. Zhou et al. [78] found that an increase of CuO wt.% within rGO/CuO composites improved their current density and potential, considering CuO with 89% current density and rGO with 59% current density. Du et al. [79] observed that increases in the rGO content in the rGO/CuO composites increased the CuO surface area and resulted in higher CuO dispersity and rGO/CuO interaction.
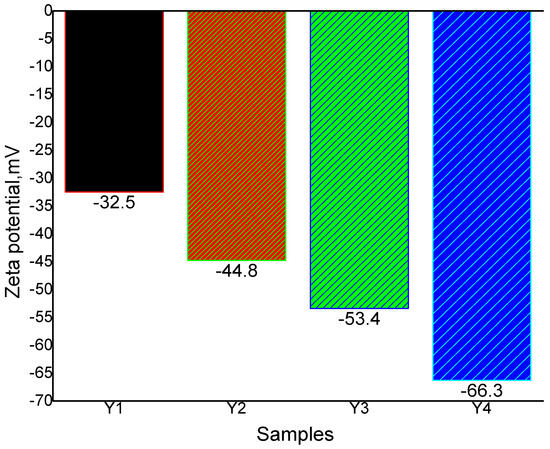
Figure 6.
Zeta potential of rGO-CuO (Y1,Y2,Y3 and Y4) nanoparticles.
3.7. FTIR Analyses
FTIR spectroscopy helped us to identify the various vibrational frequencies in the synthesized rGO/CuO nanocomposite, and the whole spectra is shown in Figure 7. Figure 7 illustrates the rGO/CuO FTIR analysis at 1.0 wt.% rGO/CuO at room temperature. Therewere three drastic decrement intensity peaks of C=O, C–OH, and C–O groups with the generation of new peaks at 576 cm−1, 505 cm−1 and 453 cm−1 corresponding to CuO stretching vibrations, that were explained by Gulati et al. [80] in agreement with Sarkar and Dolui [77]. The formation of CuO was confirmed by three peaks between the 600 cm−1 and 400 cm−1 bands, according to [81,82]. The Cu–O functional group vibrations caused a strong peak at the absorption band around 629 cm−1, as described by [83]. Sagadevan [84] connected the Cu–OH vibration to the 882 cm−1 peak, which proved the successful preparation of rGO/CuO nanocomposites in agreement with [85,86,87]. Sagadevan [88] related the absorption peak at 432 cm−1 to the CuO stretching vibrations, confirming the CuO decoration on the rGO surface. There were three peaks observed of 1180 cm−1, 1021 cm−1, and 1708 cm−1 related to C–O epoxy, C–O alkoxy, and C=O carbonyl stretching vibration, indicating the formation of Cu2O–rGO composites in agreement with [86].
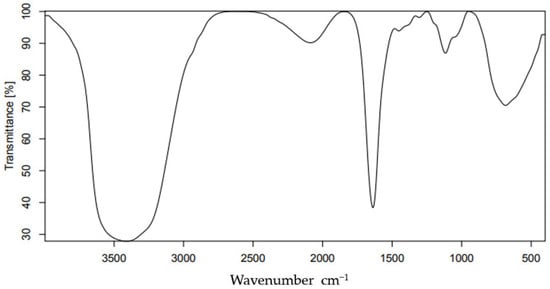
Figure 7.
FTIR spectrum of 1.0% wt.% rGO-CuO nanoparticles at room temperature.
Also, there was a high intense peak at 2750 cm−1 due to the removal of oxygen-containing functional groups in the GO, and seven lower intensity peaks of 3425 cm−1, 1736 cm−1, 1621 cm−1, 1560 cm−1, 1396 cm−1, 1215 cm−1, and 1045 cm−1 related to OH groups, the stretching of carboxylic acid groups, sp2-hybridized C groups remaining after oxidation, graphitic carbon, tertiary C-OH groups, epoxy symmetric ring deformation, and C-O stretching vibrations of alkoxy groups, respectively, in agreement with [87]. Abulizi et al. [83] attributed the disappearance of the 1066 cm−1, 1288 cm−1 and 1724 cm−1, 3448 cm−1 peaks to the removal of oxygen from the rGO functional groups, and the 1605 cm−1 peak to the strong C-C related to the rGO strong band, which demonstrated that hydrazine hydrate had reduced the GO.
According to Ghayeb et al. [88], the intensity peaks between 1300 cm−1 and 3500 cm−1 of the absorption bands were related to H2O and CO2 molecules, as these molecules were chemisorbed and/or physisorbed on the copper oxide crystal surfaces, in agreement with [89]. The broad of 3420 cm−1 is either due to OH or the water molecule present. Liu et al. [90] related the intensity peaks at 1625 cm−1 and 1719 cm−1 to the O–H bending vibration and the C=O stretching of COOH group, respectively. The peaks at 1382 cm−1 and around 1000 cm−1 were related to O–H deformation vibration and metal oxide rising values, respectively, according to [91,92,93]. According to Lin et al. [94], the intensity peak at 3425 cm−1 was related to the carboxyl decomposition groups that caused the 1736 cm−1 diminished intensity. The 458 cm−1 intensity peak was confirmed due to the CuO stretching mode in the rGO-CuO composites, according to analysis by [95].
3.8. Electrochemical Impedance and Cyclic Voltametry of rGO/CuO
Cyclic voltammetry (CV) was applied to analyze the synthesized materials, illustrating the galvanostatic charge–discharge curve and obtaining the electrochemical impedance spectroscopy results.
Figure 8a shows the rGO-CuO Faradaic redox pattern electrode using the CV curve with the potential ranging from −2 V to +2 V, on which rGO was employed as an anode and CuO as a cathode. A large rectangle curve was obtained illustrating the electrochemical activity increment resulting from the conduction of the reduced graphene oxide–copper oxide composite, in agreement with [96]. The rate of charge exchange resulted in diffusion of the anions and cations towards the electrode–electrolyte interfaces. So, due to the electrode and electrolyte interface, CuO diffused onto the graphene surface which influenced more ions’ diffusion, in agreement with [84]. The electrochemical activity contributes to the large capacitance of rGO-CuO that can be calculated according to the formula:
where Csp is the specific capacitance (in F/g), Idv is the integrated area, m is the electrode mass active material (in gram), v is the scan rate (in mV/s), and ΔV is the potential window (in V).
Csp = I dv/2 mvΔ V
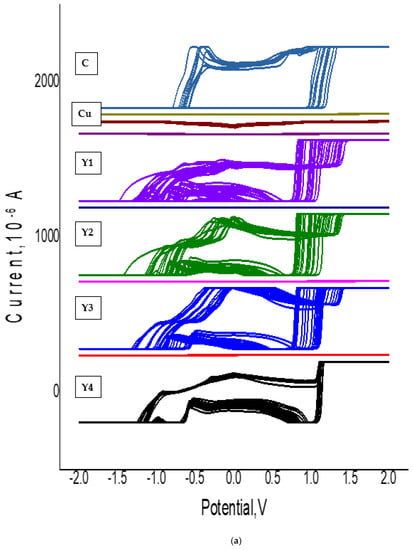
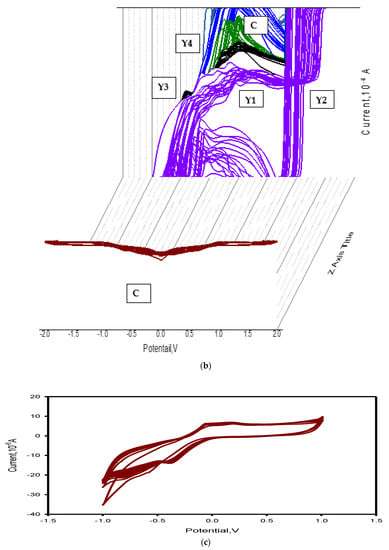
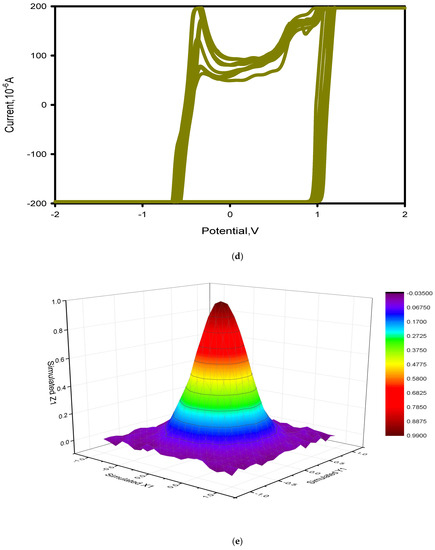
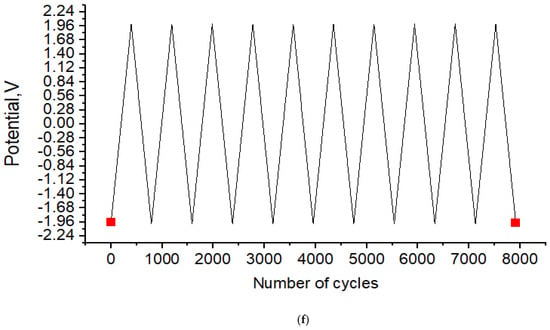
Figure 8.
Electrochemical measurements: (a,b) cyclic voltammetry of all nanoparticles, (c) cyclic voltammetry of CuO nano-particles, (d) cyclic voltammetry of GO nano-particles, and (e,f) statistical stability and number of cycles of stable charge-discharge.
Figure 8b illustrates the effect of rGO wt.% on the rGO/CuO electrochemical capacitance, represented in their galvanostatic charge–discharge curves. Figure 8b illustrates the CV curves of rGO/CuO specimens; Y1, Y2, Y3, and Y4 of 0.125 wt.% rGO; 0.5 wt.% rGO, 0.75 wt.% rGO, and 1.0 wt.% rGO, respectively, at different scan rates. As the scan rate increased, the anodic and cathodic currents both increased in agreement with [97], by which the double-layer capacitor linear triangular shape proved that the electrochemical adsorption not only related to the electrode but also to the electrolyte.
Figure 8c shows the cyclic voltammetry of the synthesized rGO and CuO nanoparticles at different scan rates. The rGO electrochemical redox reaction for CuO has an anodic peak of 10.0 V for Cu2+ oxidation; the reduction peak observed at 10.0 V clearly indicated the improvement of the copper oxidation signal due its combination with graphite nanoparticles, in agreement with [98]. The specific capacitance values at different rGO wt.% of rGO-CuO nanoparticles were 561, 582, 597 and 611 F/g for specimens Y1, Y2, Y3 and Y4, respectively, at 2 V·s−1 scan rate. With rGO wt.% increments, the capacitance increased, so the specimen Y4 showed higher electrochemical performance. As the specific capacitance of the synthesized material was below 611 F/g, the material can act as an electrode material for supercapacitor applications.
Figure 8d illustrates the rGO/CuO nanostructured hybrid system that successfully operated over a wide range of current densities with only a low voltage drop. The charge–discharge curves showed symmetricity, proving the CuO component’s pseudo-capacitive nature. A small initial voltage drop was observed at discharge that indicated very little internal resistance and good conductivity with special capability for a very quick charge. So, during the oxidation reduction reaction, the mixing of rGO in the CuO nanostructure increased the electroactive surface utilization, in agreement with [99]. Due to high specific surface area as well as the porous nature of rGO-CuO, the columbic efficiency was found to be more than 99% even after 8000 cycles. The results showed that during the first 300 cycles, the rGO-CuO electrode’s specific capacitance increased 10% at current density of 10 Ag−1, and the specific capacitance was found to be between 500 to 8000 cycles. This proves the rGO/CuO composite’s cyclic stability coupled with higher rGO-CuO electrode reversibility. So, the electrochemical impedance and cyclic voltammetry succeeded in the evaluation of the rGO/CuO electrode material’s capacitive nature.
Figure 8e demonstrated the rGO/CuO Nyquist plots at 100 kHz to 10 MHz frequencies considering an open circuit potential. By uncovering the predominant electrical conductivity of rGO/CuO material, the rGO/CuO nanoparticles maintain the ion and electron transfer in the electrode as well as the electrolyte. For Y1, Y2, Y3, and Y4, the X-intercept was found to be 0.6 Ohm, proving good conductivity and excellent electrochemical properties for rGO-CuO nanoparticles. The electric capacitance double layer ascribed to the rGO and the pseudo capacitance related to CuO were in agreement with [100]. Zhao et al. [101] related the excellent electrochemical properties of rGO/CuO to the large surface area, and the number of electron channels in the synthesized CuO/CNTs-rGO nanocomposite.
Figure 8f displays the rGO/CuO nanocomposite charge–discharge profile from 0.0 cycle to 8000 cycles. The figure shows that up to 8000 cycles, 99% capacitance retention was observed with no significant specific capacitance decrement, indicating stability of the rGO/CuO electrode across the potential range, in agreement with Subramani et al. [102]. Their conclusion illustrated the relationship between statistical stability and the number of cycles of stable charge–dis-charge during the cycling study, using the rGO/CuO nanocomposite charge–discharge profile.
4. Conclusions
The following conclusions were obtained:
- The rGO-CuO composites had XRD diffraction peaks at 22°, 20°, 43.58°, 50.70°, and 74.37° related to the (111), (200), (202), (220), and (102) planes of pure CuO, and peaks at 22.20° and 43.58° were assigned to the (002) and (100) planes of reduced graphene oxide.
- The crystallite sizes of the rGO/CuO XRD peaks were 18.114320 Å, 225.1856 Å, 321.41740 Å, and 365.98290 Å and the micro strain results for 2ϴ were 22.2031°, 43.5865°, 50.7050°, and 74.3729°, respectively.
- As the rGO wt.% increased the crystallinity index (Ic) of rGO/CuO decreased directly.
- The values of the crystallinity index based on Segal’s empirical method [14] were found to be higher than those based on the Acryst and (Aamorph) total area for all rGO, CuO, and rGO/CuO values.
- As the test temperature increased, the crystallinity index for both rGO and rGO/CuO increased and that for CuO decreased. CuO had higher Ic values followed by rGO/CuO and rGO values, respectively.
- As the test period increased, the crystallinity index values of rGO, CuO, and rGO/CuO decreased according to both the previous methods. CuO had higher Ic values followed by rGO/CuO and rGO, respectively.
- The effect of test temperature on the crystallinity index values of CuO, rGO/CuO, and rGO was found to be higher than the effect of test periods.
- The DLS measurement reported an average crystallite size of 0.7, 8.8, 25.4, and 38.5 nm for 0.125%, 0.25%, 0.50%, and 1.0% rGO-CuO respectively. So, as the rGO% increased, the average crystallite size increased.
- The rGO/CuO composite contained negative charges of; −32.5 mV, −44.8 mV, −53.4 mV, and −66.3 mV for 0.125%, 0.25%, 0.5%, and 1.0% rGO/CuO, respectively, which indicated that as the rGO wt.% increased the electrostatic repulsive forces increased also.
- FTIR spectroscopy identified the existence of vibrational frequencies and the pseudo-capacitance mode related to CuO nanoparticles.
- The cyclic voltammetry of rGO-CuO indicated the electrochemical activity increment, large capacitance, and conduction of the reduced rGO/CuO composite.
- The specific capacitance measurements were 561 F/g, 582 F/g, 597 F/g, and 611 F/g for Y1, Y2, Y3 and Y4 of rGO/CuO composites at a scan rate of 2 V·s−1, indicating good electrochemical performance. As rGO wt.% increased, the specific capacitance increase.
- The specific capacitance was found to be between 500 and 8000 cycles, indicating that rGO/CuO cyclic stability was coupled with higher rGO-CuO electrode reversibility. So, the electrochemical impedance and cyclic voltammetry successfully evaluated the rGO/CuO electrode materials’ capacitive nature.
- As per the specific capacitance found below 611 F/g, rGO/CuO can act as an electrode material for supercapacitor applications.
Author Contributions
Formal analysis, A.K.A.; Funding acquisition, A.K.A.; Investigation, A.T.M.; Methodology, A.T.M., A.K.A., H.M.A.-D. and A.M.F.; Software, H.M.A.-D., A.M.F. and A.K.A.; Supervision, T.P.; Visualization, Z.A.A., T.P. and A.K.A.; Writing—original draft, H.M.A.-D. and A.K.A. All authors have read and agreed to the published version of the manuscript.
Funding
The authors would like to extend their sincere thanks to the High Altitude Research Center, Taif University for its funding of this research through the Research Group of Project number: 1-442-47.
Institutional Review Board Statement
Not applicable.
Informed Consent Statement
Not applicable.
Data Availability Statement
The authors confirm that the data supporting the study’s findings are included in the article.
Acknowledgments
All the authors would like to extend their sincere thanks to High Altitude Research Center, Taif University for its funding of this research through the Research Group; Project number: 1-442-47.
Conflicts of Interest
The authors declare no conflict of interest.
References
- Chen, Q.; Tan, X.; Liu, Y.; Liu, S.; Li, M.; Gu, Y.; Zhang, P.; Ye, S.; Yang, Z.; Yang, Y. Biomass-derived porous graphitic carbon materials for energy and environmental applications. J. Mater. Chem. A 2020, 8, 5773–5811. [Google Scholar] [CrossRef]
- Ozbay, N.; Yargic, A.S. Carbon foam production from bio-based polyols of liquefied spruce tree sawdust: Effects of biomass/solvent mass ratio and pyrolytic oil addition. J. Appl. Polym. Sci. 2018, 136, 47185. [Google Scholar] [CrossRef]
- Jain, A.; Balasubramanian, R.; Srinivasan, M. Hydrothermal conversion of biomass waste to activated carbon with high porosity: A review. Chem. Eng. J. 2016, 283, 789–805. [Google Scholar] [CrossRef]
- Surwade, S.P.; Smirnov, S.N.; Vlassiouk, I.V.; Unocic, R.R.; Dai, S.; Mahurin, S.M. Water desalination using nanoporous single-layer graphene with tunable pore size. Nat. Nanotechnol. 2015, 10, 1–26. [Google Scholar] [CrossRef] [PubMed]
- Abbas, A.; Mariana, L.T.; Phan, A.N. Biomass-waste derived graphene quantum dots and their applications. Carbon 2018, 140, 77–99. [Google Scholar] [CrossRef]
- Ahmed, M.B.; Johir, A.H.; Zhou, J.L.; Ngo, H.H.; Nghiem, L.D.; Richardson, C.; Moni, M.A.; Bryant, M.R. Activated carbon preparation from biomass feedstock: Clean production and carbon dioxide adsorption. J. Clean. Prod. 2019, 225, 405–413. [Google Scholar] [CrossRef]
- Xu, M.; Xing, L.; Zhang, Q.; Pu, J. Ultrasonic-assisted Method of Graphite Preparation from Wheat Straw. BioResources 2017, 12, 6405–6417. [Google Scholar] [CrossRef]
- Wang, J.; Nie, P.; Ding, B.; Dong, S.; Hao, X.; Dou, H.; Zhang, X. Biomass derived carbon for energy storage devices. J. Mater. Chem. A 2017, 5, 2411–2428. [Google Scholar] [CrossRef]
- Ding, Z.; Li, F.; Wen, J.; Wang, X.; Sun, R. Gram-scale synthesis of single-crystalline graphene quantum dots derived from lignin biomass. Green Chem. 2018, 20, 1383–1390. [Google Scholar] [CrossRef]
- Das, V.K.; Shifrina, Z.B.; Bronstein, L.M. Graphene and graphene-like materials in biomass conversion: Paving the way to the future. J. Mater. Chem. A 2017, 5, 25131–25143. [Google Scholar] [CrossRef]
- Zhang, B.; Jiang, Y.; Balasubramanian, R. Synthesis, formation mechanisms and applications of biomass-derived carbonaceous materials: A critical review. J. Mater. Chem. A 2021, 9, 24759–24802. [Google Scholar] [CrossRef]
- Ogale, A.A.; Zhang, M.; Jin, J. Recent advances in carbon fibers derived from biobased precursors. J. Appl. Polym. Sci. 2016, 133, 1–13. [Google Scholar] [CrossRef]
- Mugadza, K.; Stark, A.; Ndungu, P.G.; Nyamori, V.O. Synthesis of carbon nanomaterials from biomass utilizing ionic liquids for potential application in solar energy conversion and storage. Materials 2020, 13, 3945. [Google Scholar] [CrossRef]
- Taer, E.; Apriwandi, A.; Taslim, R.; Agutino, A.; Yusra, D.A. Conversion Syzygium oleana leaves biomass waste to porous activated carbon nanosheet for boosting supercapacitor performances. J. Mater. Res. Technol. 2020, 9, 13332–13340. [Google Scholar] [CrossRef]
- Haile, A.; Gelebo, G.G.; Tesfaye, T.; Mengie, W.; Mebrate, M.A.; Abuhay, A.; Limeneh, D.Y. Pulp and paper mill wastes: Utilizations and prospects for high value-added biomaterials. Bioresour. Bioprocess. 2021, 8, 1–22. [Google Scholar] [CrossRef]
- Yan, Q.; Zhang, X.; Li, J.; Hassan, E.B.; Wang, C.; Zhang, J.; Cai, Z. Catalytic conversion of Kraft lignin to bio-multilayer graphene materials under different atmospheres. J. Mater. Sci. 2018, 53, 8020–8029. [Google Scholar] [CrossRef]
- Li, J.; Yan, Q.; Zhang, X.; Zhang, J.; Cai, Z. Efficient Conversion of LigninWaste to High Value Bio-Graphene Oxide Nanomaterials. Polymer. 2019, 11, 623. [Google Scholar] [CrossRef]
- Lin, P.C.; Wu, J.Y.; Liu, W.R. Green and facile synthesis of few layer graphene via liquid exfoliation process for Lithium-ion batteries. Sci. Rep. 2018, 8, 9766. [Google Scholar] [CrossRef]
- Lekshmi, G.S.; Tamilselvi, R.; Geethalakshmi, R.; Kirupha, S.D.; Bazaka, O.; Levchenko, I.; Bazaka, K.; Mandhakini, M. Multifunctional oil-produced reduced graphene oxide—Silver oxide composites with photocatalytic, antioxidant, and antibacterial activities. J. Colloid Interface Sci. 2022, 608, 294–305. [Google Scholar] [CrossRef]
- Azmi, A.F.M.; Kannan, V.; Yasin, N.S.; Abdul Rashi, J.I.; Omar, A.; Emee Marina Salleh, E.M. Effect of time and temperature on reduced graphene oxide (rGO) layer stability and cyclic voltammetric behaviour of modified screen-printed carbon electrode (mSPCE) for biosensing purposes. Malays. J. Anal. Sci. 2020, 24, 800–809. [Google Scholar]
- Xu, V.W.; Nizam, M.Z.I.; Yin, I.X.; Yu, O.Y.; Lung, C.Y.K.; Chu, C.H. Application of Copper Nanoparticles in Dentistry. Nanomaterials 2022, 12, 805. [Google Scholar] [CrossRef] [PubMed]
- Akintelu, S.A.; Folorunso, A.S.; Folorunso, F.A.; Oyebamiji, A.K. Green synthesis of copper oxide nanoparticles for biomedical application and environmental remediation. Heliyon 2020, 6, e04508. [Google Scholar] [CrossRef] [PubMed]
- Prasad, K.S.; Patra, A.; Shruthi, G.; Chandan, S. Aqueous Extract of Saraca indica Leaves in the Synthesis of Copper Oxide Nanoparticles: Finding a Way towards Going Green. J. Nanotechnol. 2017, 2017, 7502610. [Google Scholar]
- Mahendra, G.; Malathi, R.; Kedhareswara, S.; Lakshmi-Narayana, A.; Dhananjaya, M.; Guruprakash, N.; Hussain, O.; Mauger, A.; Julien, C. RF Sputter-Deposited Nanostructured CuO Films for Micro-Supercapacitors. Appl. Nano 2021, 2, 46–66. [Google Scholar] [CrossRef]
- Farhad, S.F.U.; Majumder, S.; Hossain, A.; Tanvir, N.I.; Akter, R.; Patwary, A.M. Effect of Solution pH and Post-annealing temperatures on the Optical Bandgap of the Copper Oxide Thin Films Grown by modified SILAR Method. MRS Adv. 2019, 4, 937–944. [Google Scholar] [CrossRef]
- Aher, Y.B.; Jain, G.H.; Patil, G.E.; Savale, A.R.; Ghotekar, S.K.; Pore, D.M.; Pansambal, S.S.; Deshmukh, K.K. Biosynthesis of copper oxide nanoparticles using leaves extract of Leucaena leucocephala L. and their promising upshot against the selected human pathogens. Int. J. Mol. Clin. Microbiol. 2017, 7, 776–786. [Google Scholar]
- Qamar, H.; Rehman, S.; Chauhan, D.K.; Tiwari, A.K.; Upmanyu, V. Green synthesis, characterization and antimicrobial activity of copper oxide nanomaterial derived from momordica charantia. Int. J. Nanomed. 2020, 15, 2541–2553. [Google Scholar] [CrossRef]
- Manjunatha, K.B.; Bhat, R.S.; Shashidhara, A.; Kumar, H.S.A.; Nagashree, S. Antimicrobial and Nonlinear Optical Studies of Copper Oxide Nanoparticles. J. Electron. Mater. 2021, 50, 3415–3421. [Google Scholar] [CrossRef]
- Bruno, E.; Haris, M.; Mohan, A.; Senthilkumar, M. Temperature effect on CuO nanoparticles via facile hydrothermal approach to effective utilization of UV–visible region for photocatalytic activity. Appl. Phys. A 2021, 127, 925. [Google Scholar] [CrossRef]
- Moralesa, J.; Sa´ncheza, L.; Martín, F.; Barradob, J.R.R.; Sánchez, M. Use of low-temperature nanostructured CuO thin films deposited by spray-pyrolysis in lithium cells. Thin Solid Film 2005, 474, 133–140. [Google Scholar] [CrossRef]
- Pandian, P.M.; Pandurangan, A. Copper nanoparticles anchored onto boron-doped graphene nanosheets for use as a high performance asymmetric solid-state supercapacitor. RSC Adv. 2019, 9, 3443–3461. [Google Scholar] [CrossRef]
- Shokouhi, S.F.; Nasirpouri, F.; Khatamian, M. Epoxy-matrix polyaniline/p-phenyl enedi-amine functionalised graphene oxide coatings with dualanti-corrosion and anti-fouling performance. R. Soc. Chem. RSC Adv. 2021, 11, 11627–11641. [Google Scholar] [CrossRef]
- Fazli-Shokouhi, S.; Nasirpouri, F.; Khatamian, M. Polyaniline-modified graphene oxide nanocomposites in epoxy coatings for enhancing the anticorrosion and antifouling properties. J. Coat. Technol. Res. 2019, 16, 983–997. [Google Scholar] [CrossRef]
- Selim, M.S.; Mo, P.J.; Hao, Z.; Fatthallah, N.A.; Chen, X. Blade-like structure of graphene oxide sheets decorated with cuprous oxide and silicon carbide nanocomposites as bactericidal materials. J. Colloid Interface Sci. 2020, 578, 698–709. [Google Scholar] [CrossRef]
- Haidaria, M.M.; Kimb, H.; Kima, J.H.; Leec, S.; Yud, Y.J.; Kime, J.T.; Choif, C.G.; Choia, J.S. Graphene laminated Cu nanoparticle arrays by spontaneous formation through dewetting. J. Ind. Eng. Chem. 2018, 64, 367–372. [Google Scholar] [CrossRef]
- Di Bernardo, I.; Bradford, J.; Fusco, Z.; Mendoza, J.; Phu, T.T.; Bo, R.; Motta, N.; Tricoli, A. Self-assembly of noble metal-free grapheme—Copper plasmonic metasurfaces. J. Mater. Chem. C 2020, 8, 11896–11905. [Google Scholar] [CrossRef]
- Li, S.; Yang, B.; Wang, C.; Wang, J.; Feng, Y.; Yan, B.; Xiong, Z.; Du, Y. A facile and green fabrication of Cu2O-Au/NG nanocomposites for sensitive electrochemical determination of rutin. J. Electroanal. Chem. 2017, 786, 20–27. [Google Scholar] [CrossRef]
- Bhavyasree, P.G.; Xavier, T.S. Green synthesis of copper oxide/carbon nanocomposites using the leaf extract of Adhatoda vasica Nees, their characterization and antimicrobial activity. Heliyon 2020, 6, e03323. [Google Scholar] [CrossRef]
- Ansari, A.R.; Ansari, S.A.; Parveen, N.; Ansari, M.O.; Osman, Z. Silver Nanoparticles Embedded on Reduced Graphene Oxide@Copper Oxide Nanocomposite for High Performance Supercapacitor Applications. Materials 2021, 14, 5032. [Google Scholar] [CrossRef]
- Folorunso, O.; Sadiku, R.; Hamam, Y.; Ray, S.S. An investigation of copper oxide-loaded reduced graphene oxide nanocomposite for energy storage applications. Appl. Phys. A 2021, 128, 54. [Google Scholar] [CrossRef]
- Siddique, S.; ul-Abdin, Z.; Waseem, M.; Naseem, T.; Bibi, A.; Hafeez, M.; Ud Din, S.; Haq, S.; Ureshi, S. Photo-catalytic and anti-microbial activities of rGO/CuO nanocomposite. J. Inorg. Organomet. Polym. Mater. 2021, 31, 1359–1372. [Google Scholar] [CrossRef]
- Pratheepa, M.I.; Lawrence, M. Synthesis of CuO-reduced graphene oxide nanocomposite for high performance electrochemical Capacitors. Int. J. Res. 2018, 5, 4519–4524. [Google Scholar]
- Yadav, A.A.; Hunge, Y.M.; Kang, S.W. Porous nanoplate-like tungsten trioxide/reduced graphene oxide catalystfor sonocatalytic degradation and photocatalytic hydrogen production. Surf. Interfaces 2021, 24, 101075. [Google Scholar] [CrossRef]
- Yadav, A.; Hunge, Y.; Kang, S.-W. Spongy ball-like copper oxide nanostructure modified by reduced graphene oxide for enhanced photocatalytic hydrogen production. Mater. Res. Bull. 2020, 133, 111026. [Google Scholar] [CrossRef]
- Ding, D.; Maeyoshi, Y.; Kubota, M.; Wakasugi, J.; Takemoto, K.; Kanamura, K.; Abe, H. Li-ion conducting glass ceramic (LICGC)/reduced graphene oxide sandwich-like structure composite for high-performance lithium-ion batteries. J. Power Sources 2021, 500, 229976. [Google Scholar] [CrossRef]
- Segal, L.; Creely, J.J.; Martin, A.E., Jr.; Conrad, C.M. An Empirical Method for Estimating the Degree of Crystallinity of Native Cellulose Using the X-Ray Diffractometer. Text. Res. J. 1959, 29, 786–794. [Google Scholar] [CrossRef]
- Chen, Y.W.; Tan, T.H.; Lee, H.V.; Abd Hamid, S.B. Easy fabrication of highly thermal-stable cellulose nanocrystals using Cr(No3)3 catalytic hydrolysis system: A feasibility study from macroto nano-dimensions. Materials 2017, 10, 42. [Google Scholar] [CrossRef]
- Ling, Z.; Wang, T.; Makarem, M.; Cintrón, M.S.; Cheng, H.N.; Kang, X.; Bacher, M.; Potthast, A.; Rosenau, T.; King, H.; et al. Effects of ball milling on the structure of cotton cellulose. Cellulose 2019, 26, 305–328. [Google Scholar] [CrossRef]
- Rashidian, E.; Babaeipour, V.; Chegeni, A.; Khodamoradi, N.; Omidi, M. Synthesis and characterization of bacterial cellulose/graphene oxide nano-biocomposites. Polym. Compos. 2021, 42, 4698–4706. [Google Scholar] [CrossRef]
- Tienne, L.G.P.; Candido, L.S.; Cruz, B.S.M.; Gondim, F.F.; Ribeiro, M.P.; Sim~ao, R.A.; Marques, M.F.V.M.; Monteiro, S.N. Reduced graphene oxide synthesized by a new modified Hummer’s method for enhancing thermal and crystallinity properties of Poly(vinylidene fluoride). J. Mater. Res. Technol. 2022, 18, 4871–4893. [Google Scholar] [CrossRef]
- Hsieh, C.C.; Liu, W.R. Synthesis and characterization of nitrogen-doped graphene nanosheets/copper composite film for thermal dissipation. Carbon 2017, 118, 1–12. [Google Scholar] [CrossRef]
- Lin, P.; Cong, Y.; Sun, C.; Zhang, B. Non-covalent modification of reduced grapheme oxide by a chiral liquid crystalline surfactant. Nanoscale-R. Soc. Chem. 2016, 8, 2403–2411. [Google Scholar] [CrossRef]
- El-Desoky, M.M.; Abdulrazek, M.M.; Sharaby, Y.A. Characterization and optical properties of reduced grapheme oxide doped nano-crystalline vanadium pentoxide. Opt. Quantum Electron. 2020, 52, 315. [Google Scholar] [CrossRef]
- Dutta, K.; Das, K.; Chakrabarti, K.; Jana, D.; De, S.K. Highly efficient photocatalytic activity of CuO quantum dot decorated rGO nanocomposites. J. Phys. D Appl. Phys. 2016, 49, 315107. [Google Scholar] [CrossRef]
- Dandia, A.; Bansal, S.; Sharma, R.; Rathore, K.S.; Parewa, V. Microwave-assisted nanocatalysis: A CuO NPs/rGO composite as an efficient and recyclable catalyst for the Petasis-borono–Mannich reaction. RSC Adv. 2018, 8, 30280–30288. [Google Scholar] [CrossRef]
- Alemdar, A.; Sain, M. Isolation and characterization of nanofibers from agricultural residues—Wheat straw and soy hulls. Bioresour. Technol. 2008, 99, 1664–1671. [Google Scholar] [CrossRef]
- Sahu, K.K.; Raj, B.; Basu, S.; Mohapatra, M. Calcination Strategy for Scalable Synthesis of Pithecellobium-Type Hierarchical Dual-Phase Nanostructured CuxO to Columnar Self-Assembled CuO and Its Electrochemical Performances. ACS Omega 2021, 6, 1108–1118. [Google Scholar] [CrossRef]
- Rousta, M.; Khalili, D.; Nezhad, A.K.; Ebrahimi, E. CuO-decorated magnetite-reduced grapheme oxide: A robust and promising heterogeneous catalyst for the oxidative amidation of methylarenes in water via benzylic sp3 C–H activation. New J. Chem. 2021, 45, 20007–20020. [Google Scholar] [CrossRef]
- Ju, X.; Bowden, M.; Brown, E.E.; Zhang, X. An improved X-ray diffraction method for cellulose crystallinity measurement. Carbohydr. Polym. 2015, 123, 476–481. [Google Scholar] [CrossRef] [PubMed]
- Yazdani, A.; Höhne, G.W.H.; Misture, S.T.; Graeve, O.A. A method to quantify crystallinity in amorphous metal alloys: A differential scanning calorimetry study. PLoS ONE 2020, 15, e0234774. [Google Scholar]
- Lunardi, C.N.; Gomes, A.J.; Rocha, F.S.; Tommaso, J.D.; Gregory, S. Patience, Experimental methods in chemical engineering: Zeta Potential. Can. J. Chem. Eng. 2021, 99, 627–639. [Google Scholar] [CrossRef]
- Kusmono; Listyanda, R.F.; Wildan, M.W.; Ilman, M.N. Preparation and characterization of cellulose nanocrystal extracted from ramie fibers by sulfuric acid hydrolysis. Heliyon 2020, 6, e05486–e05497. [Google Scholar] [CrossRef] [PubMed]
- Barbash, V.A.; Yaschenko, O.V.; Shniruk, O.M. Preparation and Properties of Nanocellulose from Organosolv Straw Pulp. Nanoscale Res. Lett. 2017, 12, 241. [Google Scholar] [CrossRef] [PubMed]
- French, A.D. Idealized powder diffraction patterns for cellulose polymorphs. Cellulose 2013, 21, 885–896. [Google Scholar] [CrossRef]
- Kagarzadeh, H.; Ahmad, I.; Abdullah, I.; Dufrense, A.; Zainuddin, S.; Sheltami, R. Effects of hydrolysis condition on the morphology, crystalinity and thermal stability of cellulose nanocrystals extracted from kenal bast fibers. Cellulose 2012, 19, 855–866. [Google Scholar] [CrossRef]
- Kian, L.K.; Jawaid, M.; Ariffin, H.; Karim, Z. Isolation and characterization of nanocrystalline cellulose from roselle-derived microcrystalline cellulose. Int. J. Biol. Macromol. 2018, 114, 54–63. [Google Scholar] [CrossRef]
- Al-Dulaimi, A.A.; Wanrosli, W.D. Isolation and characterization of nanocrystalline cellulose from totally chlorine free oil palm empty fruit bunch pulp. J. Polym. Environ. 2017, 25, 192–202. [Google Scholar] [CrossRef]
- Mahjouri, S.; Movafeghi, A.; Divband, B.; Kosari-Nasab, M. Toxicity impacts of chemically and biologically synthesized CuO nanoparticles on cell suspension cultures of Nicotiana tabacum. Plant Cell Tissue Organ Cult. (PCTOC) 2018, 135, 223–234. [Google Scholar] [CrossRef]
- Hassan, S.A.; Ghadam, P.; Ali, A.A. One step green synthesis of Cu nanoparticles by the aqueous extract of Juglans regia green husk: Assessing its physicochemical, environmental and biological activities. Bioprocess Biosyst. Eng. 2022, 45, 605–618. [Google Scholar] [CrossRef]
- Yu, Y.; Fei, Z.; Cui, J.; Miao, B.; Lu, Y.; Wu, J. Biosynthesis of Copper Oxide Nanoparticles and Their in vitro Cytotoxicity towards Nasopharynx Cancer (KB Cells) Cell Lines. Int. J. Pharmacol. 2018, 14, 609–614. [Google Scholar] [CrossRef]
- Shinde, A.B.; Mhamane, D.A.; Nishandar, S.V. Experimental investigation of rheological properties of water lubricant by adding CuO nano particles. AIP Conf. Proc. 2019, 2200, 020068. [Google Scholar]
- Małolepszy, A.; Błonski, S.; Chrzanowska-Giżyńska, J.; Wojasiński, M.; Płocinski, T.; Stobinski, L.; Szymanski, Z. Fluorescent carbon and graphene oxide nanoparticles synthesized by the laser ablation in liquid. Appl. Phys. A 2018, 124, 282. [Google Scholar] [CrossRef]
- Muthuvel, A.; Jothibas, M.; Manoharan, C. Synthesis of copper oxide nanoparticles by chemical and biogenic methods: Photocatalytic degradation and in vitro antioxidant activity. Nanotechnol. Environ. Eng. 2020, 5, 14. [Google Scholar] [CrossRef]
- Liu, Y.; Ying, Y.; Mao, Y.; Gu, L.; Wangb, Y.; Peng, X. CuO nanosheets/rGO hybrid lamellar films with enhanced capacitance. Nanoscale 2013, 5, 9134–9140. [Google Scholar] [CrossRef]
- Gao, Y.; He, Y.; Yan, S.; Yu, H.; Ma, J.; Hou, R.; Fan, Y.; Yin, X. Controlled reduction and fabrication of graphene oxide membrane for improved permeance and water purification performance. J. Mater. Sci. 2020, 55, 15130–15139. [Google Scholar] [CrossRef]
- Sudhakar, Y.N.; Hemant, H.; Nitinkumar, S.S.; Poornesh, P.; Selvakumar, M. Green synthesis and electrochemical characterization of rGO–CuO nanocomposites for supercapacitor applications. Ionics 2016, 23, 1267–1276. [Google Scholar] [CrossRef]
- Sarkar, C.; Dolu, S.K. Synthesis of copper oxide/reduced graphene oxide nanocomposite and its enhanced catalytic activity towards reduction of 4-nitrophenol. R. Soc. Chem. RSC Adv. 2015, 5, 60763–60769. [Google Scholar] [CrossRef]
- Zhou, R.; Zheng, Y.; Hulicova-Jurcakova, D.; Qiao, S.Z. Enhanced electrochemical catalytic activity by copper oxide grown on nitrogen-doped reduced graphene oxide. J. Mater. Chem. A 2013, 1, 13179–13185. [Google Scholar] [CrossRef]
- Du, X.; Zhang, Y.; Si, F.; Yao, C.; Du, M.; Hussain, I.; Kim, H.; Huang, S.; Lin, Z.; Hayat, W. Persulfate non-radical activation by nano-CuO for efficient removal of chlorinated organic compounds: Reduced graphene oxide-assisted and CuO (0 0 1) facet-dependent. Chem. Eng. J. 2018, 356, 178–189. [Google Scholar] [CrossRef]
- Gulati, U.; Rajesh, U.C.; Rawat, D.S. RGO@CuO nanocomposites from a renewable copper mineral precursor: A green approach for decarboxylative C(sp3)-H activation of proline amino acid to afford value-added synthons. ACS Sustain. Chem. Eng. 2018, 6, 10039–10051. [Google Scholar] [CrossRef]
- Botsa, S.M.; Basavaiah, K. Removal of Nitrophenols from wastewater by monoclinic CuO/RGO nanocomposite. Nanotechnol. Environ. Eng. 2019, 4, 1–14. [Google Scholar] [CrossRef]
- Sagadevan, S.; Chowdhury, Z.Z.; Bin Johan, M.R.; Aziz, F.A.; Salleh, E.M.; Hawa, A.; Rafique, R.F. A one-step facile route synthesis of copper oxide/reduced graphene oxide nanocomposite for supercapacitor applications. J. Exp. Nanosci. 2018, 13, 284–296. [Google Scholar] [CrossRef]
- Abulizi, A.; Yang, G.-H.; Zhu, J.-J. One-step simple sonochemical fabrication and photocatalytic properties of Cu2O–rGO composites. Ultrason. Sonochem. 2014, 21, 129–135. [Google Scholar] [CrossRef] [PubMed]
- Sagadevan, S.; Lett, J.A.; Weldegebrieal, G.K.; Garg, S.; Oh, W.C.; Hamizi, N.A.; Johan, M.R. Enhanced photocatalytic activity of rgo-cuo nanocomposites for the degradation of organic pollutants. Catalysts 2021, 11, 1008. [Google Scholar] [CrossRef]
- Alves, D.C.B.; Silva, R.; Voiry, D.; Asefa, T.; Chhowalla, M. Copper nanoparticles stabilized by reduced graphene oxide for CO2 reduction reaction. Mater. Renew. Sustain. Energy 2015, 4, 2. [Google Scholar] [CrossRef]
- Alhumaimess, M.S.; Alsohaimi, I.H.; Alshammari, H.M.; Aldosari, O.F.; Hassan, H.M.A. Synthesis of gold and palladium nanoparticles supported on CuO/rGO using imidazolium ionic liquid for CO oxidation. Res. Chem. Intermed. 2020, 46, 5499–5516. [Google Scholar] [CrossRef]
- Johra, F.T.; Jung, W.-G. Effect of pH on the synthesis and characteristics of RGO–CdS nanocomposites. Appl. Surf. Sci. 2014, 317, 1015–1021. [Google Scholar] [CrossRef]
- Ghayeb, Y.; Momeni, M.M.; Menati, M. Reduced graphene oxide/Cu2O nanostructure composite films as an effective and stable hydrogen evolution photocathode for water splitting. J. Mater. Sci. Mater. Electron. 2017, 28, 7650–7659. [Google Scholar] [CrossRef]
- Momeni, M.M.; Nazari, Z.; Hakimiyan, M.; Mirhoseini, S.M. Preparation of CuO nanostructures coating on copper as supercapacitor materials. Surf. Eng. 2014, 30, 775–778. [Google Scholar] [CrossRef]
- Liu, X.; Li, Z.; Zhao, W.; Zhao, C.; Wanga, Y.; Zhiqun Lin, Z. A facile route to the synthesis of reduced graphene oxide-wrapped octahedral Cu2O with enhanced photocatalytic and photovoltaic performance. J. Mater. Chem. A 2015, 3, 19148–19154. [Google Scholar] [CrossRef]
- Hontoria-Lucas, C.; Lopez-Peinado, A.J.; Lopez-Gonzalez, J.d.D.; Rojas-Cervantes, M.L.; Martin-Aranda, R.M. Study of oxygen-containing groups in a series of graphite oxides: Physical and chemical characterization. Carbon 1995, 33, 1585–1592. [Google Scholar] [CrossRef]
- Meshram, S.P.; Adhyapak, P.V.; Mulik, U.P.; Amalnerkar, D.P. Facile synthesis of CuO nanomorphs and their morphology dependent sunlight driven photocatalytic properties. Chem. Eng. J. 2012, 204–206, 158–168. [Google Scholar] [CrossRef]
- Papadimitropoulos, G.; Vourdas, N.; Vamvakas, V.E.; Davazoglou, D. Optical and structural properties of copper oxide thin films grown by oxidation of metal layers. Thin Solid Films 2006, 515, 2428–2432. [Google Scholar] [CrossRef]
- Lin, Z.; Liu, L.; Yao, Y.; Hildreth, O. Superior capacitance of functionalized grapheme. J. Phys. Chem. C 2011, 115, 7120–7125. [Google Scholar] [CrossRef]
- Huang, Y.; Liang, J.; Chen, Y. An Overview of the Applications of Graphene-Based Materials in Supercapacitors. Small 2012, 8, 1805–1834. [Google Scholar] [CrossRef]
- Aghamohammadi, H.; Hassanzadeh, N.; Eslami-Farsani, R. A review study on the recent advances in developing the heteroatom-doped graphene and porous graphene as superior anode materials for Li-ion batteries. Ceram. Int. 2021, 47, 22269–22301. [Google Scholar] [CrossRef]
- Harilal, M.; Vidyadharan, B.; Misnon, I.I.; Anilkumar, G.M.; Lowe, A.; Ismail, J.; Yusoff, M.M.; Jose, R. One-Dimensional Assembly of Conductive and Capacitive Metal Oxide Electrodes for High-Performance Asymmetric Supercapacitors. Am. Chem. Soc. 2017, 9, 10730–10742. [Google Scholar] [CrossRef]
- Jouda, A.M.; Abood, E.S.; Mashloor, M.S. Copper metal at new CuO nanoparticles modified carbonpaste electrode: Selective voltammetric determination. Nano Biomed. Eng. 2018, 10, 243–249. [Google Scholar] [CrossRef]
- Dubal, D.P.; Chodankar, N.R.; Gund, G.S.; Holze, R.; Lokhande, C.D.; Romero, P.G. Asymmetric supercapacitors based on hybrid CuO@reduced graphene oxide@sponge versus reduced graphene oxide@sponge electrodes. Energy Technol. 2015, 3, 168–176. [Google Scholar] [CrossRef]
- Sridevi, A.; Balraj, B.; Senthilkumar, N.; Venkatesan, G.K.D. Synthesis of rGO/CuO/Ag ternary nanocomposites via hydrothermal approach for opto-electronics and supercapacitor applications. J. Supercond. Nov. Magn. 2020, 33, 3501–3510. [Google Scholar] [CrossRef]
- Zhao, Z.; Wang, W.; Tang, W.; Xie, Y.; Li, Y.; Song, J.; Zhuiykov, S.; Hu, J.; Gong, W. Synthesis and electrochemistry performance of CuO-functionalized CNTs-rGO nanocomposites for highly sensitive hydrazine detection. Ionics 2020, 26, 2599–2609. [Google Scholar] [CrossRef]
- Subramani, K.; Jeyakumar, D.; Sathish, M. Manganese hexacyanoferrate derived Mn3O4 nanocubes–reduced graphene oxide nanocomposites and their charge storage characteristics in supercapacitors. Phys. Chem. Chem. Phys. 2014, 16, 4952. [Google Scholar] [CrossRef] [PubMed]
Publisher’s Note: MDPI stays neutral with regard to jurisdictional claims in published maps and institutional affiliations. |
© 2022 by the authors. Licensee MDPI, Basel, Switzerland. This article is an open access article distributed under the terms and conditions of the Creative Commons Attribution (CC BY) license (https://creativecommons.org/licenses/by/4.0/).