Article

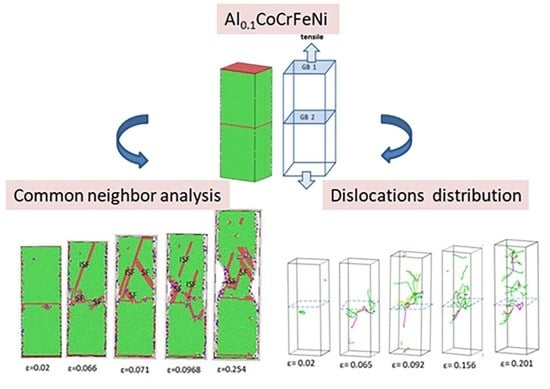
The Influence of Grain Boundaries on Crystal Structure and Tensile Mechanical Properties of Al0.1CoCrFeNi High-Entropy Alloys Studied by Molecular Dynamics Method

School of Materials Science and Chemical Engineering, Xi’an Technological University, Xi’an 710021, China
*
Author to whom correspondence should be addressed.
Crystals 2022, 12(1), 48; https://doi.org/10.3390/cryst12010048
Submission received: 26 November 2021 / Revised: 22 December 2021 / Accepted: 27 December 2021 / Published: 30 December 2021
(This article belongs to the Special Issue Photovoltaic Functional Crystals and Ceramics)

Abstract

:
The mechanical properties of high-entropy alloys are superior to those of traditional alloys. However, the key problem of finding a strengthening mechanism is still challenging. In this work, the molecular dynamics method is used to calculate the tensile properties of face-centered cubic Al0.1CoCrFeNi high-entropy alloys containing Σ3 grain boundaries and without grain boundary. The atomic model was established by the melting rapid cooling method, then stretched by the static drawing method. The common neighbor analysis and dislocation extraction algorithm are used to analyze the crystal evolution mechanism of Σ3 grain boundaries to improve the material properties of high-entropy alloys during the tensile test. The results show that compared with the mechanical properties Al0.1CoCrFeNi high-entropy alloys without grain boundary, the yield strength and Young’s modulus of a high-entropy alloy containing Σ3 grain boundary are obviously larger than that of high-entropy alloys without grain boundary. Dislocation type includes mainly 1/6<112> Shockley partial dislocations, a small account of 1/6<110> Stair-rod, 1/2<110>perfect dislocation, and 1/3<111> Hirth dislocations. The mechanical properties of high-entropy alloys are improved by dislocation entanglement and accumulation near the grain boundary.

Graphical Abstract

1. Introduction

With the rapid development of industry, traditional materials no longer satisfy higher requirements. Research scholars began to pay more attention to high-entropy alloys (HEAs) with high strength, high hardness [1], high wear resistance [2], corrosion resistance [3,4], and suitable thermal stability [5]. HEAs are mixed entropy alloys composed of five or more kinds of elements according to the proportion of equimolar or near equimolar atoms [6]. It generally forms a stable single-phase solid solution, which may be face-centered cubic crystal structure (fcc), body-centered cubic crystal structure (bcc), hexagonal close-packed structure (hcp), or an alloy of two phases [7,8], sometimes nano-phase or even amorphous phase of a class of alloys. Among many kinds of HEAs, the HEAs with fcc crystal structure have considerable stretch plasticity and multiple strengthening mechanisms, and it is gradually becoming the current hot research area in the field of HEAs [9,10]. Thota et al. [11] observed Σ3, Σ9, and Σ27 grain boundaries when they researched the microstructure of as-recrystallized specimens in CoCrFeMnNi HEAs. Chen et al. [12] explains that in FCC alloys, special boundaries were mainly composed of Σ3ns boundaries for CoCrFeMnNi HEAs. Li et al. [13] confirms stacking faults and dislocations present even in the as-homogenized state of the FCC γ matrix in Fe20Mn20Ni20Co20Cr20 HEAs. Zhao et al. [14] also simulated the influences of Σ3, Σ5, and Σ11 grain boundary on materials performance for CuNiCoFe HEAs. In this paper, Al0.1CoCrFeNi HEAs, as typical HEAs as the research object, have a single-phase fcc crystal structure [15]. The deformation process during the tensile test is comparatively studied. For fcc crystal structure, grain boundary energy for Σ3 grain boundary is lowest [16]; as a result, a Σ3 grain boundary is easy to appear in the fcc crystal structure. Therefore, Al0.1CoCrFeNi HEAs with Σ3 grain boundary are studied as a subject.
Among various strengthening methods to improve the mechanical properties of HEAs, grain boundary strengthening is the main effective mechanism. Yang et al. [17] found that the main strengthening mechanism of Al0.1CoCrFeNi high-entropy alloy is fine-grained strengthening and precipitation strengthening. In order to improve the mechanical properties of HEAs, the deformation mechanism during the stretching was accurately analyzed. Traditional experiments focus on the mechanical properties of HEAs mainly. For example, Yang et al. [18] and others studied the Al content of the mechanical properties and found that x is less than 0.5 when HEAs exhibit a single fcc crystal structure. While x is greater than 0.5 and less than 0.9, HEAs display fcc and bcc two-phase mixtures. As the Al content increases, the hardness increases and ductility decreases. For the Al0.1CoCrFeNi HEAs, it is found in the tensile test at different temperatures that the yield strength and ultimate tensile strength decrease with the increase in temperature. The transmission electron microscope shows the normal face-centered cubic slip {111} (110) during the tensile test. In the tensile test at the temperature of 77 K, it was found that the appearance of nano-twins at low temperature can promote the jagged stress-strain curve [19,20]. It is difficult for traditional experiments to describe the micro-evolution process of how grain boundaries in high-entropy alloys improve mechanical properties from the nanoscale. The molecular dynamics simulation can also reduce the elastic and plastic deformation of raw materials to some extent at the atomic scale. It is greatly significant to explain the mechanical properties of crystals and predict the possible deformation mechanism of crystals. Jia et al. [21] studied the mechanical behavior of AlCrFeCuNi HEAs during the tensile deformation using analytical dynamics. It is found that severe lattice distortion and solid solution can lead to dislocation sliding and pinning, thus affecting the mechanical properties of the alloy.
Molecular dynamics simulation is used to stretch the Al0.1CoCrFeNi containing preset Σ3 grain boundary structure at different strain rates and different temperatures in nanoscale. The effect of grain boundary on the excellent mechanical properties and deformation mechanism Al0.1CoCrFeNi HEAs was studied.

2. Computational Methods

In order to study the effect of grain boundary on tensile deformation, the Σ3 grain boundaries of Al0.1CoCrFeNi HEAs with fcc crystal structure are established with molecular dynamics method based on coincidence site lattice (CSL) [22], as shown in Figure 1. The lower the energy of grain boundary, the stabler the crystal structure. As a result, the energy of Σ3 (the orientation angle is 109.47°) grain boundary is lowest in experimental conditions. Σ3 grain boundary selected contains two grains, including GB1 and GB2 (Abbrev. Σ3 GBs HEAs). The model of Σ3 grain boundary is established by obtaining the interface structure by the grain with upper and lower orientation. Through the orient command in the Lammps software (Large-scale Atomic/Molecular Massively Parallel Simulator) to change the X, Y, and Z axes corresponding to the crystal coordinates, on the basis of ensuring that the three directions meet the right-hand rule X, Y, and Z, the coordinates correspond to the works of [11 2 ¯ ], [111], and [101] crystal directions, respectively. Meanwhile, the HEAs model without grain boundary (abbreviation: non-GBs HEAs) was set, as shown in Figure 2. In contrast, the grain orientation of the non-GBs HEAs is consistent with that of GB1.
In order to ensure the representation of the simulation results and the feasibility of the simulation process, the appropriate size should be considered in the modeling process. In order to avoid the rigid docking form of atoms at the boundary and surface caused by periodic boundary conditions and stacking order problems, the boundary length of the model must be carefully selected when defining grain size so as to generate a reasonable model. The size of the model is calculated according to Formulas (1) and (2). The L, B, W are distributed along the Y axis, the X axis, and the Z axis in Figure 1, respectively. For this purpose, the length, width, and height of the three directions correspond to integer times of the minimum periodic constant of the oriented lattice with a size of 62 × 172 × 50.
L = a × h 2 + k 2 + l 2
B   o r   W = b × h 2 + k 2 + l 2
where h, k, and l are the miller indices along three forward-measured grain directions, respectively. To achieve the desired size, a and b are constants.
To eliminate the boundary effect, periodic boundary conditions are adopted. Because the grain boundary structure itself is unstable structure, static relaxation is needed. After static relaxation, minimizing the energy of the system, the grain boundary structure reaches a stable state. An embedded atom method (EAM) [23] is used to describe the force between atoms, and the timestep is set to 0.001 ps. After the model was built, it was heated above the melting point and cooled at a cooling rate of 1011 K/s to room temperature. As a result, the equilibrium structure was obtained. Figure 3 shows the common neighbor analysis (CNA) of Σ3 GBs HEAs after solidification. We can conclude that the main crystal phase is fcc (97.1%) and a small amount of hcp (2.7%), and bcc (0.1%). The radial distribution function during the solidification process is drawn as shown in Figure 4. The splitting appears in the second peak shape of the curve, which indicates that the system has typical characteristics of a crystalline state. They are consistent with the experimental results [14], which prove the correctness of the model structure and potential function and provide support to predict and analyze the deformation mechanism of Al0.1CoCrFeNi HEAs.
The temperature in the tensile deformation is 100, 300, 600, and 800 K, respectively. The pressure in the X, Z direction remains at standard atmospheric pressure. Different strain rates (1 × 10⁸ s−1, 5 × 10⁸ s−1, 1 × 10⁹ s−1, 5 × 10⁹ s−1) are set for uniaxial tension on the Y axis. The tensile test was performed using a micro-canonical ensemble (NVE) and temp/berendsen ensemble. The molecular dynamics of the model are simulated by Lammps software, and the microstructure evolution of HEAs is analyzed by visual Ovito (Open Visualization Tool) software.
The strain rate of the simulated conditions is much larger than that of the actual process. The effects of strain rate and grain boundary on the mechanical properties of HEAs are mainly studied. After each loading, the atomic configuration and stress-strain values in the model are recorded.
During this tensile simulation, the stress-strain value is solved by the Velert equation of motion by velocity Velert method. The corresponding formula of stress-strain is as follows:
σ = F / A x z
ε = ( L y L y 0 ) / L y 0
where the F is the stress applied along the Y axis. The Axz is the area of the X-Z plane. The L y is the length of Y direction in the model. L y 0 is the initial length of Y direction. Each applied strain increment relaxes once at a determined temperature to ensure the grain boundary stability of the HEAs of the fcc crystal structure.

3. Results

The uniaxial stretch was performed on two types of models of HEAs (Σ3 GBs HEAs and non-GBs HEAs) at different strain rates and temperatures to investigate the effect of stacking faults, twins, and dislocations on the mechanical properties of HEAs under the efficiency effect and temperature effect.

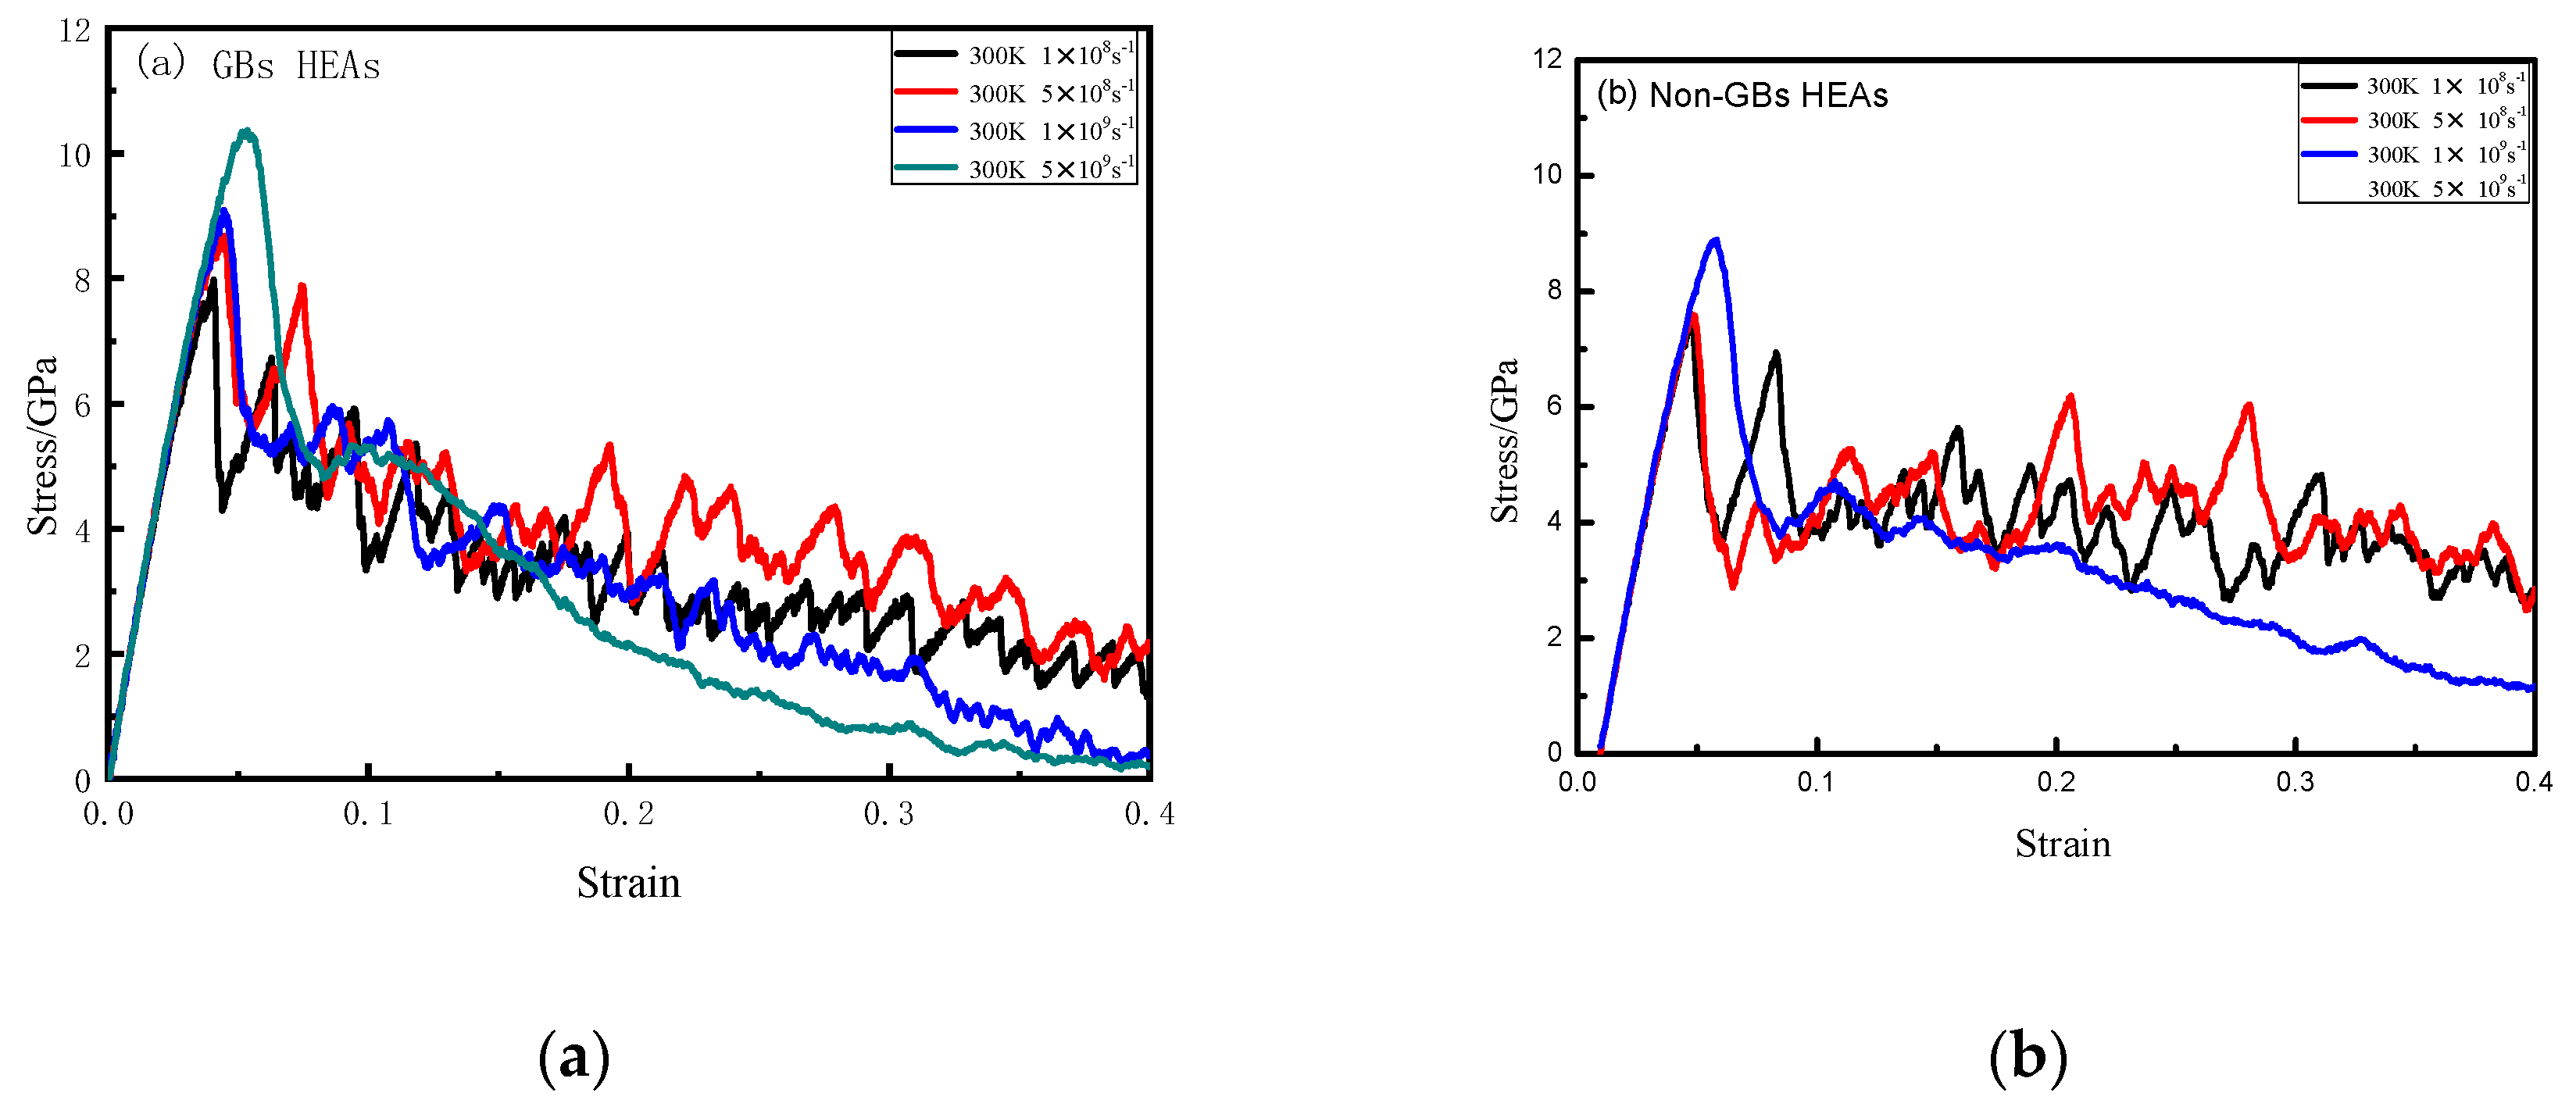
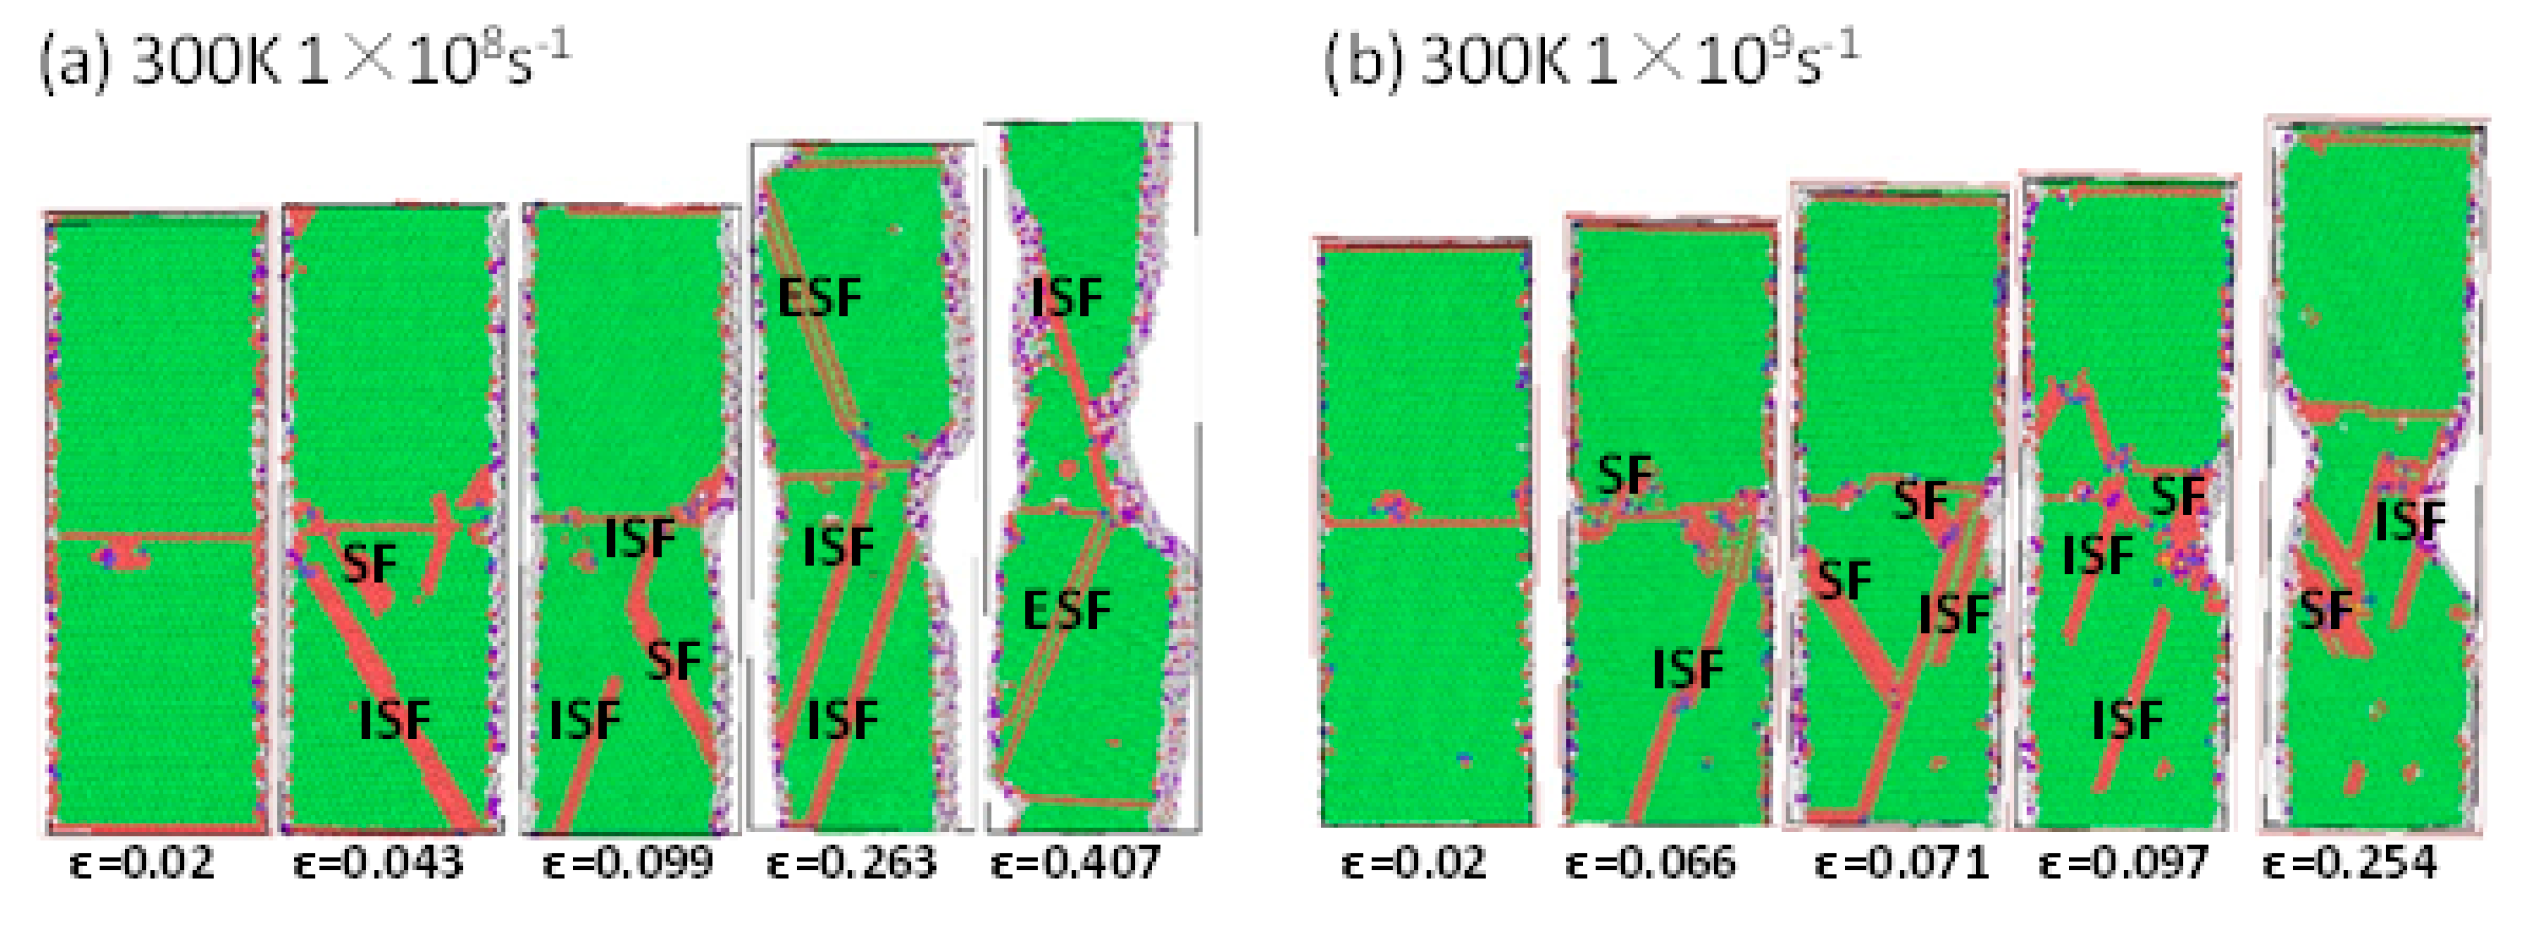
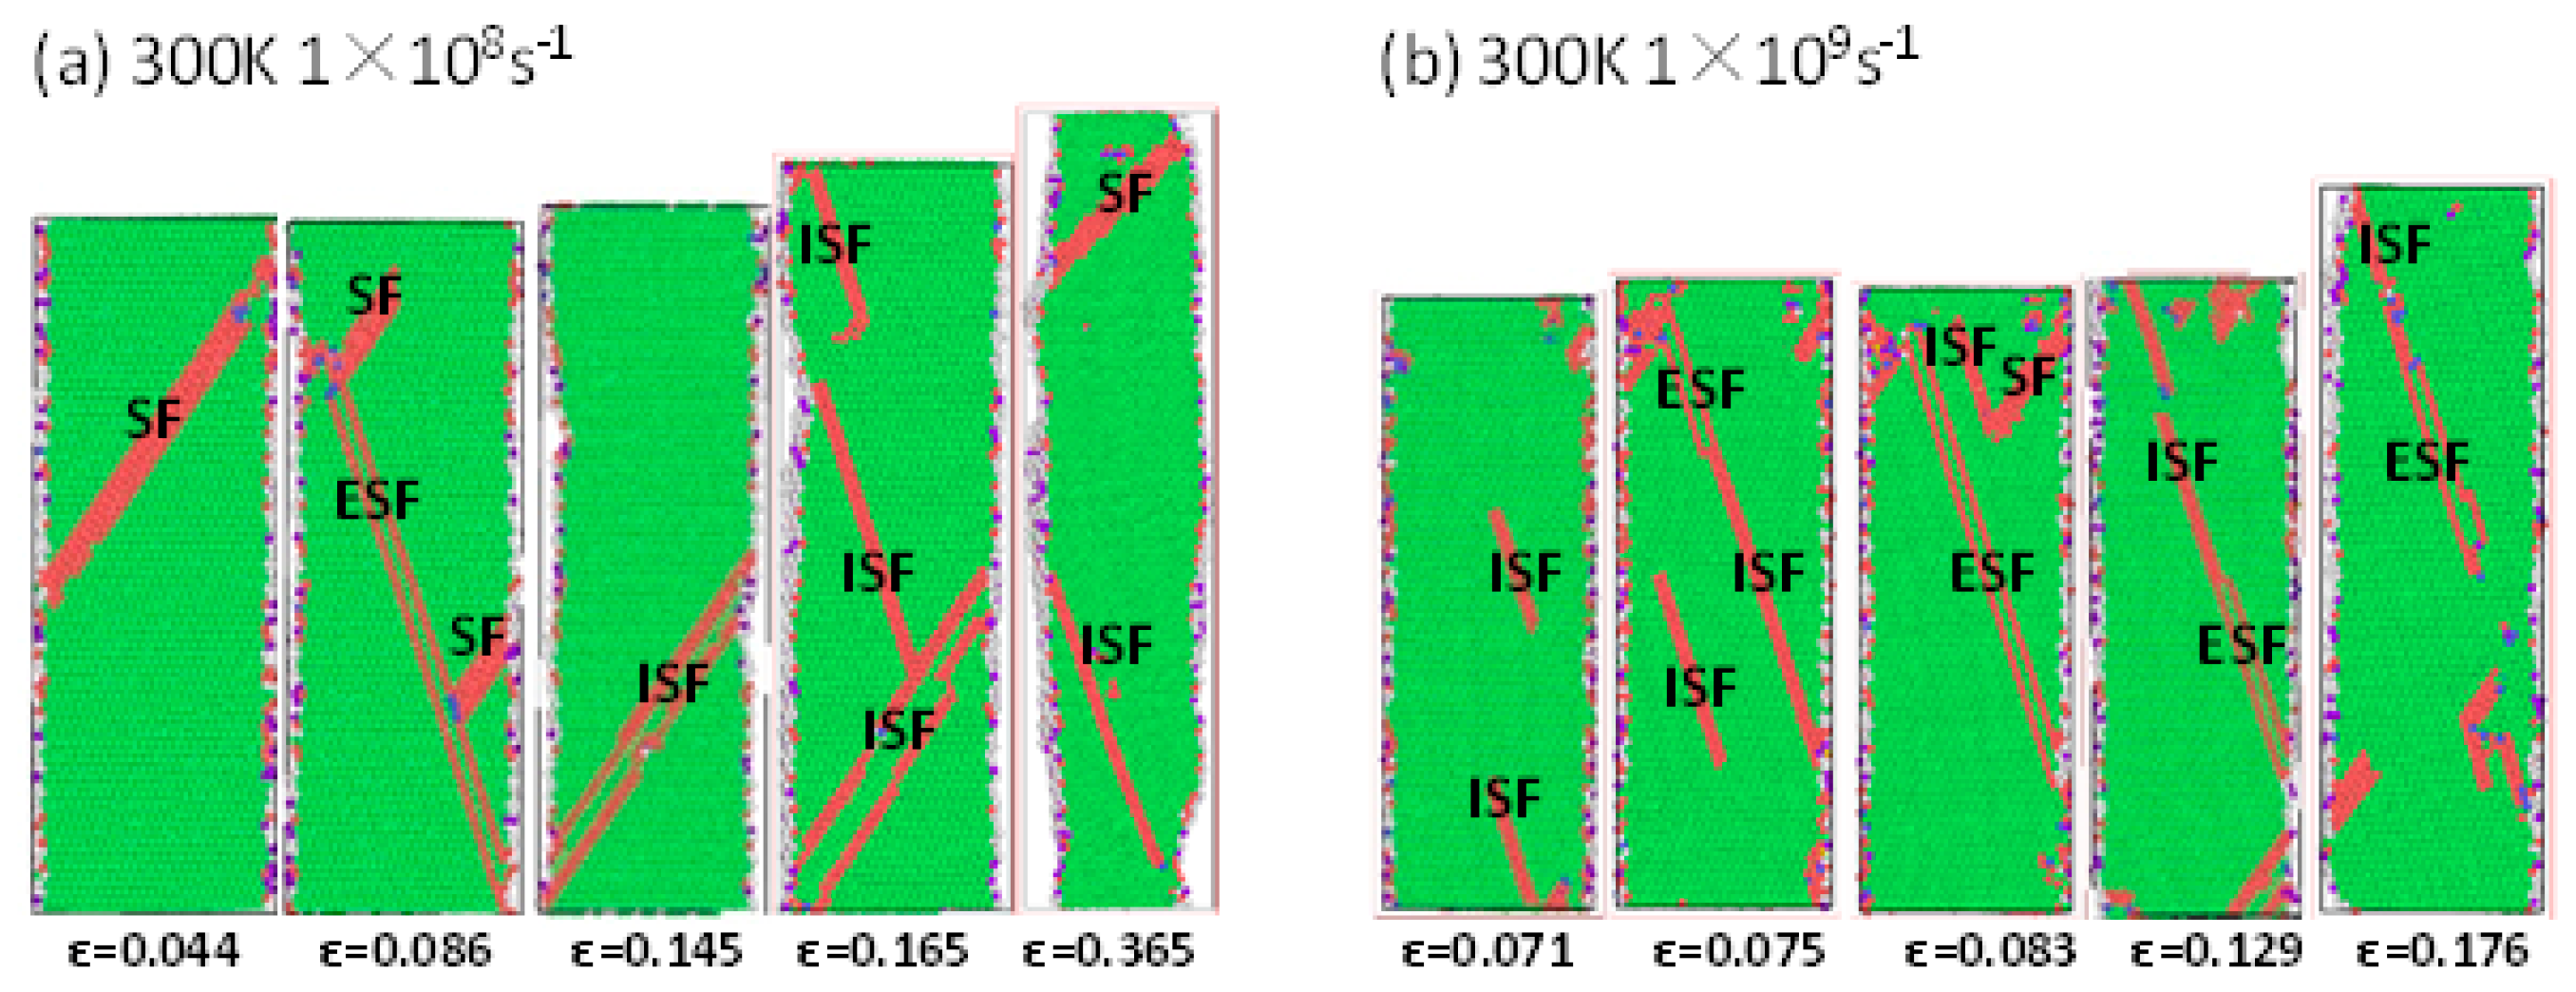
3.1. Effect of Σ3 GBs HEAs and Non-GBs HEAs at Different Strain Rates at Room Temperature (300 K)

To study the effect of strain rate on Σ3 GBs HEAs, the uniaxial stretch was selected at a strain rate of 1 × 10⁸ s−1, 5 × 10⁸ s−1, 1 × 10⁹ s−1, and 5 × 10⁹ s−1. The stress-strain curves, microstructure, and dislocation line configurations were simulated and analyzed at 300 K. The effects of Σ3 grain boundaries on stacking faults, dislocation emission, slip, and mechanical properties of high-entropy alloys are studied under different strain rate conditions.
Figure 5 shows the stress-strain curves of Σ3 GBs HEAs and non-GBs HEAs at different strain rates at 300 K. At the elastic stage (that is, the beginning stage), stress-strain curves show a near-linear relationship to the peak yield strength. After that, the system enters a long plastic deformation process until fracture. At the same time, by linear fitting of the linear deformation process of the stress-strain curve with Σ3 GBs HEAs and non-GBs HEAs, Young’s modulus is obtained. In classical mechanics, Young’s modulus is defined as:
e = σ / ε
The σ is axial stress, and the ε is strain. It is concluded that Young’s modulus of Σ3 GBs HEAs is about 230 GPa and that of non-GBs HEAs is about 220 GPa. The density of HEAs is 8151.298 kg/m3. They were in accord with the experimental values 203 GPa [18] and 7950 kg/m3 [24]. It also shows that a high strain rate leads to high yield strength. The reason is that during the deformation of the high strain rate, the dislocation motion accelerates, resulting in an increased “near-range resistance”, and the deformation of HEAs increases with the increase in strain rate. The experiment [11] also showed that high strain rate sensitivity was observed at high strain rates.
Compare the yield strength and Young’s modulus of Σ3 GBs HEAs and non-GBs HEAs. Table 1 shows that under the different strain rates, the yield strength and Young’s modulus of Σ3 GBs HEAs are both higher than those of non-GBs HEAs. The corresponding peak stress of non-GBs HEAs is 6.89, 7.51, 7.54, and 8.54 GPa at a strain rate of 1 × 10⁸ s−1, 5 × 10⁸ s−1, 1 × 10⁹ s−1, and 5 × 10⁹ s−1 and the strain of 0.040, 0.044, 0.045, and 0.053. However, for Σ3 GBs HEAs, the corresponding peak stress is 7.97, 8.84, 9.03, and 10.34 GPa at a strain rate of 1 × 10⁸ s−1, 5 × 10⁸ s−1, 1 × 10⁹ s−1, and 5 × 10⁹ s−1 and the strain of 0.046, 0.049, 0.057, and 0.058, respectively. At the same time, for Σ3 GBs HEAs, the strain corresponding to the peak stress are all higher than that of non-GBs HEAs, which proves that the presence of grain boundary may delay strain and increase the yield strength.
In order to research the morphology of crystal defects in plastic deformation of HEAs, the deformation mechanism of HEAs is analyzed by observing the atomic configuration diagram of high-entropy alloy by CNA diagram. The atomic structure diagrams with strain rates of 1 × 10⁸ s−1 and 1 × 10⁹ s−1 are selected, respectively, which was shown in Figure 6. Green is the fcc crystal structure, and red is the hcp crystal structure. The single-layer hcp structure is twinned (TB). Two adjacent hcp are intrinsic lamination (ISF), multiple hcp connected together are stacking fault (SF), and one layer between two hcp layers represents extrinsic lamination (ESF) [15].
For Σ3 GBs HEAs (Figure 6), the CNA diagram strain rate is 1×10⁸ s-1. When the strain is 0.02, there is an SF near the grain boundary. As the strain increases, ISF emerging observed at strain 0.099, and ISF started moving toward the grain boundary. At a strain of 0.263, ISF moves near to grain boundary, and symmetrical ESF appears on the other side of the grain boundary. The ISF and ESF cross in the opposite direction to form obvious defect regions, which become the crack source of fracture. When the strain rate is 1 × 10⁹ s−1, the CNA diagram under different strains is observed. When the strain is 0.02, there is a stacking fault below the grain boundary. When the strain increases to 0.066, SF moves constantly to the grain boundary and then is blocked by grain boundaries. Therefore, SF is at the grain boundary, and it is difficult to cross grain boundaries. It shows that the grain boundary effectively constrains the movement of the fault or changes the motion direction.
Figure 7a is the CNA diagram of the non-GBs HEAs with a strain rate of 1 × 10⁸ s−1. When the strain is 0.044, SF appears as the strain increases. When the strain is 0.086, an ESF appears throughout the entire model. Figure 7b shows the CNA diagram of the non-GBs HEAs with a strain rate of 1 × 10⁹ s−1. When the strain ranges from 0.071 to 0.075, the ISF and ESF can move through the whole grain. It can be seen from Figure 7 that different types of SF can move in the whole model under different strain rates in non-GBs HEAs. At the same time, the fracture is more difficult to occur in the non-GBs HEAs than in the Σ3 GBs HEAs. In non-GBs HEAs, the movement of the ISF and ESF will not be hindered by grain boundary, so it will not cause the accumulation of stacking fault. In addition, dislocation is also a major factor in influential performance. DXA was used to analyze dislocations with different strain rates, as shown in Figure 8 and Figure 9. Green is 1/6<112> Shockley partial dislocations. Red is 1/6<110> Stair-rod partial dislocations. Blue is 1/2<110>perfect dislocation. Yellow is 1/3<111> Hirth dislocations.
The main dislocation is of Σ3 GBs HEAs, and non-GBs HEAs is1/6<112> Shockley partial dislocations in Figure 8 and Figure 9, and the dislocation density of both types of HEAs increases with the increase in strain rate. The strain rate is 1 × 10⁹ s−1 (Figure 7). It is found that 1/6<112> Shockley partial dislocations first nucleate at the grain boundary when the strain is 0.02. As the deformation continues, the dislocations proliferate and slip into the crystal, and the crystal begins to deform. At the DXA diagram of strain 0.065, it can be seen that when the dislocation slips to the other side of the grain boundary, the dislocation movement is hindered. Because the atoms on the grain boundary have different orientations, it is difficult to continue to slip and is forced to pile up at the grain boundary. The microstructure of the dislocation line of non-GBs HEAs is shown in Figure 9. The strain rate is 1 × 10⁸ s−1. The strain increases from 0.041 to 0.166, the length of the dislocation increases with the increase in strain. The dislocations in the tensile deformation of the non-GBs can be extended in the whole model without being hindered by grain boundaries.

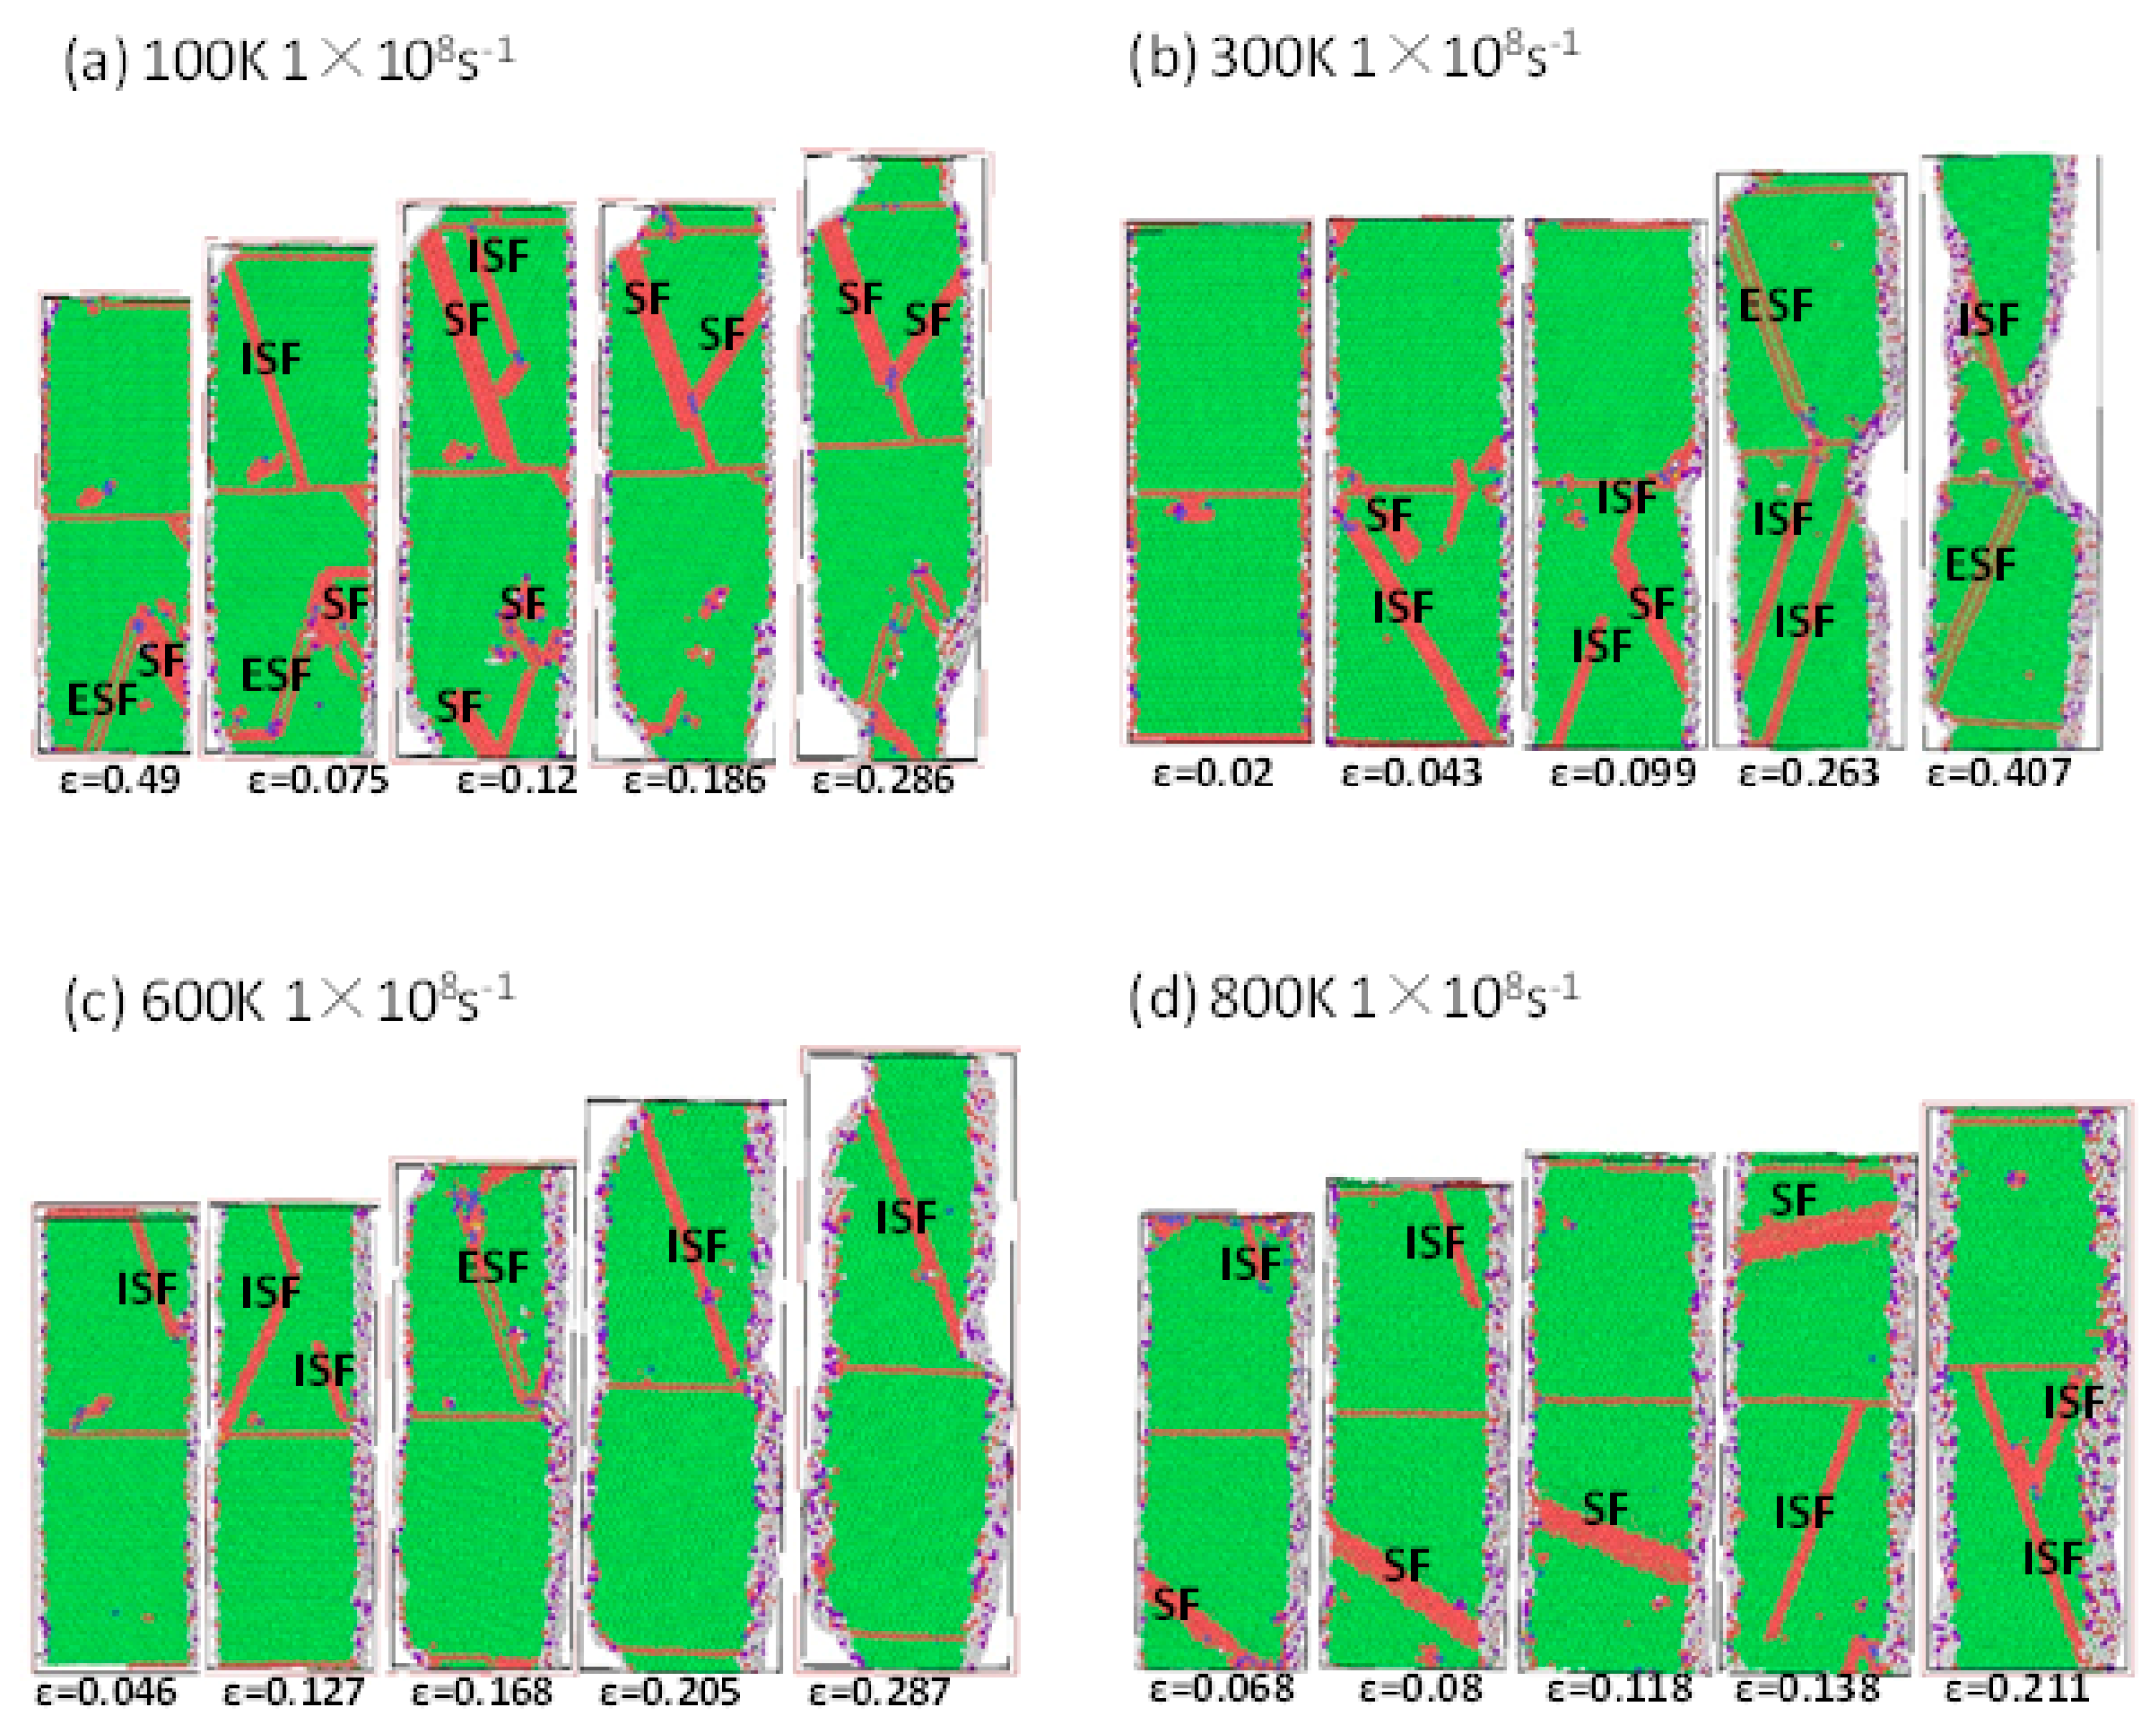
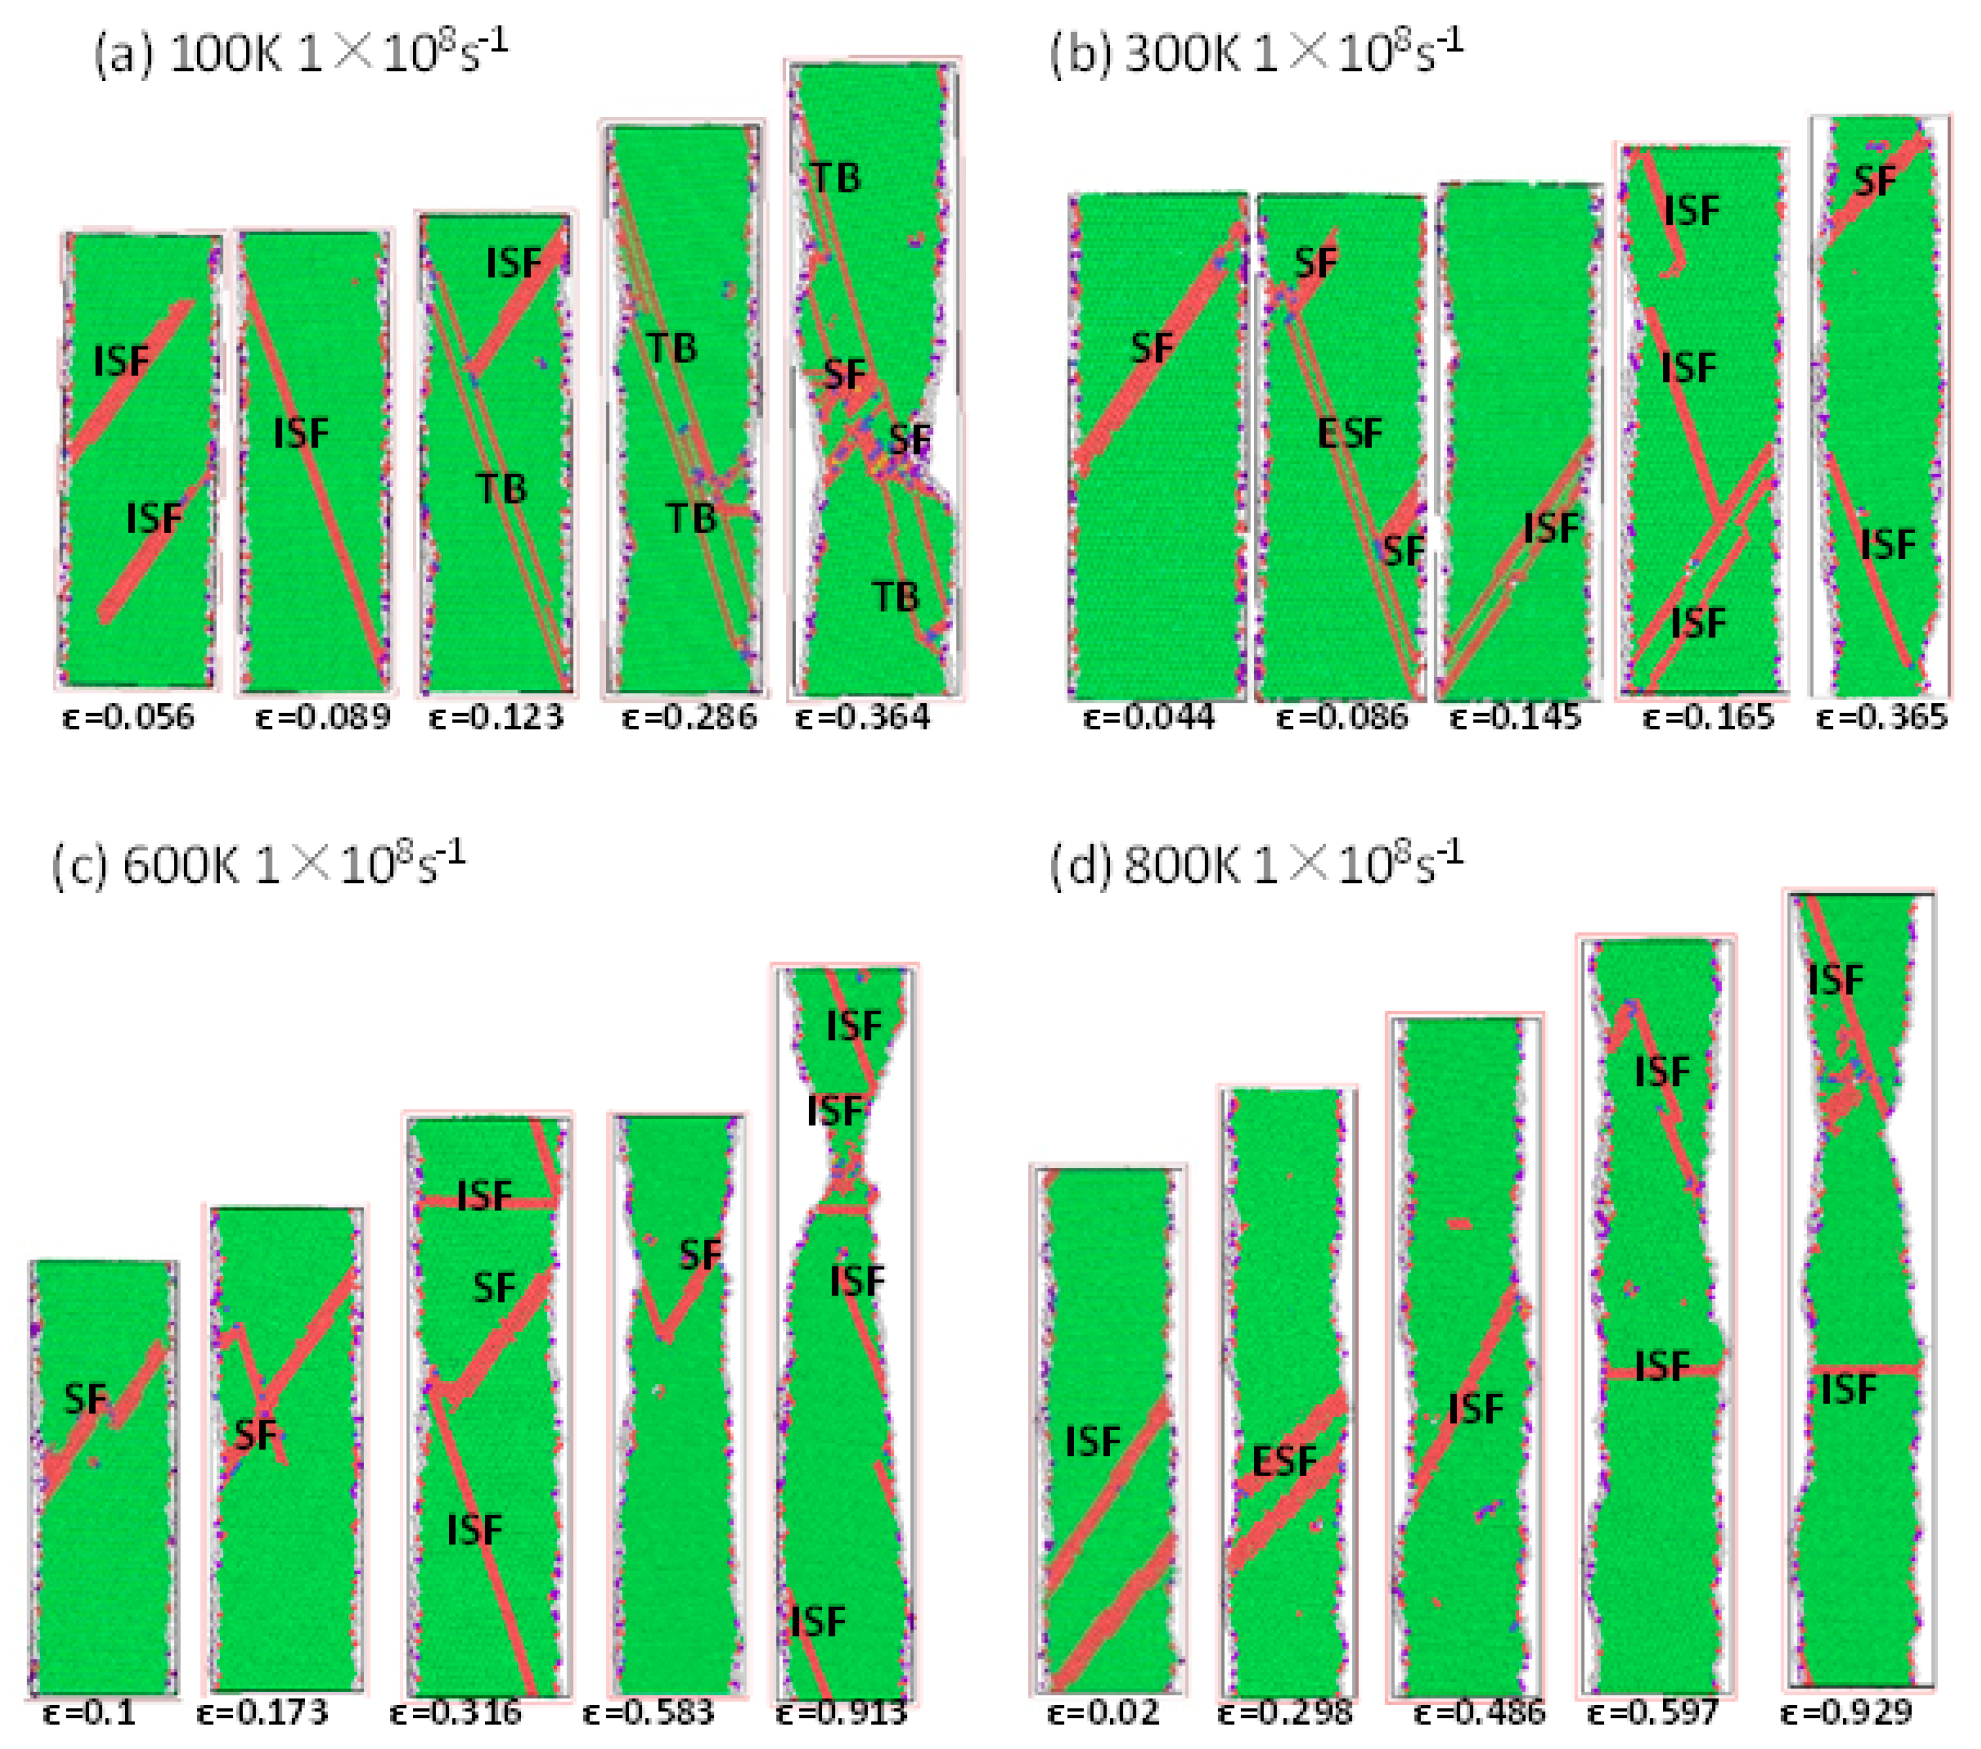
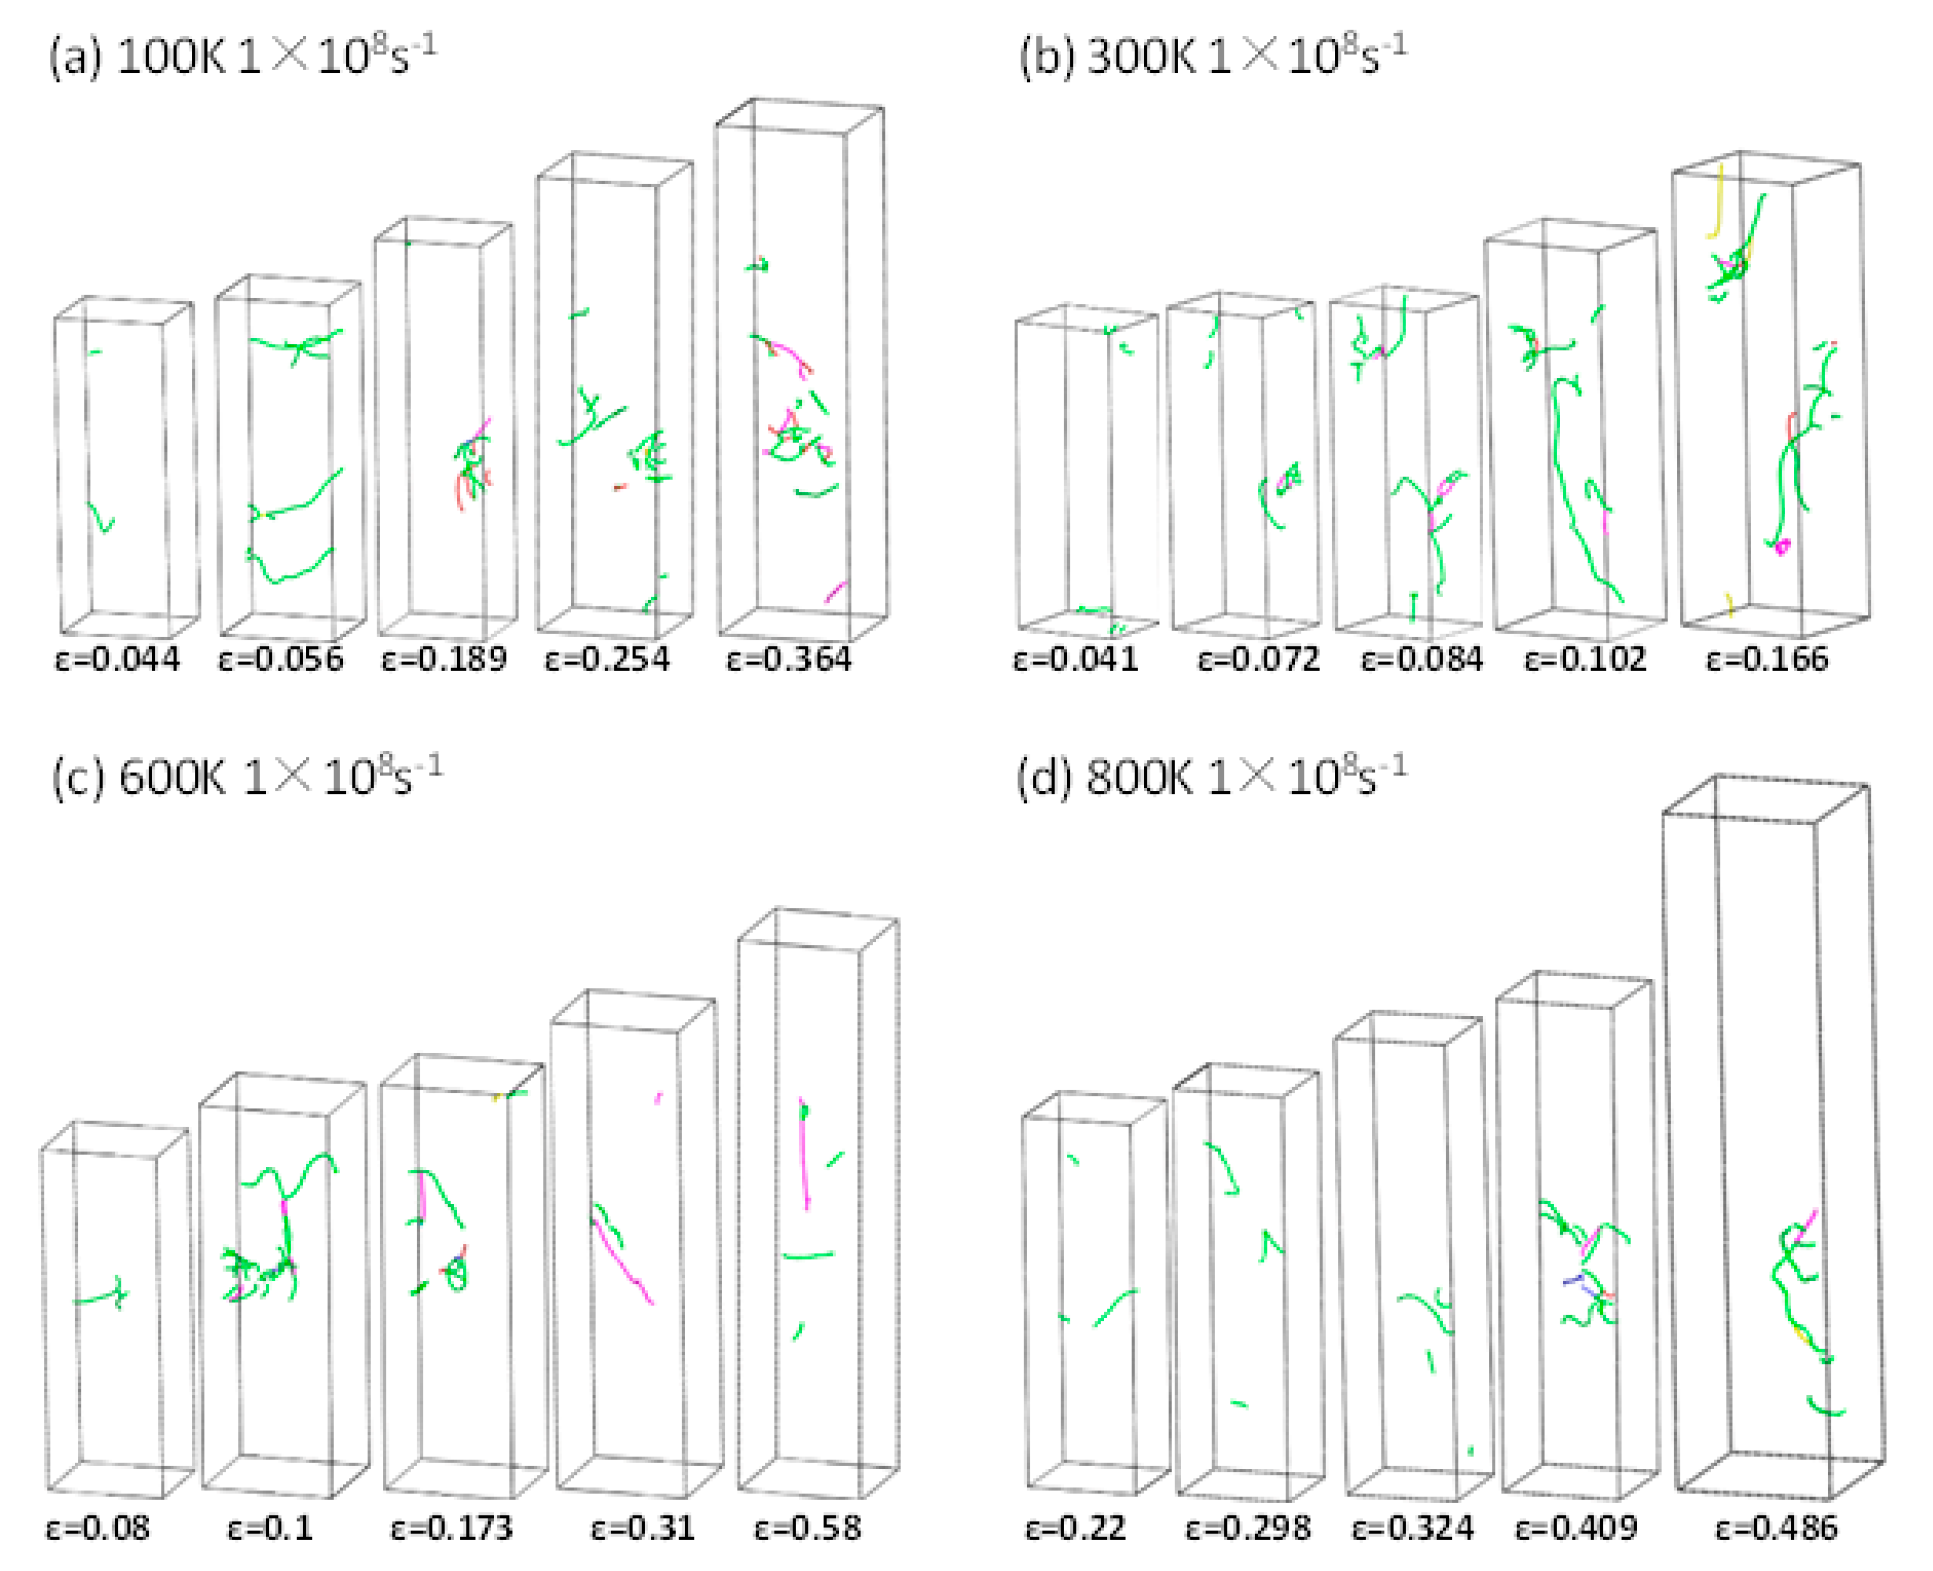
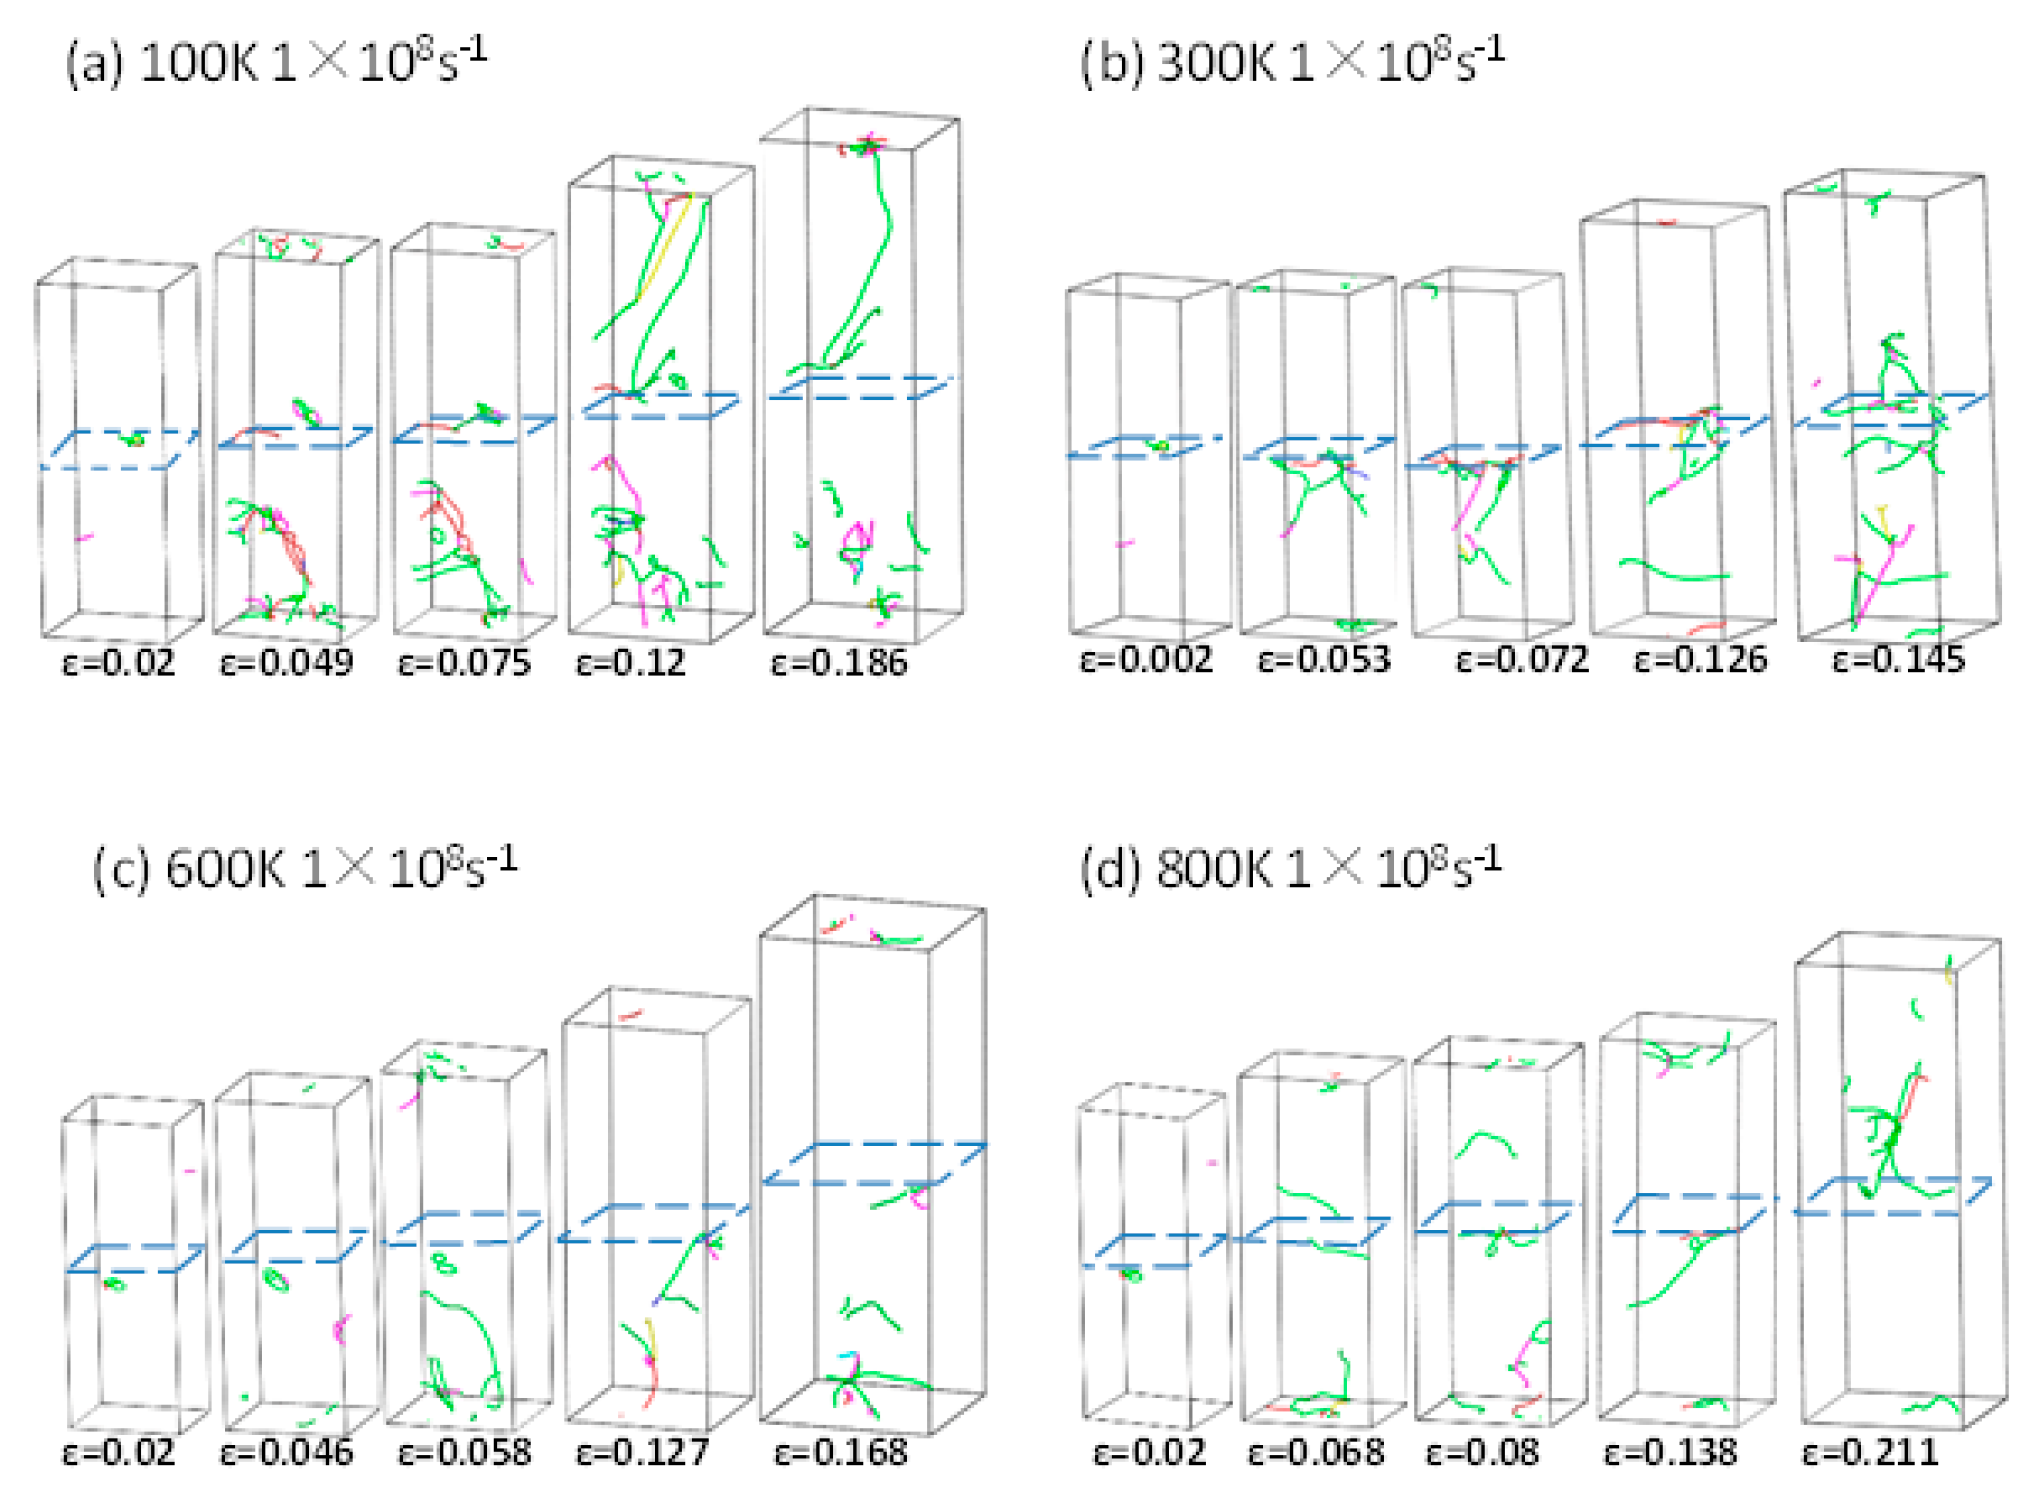
3.2. Tensile Properties of Σ3 GBs HEAs and Without Non-GBs HEAs at the Same Strain Rate at Different Temperatures

The effect of temperature on the tensile properties of HEAs is very important. Uniaxial tensile experiments are carried out for Σ3 GBs HEAs and non-GBs HEAs with a strain rate of 1 × 10⁸ s−1 at 100, 300, 600, and 800 K. By simulating and analyzing the stress and strain curves, micro-atomic and dislocation line configurations during the tensile deformation, the effects of Σ3 GBs HEAs are studied under different temperature conditions.
Figure 10 shows that the stress-strain curves of the deformation process at different temperatures of Σ3 GBs HEAs and non-GBs HEAs. Two curves of stress-strain show similar stress-strain behavior. It can be separated into three stages. The first stage is a linear elastic process. As the deformation continues, the stress rises to its peak and then drops sharply. The third stage is the gradual plastic deformation under low stress until the final structural fracture. At the same time, it is observed that the curves change of the stress-strain curve with Σ3 GBs HEAs after the yield point is more stable than that after the yield point of non-GBs HEAs. Further analysis of internal changes during the tensile deformation is needed.
Tensile experiments with strain rates of 1 × 10⁸ s−1 at temperatures of 100, 300, 600, and 800 K process for Σ3 GBs HEAs and non-GBs HEAs. The yield strength and Young’s modulus of both HEAs were obtained from Table 2. As the temperature increased, the yield strength and Young’s modulus of Σ3 GBs HEAs were higher than those of non-GBs HEAs. In general, the higher the temperature, the higher the atomic thermal motion, which leads to an unstable structure and decreases the strength. In order to observe obviously the changes of lattice structure at different temperatures, the stacking faults at grain boundaries, and the nucleation and expansion of dislocations in the tensile deformation, the microstructure of atoms and dislocation lines under different strains were selected.
The CNA of Σ3 GBs HEAs and non-GBs HEAs at different temperatures of 100, 300, 600, and 800 K, as observed in Figure 11 and Figure 12. From Figure 11a, when the strain is 0.049, there is an SF above the grain boundary. As the strain increases, the length of ISF above is gradually increasing longer. The grain boundary is also found to hinder the expansion of the SF, ISF, and ESF in the CNA of 300, 600, and 800 K. In the CNA diagram of 100 K non-GBs HEAs (Figure 12). When the strain is 0.056, ISF appears. When the strain is 0.089, ISF runs through the whole model. TB is found at a strain of 0.089. TB appears, which is consistent with the observed phenomena in the experiment [15]. The increasing strain reduced the steady strain hardening of dislocation, which resulted in the greater fluctuation of the stress-strain curve of the non-GBs HEAs. The TB is decomposed from 1/2<110> perfect dislocation to 1/6/<112> Shockley partial dislocations. TB hinders the expansion of the upper right ISF. As the strain increases, found a reduction in the number of ISF, TB has become the main deformation mechanism. As shown in Figure 12b–d, ISF and ESF are not hindered by grain boundary at temperatures of 300, 600, and 800 K and can be expanded in the whole model.
The microstructure of dislocation lines Σ3 GBs HEAs (Figure 13) and non-GBs HEAs (Figure 14) at different temperatures (100, 300, 600, and 800 K) were researched. Dislocation type includes mainly green 1/6<112> Shockley partial dislocations, a small account of 1/6<110> Stair-rod, 1/2<110>perfect dislocation, and 1/3<111> Hirth dislocations. Draw a DXA diagram of Σ3 GBs HEAs at different temperatures (Figure 13), 1/6<112> Shockley partial dislocations always start nucleation near grain boundaries and form a dislocation loop. Dislocations expand with the increase in strain. With the increase in dislocation density, if it slips to the grain boundary, it is hard to slip and stack at grain boundaries. Therefore, dislocation entanglement and dislocation accumulation near grain boundaries. Figure 14 shows the motion of the dislocation line of the non-GBs HEAs at different temperatures. Dislocations appear randomly at the origin of non-GBs HEAs. The dislocation has been expanded smoothly in non-GBs HEAs. The dislocation density at 100 and 300 K is greater than 600 and 800 K. As the temperature increases, the movement of dislocations increases, and the annihilation of dislocations occurs, resulting in a decrease in dislocation density.

4. Conclusions

The stress-strain curves of GBs HEAs and non-GBs HEAs at different strain rates and temperatures were compared and discussed. The variation trend for stacking faults and dislocations through the molecular dynamics method was researched.
The stress-strain curves of Σ3 GBs HEAs and non-GBs HEAs were analyzed at different strain rates at 300 K. From the elastic stage of approximate linear change to the peak yield strength, the system enters a long plastic deformation process until fracture. At the same strain rate, the yield strength of Σ3 GBs HEAs is higher than that of non-GBs HEAs. This is due to dislocation entanglement and dislocation accumulation near grain boundaries. There is no obvious difference in Young’s modulus between Σ3 GBs HEAs and non-GBs HEAs. It indicates that the presence or absence of grain boundary has little effect on Young’s modulus of HEAs. At different strain rates, with the increase in strain rate, the yield strength of Σ3 GBs HEAs and non-GBs HEAs increase with the increase in strain rate.
Under different temperatures, Σ3 GBs HEAs and non-GBs HEAs were subjected to uniaxial tensile at the same strain rate. The yield strength and Young’s modulus decreased with the increase in temperature. The yield strength and Young’s modulus of Σ3 GBs HEAs are higher than non-GBs HEAs at the same temperature. At the same time, with the increase in temperature, the dislocation of the Σ3 GBs HEAs and non-GBs HEAs are enhanced and occurred dislocation annihilation, resulting in the decrease in dislocation density. Dislocation type includes mainly 1/6<112> Shockley partial dislocations, a small account of 1/6<110> Stair-rod, 1/2<110>perfect dislocation, and 1/3< 111> Hirth dislocations. This research is helpful to understand how grain boundaries affect the mechanical properties of HEAs from the atomic point of view and provides guidance for the study of HEAs with better mechanical properties.

Author Contributions

C.L.: Methodology, Software, Validation, Investigation, Visualization, Writing—original draft, Writing—review and editing. R.W.: Software, Writing—review and editing. Z.J.: Methodology, Writing—reviewand editing. All authors have read and agreed to the published version of the manuscript.

Funding

This research was funded by the Natural Science Foundation of China (grant number 51971166) and the Key Laboratory of Shaanxi Provincial Education Department (grant number 20JS055).

Institutional Review Board Statement

Not applicable.

Informed Consent Statement

Not applicable.

Data Availability Statement

Data are contained within the article. The data presented in this study can be seen in the content above.

Acknowledgments

This work was supported by the Natural Science Foundation of China (grant number 51971166) and the Key Laboratory of Shaanxi Provincial Education Department (grant number 20JS055).

Conflicts of Interest

The authors declare no conflict of interest.

References

  1. Chou, Y.-L.; Wang, Y.-C.; Yeh, J.-W.; Shih, H.-C. Pitting corrosion of the high-entropy alloy Co1.5CrFeNi1.5Ti0.5Mo0.1 in chloride-containing sulphate solutions. Corros. Sci. 2010, 52, 3481–3491. [Google Scholar] [CrossRef]
  2. Shi, Y.; Yang, B.; Xie, X.; Brechtl, J.; Dahmen, K.A.; Liaw, P.K. Corrosion of AlxCoCrFeNi High-entropy alloys: Al-content and potential scan-rate dependent pitting behavior. Corros. Sci. 2017, 119, 33–45. [Google Scholar] [CrossRef]
  3. Chuang, M.-H.; Tsai, M.-H.; Wang, W.-R.; Lin, S.-J.; Yeh, J.-W. Microstructure and wear behavior of AlxCo1.5CrFeNi1.5Tiy high-entropy alloys. Acta Mater. 2011, 59, 6308–6317. [Google Scholar] [CrossRef]
  4. Poulia, A.; Georgatis, E.; Lekatou, A. Microstructure and wear behavior of a refractory high entropy alloy. Int. J. Refract. Met. Hard Mater. 2016, 57, 50–63. [Google Scholar] [CrossRef]
  5. Yeh, J.-W.; Chen, S.-K.; Lin, S.-J.; Gan, J.-Y.; Chin, T.-S.; Shun, T.-T.; Tsau, C.-H.; Chang, S.-Y. Nanostructured high-entropy alloys with multiple principal elements: Novel alloy design concepts and outcomes. Adv. Eng. Mater. 2004, 5, 299–303. [Google Scholar] [CrossRef]
  6. Qiu, X.-W.; Zhang, Y.-P.; He, L.; Liu, C.-G. Microstructure and corrosion resistance of AlCrFeCuCo high entropy alloy. J. Alloys Compd. 2013, 549, 195–199. [Google Scholar] [CrossRef]
  7. Yen, J.-W.; Lin, S.-J.; Chin, T.-S.; Gan, J.-Y.; Chen, S.-K.; Shun, T.-T.; Tsau, C.-H.; Chou, S.-Y. Formation of simple crystal structures in Cu-Co-Ni-Cr-Al-Fe-Ti-V alloys with multi principal metallic elements. Metall. Mater. Trans. A 2004, 35, 2533–2536. [Google Scholar]
  8. Tong, C.-J.; Chen, Y.-L.; Yeh, J.-W.; Shun, T.-T.; Tsau, C.-H.; Lin, S.-J.; Chang, S.-Y. Microstructure characterization of AlxCoCrCuFeNi high-entropy alloy system with multi-principal elements. Metall. Mater. Trans. A 2005, 36, 881–893. [Google Scholar] [CrossRef]
  9. Wu, Z.; Bei, H.; Pharr, G.-M.; George, E.-P. Temperature dependence of the mechanical properties of equiatomic solid solution alloys with face-centered cubic crystal structures. Acta Mater. 2014, 81, 428–441. [Google Scholar] [CrossRef]
  10. Liu, W.-H.; Wu, Y.; He, J.-Y.; Nieh, T.-G.; Lu, Z.P. Grain growth and the Hall–Petch relationship in a high-entropy FeCrNiCoMn alloy. Scr. Mater. 2013, 68, 526–529. [Google Scholar] [CrossRef]
  11. Thota, H.; Jeyaraam, R.; Bairi, L.-R.; Tirunilaic, A.-S.; Kauffmann, A.; Freudenberger, J.; Heilmaier, M.; Mandal, S.; Vadlamani, S.-S. Grain boundary engineering and its implications on corrosion behavior of equiatomic CoCrFeMnNi high entropy alloy. J. Alloys Compd. 2020, 888, 161500. [Google Scholar] [CrossRef]
  12. Chen, B.-R.; Yeh, A.-C.; Yeh, J.-W. Effect of one-step recrystallization on the grain boundary evolution of CoCrFeMnNi high entropy alloy and its subsystems. Sci. Rep. 2016, 6, 22306. [Google Scholar] [CrossRef] [Green Version]
  13. Li, Z.-M.; Tasan, C.-C.; Pradeep, K.-G.; Raabe, D. A TRIP-assisted dual-phase high-entropy alloy: Grain size and phase fraction effects on deformation behavior. Acta Mater. 2017, 131, 323–335. [Google Scholar] [CrossRef]
  14. Zhao, S.-J. Effects of local elemental ordering on defect-grain boundary interactions in high-entropy alloys. J. Alloys Compd. 2021, 887, 161314. [Google Scholar] [CrossRef]
  15. Kumar, N.; Ying, Q.; Nie, X.; Mishra, R.-S.; Tang, Z.; Liaw, P.-K.; Brennan, R.-E.; Doherty, K.-J.; Cho, K.-C. High Strain-Rate Compressive Deformation Behavior of the Al0.1CrFeCoNi High Entropy Alloy. Mater. Des. 2015, 86, 598–602. [Google Scholar] [CrossRef]
  16. Bulatov, V.-V.; Reed, B.-W.; Kumar, M. Grain boundary energy function for fcc metals. Acta Mater. 2014, 65, 161–175. [Google Scholar] [CrossRef]
  17. Yang, J.; Qiao, W.-J.; Ma, G.-S.; Wu, Y.-G.; Zhao, D. Revealing the Hall-Petch relationship of Al0.1CoCrFeNi high-entropy alloy and its deformation mechanisms. J. Alloys Compd. 2019, 795, 269–274. [Google Scholar] [CrossRef]
  18. Yang, T.; Xia, S.; Liu, S.; Wang, C.; Wang, L. Effects of Al addition on microstructure and mechanical properties of AlxCoCrFeNi High-entropy alloy. Mater. Sci. Eng. A 2015, 648, 15–22. [Google Scholar] [CrossRef]
  19. Xia, S.; Zhang, Y. Deformation mechanisms of Al0.1CoCrFeNi high entropy alloy at ambient and cryogenic temperatures. Mater. Sci. Eng. A 2018, 733, 408–413. [Google Scholar] [CrossRef]
  20. Yang, T.-F.; Tang, Z.; Xie, X.; Carroll, R.; Wang, G.-Y.; Wang, Y.-G.; Dahmen, K.-A.; Liaw, P.-K.; Zhang, Y.-W. Deformation mechanisms of Al0.1CoCrFeNi at elevated temperatures. Mater. Sci. Eng. A 2017, 684, 552–558. [Google Scholar] [CrossRef] [Green Version]
  21. Jia, L.; Fang, Q.-H.; Liu, B.; Liu, Y.-W.; Liu, Y. Mechanical behaviors of AlCrFeCuNi high-entropy alloys under uniaxial tensile via molecular dynamics simulation. RSC Adv. 2016, 6, 76409–76419. [Google Scholar]
  22. Brandon, D.-G. The structure of high-angle grain boundaries. Acta Metall. 1966, 14, 1479–1484. [Google Scholar] [CrossRef]
  23. Yang, Y.-C.; Liu, C.-X.; Lin, C.-Y.; Xia, Z.-H. The effect of local atomic configuration in high-entropy alloys on the dislocation behaviors and mechanical properties. Mater. Sci. Eng. A 2021, 815, 141253. [Google Scholar] [CrossRef]
  24. Sharma, A.; Balasubramanian, G. Dislocation dynamics in Al0.1CoCrFeNi high-entropy alloy under tensile loading. Intermetallics 2017, 91, 31–34. [Google Scholar] [CrossRef]
Figure 1. GBs HEAs. (a) 3D structure of GBs HEAs; (b) structure of Σ3{112}.
Crystals 12 00048 g001
Figure 2. Three-dimensional structure of non-GBs HEAs.
Crystals 12 00048 g002
Figure 3. GBs HEAs model after solidification.
Crystals 12 00048 g003
Figure 4. Radial distribution function for Al0.1CoCrFeNi HEAs.
Crystals 12 00048 g004
Figure 5. Stress-strain curves of deformation process at different strain rates of HEA. (a) GBs HEAs; (b) non-GBs HEAs.
Crystals 12 00048 g005
Figure 6. The CNA diagram of GBs HEAs under tensile. (a) 300 K, 1 × 10⁸ s−1; (b) 300 K, 1 × 10⁹ s−1.
Crystals 12 00048 g006
Figure 7. The CNA diagram of non-GBs HEAs under tensile. (a) 300 K, 1 × 10⁸ s−1; (b) 300 K, 1 × 10⁹ s−1.
Crystals 12 00048 g007
Figure 8. The DXA diagram of GBs HEAs under tensile. (a) 300 K, 1 × 10⁸ s−1; (b) 300 K, 1 × 10⁹ s−1.
Crystals 12 00048 g008
Figure 9. The DXA diagram of non-GBs HEAs under tensile. (a) 300 K, 1 × 10⁸ s−1; (b) 300 K, 1 × 10⁹ s−1.
Crystals 12 00048 g009
Figure 10. Stress-strain curves of deformation process at different temperatures of GBs HEAs and non-GBs HEAs; (a) GBs HEAs; (b) non-GBs HEAs.
Crystals 12 00048 g010
Figure 11. The CNA diagram of GBs HEAs under tensile. (a) 100 K, 1 × 10⁸ s−1; (b) 300 K, 1 × 10⁸ s−1; (c) 600 K, 1 × 10⁸ s−1; (d) 800 K, 1 × 10⁸ s−1.
Crystals 12 00048 g011
Figure 12. The CNA diagram of non-GBs HEAs under tensile. (a) 100 K, 1 × 10⁸ s−1; (b) 300 K, 1 × 10⁸ s−1; (c) 600 K, 1 × 10⁸ s−1; (d) 800 K, 1 × 10⁸ s−1.
Crystals 12 00048 g012
Figure 13. The DXA diagram of GBs HEAs under tensile. (a) 100 K, 1 × 10⁸ s−1; (b) 300 K, 1 × 10⁸ s−1; (c) 600 K, 1 × 10⁸ s−1; (d) 800 K, 1 × 10⁸ s−1.
Crystals 12 00048 g013
Figure 14. The DXA diagram of non-GBs HEAs under tensile. (a) 100 K,1 × 108 s−1; (b) 300 K, 1 × 10⁸ s−1; (c) 600 K,1 × 108 s−1; (d) 800 K, 1 × 10⁸ s−1.
Crystals 12 00048 g014
Table 1. Young’s modulus and yield strength of GBs HEAs and non-GBs HEAs at different strain rates.
Rate/s−1Non-GBs Yield Strength/GPaGBsyield Strength/GPaNon-GBs Young’s Modulus/GPaGBsYoung’s Modulus/GPa
1 × 1086.897.97219.12230.57
5 × 1087.518.67219.24231.63
1 × 1097.549.03219.71235.08
5 × 1098.8410.34221.07235.76
Table 2. Young’s modulus and yield strength of GBs HEAs and non-GBs HEAs at different temperatures.
Temperature/KNon-GBs Yield Strength/GPaGBsyield Strength/GPaNon-GBsYoung’s Modulus/GPaGBsYoung’s Modulus/GPa
1007.869.47226.09242.84
3006.897.97219.12230.57
6005.675.86180.52188.52
Publisher’s Note: MDPI stays neutral with regard to jurisdictional claims in published maps and institutional affiliations.

