
Near-Infrared Spectroscopy Study of Serpentine Minerals and Assignment of the OH Group

Abstract
:
1. Introduction
2. Materials and Methods
3. Results
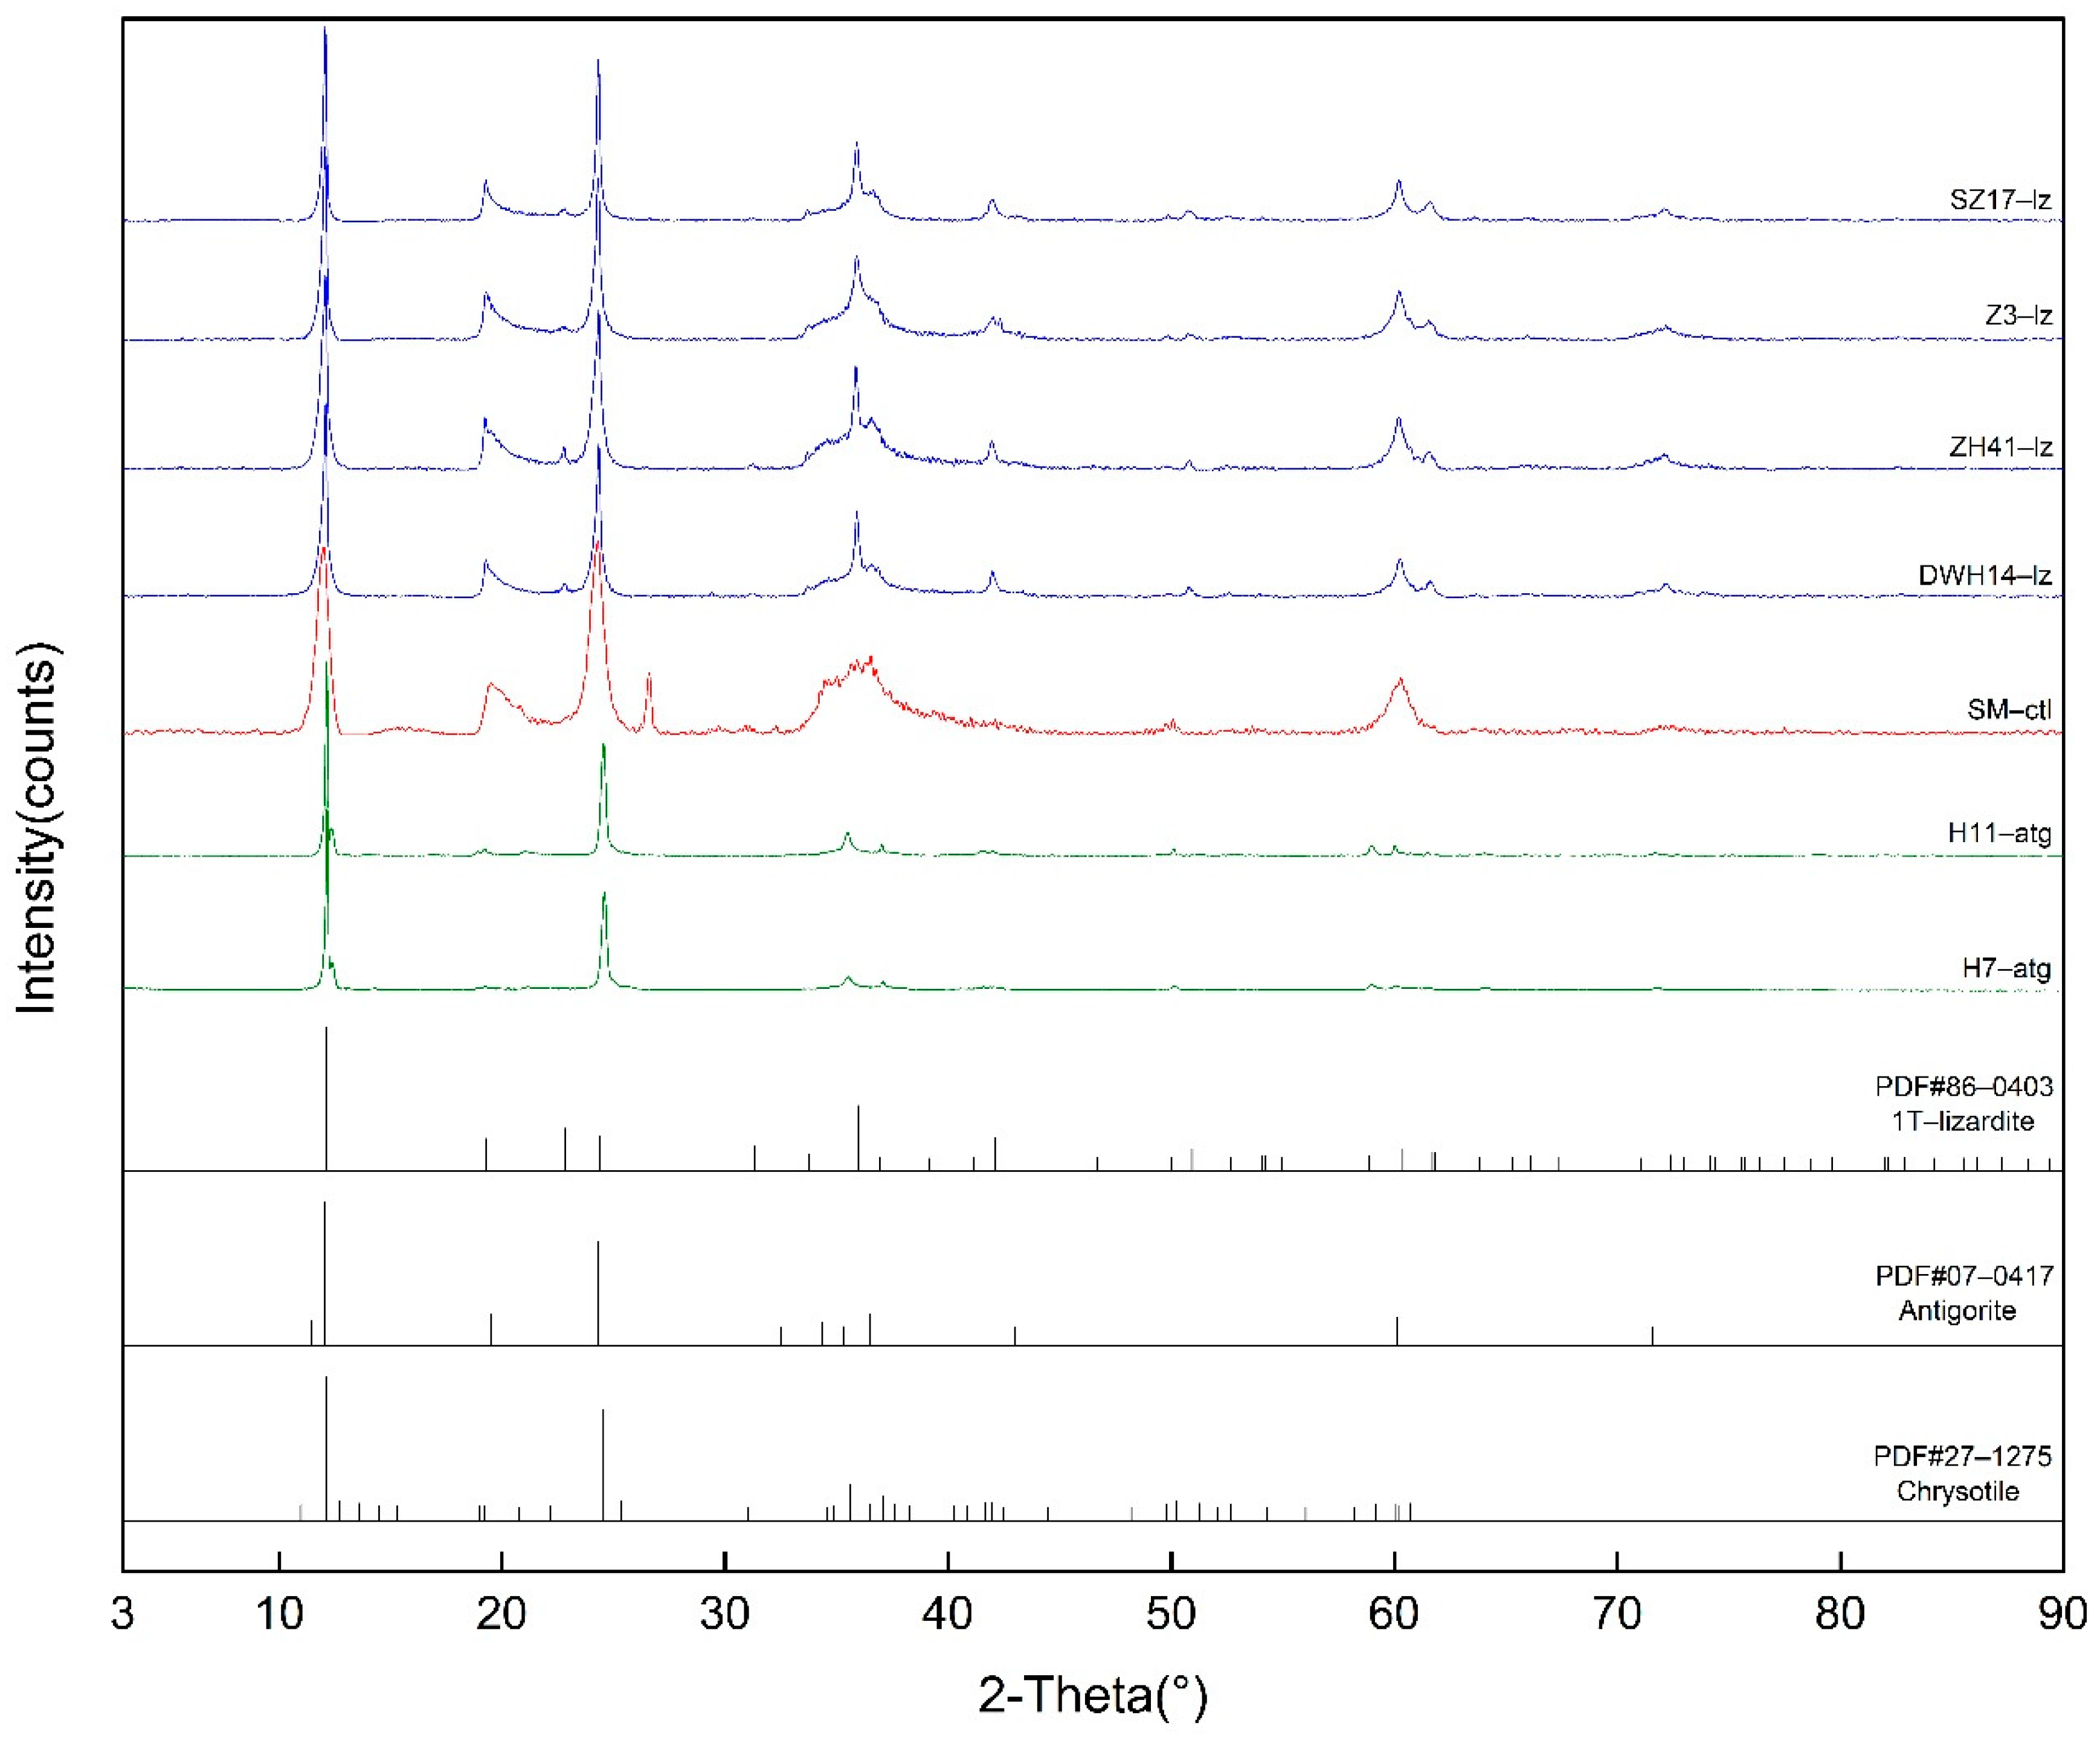
3.1. X-ray Diffraction
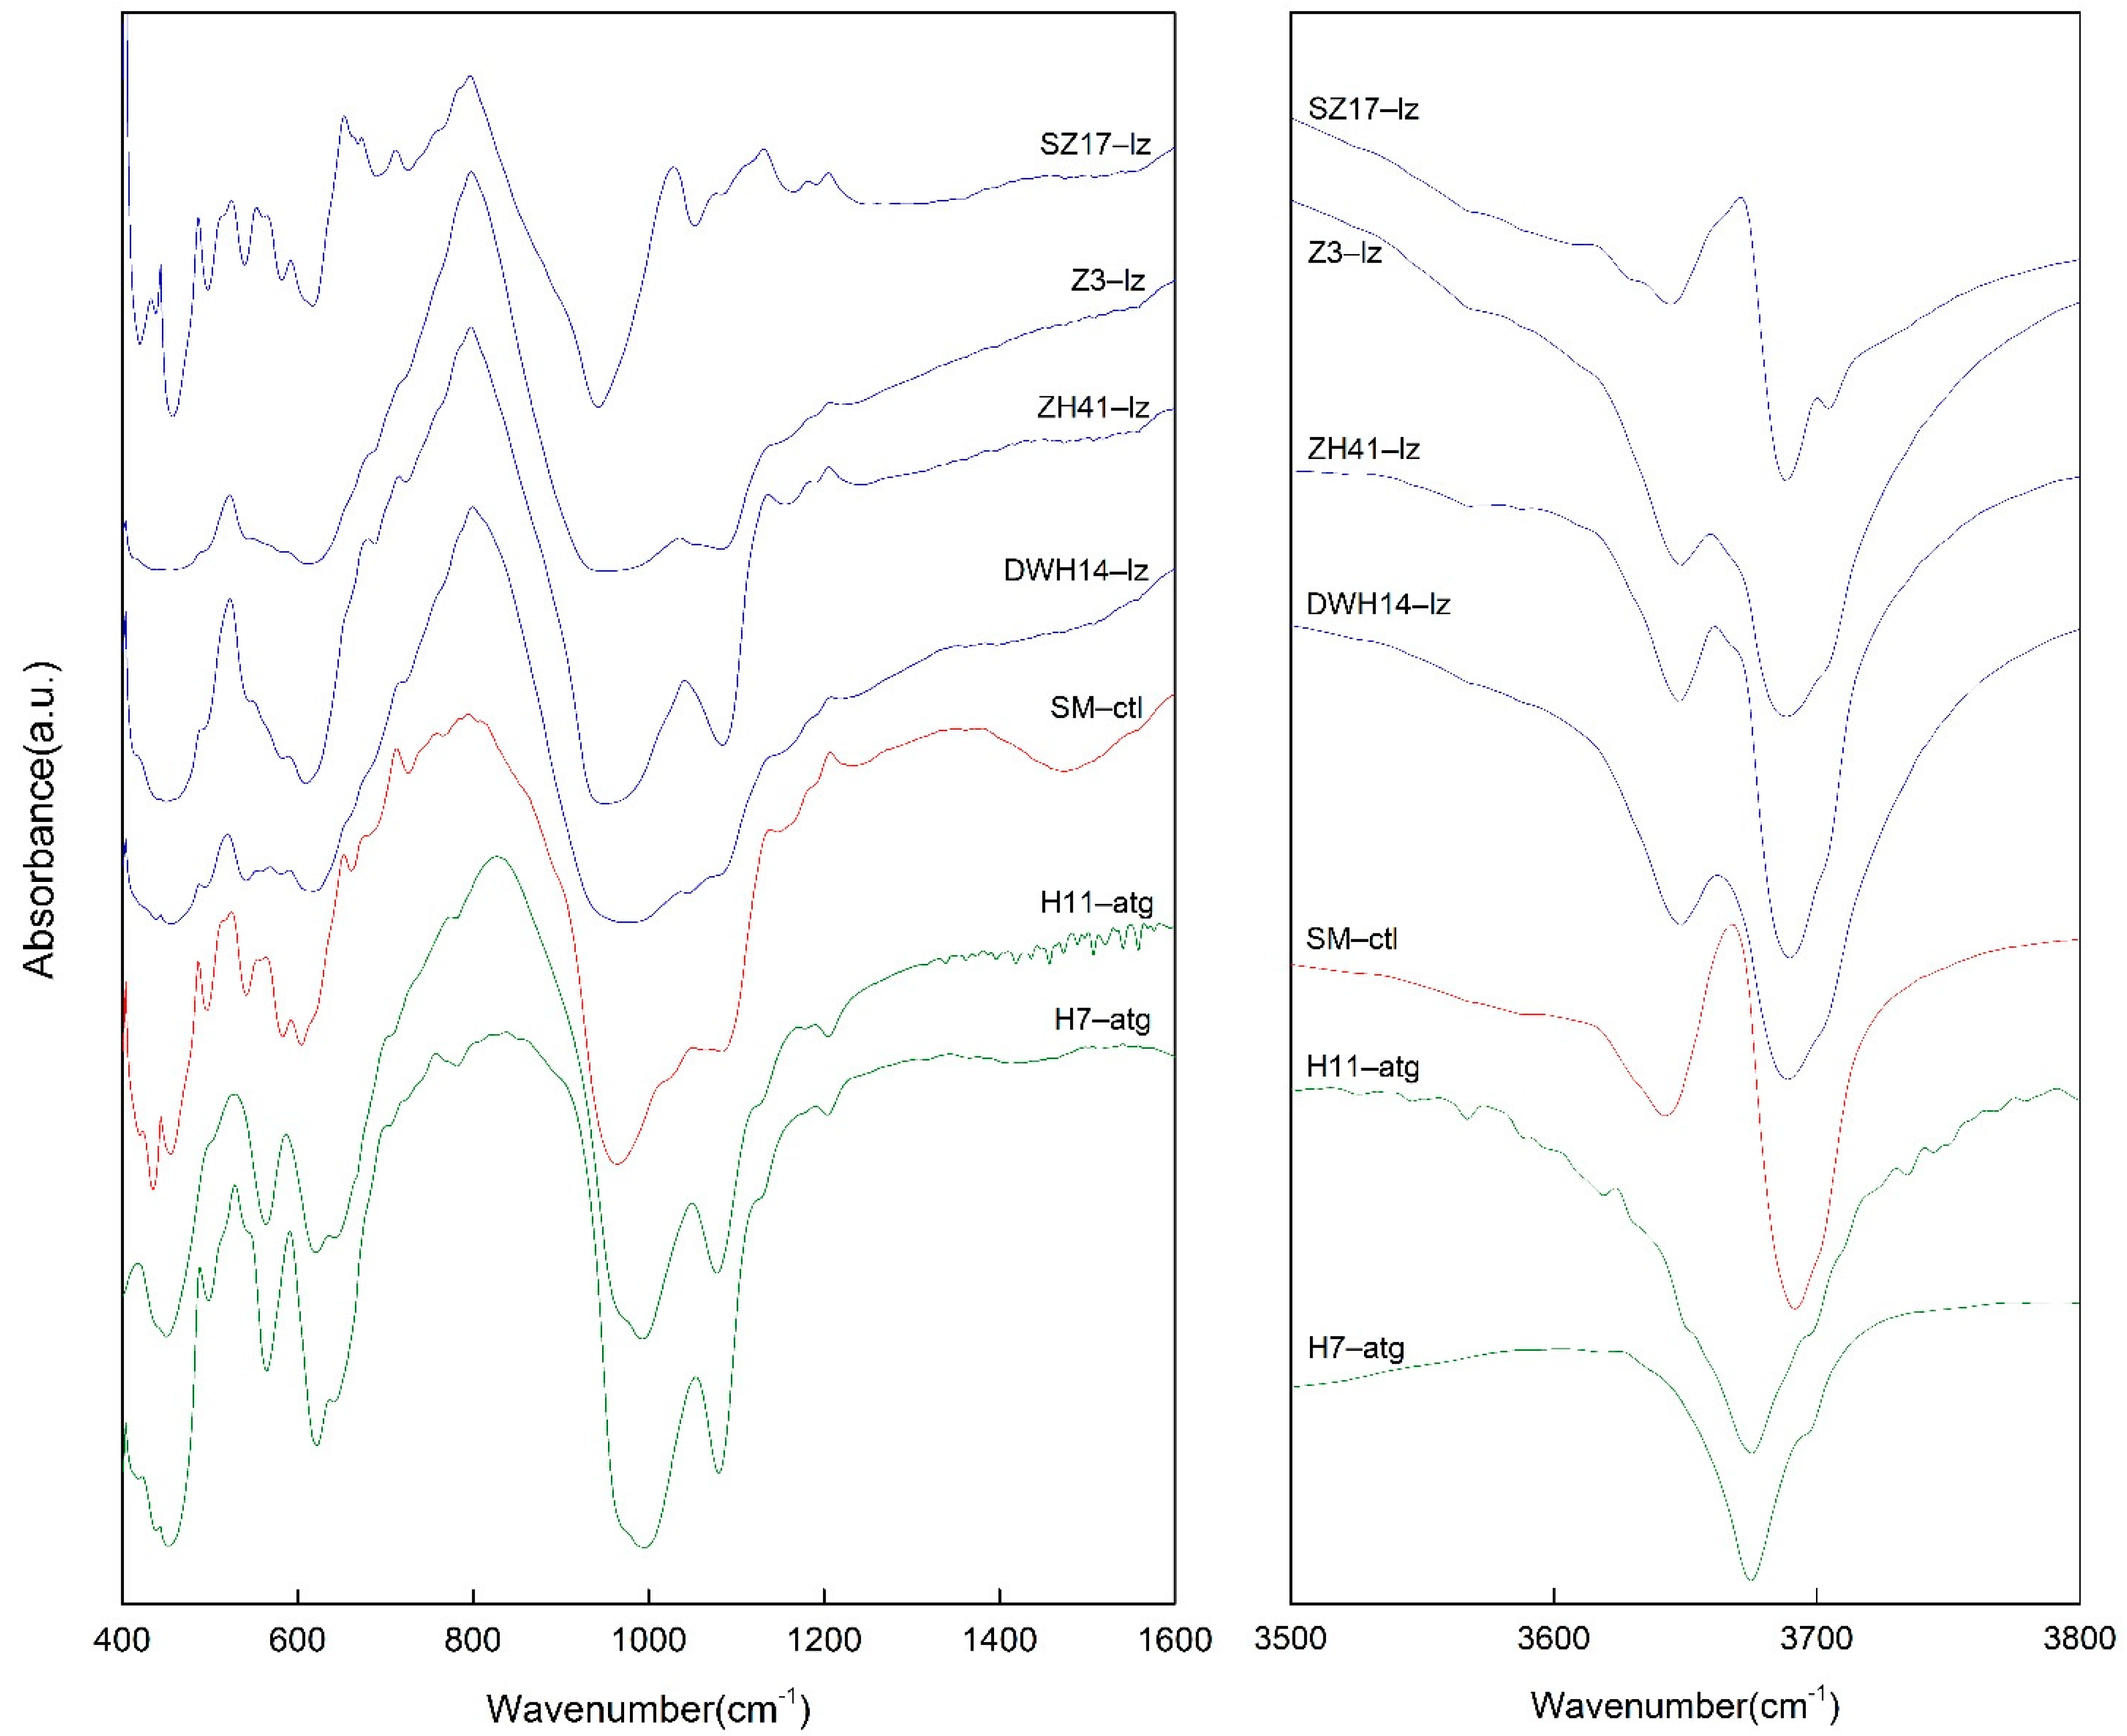
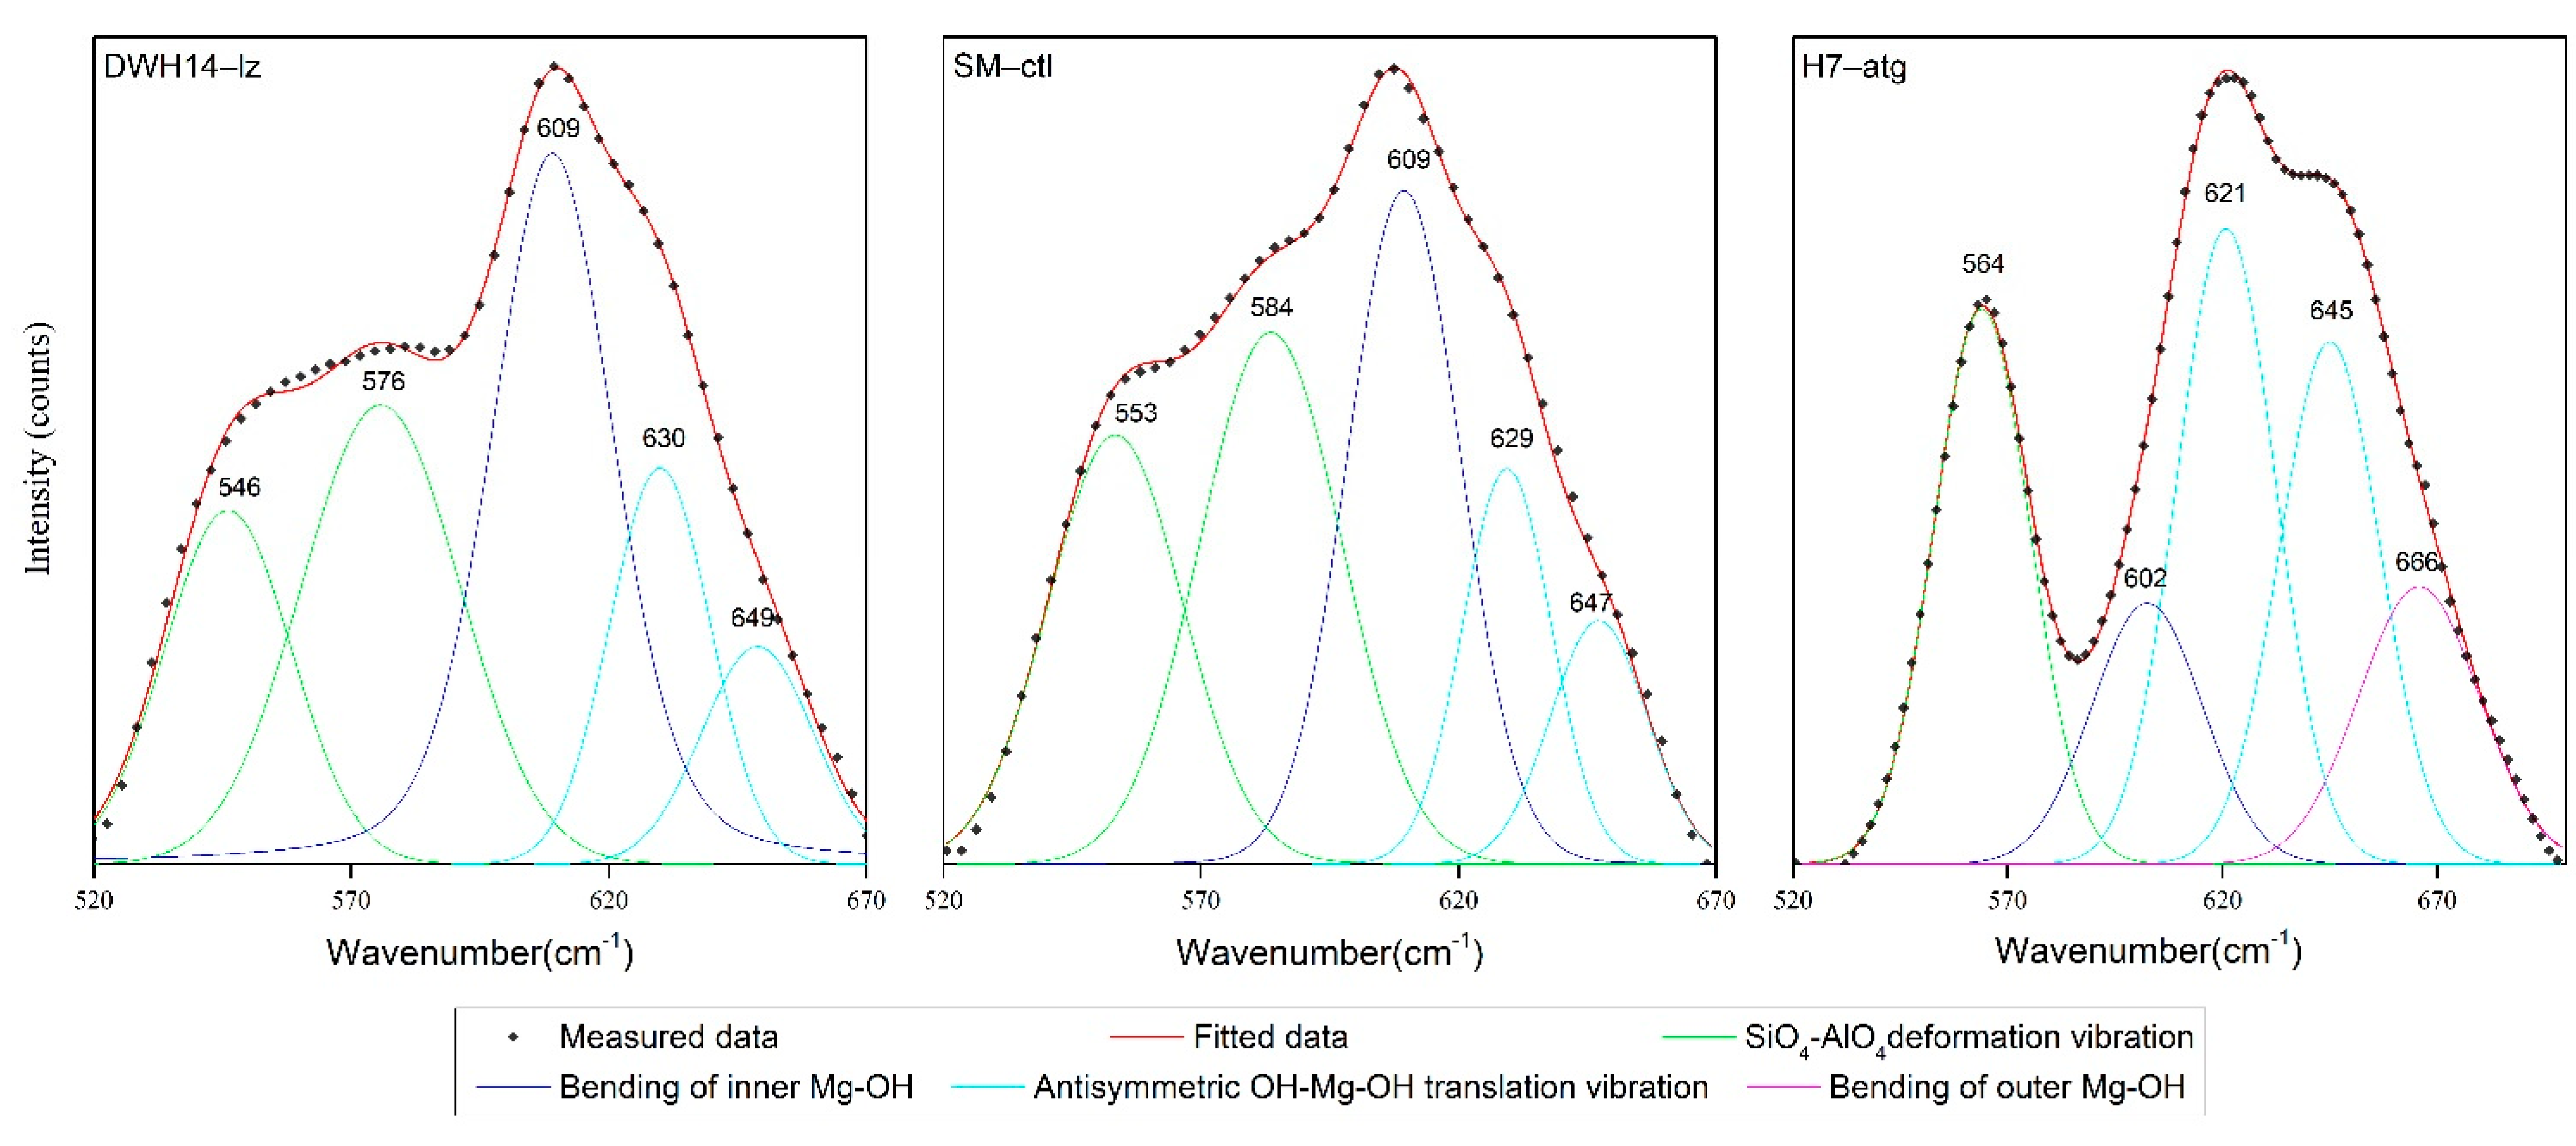
3.2. Characteristics of MIR
3.3. Characteristics of NIR
4. Discussion
5. Conclusions
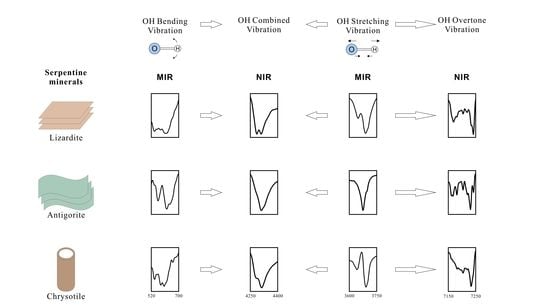
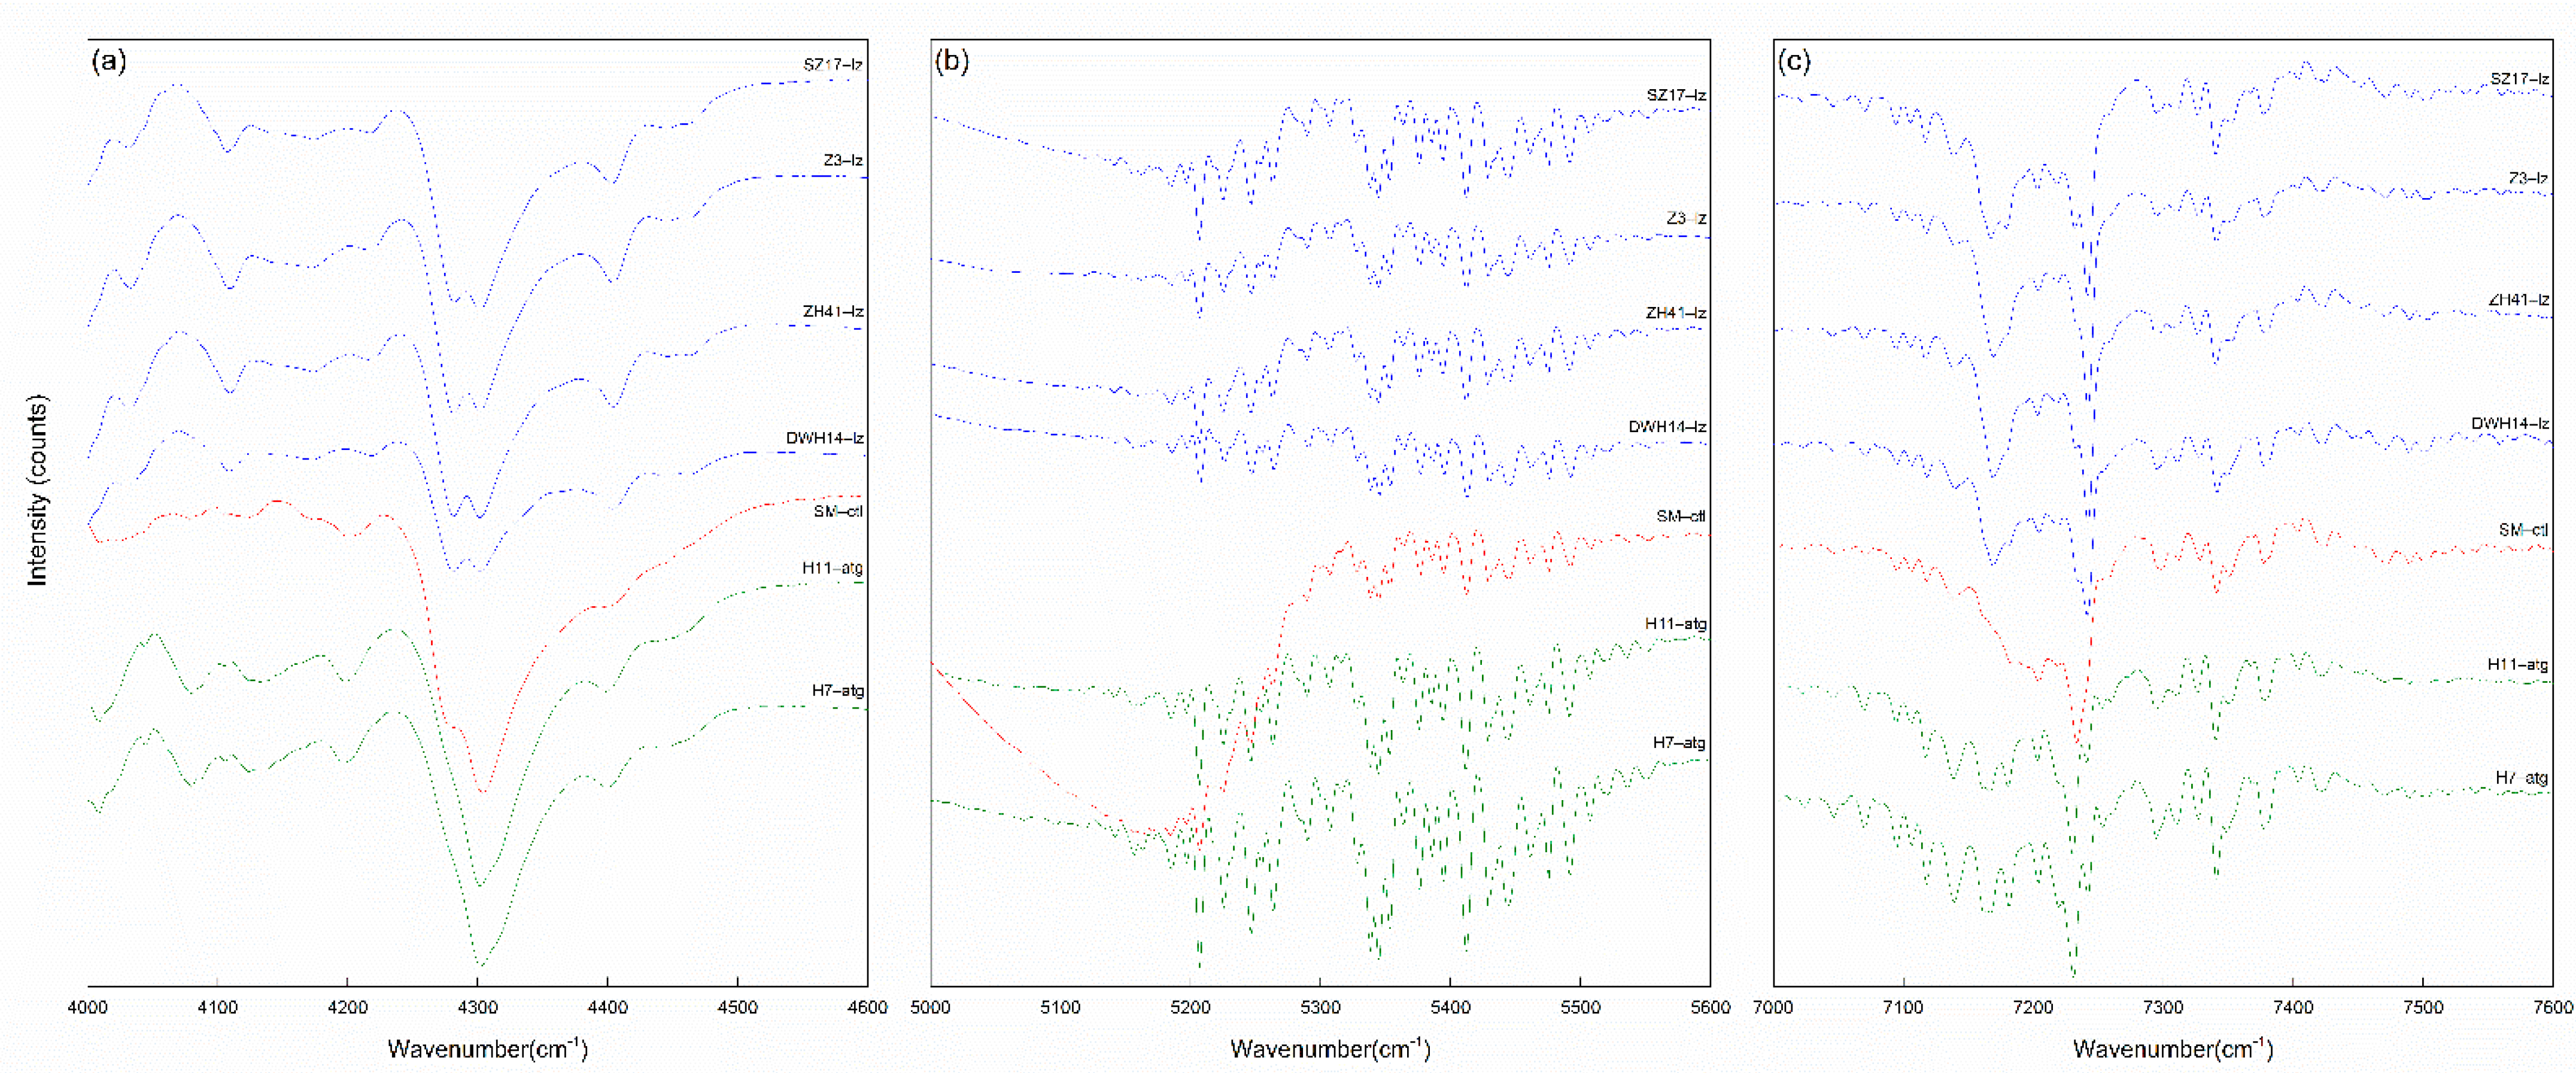
- There are obvious differences in the infrared spectrum of the three serpentine minerals. Lizardite has two equal-height peaks at 4280 and 4300 cm−1, and two strong peaks at 7170 and 7241 cm−1. Chrysotile has a shoulder peak at 4280 cm−1 and 7243 cm−1 and only one strong peak at 7233 cm−1. There are single strong peaks at 3674 cm−1, 4300 cm−1, and 7231 cm−1 and weak shoulder peaks at 4280 cm−1 and 4315 cm−1 for antigorite, with a clear peak at 7242 cm−1. These characteristic peaks are helpful in identifying and distinguishing between serpentine minerals.
- In the range 4000–4600 cm−1, the serpentine peaks correspond to the OH secondary combination band region and in the range between 4280 and 4300 cm−1, it corresponds to a combination of sloping, vertical stretching, and bending vibrations of the outer OH groups. The 7000–7600 cm−1 band is the first fundamental overtone of the OH group stretching vibrations. The peaks at 7170, 7204, 7233, and 7242 cm−1 correspond to the overtone of the sloping stretching vibration of the outer OH group, the overtone combined sloping stretching vibration and vertical stretching vibration of the outer OH group, and the overtone of the vertical stretching vibration of the outer OH group, respectively.
- Due to the non-ideal conditions, the actual position of the overtone peak is lower than the theoretical position. The factor of the first fundamental overtone of the OH group stretching vibration is about 1.965.
Author Contributions
Funding
Data Availability Statement
Conflicts of Interest
References
- Yu, X.Y. Colored Gemmology, 2nd ed.; Geological Publishing House: Beijing, China, 2009; pp. 86–87. [Google Scholar]
- Salzer, R. Practical Guide to Interpretive Near-Infrared Spectroscopy. By Jerry Workman, Jr. and Lois Weyer. Angew. Chem. Int. Ed. 2008, 47, 25. [Google Scholar] [CrossRef]
- Li, Y.Q.; Jiang, S.Y.; Fan, W.W. Study on the Infrared Spectra of Chrysotiles in China. Chin. J. Geol. 1981, 3, 247–253. [Google Scholar]
- Xu, G.T.; Yuan, H.F.; Lu, W.Z. Development of Modern Near Infrared Spectroscopic Techniques and Its Applications. Spectrosc. Spectr. Anal. 2000, 2, 134–142. [Google Scholar]
- Chu, X.L.; Yuan, H.F.; Lu, W.Z. Progress and Application of Spectral Data Pretreatment and Wavelength Selection Methods in NIR Analytical Technique. Anal. Instrum. 2006, 2, 1–10. [Google Scholar]
- Zheng, A.B.; Yang, H.H.; Pan, X.P.; Yin, L.H.; Feng, Y.C. Identifying Multi-Class Drugs by Using Near-Infrared Spectroscopy and Variational Auto-Encoding Modeling. Spectrosc. Spectr. Anal. 2020, 40, 3946–3952. [Google Scholar]
- Petriglieri, J.R.; Salvioli-Mariani, E.; Mantovani, L.; Tribaudino, M.; Lottici, P.P.; Laporte-Magoni, C.; Bersani, D. Micro-Raman mapping of the polymorphs of serpentine. J. Raman Spectrosc. 2015, 46, 953–958. [Google Scholar] [CrossRef]
- Groppo, C.; Rinaudo, C.; Cairo, S.; Gastaldi, D.; Compagnoni, R. Micro-Raman spectroscopy for a quick and reliable identification of serpentine minerals from ultramafics. Eur. J. Mineral. 2006, 18, 319–329. [Google Scholar] [CrossRef]
- Farmer, V.C. The Infrared Spectra Of Minerals; The Mineralogical Society of Great Britain & Ireland: Middlesex, UK, 1974; p. 539. [Google Scholar]
- Cheng, H.F.; Hao, R.W.; Zhou, Y. Visible and near-infrared spectroscopic comparison of five phyllosilicate mineral samples. Spectrochim. Acta Part A Mol. Biomol. Spectrosc. 2017, 180, 19–22. [Google Scholar] [CrossRef] [PubMed]
- Li, X.J.; Yu, L.; Zu, E.D. Application of Near Infrared Spectroscopy in the Study of Gems. Spectrosc. Spectr. Anal. 2018, 38, 54–57. [Google Scholar]
- Zhang, S.J.; Deji, Z.; Qin, H.; Liu, H.; Luosang, D.; Cheng, H.F. The Structure of Layered Silicate Mineral and Their Vibrational Spectra Characteristics. China Non-Met. Miner. Ind. 2018, 2, 1–7. [Google Scholar]
- Yariv, S. Infrared evidence for the occurrence of SiO groups with double-bond character in antigorite, sepiolite and palygorskite. Clay Miner. 1986, 21, 925–936. [Google Scholar] [CrossRef]
- Kloprogge, J.T.; Frost, R.L.; Rintoul, L. Single crystal Raman microscopic study of the asbestos mineral chrysotile. Phys. Chem. Chem. Phys. 1999, 1, 2559–2564. [Google Scholar] [CrossRef]
- Post, J.L.; Borer, L. High-resolution infrared spectra, physical properties, and micromorphology of serpentines. Appl. Clay Sci. 2000, 16, 73–85. [Google Scholar] [CrossRef]
- Trittschack, R.; Grobéty, B.; Koch-Müller, M. In situ high-temperature Raman and FTIR spectroscopy of the phase transformation of lizardite. Am. Mineral. 2012, 97, 1965–1976. [Google Scholar] [CrossRef]
- Bishop, J.; Murad, E.; Dyar, M.D. The influence of octahedral and tetrahedral cation substitution on the structure of smectites and serpentines as observed through infrared spectroscopy. Clay Miner. 2002, 37, 617–628. [Google Scholar] [CrossRef]
- Uehara, S.; Shirozu, H. Variations in chemical composition and structural properties of antigorites. Mineral. J. 1985, 12, 299–318. [Google Scholar] [CrossRef] [Green Version]
- Luce, R.W. Identification of serpentine varieties by infrared absorption. Geol. Sur. Prof. Pap. 1971, 750, 199–201. [Google Scholar]
- Rinaudo, C.; Gastaldl, D.; Belluso, E. Characterization of Chrysotile, Antigorite and Lizardite by FT-Raman Spectroscopy. Can. Mineral. 2003, 41, 883–890. [Google Scholar] [CrossRef]
- Xue, L.; Wang, Y.Q.; Fan, J.L. Study on the Spectroscopy of Yellow Serpentine Jade. Laser Infrared 2009, 39, 267–270. [Google Scholar]
- Prencipe, M.; Noel, Y.; Marco Bruno, M.; Dovesi, R. The vibrational spectrum of lizardite-1T [Mg3Si2O5(OH)4] at the Γ point: A contribution from an ab initio periodic B3LYP calculation. Am. Mineral. 2015, 94, 986–994. [Google Scholar] [CrossRef]
- Balan, E.; Saitta, A.M.; Mauri, F.; Lemaire, C.; Guyot, F. First-principles calculation of the infrared spectrum of lizardite. Am. Mineral. 2015, 87, 1286–1290. [Google Scholar] [CrossRef]
- Bishop, J.L.; Lane, M.D.; Dyar, M.D.; Brown, A.J. Reflectance and emission spectroscopy study of four groups of phyllosilicates: Smectites, kaolinite-serpentines, chlorites and micas. Clay Miner. 2008, 43, 35–54. [Google Scholar] [CrossRef]
- Jana Madejová, J.; Jankovič, L.; Pentrák, M.; Komadel, P. Benefits of near-infrared spectroscopy for characterization of selected organo-montmorillonites. Vib. Spectrosc. 2011, 57, 8–14. [Google Scholar] [CrossRef]
- Hunt, G.R.; Ashley, R.P. Spectra of altered rocks in the visible and near infrared. Econ. Geol. 1979, 74, 1613–1629. [Google Scholar] [CrossRef]
- King, T.V.; Clark, R.N. Spectral characteristics of chlorites and Mg-serpentines using high-resolution reflectance spectroscopy. J. Geophys. Res. Solid Earth 1989, 94, 13997–14008. [Google Scholar] [CrossRef]
- Baron, F.; Petit, S. Interpretation of the infrared spectra of the lizardite-nepouite series in the near- and mid-infrared range. Am. Mineral. 2016, 101, 423–430. [Google Scholar] [CrossRef]


| Samples | Minerals | Form | Color | Isomorphism |
|---|---|---|---|---|
| DWH14-lz | Lizardite | Block | Yellow | Fe/0.7%, Al/0.1% |
| ZH41-lz | Block | Brownish yellow | Fe/0.9% | |
| Z3-lz | Block | Brown | Fe/1.0%, Mn/0.1%, Al/0.1% | |
| SZ17-lz | Block | Dark brown | Fe/0.8%, Mn/0.2%, Al/0.1% | |
| SM-ctl | Chrysotile | Fiber | Brown | Fe/0.7%, Mn/0.1%, Al/0.2% |
| H7-atg | Antigorite | Block | Light yellow | Fe/0.4%, Al/0.1% |
| H11-atg | Block | Colorless | Fe/0.3% |
| Band Assignment [14,18,19,20,21,22,23] | DWH14-lz | ZH41-lz | Z3-lz | SZ17-lz | SM-ctl | H7-atg | H11-atg |
|---|---|---|---|---|---|---|---|
| Antisymmetric Mg-OH translation | 441 | 441 | 438 | 438 | 435 | 436 | 435 |
| Mg-OH translation + υ6(e) SiO4 | 462 | 462 | 463 | 463 | 454 | 449 | 449 |
| SiO4-AlO4 deformation vibration | 546 | 553 | 551 | 553 | 553 | 564 | 564 |
| 576 | 580 | 580 | 583 | 584 | |||
| Bending of inner Mg-OH | 609 | 609 | 609 | 610 | 609 | 602 | 600 |
| Antisymmetric OH-Mg-OH translation vibration | 630 | 630 | 629 | 630 | 629 | 621 | 619 |
| 649 | 648 | 646 | 649 | 647 | 645 | 644 | |
| Bending of outer Mg-OH | 666 | 666 | |||||
| Si-O stretching vibration | 961 | 962 | 963 | 956 | 963 | 970 | 969 |
| Si-Ob-Si stretching vibration | 1022 | 1022 | 1024 | 1018 | 1026 | 994 | 993 |
| Si-Onb stretching vibration | 1080 | 1078 | 1080 | 1079 | 1080 | 1080 | 1077 |
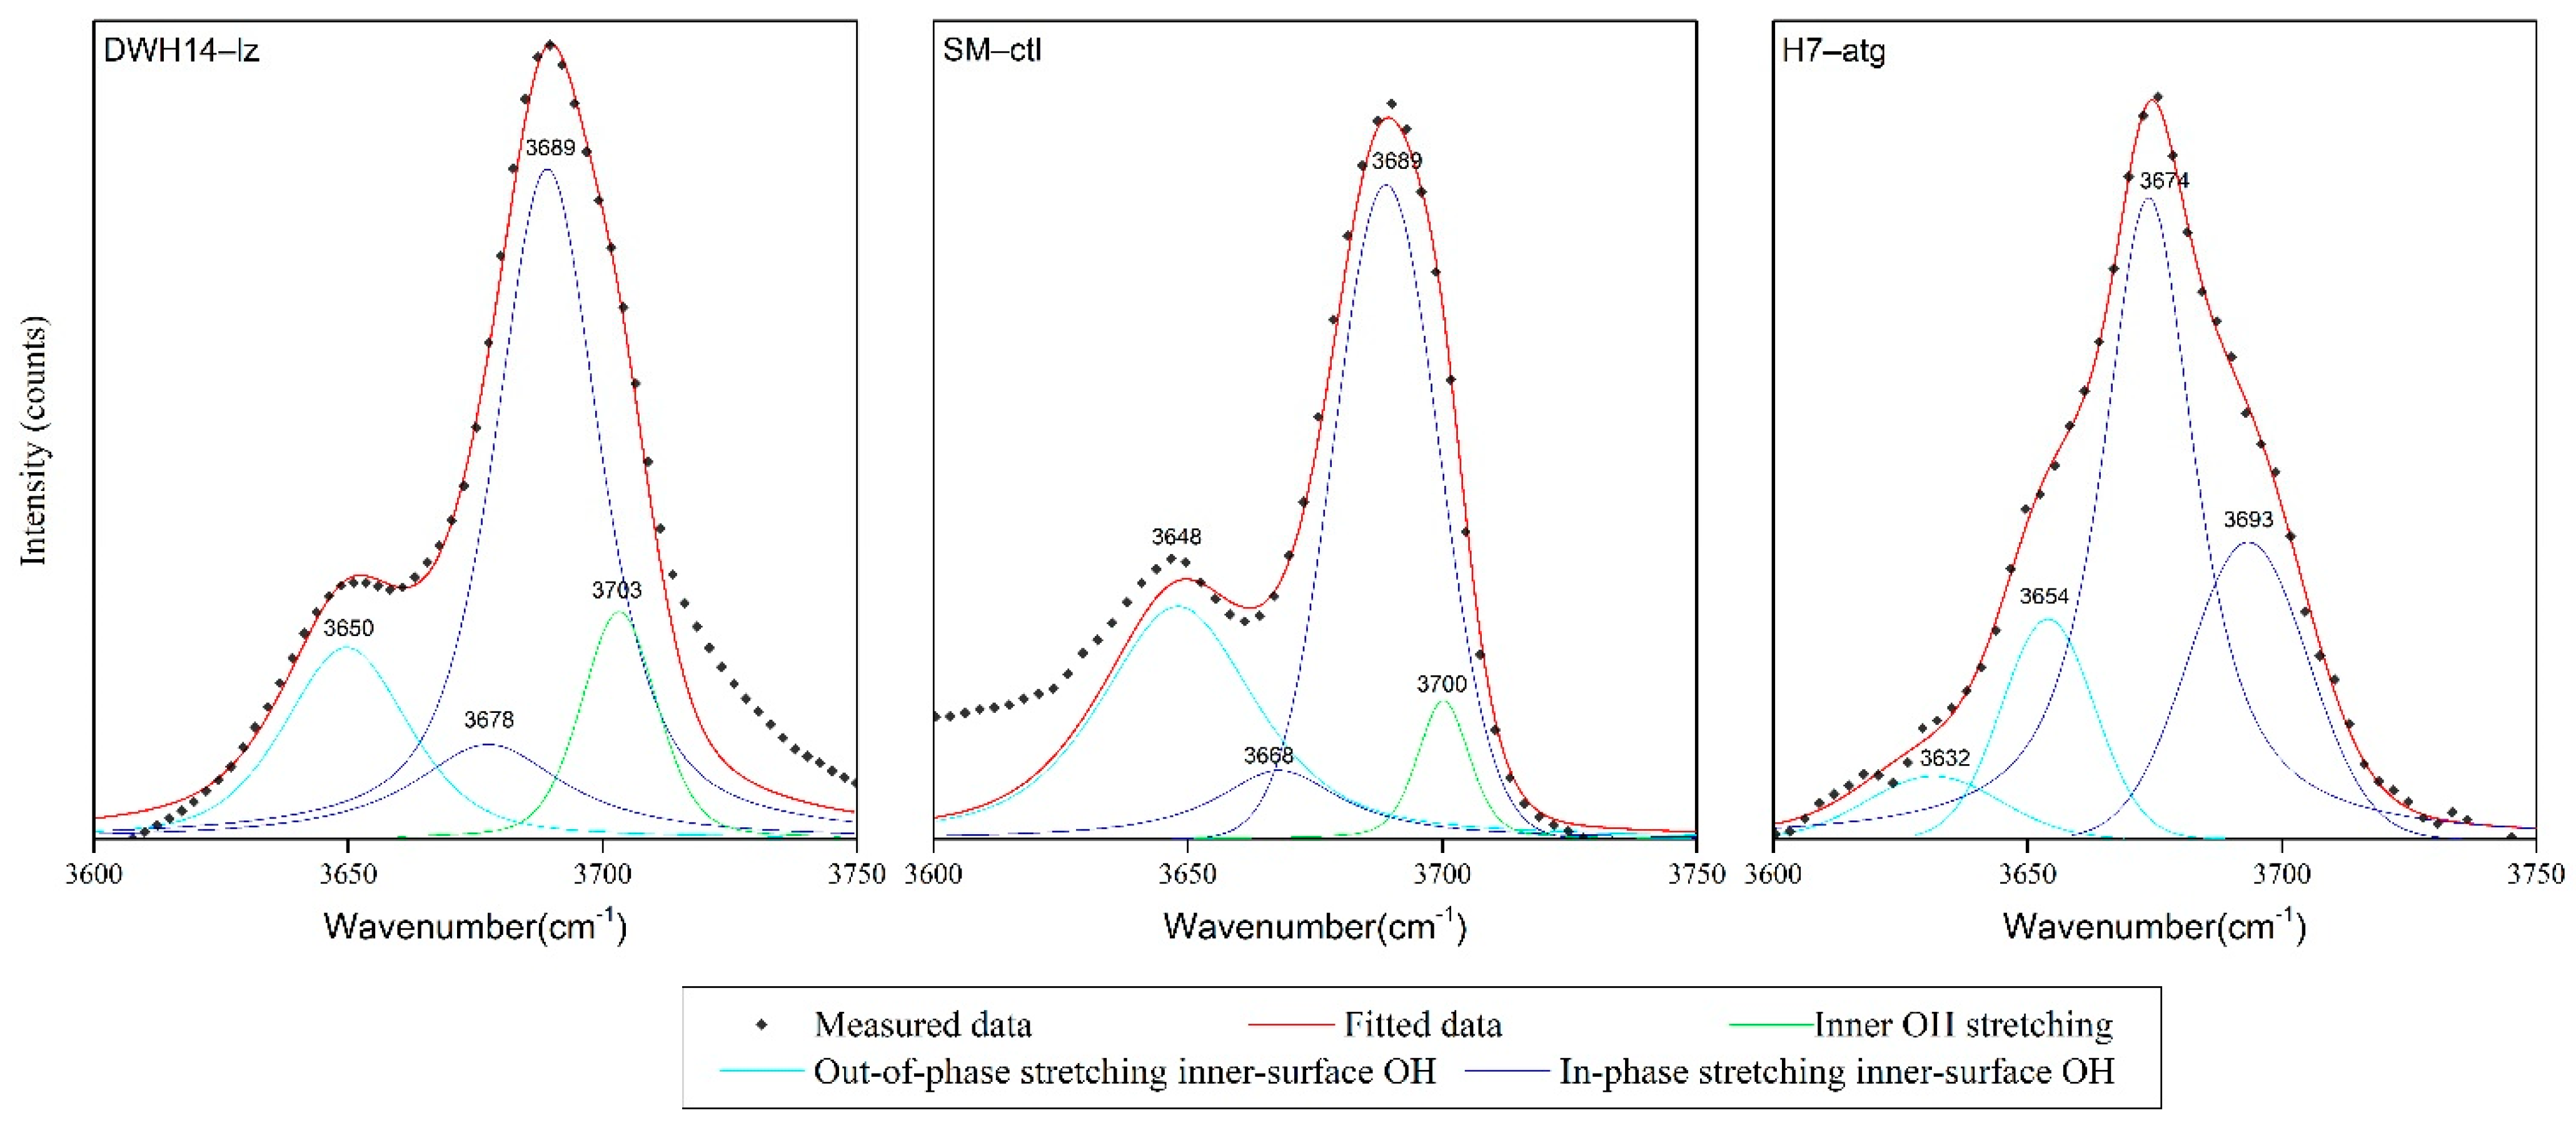
| Outer OH sloping stretching vibration | 3650 | 3647 | 3649 | 3648 | 3648 | 3632 3654 | 3632 3653 |
| Outer OH vertical stretching vibration | 3678 | 3665w | 3670w | 3667 | 3668 | 3674 | 3674 |
| 3689 | 3688 | 3688 | 3688 | 3689 | 3693 | 3696 | |
| Inner OH stretching vibration | 3703 | 3704 | 3705 | 3705 | 3700 |
| J. L. Post [18] | Baron [19] | DWH14-lz | ZH41-lz | Z3-lz | SZ17-lz | SM-ctl | H7-atg | H11-atg |
|---|---|---|---|---|---|---|---|---|
| 4010 | 4001 | 4009 | 4009 | 4009 | 4009 | 4009 | 4009 | 4009 |
| 4044 | 4043 | |||||||
| 4076 | 4077 | 4078 | 4079 | 4079 | ||||
| 4123 | 4121 | 4109 | 4109 | 4109 | 4108 | 4106 | 4105 | 4105 |
| 4196 | 4199 | 4218 | 4218 | 4218 | 4218 | 4201 | 4197 | 4197 |
| 4279 | 4274 | 4281 | 4281 | 4281 | 4281 | 4279 | 4279 | 4279 |
| 4303 | 4307 | 4301 | 4301 | 4301 | 4301 | 4304 | 4302 | 4301 |
| 4315 | 4315 | 4315 | ||||||
| 4401 | 4409 | 4404 | 4404 | 4404 | 4404 | 4401 | 4400 | 4400 |
| Outer OH | DWH14-lz | ZH41-lz | Z3-lz | SZ17-lz | SM-ctl | H7-atg | H11-atg |
|---|---|---|---|---|---|---|---|
| νOH-s | 7170 | 7168 | 7170 | 7167 | 7170 | 7168 | 7167 |
| νOH-s + νOH-v | 7204 | 7203 | 7204 | 7204 | 7204 | 7204 | 7203 |
| νOH-v | 7234 | 7233 | 7233 | 7231 | 7233 | 7231 | 7230 |
| νOH-v | 7241 | 7241 | 7242 | 7241 | 7243 | 7243 | 7241 |
| Lizardite | Chrysotile | Antigorite | ||||||||||||
|---|---|---|---|---|---|---|---|---|---|---|---|---|---|---|
| Measured Peak | Fundamental Peaks | Theoretical Peak | Δ | Measured Peak | Fundamental Peaks | Theoretical Peak | Δ | Measured Peak | Fundamental Peaks | Theoretical Peak | Δ | |||
| DWH14-lz | 4281 | 3650 + 630 | 4280 | 1 | SM-ctl | 4279 | 3648 + 629 | 4277 | 2 | H7-atg | 4279 | 3643 * + 645 | 4288 | 9 |
| 4301 | 3689 + 609 | 4298 | 3 | 4304 | 3689 + 609 | 4298 | 6 | 4302 | 3674 + 621 | 4295 | 7 | |||
| ZH41-lz | 4281 | 3647 + 630 | 4277 | 4 | 4315 | 3674 + 645 | 4319 | 4 | ||||||
| 4301 | 3688 + 609 | 4297 | 4 | H11-atg | 4279 | 3643 * + 644 | 4288 | 9 | ||||||
| Z3-lz | 4281 | 3649 + 629 | 4278 | 3 | 4301 | 3674 + 619 | 4295 | 6 | ||||||
| 4301 | 3688 + 609 | 4297 | 4 | 4315 | 3674 + 644 | 4319 | 4 | |||||||
| SZ17-lz | 4281 | 3648 + 630 | 4278 | 3 | ||||||||||
| 4301 | 3688 + 610 | 4298 | 3 | |||||||||||
| Lizardite | Chrysotile | Antigorite | |||||||||
|---|---|---|---|---|---|---|---|---|---|---|---|
| Measured Peak | Fundamental Peaks | Factor | Measured peak | Fundamental Peaks | Factor | Measured Peak | Fundamental Peaks | Factor | |||
| DWH14-lz | 7170 | 3650 | 1.9644 | SM-ctl | 7170 | 3648 | 1.9655 | H7-atg | 7168 | 3643 * | 1.9676 |
| 7204 | (3650 + 3689)/2 | 1.9632 | 7204 | (3648 + 3689)/2 | 1.9637 | 7204 | (3643 * + 3693)/2 | 1.9640 | |||
| 7234 | (3678 + 3689)/2 | 1.9639 | 7233 | (3668 + 3689)/2 | 1.9663 | 7231 | (3674 + 3693)/2 | 1.9631 | |||
| 7241 | 3689 | 1.9629 | 7243 | 3689 | 1.9634 | 7243 | 3693 | 1.9613 | |||
| ZH41-lz | 7168 | 3647 | 1.9655 | H11-atg | 7167 | 3643 * | 1.9673 | ||||
| 7203 | (3647 + 3688)/2 | 1.9640 | 7203 | (3643 * + 3696)/2 | 1.9629 | ||||||
| 7233 | (3665 + 3688)/2 | 1.9674 | 7230 | (3674 + 3696)/2 | 1.9673 | ||||||
| 7241 | 3688 | 1.9634 | 7241 | 3696 | 1.9673 | ||||||
| Z3-lz | 7170 | 3649 | 1.9649 | ||||||||
| 7204 | (3649 + 3688)/2 | 1.9637 | |||||||||
| 7233 | (3670 + 3688)/2 | 1.9660 | |||||||||
| 7242 | 3688 | 1.9637 | |||||||||
| SZ17-lz | 7167 | 3648 | 1.9646 | ||||||||
| 7204 | (3648 + 3688)/2 | 1.9640 | |||||||||
| 7231 | (3667 + 3688)/2 | 1.9663 | |||||||||
| 7241 | 3688 | 1.9634 | |||||||||
| Average | Average | Average | |||||||||
| 1.9645 | 1.9647 | 1.9651 | |||||||||
Publisher’s Note: MDPI stays neutral with regard to jurisdictional claims in published maps and institutional affiliations. |
© 2021 by the authors. Licensee MDPI, Basel, Switzerland. This article is an open access article distributed under the terms and conditions of the Creative Commons Attribution (CC BY) license (https://creativecommons.org/licenses/by/4.0/).
Share and Cite
Wu, S.; He, M.; Yang, M.; Zhang, B.; Wang, F.; Li, Q. Near-Infrared Spectroscopy Study of Serpentine Minerals and Assignment of the OH Group. Crystals 2021, 11, 1130. https://doi.org/10.3390/cryst11091130
Wu S, He M, Yang M, Zhang B, Wang F, Li Q. Near-Infrared Spectroscopy Study of Serpentine Minerals and Assignment of the OH Group. Crystals. 2021; 11(9):1130. https://doi.org/10.3390/cryst11091130
Chicago/Turabian StyleWu, Shaokun, Mingyue He, Mei Yang, Biyao Zhang, Feng Wang, and Qianzhi Li. 2021. "Near-Infrared Spectroscopy Study of Serpentine Minerals and Assignment of the OH Group" Crystals 11, no. 9: 1130. https://doi.org/10.3390/cryst11091130
APA StyleWu, S., He, M., Yang, M., Zhang, B., Wang, F., & Li, Q. (2021). Near-Infrared Spectroscopy Study of Serpentine Minerals and Assignment of the OH Group. Crystals, 11(9), 1130. https://doi.org/10.3390/cryst11091130