1. Introduction
Quartz, also called ‘rock crystal’, is widely distributed on the earth and has broad application in many industries. High-quality quartz with various colors can be regarded as a gemstone and has a high share on the jewelry market. In addition, quartz can also be used as piezoelectric material and optical material, which require high clarity. Different types and amounts of impurities are common in natural quartz. Therefore, clear quartz is often synthesized by hydrothermal synthetic technique in the industry. This technique simulates the crystallization process of natural quartz in the hydrothermal fluid. It can be dated back to the 19th century and has been continuously improved ever since. The market demand also accelerated the development of this synthetic technique [
1,
2,
3,
4,
5,
6,
7,
8,
9,
10]. Nowadays, different kinds of colorless or various color quartz can be synthesized by the hydrothermal method.
In recent years, regrown quartz crystal druse has sprung up and become popular on the Chinese jewelry market, which is produced by regrowing a layer of synthetic quartz on the surface of natural quartz. Due to similar appearance and inclusion characteristics, it has brought some difficulties to laboratory identification, and investigation of its properties can help understand the regrowth process. Previous studies mainly focused on the surface topography, inclusions feature and optical property of such regrown quartz crystals [
11,
12]. However, the microstructure and spectral characteristics of its different sections (natural section and synthetic section) still need to be investigated, which can reveal more information on the structure, component, and formation condition during the regrowth process. In this study, regrown quartz crystal samples were collected from the Donghai crystal market (Donghai, Jiangsu province, China), which is the largest trade center of rock crystal (quartz) in China. Combined with the survey of synthetic quartz factories, microstructure and spectral characteristics were analyzed and their genesis was discussed. Three dimensional (3D) computed tomography system and its artificial intelligence recognition function of visual imaging were used to display the 3D image of the microstructure characteristics of regrown quartz crystals. Spectral characteristics were obtained by infrared spectroscopy. Related results can provide more scientific evidence not only for the regrown quartz crystal identification but also the discussion on the crystal nucleation, growth, and dissolution process of hydrothermally synthetic gemstones on the natural ones.
2. Materials and Methods
Two typical regrown quartz crystal druses collected from Donghai crystal market (Donghai, Jiangsu Province, China) (
Figure 1). Each druse sample had 10~20 single crystals and six single crystal samples (Q-1-1~Q-1-3, Q-2-1~Q-2-3) were separated from regrown quartz crystal druses for observation and measurements.
As to the basic gemological properties, the refractive index (RI) of polished samples was measured with a refractometer using diiodimethane as refractive oil. The specific gravity (SG) was obtained by the hydrostatic weighing method. The hardness was determined by the Mohs hardness tester. Their fluorescence was observed by ultraviolet light with main wavelengths of 365 and 254 nm. Chemical composition was analyzed by Thermo Scientific ARL Quant’X energy dispersive X-ray Fluorescence Spectrometer with an operating voltage of 16 kV and a working current of 1.98 mA. Internal inclusion features were observed under ZEISS Stemi 2000-C microscope with the max magnification of 50×.
Microstructure of regrown quartz crystal samples was observed by three dimensional computed tomography system using Nikon XTH225ST, with 127kV voltage and 100 μA electric current. The 3D images were obtained by VG-Studio Max 3.0 visual imaging software, which can realize artificial intelligence recognition of different microstructure characteristics. Fourier-transform infrared (FTIR) spectra were measured by Thermo Scientific Nicolet is 50 spectrometer with Pike Technologies Beam Condenser™ in the range of 1000–5000 cm−1, with the uncertainty of 2 cm−1. In order to get more accurate spectra of different sections, single crystal samples were cut into slices with the thickness of 5 mm and polished.
3. Results
3.1. Basic Gemological Properties
The investigated samples are transparent, colorless, or with green tint in some zones. The refractive index ranges from 1.54 to 1.55. The specific gravity values vary between 2.62 and 2.65. The hardness is 7 (
Table 1). All investigated samples mainly consist of SiO
2 and other trace elements include Al, Mg, Na, K, Ca, etc. (
Table 2), which also exist in natural quartz. All samples are inert to longwave and shortwave UV radiation. Under the observation of a gem microscope, the regrown quartz crystal also has gas-fluid inclusions which arrange in irregular curved planes extending in various directions, as the internal features of natural quartz (
Figure 2). Therefore, the basic gemological properties of regrown quartz crystal show no obvious difference from natural quartz.
3.2. Microstructure Characteristics
The 3D images of different sections of regrown quartz crystal show different microstructure characteristics, which were obtained by the three dimensional computed tomography system and the intelligence recognition function of visual imaging software. From the side view of the 3D image (
Figure 3a), there are many micron- to millimeter-sized pores in the natural section, with the volume from 8 × 10
5 μm
3 to 0.17 mm
3. However, the regrown section has much lower porosity and rare pores in it, in which the pore volume is under 6 × 10
4 μm
3. From the top view of the 3D image (
Figure 3b), most pores in investigated samples are distributed along or close to the interface of the two sections. These pores in the regrown quartz crystal can be vacuum or filled with gas, fluid, or gas-liquid phases.
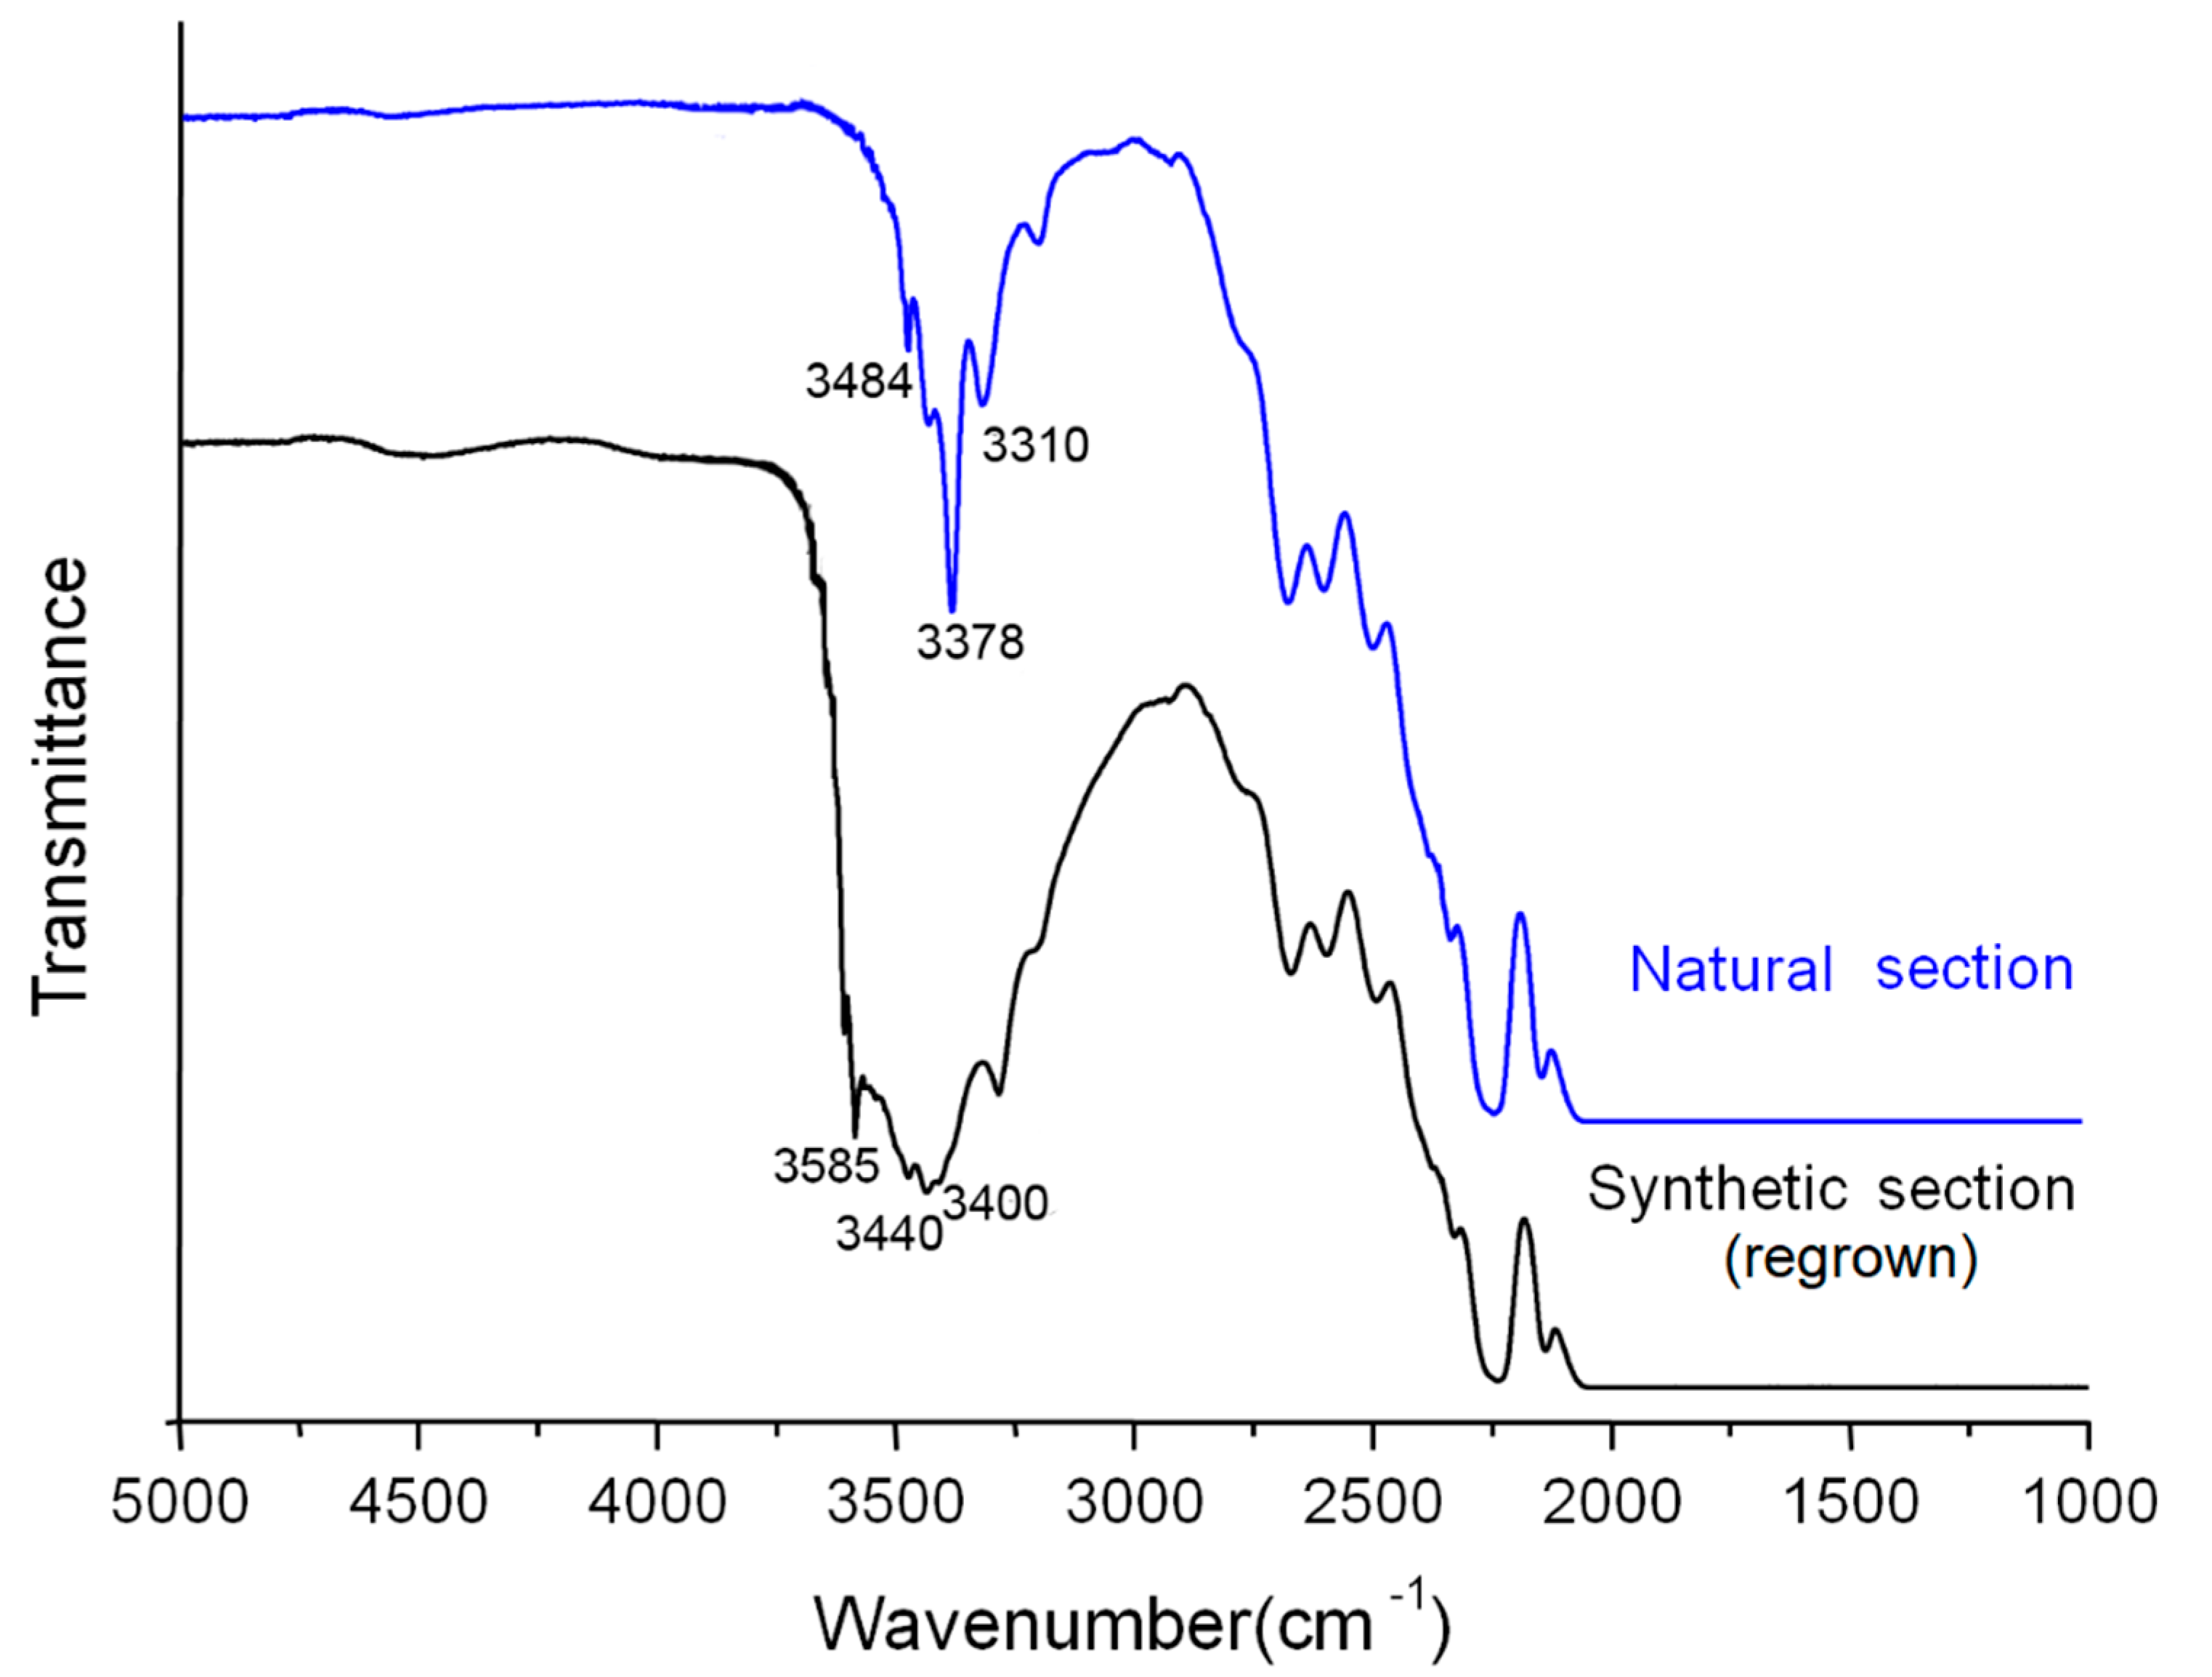
3.3. Infrared Spectral Characteristics
The distinction on infrared spectra between the natural section and the synthetic section mainly shows in the regions from 3300 to 3600 cm
−1. The natural section shows absorption peaks at 3310, 3378, and 3484 cm
−1, while the synthetic section displays obvious absorption at 3400, 3440, and 3585 cm
−1 (
Figure 4).
Previous studies have shown that the absorption peaks at 3310, 3378, and 3484 cm
−1 in the natural quartz are associated with hydroxyl group (OH) in the structure. For synthetic quartz, the different existence state of hydroxyl group is influenced by the alkali cations (mainly Na
+, K
+, Li
+) of growth solution, which can result in the absorption at 3400, 3440, and 3585 cm
−1 [
13,
14,
15,
16,
17,
18,
19,
20,
21].
4. Discussion
The synthetic layer of regrown quartz crystal consists of α-quartz, while quartz can transfer from α-quartz to β-quartz at 573 °C. Therefore, the crystallization temperature of the synthetic regrown quartz layer is usually under 573 °C [
2,
3,
4,
22,
23,
24,
25]. The growing process of hydrothermally synthetic quartz is accomplished in an autoclave. Melted quartz or broken pieces of natural vein quartz as raw material for SiO
2 source and alkaline solution (containing K
+, Na
+, Li
+, etc.) as mineralizer are used during the process. The interior of autoclave can be divided into two parts which are raw material dissolution zone and the crystallization zone, with the temperature from 300 °C to 380 °C, the temperature of the dissolution zone is relatively higher) and the pressure from 1.1~1.6 × 10
8 Pa [
2,
3,
4,
5,
6,
7].
Due to the closed environment and the controlled conditions in the autoclave, the forming environment of synthetic quartz was relatively uniform and stable, which can explain its fewer defects and lower porosity. However, natural quartz formed in an open natural environment so that the temperature, pressure, composition of ore-forming fluid and other factors were in constant change, which resulted in the internal features of gas-liquid inclusion, mineral inclusion, negative crystal, fracture, colored tape, etc. For the regrown quartz crystal, the synthetic quartz layer grew around the surface of natural quartz. Hence, it has similar inclusions with those in the natural quartz under a microscope, making it easy to be confused. Nevertheless, the difference on the defect amount and porosity of the natural section and the synthetic section of regrown quartz crystal, which are caused by the different forming environment, can be visually displayed in the 3D image of microstructure characteristics. There are many micron- to millimeter-sized pores in the natural section or on the interface of the natural and synthetic section, while the porosity of the synthetic section is much lower.
The infrared spectra of the two sections of regrown quartz crystal show a significant distinction on absorption peaks in the 3300–3600 cm−1 range, which are mainly related to the OH group which comes from the ore-forming fluid or solution. Natural quartz and synthetic quartz differ in the temperature and the component of ore-forming fluid during crystallization. The existence state of OH groups influenced by alkali cations (e.g., K+, Na+, Li+) of growth solution in the synthetic quartz section leads to different infrared absorption characteristics from those in the natural quartz section. Therefore, it can be inferred that the difference in the forming condition has an influence on the existence state of OH groups in the structure of SiO2, which leads to the different absorption characteristics of the natural and synthetic sections of regrown quartz crystals.
5. Conclusions
Regrown quartz crystals on the Chinese jewelry market consist of the natural section and the synthetic section by hydrothermal synthetic technique. They have similar gemological properties with those of natural quartz, which has brought challenges to gem identification and also new questions to scientific research. However, they display different microstructure and spectral characteristics between the two sections in the regrown quartz crystal. The natural section has a higher porosity and there are also many micron- to millimeter-sized pores on the interface of the two sections. The differences on the absorption peaks in the 3300–3600 cm−1 range of infrared spectra are mainly attributed to the existence state of OH groups.
Microstructure and spectral characteristics indicate different forming conditions between natural quartz and synthetic quartz. For regrown quartz crystals, the relatively stable forming environment during synthetic process leads to a lower porosity and the different forming solution can result in the change of the existence state of OH groups compared with natural quartz.
Investigation results in this study can provide reference not only for regrown quartz crystals identification but also the discussion on the crystal nucleation, growth, and dissolution process of hydrothermally synthetic gemstone on the natural ones. In the future, with the upgrading and the development of regrowth techniques, it is foreseeable that more regrown gemstones with higher quality will emerge on the jewelry market and deserve further study.
Author Contributions
Investigation, D.Z., H.D. and J.L.; writing—original draft preparation, D.Z.; writing—review and editing, D.Z. and T.L.; visualization, D.Z. and S.C.; supervision, T.L., Z.S. and J.Z.; project administration, D.Z.; funding acquisition, D.Z. and T.L. All authors have read and agreed to the published version of the manuscript.
Funding
This research was funded by the National Science Foundation of China (42073008) and by NGTC Scientific Research Fund (NGTC20200903).
Data Availability Statement
Data available on request due to restrictions privacy. The data provided in this study can be obtained at the request of the corresponding author. As the data needs further research, the data is currently not publicly available.
Acknowledgments
Thanks are given to Qinfang Fang of China University of Geosciences (Beijing) for their assistance in the microstructure measurement. We are also grateful to all reviewers and editors for their constructive and helpful comments, which significantly improved the manuscript.
Conflicts of Interest
The authors declare no conflict of interest.
References
- Wooster, N.; Wooster, W.A. Preparation of synthetic quartz. Nature 1946, 157, 297. [Google Scholar] [CrossRef]
- Heaney, P.J.; Prewitt, C.T.; Gibbs, G.V. Silica: Physical Behavior, Geochemistry and Materials Applications; Mineralogical Society of America: Blacksburg, VA, USA, 1994. [Google Scholar]
- Zhong, W.Z. Synthetic Quartz; Science Press: Beijing, China, 1983. [Google Scholar]
- He, X.M.; Shen, C.Q. Artificial Synthesis Technology of Gemstones, 2nd ed.; Chemical Industrial Press: Beijing, China, 2010. [Google Scholar]
- Balitsky, V.S.; Lu, T.J.; Rossman, G.R.; Makhina, I.B.; Marin, A.A.; Shigley, J.E.; Elen, S.; Dorogovin, B.A. Russian Synthetic Ametrine. Gems Gemol. 1999, 35, 122–134. [Google Scholar] [CrossRef][Green Version]
- Balitsky, V.S.; Makhina, I.B.; Marina, E.A.; Rossman, G.R.; Lu, T.J.; Shigley, J.E. Growth and characteristics of some new varieties of coloured quartz single crystals. High Press. Res. Int. J. 2001, 20, 219–227. [Google Scholar] [CrossRef]
- Balitsky, V.S.; Kurashige, M.; Balitskaya, L.V.; Twasaki, H. Kinetics of dissolution and state of silica in hydrothermal solutions of Na2CO3 and NaOH, and accelerated method for the quartz crystal characterization against growth rate. J. Cryst. Growth 2002, 237–239, 828–832. [Google Scholar] [CrossRef]
- Ng-Pooresatien, N. Synthetic rock crystal quartz bangle with unusual inclusions. Gems Gemol. 2015, 51, 439–440. [Google Scholar]
- Skalwold, E.A. Micro-world: Synthetic quartz: A designer inclusion specimen. Gems Gemol. 2016, 52, 425–426. [Google Scholar]
- Clifford, J.H.; Klipov, V.A. A marriage of science and art: Creating quartz specimens in the laboratory. Rocks Miner. 2015, 90, 379–385. [Google Scholar] [CrossRef]
- Dai, H.R.; Zhou, D.Y.; Song, Z.H.; Su, J.; Li, H.B.; Lu, T.J.; Ma, Y.W. Synthetic rock crystal clusters on the Chinese Market. J. Gemmol. 2020, 37, 354–356. [Google Scholar] [CrossRef]
- Xie, P.H. The discrimination of surface accreting compound crystal druse from natural crystal druse. Yunnan Geol. 2008, 27, 434–436. [Google Scholar]
- Wood, D.L. Infrared absorption of defects in quartz. J. Phys. Chem. Solids 1960, 13, 326–336. [Google Scholar] [CrossRef]
- Kats, A. Hydrogen in alpha quartz. Philips Res. Rep. 1962, 17, 133–195; discussion 201–279. [Google Scholar]
- Dodd, D.M.; Fraser, D.B. The 3000–3900 cm−1 absorption bands and anelasticity in crystalline α-quartz. J. Phys. Chem. Solids 1965, 26, 673–686. [Google Scholar] [CrossRef]
- Staats, P.A.; Kopp, O.C. Studies on the origin of the 3400 cm−1 region infrared bands of synthetic and natural α-quartz. J. Phys. Chem. Solids 1974, 35, 1029–1033. [Google Scholar] [CrossRef]
- Krefft, G.B. Effects of high-temperatrue electrolysis on the coloration characteristics and OH absorption bands in alpha quartz. Radiat. Eff. 1975, 26, 249–259. [Google Scholar] [CrossRef]
- Aines, R.D.; Rossman, G.R. Water in minerals? A peak in the infrared. J. Geophys. Res. Solid Earth 1984, 89, 4059–4071. [Google Scholar] [CrossRef]
- Aines, R.D.; Kirby, S.H.; Rossman, G.R. Hydrogen speciation in synthetic quartz. Phys. Chem. Miner. 1984, 11, 204–212. [Google Scholar] [CrossRef]
- Cao, P.; Yu, L.; Zu, E.D. Study on the near infrared spectrum of natural crystals and synthetic crystals by hydrothermal method. J. Light Scatt. 2017, 29, 177–180. [Google Scholar]
- Stalder, R.; Potrafke, A.; Billström, K. OH defects in quartz as monitor for igneous, metamorphic, and sedimentary processes. Am. Mineral. 2017, 102, 1832–1842. [Google Scholar] [CrossRef]
- Moarefvand, A.; Fauconnier, J.; Gasc, J.; Deldicque, D.; Labrousse, L.; Schubnel, A. Experimental study of the effect of stress on α→β quartz transformation at lower continental crust pressure and temperature. Geophys. Res. Abstr. 2019, 21, 1. [Google Scholar]
- Hu, Q.Y.; Shu, J.F.; Yang, W.G.; Park, C.; Chen, M.W.; Fujita, T.; Mao, H.K.; Sheng, H.W. Stability limits and transformation pathways of α-quartz under high pressure. Phys. Rev. B 2017, 95, 104–112. [Google Scholar] [CrossRef]
- Karunadasa, K.S.P.; Manoratne, C.H.; Pitawala, H.M.T.G.A.; Rajapakse, R.M.G. The composition, unit cell parameters and microstructure of quartz during phase transformation from α to β as examined by in-situ high-temperature X-ray powder diffraction. J. Phys. Chem. Solids 2018, 117, 131–138. [Google Scholar] [CrossRef]
- Lawn, B.R.; Marshall, D.B.; Raj, R.; Hirth, G.; Page, T.F.; Yeomans, J. Precipitous weakening of quartz at the α–β phase inversion. J. Am. Ceram. Soc. 2021, 104, 23–26. [Google Scholar] [CrossRef]
| Publisher’s Note: MDPI stays neutral with regard to jurisdictional claims in published maps and institutional affiliations. |
© 2021 by the authors. Licensee MDPI, Basel, Switzerland. This article is an open access article distributed under the terms and conditions of the Creative Commons Attribution (CC BY) license (https://creativecommons.org/licenses/by/4.0/).


 ,
, 


