
Determination of the Metastable Zone Width and Nucleation Parameters of Succinic Acid for Electrochemically Induced Crystallization


Abstract
:1. Introduction
2. Theory
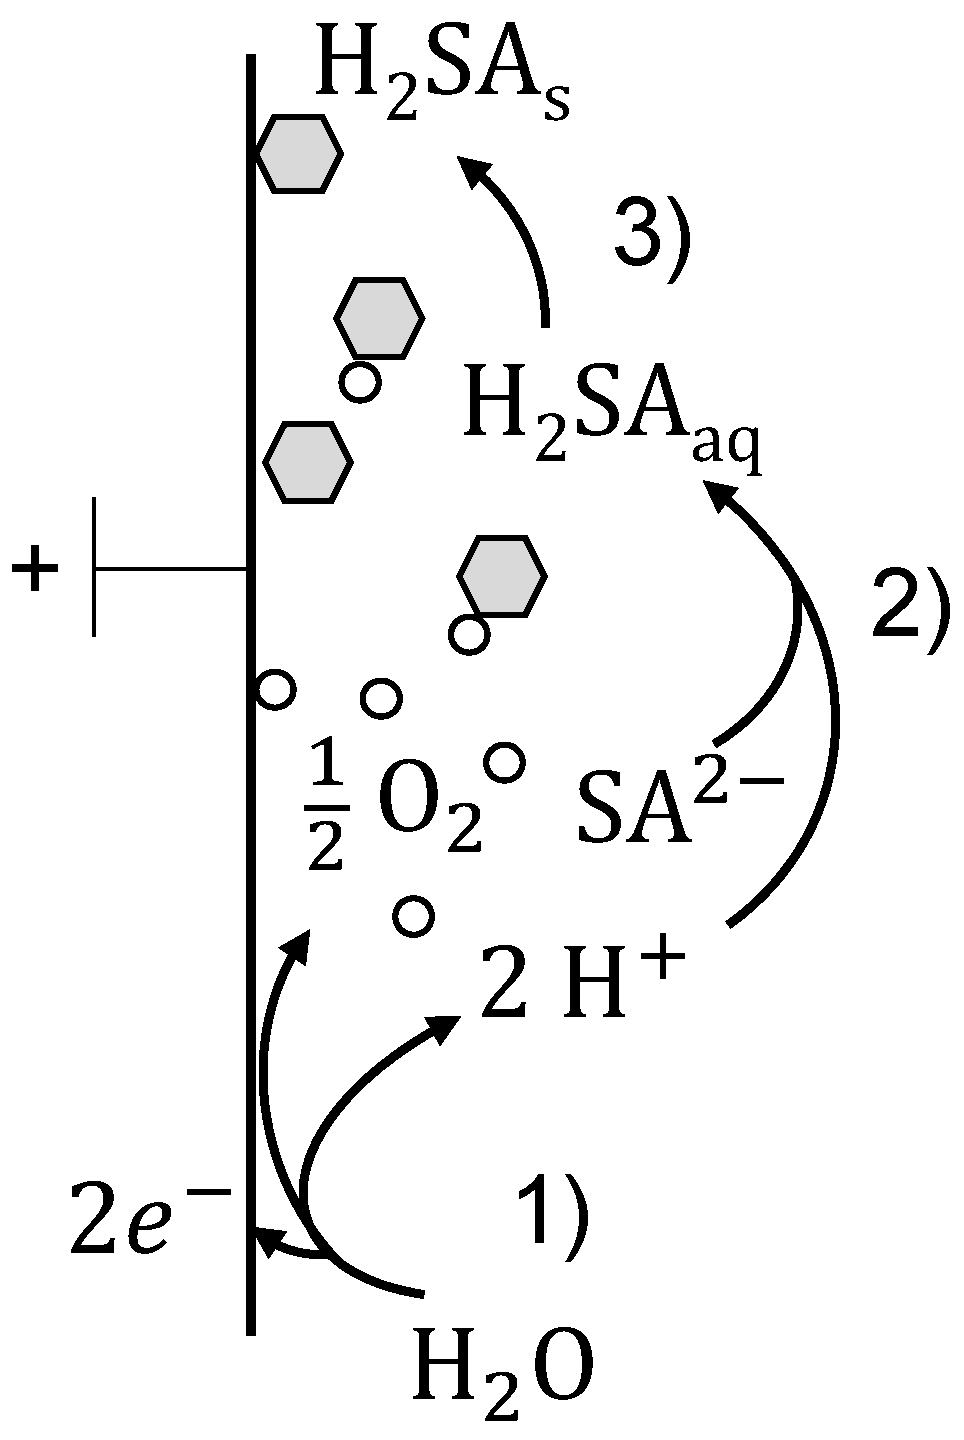
2.1. Electrochemically Induced pH-Shift Crystallization
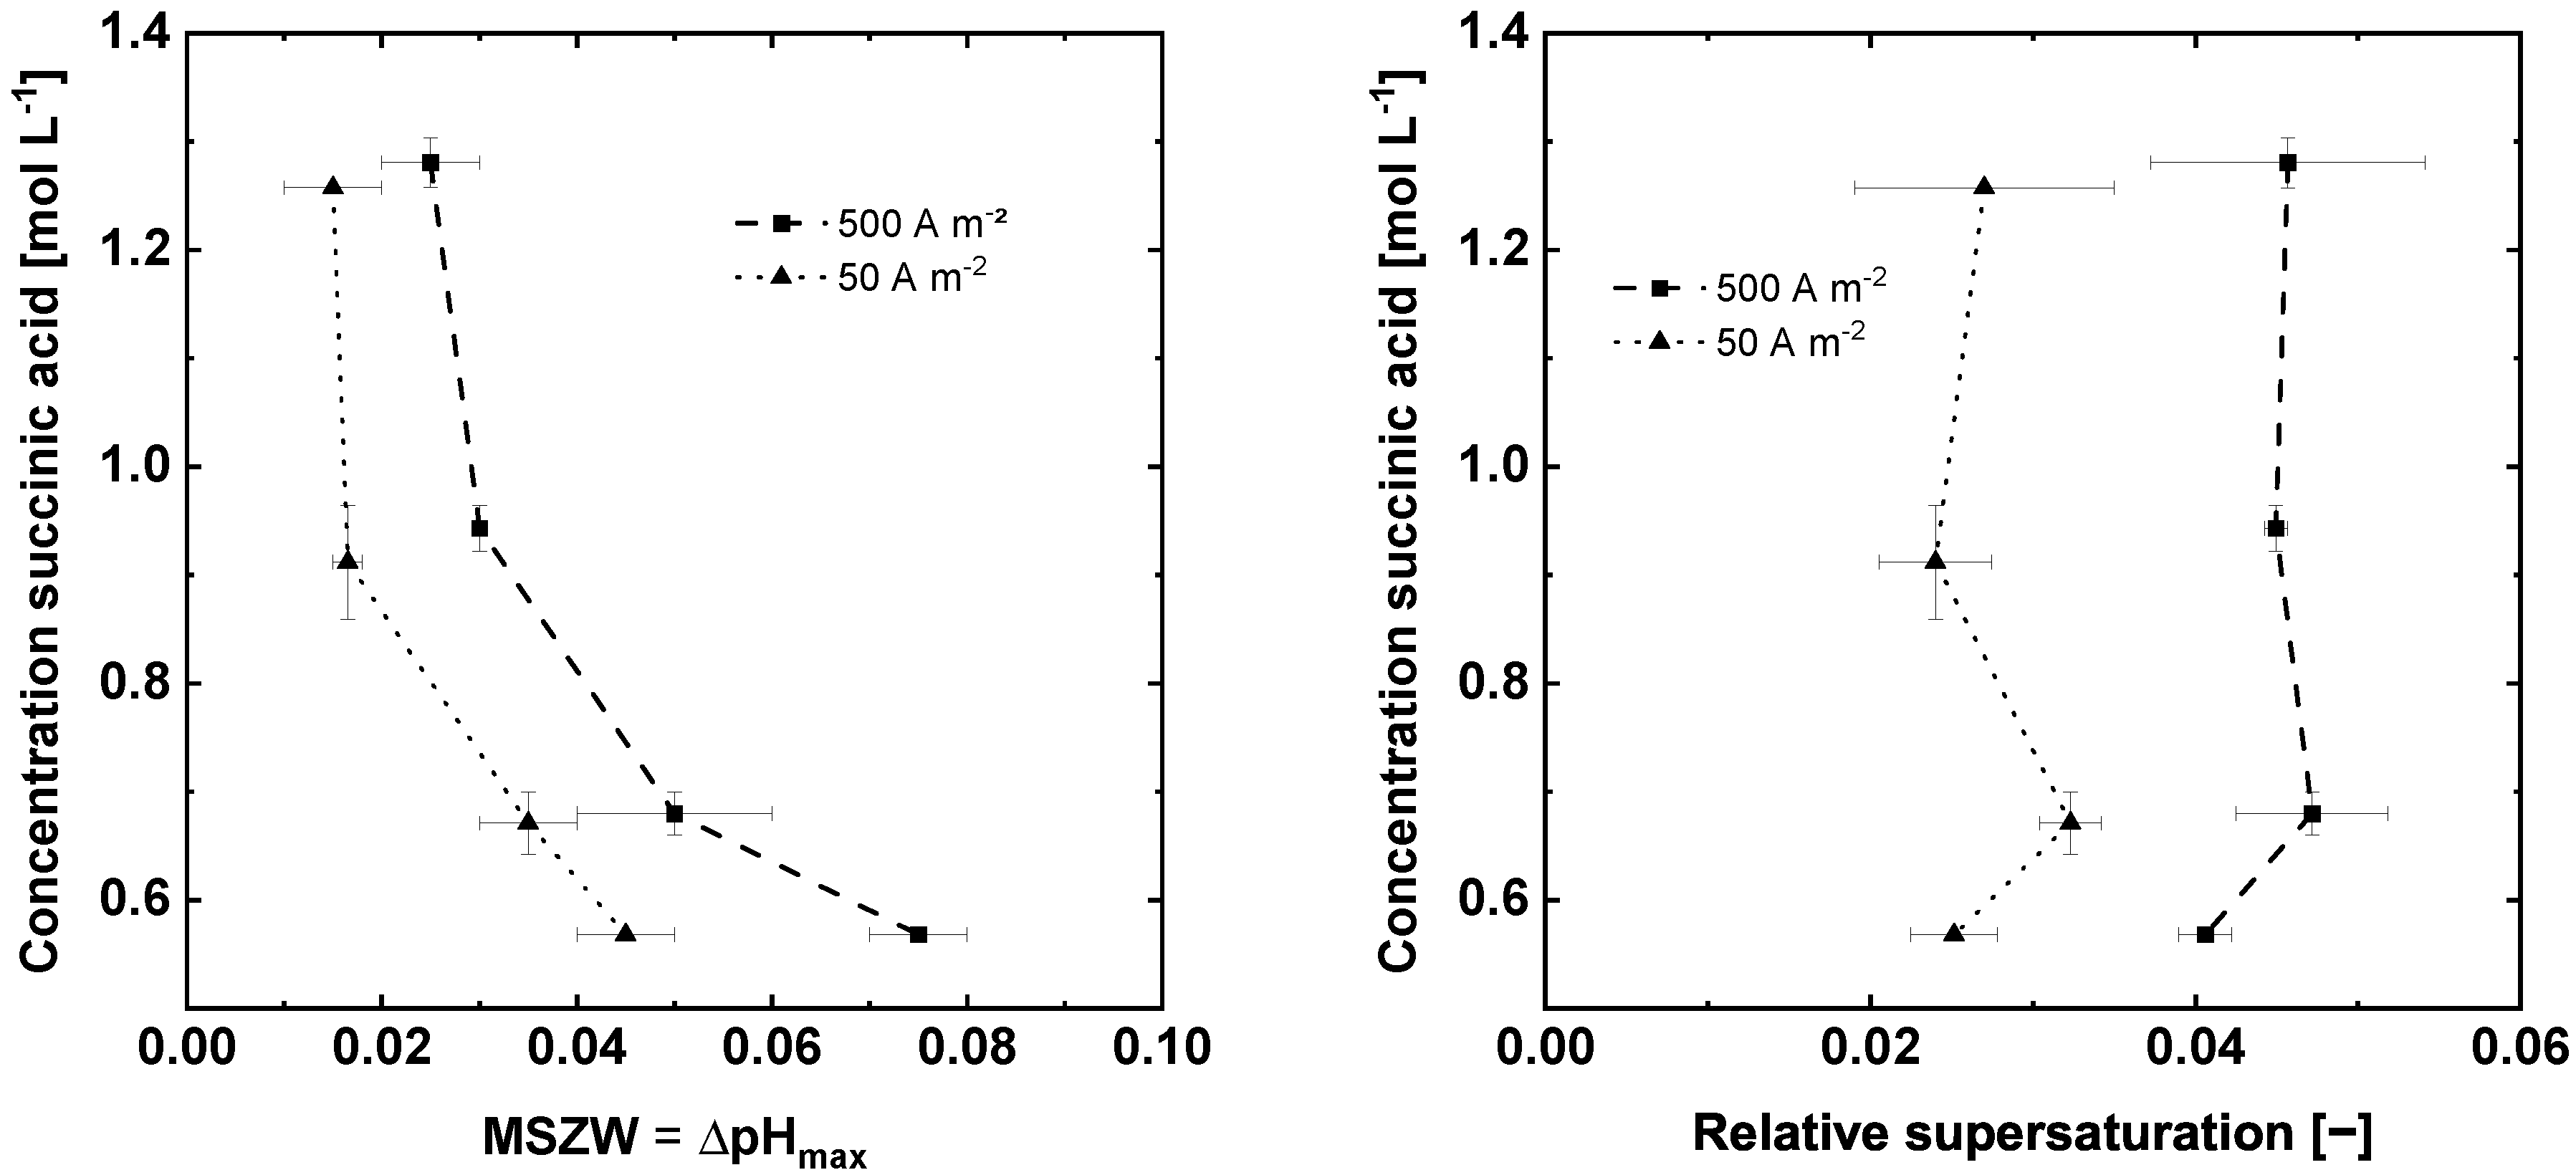
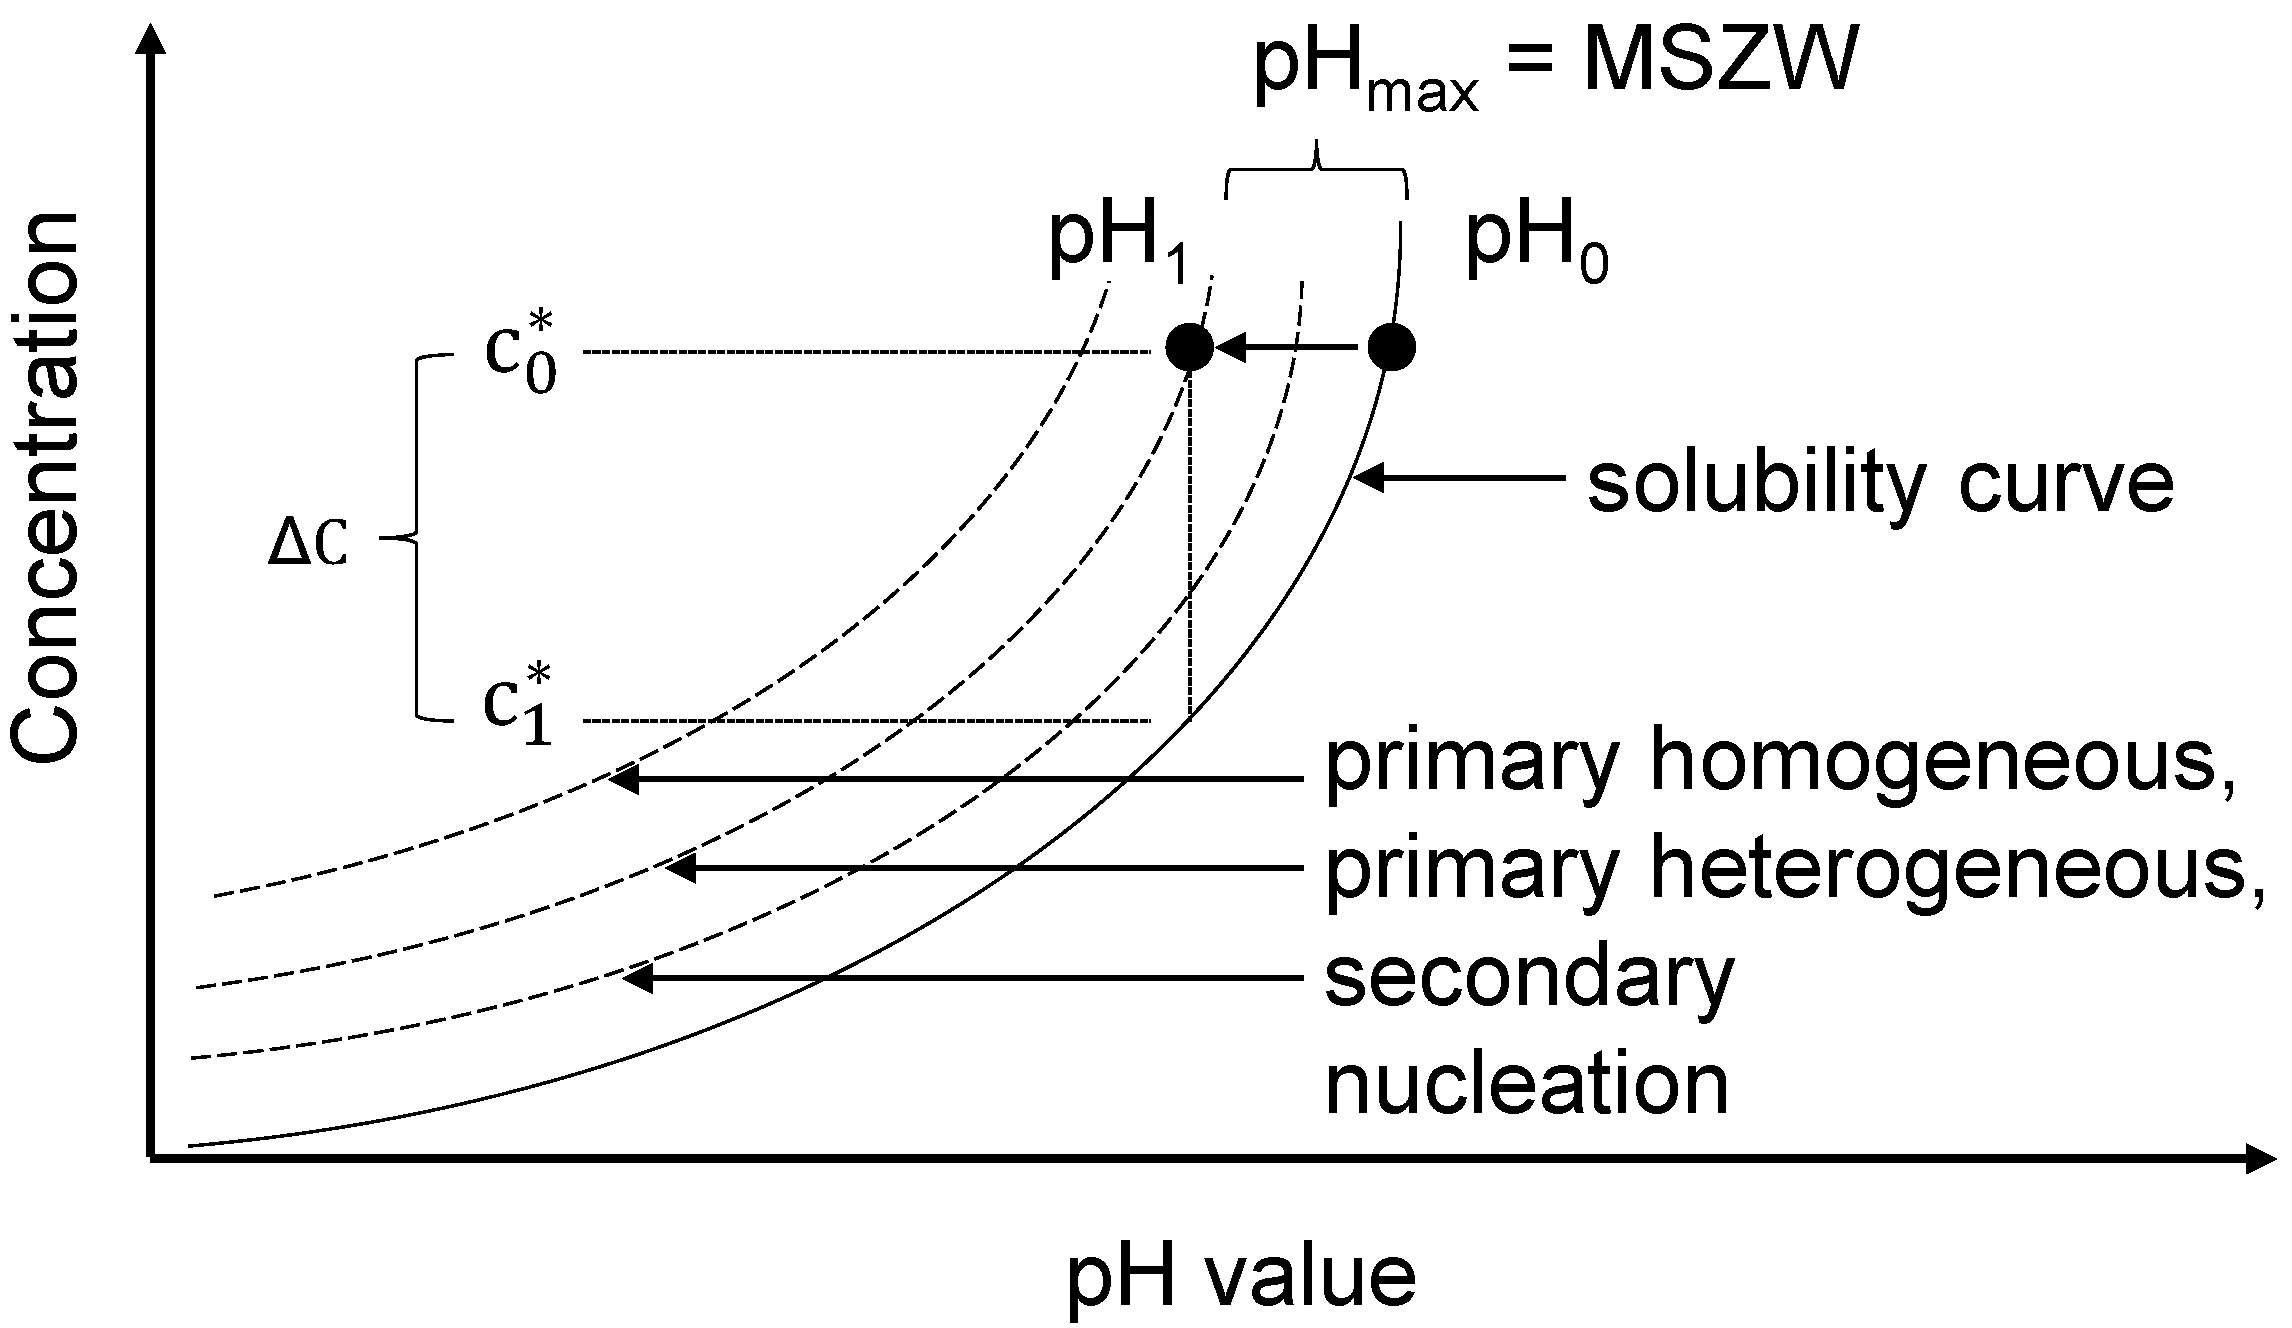
2.2. Metastable Zone Width and Determination of Nucleation Kinetics
3. Materials and Methods
3.1. Chemicals
3.2. Analytical Procedure
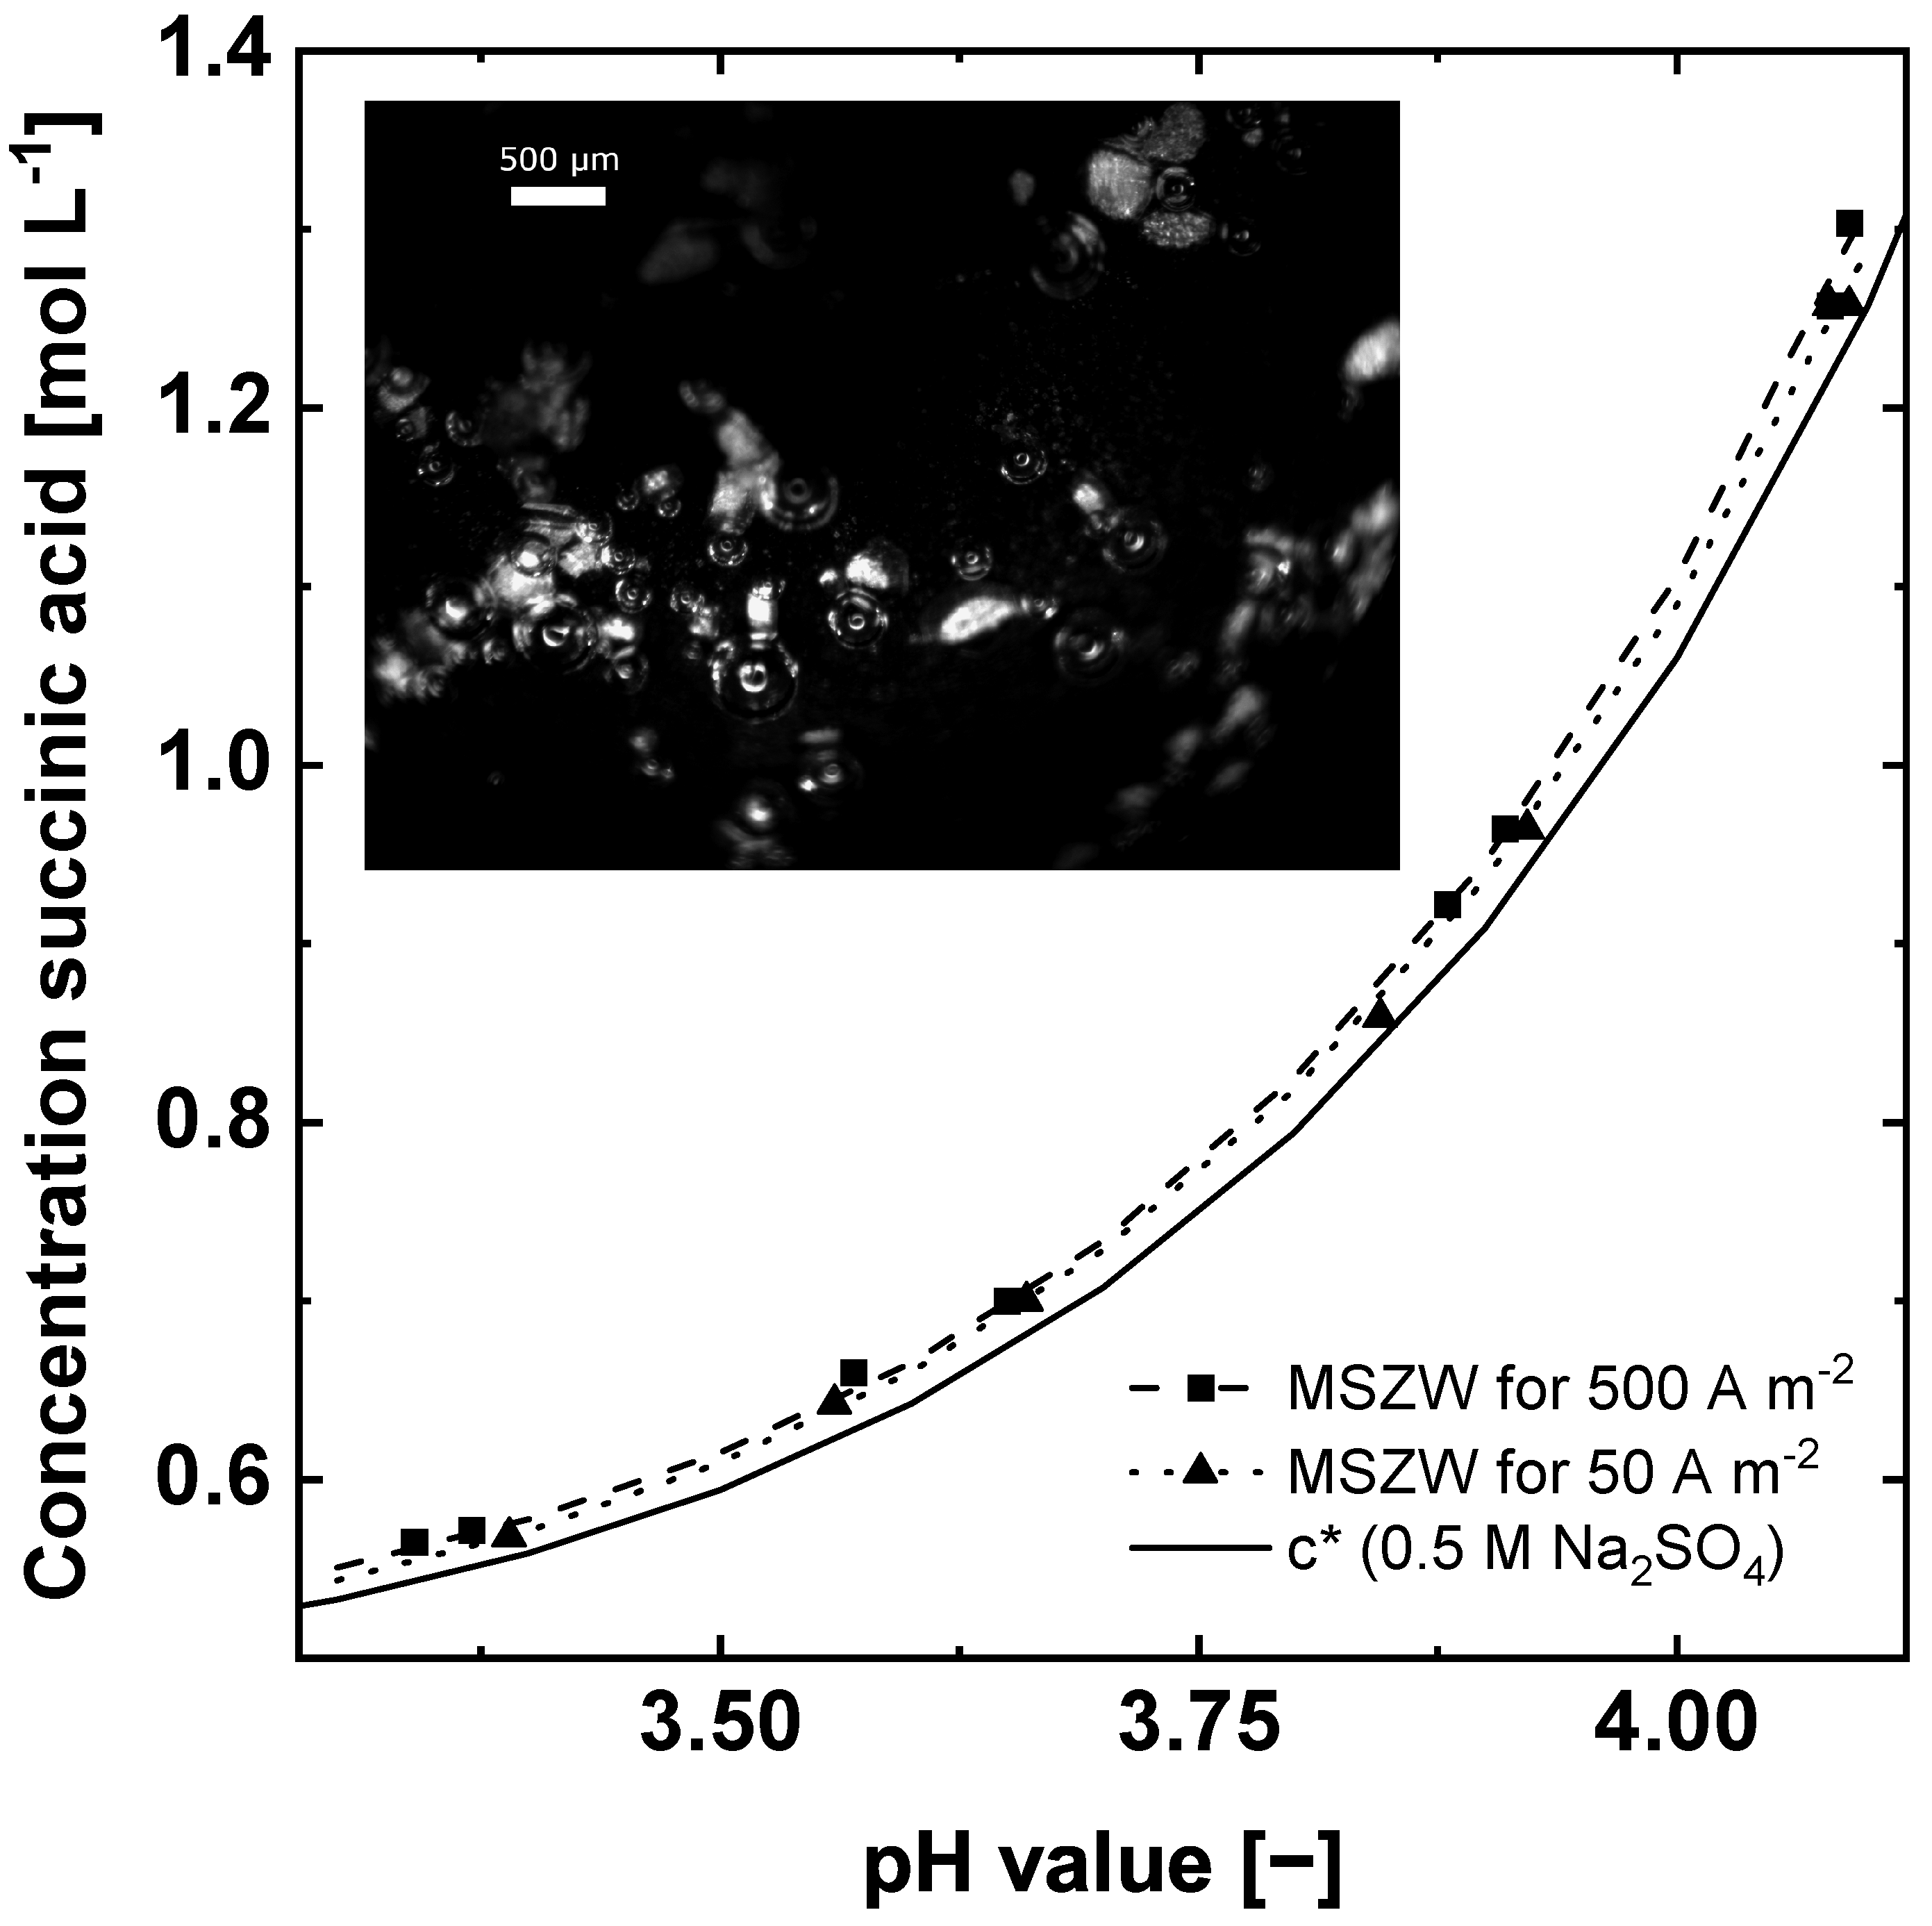
3.3. Solubility Measurements
3.4. Determination of the Metastable Zone Width
4. Results and Discussion
5. Conclusions
Author Contributions
Funding
Conflicts of Interest
References
- Jansen, M.L.A.; van Gulik, W.M. Towards large scale fermentative production of succinic acid. Curr. Opin. Biotechnol. 2014, 30, 190–197. [Google Scholar] [CrossRef]
- Andersen, S.J.; Candry, P.; Basadre, T.; Khor, W.C.; Roume, H.; Hernandez-Sanabria, E.; Coma, M.; Rabaey, K. Electrolytic extraction drives volatile fatty acid chain elongation through lactic acid and replaces chemical pH control in thin stillage fermentation. Biotechnol. Biofuels 2015, 8, 221. [Google Scholar] [CrossRef] [PubMed] [Green Version]
- Kim, Y.H.; Moon, S.H. Lactic acid recovery from fermentation broth using one-stage electrodialysis. J. Chem. Technol. Biotechnol. 2001, 76, 169–178. [Google Scholar] [CrossRef]
- Hábová, V.; Melzoch, K.; Rychtera, M.; Sekavová, B. Electrodialysis as a useful technique for lactic acid separation from a model solution and a fermentation broth. Desalination 2004, 162, 361–372. [Google Scholar] [CrossRef]
- Urbanus, J.; Bisselink, R.; Nijkamp, K.; ter Horst, J.H.; Verdoes, D.; Roelands, C. Integrated product removal of slightly water-soluble carboxylates from fermentation by electrochemically induced crystallization. J. Membr. Sci. 2010, 363, 36–47. [Google Scholar] [CrossRef]
- Gausmann, M.; Kocks, C.; Pastoors, J.; Büchs, J.; Wierckx, N.; Jupke, A. Electrochemical pH-T-Swing Separation of Itaconic Acid for Zero Salt Waste Downstream Processing. ACS Sustain. Chem. Eng. 2021, 9, 9336–9347. [Google Scholar] [CrossRef]
- Kocks, C.; Görtz, J.; Holtz, A.; Gausmann, M.; Jupke, A. Electrochemical Crystallization Concept for Succinic Acid Reduces Waste Salt Production. Chem. Ing. Tech. 2019, 754, 46. [Google Scholar] [CrossRef] [Green Version]
- Gausmann, M.; Kocks, C.; Doeker, M.; Eggert, A.; Maßmann, T.; Jupke, A. Recovery of succinic acid by integrated multi-phase electrochemical pH-shift extraction and crystallization. Sep. Purif. Technol. 2020, 240, 116489. [Google Scholar] [CrossRef]
- Ulrich, J.; Strege, C. Some aspects of the importance of metastable zone width and nucleation in industrial crystallizers. J. Cryst. Growth 2002, 237-239, 2130–2135. [Google Scholar] [CrossRef]
- Mullin, J.W. Crystallization, 4th ed.; Elsevier Professional: Amsterdam, The Netherlands, 2001. [Google Scholar]
- Beckmann, W.; Lorenz, H.; Hilficker, R.; Schmidt, C.; Jones, J.M.; Ulrich, J.; Wieckhusen, D.; Hofmann, G.; Melches, C.; Nienhaus, B.; et al. Crystallization: Basic Concepts and Industrial Applications; Wiley-VCH: Weinheim, Germany, 2013. [Google Scholar]
- Mersmann, A.; Kind, M.; Stichlmair, J. Thermische Verfahrenstechnik: Grundlagen und Methoden, 2nd ed.; Wesentlich Erw. und Aktualisierte Aufl; Chemische Technik Verfahrenstechnik; Springer: Berlin, Germany, 2005. [Google Scholar]
- Barrett, P.; Glennon, B. Characterizing the Metastable Zone Width and Solubility Curve Using Lasentec FBRM and PVM. Chem. Eng. Res. Des. 2002, 80, 799–805. [Google Scholar] [CrossRef] [Green Version]
- Kubota, N. A new interpretation of metastable zone widths measured for unseeded solutions. J. Cryst. Growth 2008, 310, 629–634. [Google Scholar] [CrossRef]
- Nývlt, J. Kinetics of nucleation in solutions. J. Cryst. Growth 1968, 3–4, 377–383. [Google Scholar] [CrossRef]
- Kleetz, T.; Pätzold, G.; Schembecker, G.; Wohlgemuth, K. Gassing Crystallization at Different Scales: Potential to Control Nucleation and Product Properties. Cryst. Growth Des. 2017, 17, 1028–1035. [Google Scholar] [CrossRef]
- Chaitanya, K.K.; Sarkar, D. Determination of the Metastable Zone Width by a Simple Optical Probe. Chem. Eng. Technol. 2014, 37, 1037–1042. [Google Scholar] [CrossRef]
- Schmidt, V.M. Elektrochemische Verfahrenstechnik: Grundlagen, Reaktionstechnik, Prozeszoptimierung: Grundlagen, Reaktionstechnik, Prozeszoptimierung; Wiley-VCH: Weinheim, Germany, 2003. [Google Scholar]
- Lange, L.; Lehmkemper, K.; Sadowski, G. Predicting the Aqueous Solubility of Pharmaceutical Cocrystals As a Function of pH and Temperature. Cryst. Growth Des. 2016, 16, 2726–2740. [Google Scholar] [CrossRef]
- Holtz, A.; Görtz, J.; Kocks, C.; Junker, M.; Jupke, A. Automated measurement of pH-dependent solid-liquid equilibria of itaconic acid and protocatechuic acid. Fluid Phase Equilibria 2021, 532, 112893. [Google Scholar] [CrossRef]
- Sangwal, K. A novel self-consistent Nývlt-like equation for metastable zone width determined by the polythermal method. Cryst. Res. Technol. 2009, 44, 231–247. [Google Scholar] [CrossRef]
- Nagy, Z.K.; Fujiwara, M.; Woo, X.Y.; Braatz, R.D. Determination of the Kinetic Parameters for the Crystallization of Paracetamol from Water Using Metastable Zone Width Experiments. Ind. Eng. Chem. Res. 2008, 47, 1245–1252. [Google Scholar] [CrossRef]
- Kleetz, T.; Funke, F.; Sunderhaus, A.; Schembecker, G.; Wohlgemuth, K. Influence of Gassing Crystallization Parameters on Induction Time and Crystal Size Distribution. Cryst. Growth Des. 2016, 16, 6797–6803. [Google Scholar] [CrossRef]
- Apelblat, A.; Manzurola, E. Solubility of oxalic, malonic, succinic, adipic, maleic, malic, citric, and tartaric acids in water from 278.15 to 338.15 K. J. Chem. Thermodyn. 1987, 19, 317–320. [Google Scholar] [CrossRef]
- Li, Q.; Wang, D.; Wu, Y.; Li, W.; Zhang, Y.; Xing, J.; Su, Z. One step recovery of succinic acid from fermentation broths by crystallization. Sep. Purif. Technol. 2010, 72, 294–300. [Google Scholar] [CrossRef]
- Wohlgemuth, K.; Kordylla, A.; Ruether, F.; Schembecker, G. Experimental study of the effect of bubbles on nucleation during batch cooling crystallization. Chem. Eng. Sci. 2009, 64, 4155–4163. [Google Scholar] [CrossRef]
- Nývlt, J.; Rychlý, R.; Gottfried, J.; Wurzelová, J. Metastable zone-width of some aqueous solutions. J. Cryst. Growth 1970, 6, 151–162. [Google Scholar] [CrossRef]
- Sangwal, K. Some features of metastable zone width of various systems determined by polythermal method. CrystEngComm 2011, 13, 489–501. [Google Scholar] [CrossRef]
- Bian, C.; Chen, H.; Song, X.; Yu, J. Metastable zone width and the primary nucleation kinetics for cooling crystallization of NaNO3 from NaCl-NaNO3-H2system. J. Cryst. Growth 2019, 518, 5–13. [Google Scholar] [CrossRef]
- Kulkarni, S.A.; Kadam, S.S.; Meekes, H.; Stankiewicz, A.I.; ter Horst, J.H. Crystal Nucleation Kinetics from Induction Times and Metastable Zone Widths. Cryst. Growth Des. 2013, 13, 2435–2440. [Google Scholar] [CrossRef]


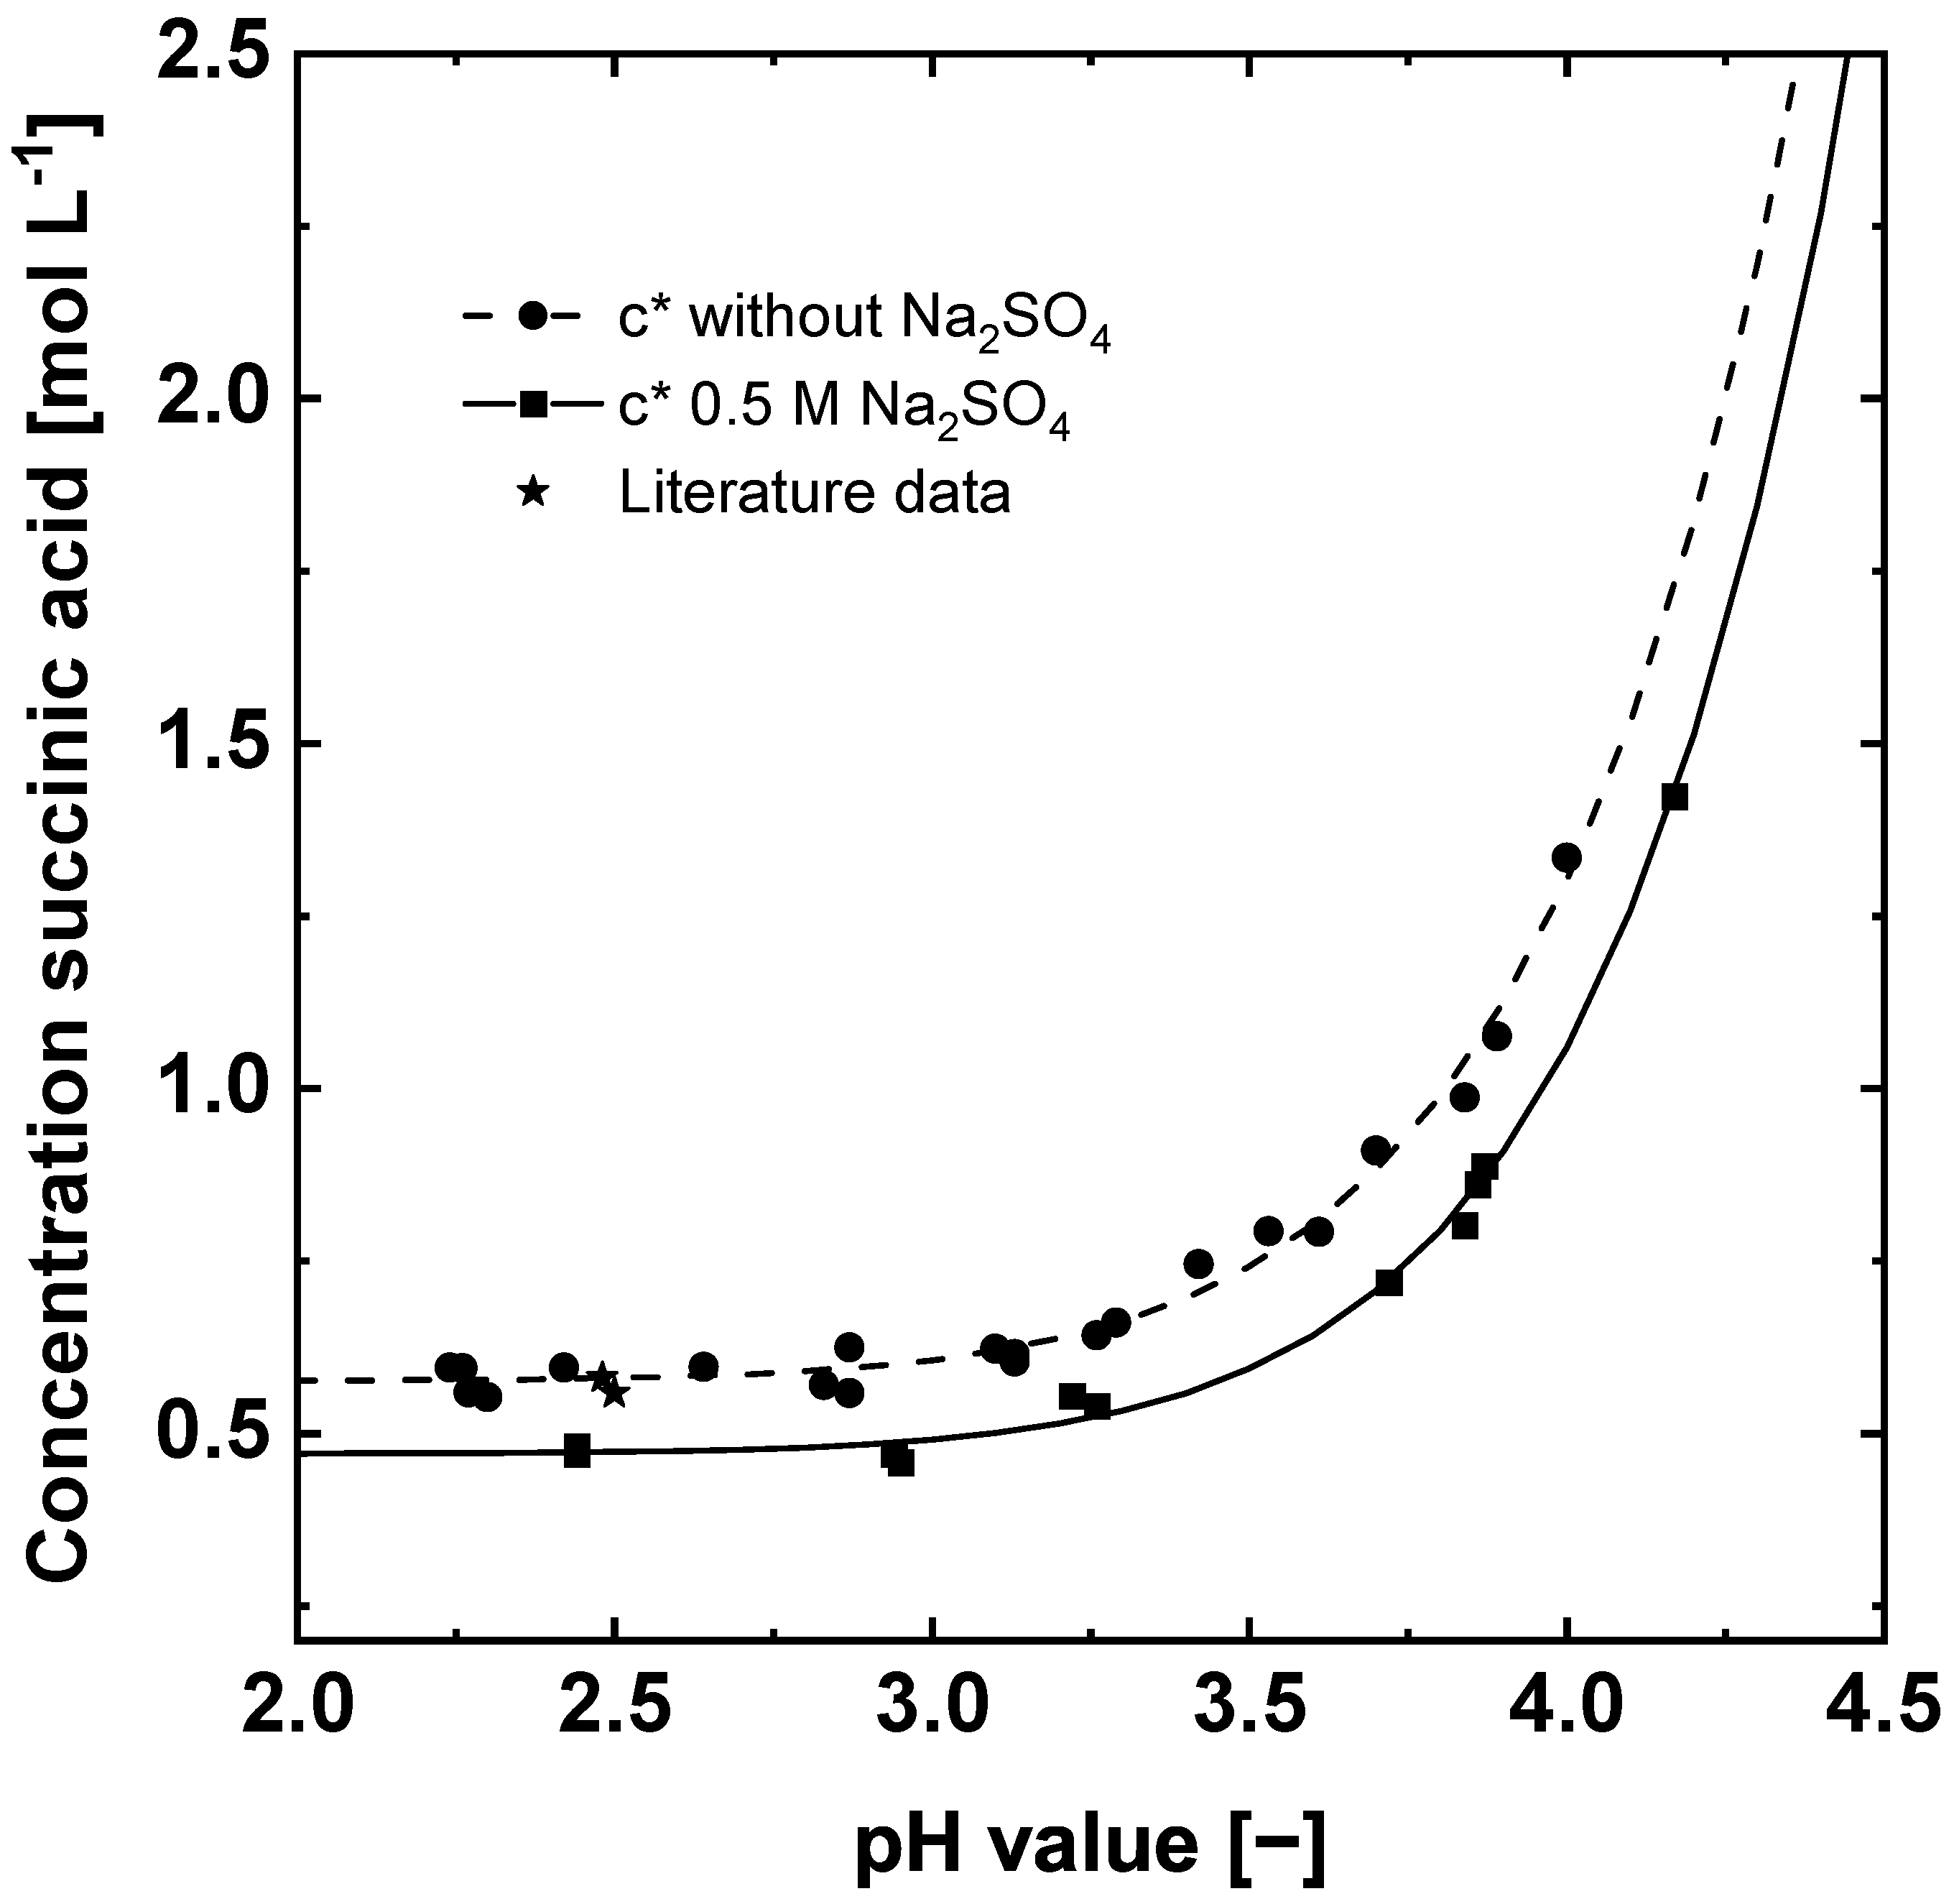
| Na2SO4 | ||||
|---|---|---|---|---|
| 0 M | 1.571 × | 11.07 | 0.576 | 0.983 |
| 0.5 M | 5.249 × | 11.71 | 0.471 | 0.997 |
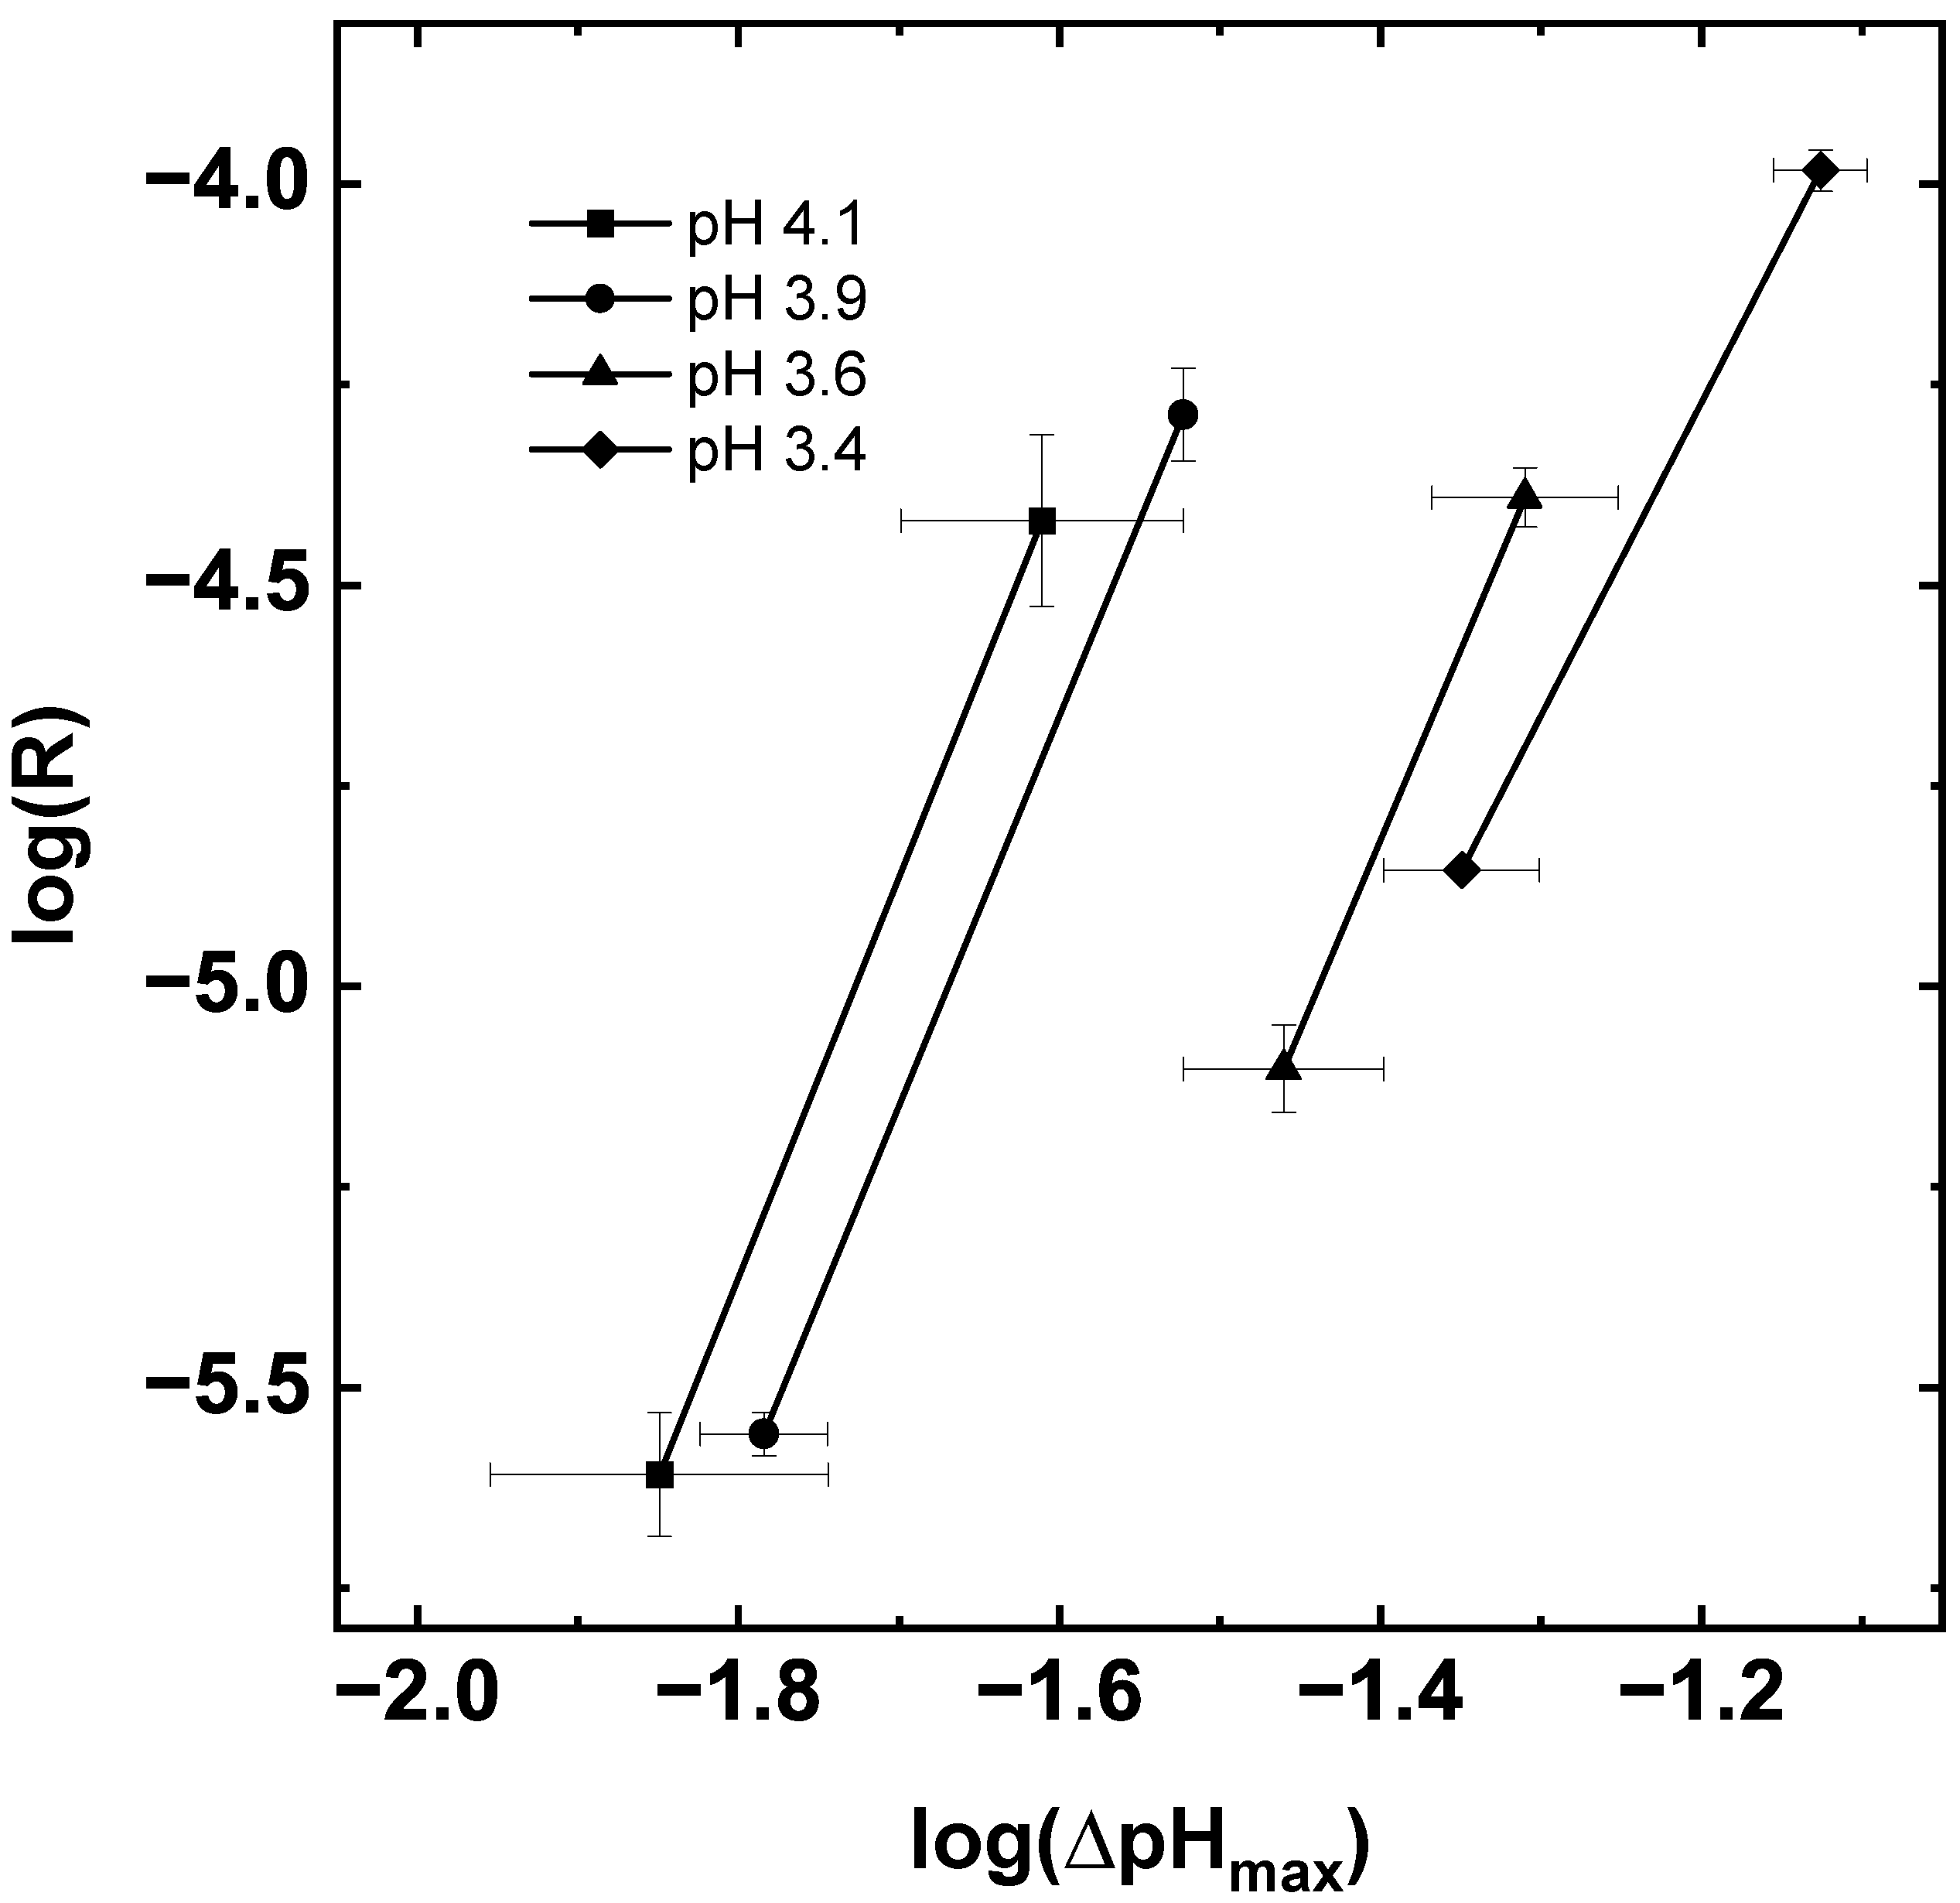
| Saturation pH Value | m | y-Intercept | k | |
|---|---|---|---|---|
| 4.1 | 4.984 | 3.610 | 2.247 | 161.953 |
| 3.9 | 4.861 | 2.867 | 1.315 | 267.308 |
| 3.6 | 4.731 | 1.806 | 0.558 | 563.780 |
| 3.4 | 3.901 | 0.409 | 0.303 | 44.659 |
Publisher’s Note: MDPI stays neutral with regard to jurisdictional claims in published maps and institutional affiliations. |
© 2021 by the authors. Licensee MDPI, Basel, Switzerland. This article is an open access article distributed under the terms and conditions of the Creative Commons Attribution (CC BY) license (https://creativecommons.org/licenses/by/4.0/).
Share and Cite
Kocks, C.; Krekel, C.M.; Gausmann, M.; Jupke, A. Determination of the Metastable Zone Width and Nucleation Parameters of Succinic Acid for Electrochemically Induced Crystallization. Crystals 2021, 11, 1090. https://doi.org/10.3390/cryst11091090
Kocks C, Krekel CM, Gausmann M, Jupke A. Determination of the Metastable Zone Width and Nucleation Parameters of Succinic Acid for Electrochemically Induced Crystallization. Crystals. 2021; 11(9):1090. https://doi.org/10.3390/cryst11091090
Chicago/Turabian StyleKocks, Christian, Christina Maria Krekel, Marcel Gausmann, and Andreas Jupke. 2021. "Determination of the Metastable Zone Width and Nucleation Parameters of Succinic Acid for Electrochemically Induced Crystallization" Crystals 11, no. 9: 1090. https://doi.org/10.3390/cryst11091090
APA StyleKocks, C., Krekel, C. M., Gausmann, M., & Jupke, A. (2021). Determination of the Metastable Zone Width and Nucleation Parameters of Succinic Acid for Electrochemically Induced Crystallization. Crystals, 11(9), 1090. https://doi.org/10.3390/cryst11091090