Article

Microstructure and Elements Concentration of Inconel 713LC during Laser Powder Bed Fusion through a Modified Cellular Automaton Model

Department of Mechanical Engineering, National Cheng Kung University, No.1 Daxue Rd., East Dist., Tainan City 701, Taiwan
*
Author to whom correspondence should be addressed.
Crystals 2021, 11(9), 1065; https://doi.org/10.3390/cryst11091065
Submission received: 12 August 2021 / Revised: 30 August 2021 / Accepted: 31 August 2021 / Published: 3 September 2021

Abstract

:
In this study, a hybrid finite element (FE) and cellular automaton (CA) model is developed to explore crystallization behavior and alloying of Inconel713LC during Laser powder bed fusion. A cellular automaton model is considering the surface nucleation, equiaxed bulk nucleation, and grain growth kinetics. In addition, the equation for solute diffusion is coupled with a cellular automaton model to simulate the IN713LC elements segregation. During the phase change, the non-equilibrium segregation model is applied to insert the effect of ultra-fast solidification happening during LPBF. It is found that, during LPBF processing of IN713LC, the micro segregation of Nb, Ti, and C is accrued at the grain boundaries. It is further shown that the micro segregation intensity depends on the solidification speed, which is determined in turn by the laser heat input. In particular, a lower laser heat input increases the solidification speed and results in a more uniform solid phase, thereby reducing the risk of crack formation. Finally, using a comparison between simulation results and experimental observation, it was shown that the proposed model successfully predicts the bulk element concentration of IN713LC after laser melting.

Graphical Abstract

1. Introduction

IN713LC, a nickel alloy with a composition of Cr-Al-Mo-Ti-Nb-Zr, is known for its good fatigue resistance, excellent mechanical properties, superior oxidation resistance, and enhanced resistance to degradation under harsh operating conditions [1,2,3,4]. Although the Ni-based superalloys faced many challenges with the LPBF process, still many studies have shown that most of them such as IN718 [5], IN625 [6], and Hastelloy X [7] can be successfully fabricated by laser powder bed fusion (LPBF). However, due to its crack-prone nature, the LPBF processing of IN713LC is extremely challenging [8,9]. Due to the rapid rate of solidification during LPBF, experimental investigations provide only limited insights about LPBF of IN713LC. Thus, in exploring the mechanisms which render the LPBF processing of IN713LC so challenging, simulation models are widely preferred. Cellular Automaton (CA) is recognized as one of the best simulation methods for examining ultra-fast solidification processes such as LPBF [10,11,12,13]. Ao et al. [14] used CA to simulate the microstructure of AlSi10Mg with a moving molten pool by selective laser melting. They have used the thermodynamic driven growth kinetics of the solid/liquid and composition. In addition, the growth rate was computed by the Kurz–Giovanola–Trivedi model [15] and they showed that the cooling rate is around 105–106 K/s. In addition, they proved that, during the solidification, the equiaxed grain formation increases with increasing the pre-heating temperature or reducing the scanning speed. A two-dimensional CA model is developed by Zinoviev et al. [16] to evaluate grain structure of alloys during SLM. They proved that the CA modelling can provide an accurate prediction of the alloy microstructure made by SLM. In addition, the microstructure of IN718 is predicted by a a 3D-CA model by Lain et al. [17], and they revealed that a CA model can predict the different microstructure forms of IN718 such as columnar grins, fine, and course equiaxed grains during a complex 3D transition thermal condition.
Currently, no work has been done to simulate the grain structure evolution or alloy segregation during the LBPF of IN713LC alloy. Specially, there is not any model to consider the non-equilibrium segregation model that occurs during the ultra-fast solidification in the LPBF process. The segregation and alloying that occur during the LPBF plays an important role in the determination of final properties of products. Simonelli et al. [18] obtained Ti-based alloys with superior mechanical properties without obvious precipitation of detrimental brittle phases by adding Fe and adjusting the LPBF process parameters. Furthermore, segregation induced liquation, and subsequent cracking was found to be the root cause of cracking in electron beam welded Inconel-713LC by Chamanfar et al. [19]. Later, Xu et al. [20] proved that the segregation of Ti and Al is the dominant parameter to control the size of blocky carbides and γ-γ′ eutectic increased during the LPBF process of In738LC. Accordingly, the current study develops a coupled finite element (FE) and modified CA model to predict the microstructure and micro segregation behavior of IN713LC during LPBF. The model takes account of Marangoni and surface tension forces, powder volume shrinkage during the melting, melt flow, melt surface evaluation, boundary and bulk equiaxed nucleation, and grain growth. In addition, the equations of solute diffusion have been coupled with an FE-CA model. A particular effort has been made to develop a practical and accurate model for elements partition coefficient during LPBF processing under conditions far from equilibrium conditions. The simulation results are used to determine the LPBF conditions which enable the uniform solid phase printing of IN713LC components and decreases the chance of crack formation. The validity of the derived conditions is demonstrated by means of experimental trials.

2. Computational Method

2.1. Finite Element Model

The transition governing equations used in this study are expressed as follows [21]:
ρ h t + . ρ h V = . k T + Q ˙ L
ρ V t + V V V A L E = . p I + μ V + V T + S b + S v
. ρ V = 0
where ρ is density, h is the enthalpy, V is the velocity field, T is temperature,   Q ˙ L is the laser heat source. In the momentum equation, p denotes pressure, μ is viscosity, and V A L E is the mesh velocity field from the Arbitrary Lagrangian-Eulerian (ALE) model [22]. In addition, S b represents the buoyancy forces and S v is the body force that is expressed by Carman–Kozeny approximation obtained from Darcy’s law as [23,24,25]:
S b = ρ 1 β T T m g
S v = C 1 f l 2 f l 3 + ε V
where β is the thermal expansion coefficient, g is the gravity vector, Tm is the IN713LC melting temperature, f l is the liquid fraction, ε is a small number to prevent division by zero during the solidification, and C is a constant number which is set here to 106. The laser heat source is based on volumetric laser-powder and laser-bulk matter (melted or solidified IN713LC) interactions and defined as [24]:
Q ˙ L = 1 f l q ˙ p r + f l q ˙ m r
Here, the liquid fraction, f l , and the laser–melt interaction, q ˙ m r are expressed by [24]:
f l = 0                                                                       T < T s T T s T l T s                             T s T   T l 1                                                                     T > T l
q ˙ m r = 2 P l π r 0 2 1 R exp 2 r 2 r 0 2 cos γ
In addition, q ˙ p r   is the laser–powder interaction which is modified by Beer–Lambert law [26] and has the following form:
q ˙ p r = 2 P l π r 0 * , 2 1 R α exp 2 r 2 r 0 * , 2 exp ( 0 z α d l )
where γ is the angle between laser direction and normal melt surface, r 0   is the laser radius, P l is the laser power, R is the IN713LC reflection coefficient, r is the distance between any point and laser center incident point, α is in-depth absorption coefficient, and r 0 * is the effective laser interaction radius where, due to radiation between powders, r 0 * > r 0 .
The effect of latent heat during phase change is included in specific heat expression as [24,27,28]:
c = 1 f l ρ s c s + f l ρ l c l ρ + H m d ω d T
where H m is the latent heat of fusion and ω is the smoothed function to express the fraction of phase during the phase change and can be expressed as [28]:
ω = f l ρ l 1 f l ρ s 2 ρ
Thermal conductivity, k, and density, ρ , of bulk IN713LC are respectively defined as [28]:
k = 1 f l k s + f l k l
ρ = 1 f l ρ s + f l ρ l
where k s   and k l are the thermal conductivity of IN713LC at solid and liquid phases.
In order to model the powder physical properties, Sih [29] effective conductivity is used as:
k p = k g 1 1 φ 1 + φ k r k g + 1 φ 2 1 k g k 2 1 k g k l n k k g 1 + k r k g
where φ is the porosity of the powder layer, k g   is the thermal conductivity of atmosphere gas, and k r is the radiation thermal conductivity between individual powder particles, which is defined as [29]:
k r = 4 3 σ T 3 D p
where σ is the Stefan–Boltzmann constant, and D p is the average powder size. To find powder surface emissivity, powder is considered as a porous media including particles and cavities. In this condition, the powder media emissivity is obtained from summation of emissivity of particles and cavities located at the powder surface as [29]:
ε p = 1 A H ε + A H ε H
where ε H is the emissivity of surface cavities and A H is the fraction of cavities on the powder surfaces. These two parameters can be defined as [29]:
ε H = ε 2 + 3.082 1 φ φ 2 ε 1 + 3.082 1 φ φ 2 + 1
A H = 0.908 φ 2 1.908 φ 2 2 φ + 1
All other powder’s physical properties, p , can be expressed as a function of corresponding IN713LC property, ,   and the porosity of the powder layer, φ , as [30]:
p = 1 φ
Both Marangoni and surface tension forced are imposed as boundary conditions on melt surface as:
σ = γ n . n + γ T T T . n n
where n is the unit vector normal to the melt surface and 𝛾 is the surface tension coefficient.
An arbitrary Lagrangian Eulerian (ALE) method [22] is implemented in order to simulate the free melt surface evaluation. The moving mesh velocity can be expressed as:
V A L E . n = V . n + v s h . n
where v s h is the powder volume shrinkage speed during the melting and can be expressed as:
v s h = L p 1 φ f l t

2.2. Microstructure Model

In the CA model, the number of nucleation sites formed during the solidification is conventionally assumed to have a Gaussian distribution as a function of the undercooling temperature and can be modeled using the following equation [10]:
d n d T = n m a x 2 π e x p T T m a x 0 2 2 T σ 2 ,
where T is the undercooling temperature, T m a x 0 is the maximum nucleation undercooling temperature, T σ   is the standard deviation of the undercooling temperature, and n m a x is the maximum nucleation density. The total density of the nucleation sites can thus be modeled as
n T = 0 T d n d T d T .
Since the IN713LC alloy system is dominated by Ni (~75 wt.%), the undercooling temperature,   T , can be assumed to consist of only thermodynamic undercooling T T . That is,
T = T T .
The thermodynamic undercooling, T T , can be expressed as [10]:
T T = H c p I v P t ,
where c p , H , P t , and I v are the specific heat, latent heat, Peclet number, and Ivantsov function, respectively. The Ivantsov function has for [10]:
I v P t = P t e x p P t P t e η η d η .
In addition, the Peclet number is defined as [10]:
P t = v g r o w t h R 2 α ,
where v g r o w t h is the liquid/solid growth speed, α is the thermal diffusivity, and R is the dendrite tip radius. According to Trivedi [31] and Kurz and Fisher [32], the growth speed and dendrite tip radius are related via the following stability criterion:
R = c p Γ 0.025 P t Δ H ,
where Γ is the Gibbs–Thomson coefficient. From Equations (28) and (29), the growth rate can be obtained as
v g r o w t h [ m m s ] = 1.5 T 2 2.1 T .
In modeling the element segregation behavior during solidification, the governing equation for solute diffusion is given as [33]:
C i t + . C i V = . D i T C i + ( C L , i * C s , i * ) f S t ,
where D i is the solute diffusion coefficient of component i (Cr, Mo, Nb, Al, Ti, and C in the present case). In addition, the third term in Equation (31) is the solute source term which is segregated at the solid–liquid interface and C L , i * and C S , i * are the solute concentrations of component i at the solid–liquid interface, respectively. Under equilibrium conditions, the two solute concentration terms at the solid–liquid interface are related as follows:
C s , i * = k i C L , i * ,
where k i is the equilibrium partition coefficient of element i. However, for the rapid solidification rate considered in the present study, the non-equilibrium relation between the element concentrations in the liquid and solid phases is given as
C s , i * = k i + a 0 R s D i 1 + a 0 R s D i C L , i * ,
where a 0 is the length of atomic dimensions of the components and R s is the solidification rate, as computed by the CA model. From Equation (33), when the solidification speed is slow, R s 0 and C s , i * = k i C L , i * . However, when the solidification speed is very fast, R s and C s , i * = C L , i * . In other words, no element segregation occurs since the elements are captured by the solid phase before they can diffuse to the liquid phase.
In the CA model, the simulation domain is divided into cells with a uniform size of 0.2 µm × 0.2 µm. Each cell is characterized by two variables, namely the state (i.e., solid or liquid) and the crystallography orientation. In initializing the model, the system is considered to be at the solidus temperature, and hence all of the cell states are set as 1. During the simulation, if temperature of the CA cell passes from liquid temperature, its state and crystallography are changed to 0. Notably, the cell state may change from 0 or 1 under the following two conditions:
  • Nucleation occurs in the cell;
  • The cell is captured by a solid cell.
The density of new nuclei formed during the solidification process is calculated by Equation (23) for simulation domain at boundaries or inside the melt. The nucleation densities are then multiplied by the total number of cells with a state of 1 in order to determine the number of new nucleation sites. That is,
N s = n s m a x 2 π e x p T T s m a x 0 2 2 T s σ 2 N a s ,
N v = n v m a x 2 π e x p T T v m a x 0 2 2 T v σ 2 N a v ,
where N a s is the total number of cells with state 1 at the system boundary, and N a v is the total number of cells with state 1 inside the bulk liquid. Furthermore, T v m a x 0 is considered to be 5 °C lower than T s m a x 0 . In performing the simulations, a random number, ri, with a value between 0 and 1 is assigned to each CA cell and nucleation is assumed to occur if the following condition is then satisfied:
r i < N s N a s .
Following nucleation, a second random process is used to generate and assign a crystallography orientation number, q = [0−64], to the corresponding cell. Note that a large number of possible crystallography orientations is deliberately considered here in order to avoid impinging grains with the same orientation during the solidification process. In addition, the growth length of cell i with regard to its neighbor j at time t is calculated as
L i j t = 0 t v g r o w t h d t .
Liquid neighbor capturing is also regarded as a random process. In particular, neighbor j is captured by cell i if the following condition is satisfied:
r i < L i j t x c o s θ i + s i n θ i ,
where x is the cell length and θ is the crystallographic orientation, which is calculated from the state of cell i as follows:
θ i = π 180 45 90 q i q .
Equations (37) and (38) show that the grain growth speed is a function of the grain orientation. In particular, the grain orientation affects the capturing rate and then drives the grain growth phenomena. After cell i captures cell j, the orientation of cell j is assigned to that of cell i. The solid fraction of cells, f S , is then calculated at each time step using the following equation:
f S t = L i j t x .
Considering the need for convergence and numerical stability, the time step in the simulation process is limited as follows:
d t 1 5 x d f S t d t , x 2 D L .
The 3D-FE model including all thermal equations is explicitly implemented in COMSOL Multiphysics. A microstructure model is also implemented in the in-house written code using FORTRAN. Heat loss radiation and convection boundary conditions are applied for the surface of the system. The Laplace smoothing algorithm is used to control the displacements of nodes. During the ALE model, if meshes deform too much, the map from mesh coordinates to spatial coordinates may enhance the ill-condition. In this condition, the auto re-mesh is applied. The powder layer thickness is considered 40 µm where the powder porosity, φ , is assumed to be 50%. For all the simulations, after laser track end up, simulation continues until the system became solid. In implementing the CA model, the IN713LC alloy was considered to be a 7-element system consisting of 12.1 Cr, 4.10 Mo, 2.0 Nb, 6.2 Al, 0.77 Ti, 0.05 C, and balance Ni. Note that the C component of the alloy was retained in the model even though its concentration is extremely low due its importance in increasing the formation of hot cracking. Furthermore, the diffusion coefficients in the solid phase are considered five orders smaller than liquid phase and no-flux boundary conditions were applied at all the boundaries. Table 1 summarizes the parameters applied in the micro-segregation model for the different elements of the IN713LC alloy. The physical parameters employed in the CA model are listed in Table 2.

2.3. Laser Processing

The printing trials were performed on a Tongtai Taiwan, Kaohsiung city, AM-250 LPBF machine equipped with a Nd-YAG laser with a wavelength of 1064 nm, a focal beam diameter of 100 μm, and a Gaussian irradiation profile. The laser provided a maximum power of 500 W and a maximum scanning speed of 2000 mm/s.
A single track experiment was conducted on a substrate made up of IN713LC. A total of nine single tracks were deposited on the substrate for laser energy densities of 360, 280, and 210 J/m, respectively. A layer thickness of 40 μm was maintained for single-track deposits with powder. To capture the statistical variation, three identical single tracks for each parameter is conducted. The single track length was kept constant at 10 mm for all single track experiments.
The trials used a zig-zag scanning model with a 67° rotation of the scanning direction between consecutive layers. To avoid oxidation during the LPBF process, the experiments were performed in a nitrogen atmosphere with an oxygen content of less than 1000 ppm. Based on a series of preliminary experiments, the scanning process was performed using three different laser energy densities of 360, 280, and 210 J/m, respectively. For each energy density, three cubic specimens were printed with dimensions of 10 × 10 × 10 mm3. Following the LPBF process, the samples were cut from the base plate with a wire and mounted on epoxy resin. The mounted samples were ground progressively with SiC sandpaper from a grit size of P240 to a final grit size of P3000, and were then further polished with a diamond suspension to a final particle size of around 0.3 μm. The polished samples were cleaned in ethanol solution and then dried. The microstructures and element compositions of the samples were examined using a scanning electron microscope (SEM, ZEISS Supra 55) equipped with energy dispersive X-ray spectroscopy (EDS) and electron backscattered diffraction (EBSD). In addition, the crack density was calculated using ImageJ software.

3. Results and Discussion

The 3D temperature distribution and surface pattern under laser power 250 W and scanning speed 700 mm/s, obtained from simulation, is shown in Figure 1a. In addition, Figure 1b,c compares the height map, surface morphology, and grain structure between simulation and experimental observations. The track width, melt penetration depth, and track bead height are obtained by simulation equal to 135 µm, 93 µm, and 56 µm, respectively. In addition, using experimental observation, the average track width, melt penetration depth, and track bead height are determined to be 143 µm, 83 µm, and 51 µm, respectively. Furthermore, grain structure shows the same trend between simulation and experimental results when the grains elongated toward melt pool center. Both experimental and simulation models show formation of equiaxed grains at the center of the melt pool. The average grain size is calculated using ImageJ software for experimental and simulation results equal to 56 µm and 49 µm. The comparison proved that the single-track geometry matches well with the experimental observations.
The Q/v, the ratio of laser power to laser travelling speed, is known as the heat input [39]. Here, the microstructures and element compositions of the IN713LC samples fabricated using heat inputs of 360, 280, and 210 J/m were simulated using the present model. These heat inputs are obtained at laser powers 250 W, 200 W, and 150 W, while the laser scanning speed remained at ~700 mm/s. Table 3 lists the results obtained from Equation (33) of the CA model for the average non-equilibrium partition coefficients of Cr, Mo, Nb, Al, Ti, and C during solidification given different values of the laser heat input. It is seen that the different elements have different solubilities in the IN713LC matrix. In particular, the C, Nb, Ti, Al, and Mo elements have relatively lower solubilities in the solid matrix, and hence tend to segregate in liquid. By contrast, Cr has a higher solubility, and thus tends to be trapped in the solid. It is noted that C has the highest diffusion coefficient of all the components in IN713LC and therefore moves through the solid–liquid interface easier than the other elements. The rapid diffusion of C atoms can be attributed to their small size, which allows them to sit interstitially within the Ni-super alloy lattice and hence move faster by jumping from one interstice to another. Comparing the equilibrium partition coefficients in Table 1 with the non-equilibrium element partition coefficients in Table 3, it is also seen that their values tend toward unity as the heat input reduces, i.e., the cooling rate increases. The average cooling rate during the solidification can be expressed by:
T ˙ = i = 1 N 0 t i ´ T i t d t N i = 1 N t i ´
where N is the number of cells which experience phase change during the LPBF process, Ti is the temperature of cell i, and t i ´ is the total time that cell i remains in the liquid phase during the cooling.
The average cooling rates during the solidification were calculated equal to 4.3 × 10⁴, 5.5 × 10⁴, and 7.3 × 10⁴ K/s, for heat inputs 360, 280, and 210 J/m, respectively. In other words, a more uniform element concentration is obtained under lower energy densities. This finding is reasonable since, as the energy density decreases, the cooling rate and solidification speed increase, and hence the elements have less time to diffuse from the solid phase to the liquid phase.
Figure 2, Figure 3 and Figure 4 show the simulation results for the grain structure and Nb, Ti, and C concentrations after laser melting for laser heat inputs of 360, 280, and 210 J/m, respectively. Note that Nb, Ti, and C are deliberately selected here since they have the lowest partition coefficients among all the elements in IN713LC, as shown in Table 3. In general, the results reveal that a lower heat input leads to a more dominant columnar grain growth structure along the solidification direction. In addition, a higher heat input results in a greater number of equiaxed grains above the columnar grains (see Figure 2, for example, for the maximum heat input of 360 J/m). The greater volume fraction of equiaxed grains can be attributed to the lower temperature gradient produced at higher heat inputs (i.e., 4.5 × 10⁵ K/m at an energy density of 360 J/m, compared to 5.8 × 10⁵ and 7.8 × 10⁵ K/m at heat input of 280 J/m and 210 J/m, respectively). More specifically, a lower temperature gradient results in the formation of equiaxed grains in front of the columnar grains, whereas a higher temperature gradient promotes directional growth.
The element distribution results in Figure 2 also show an obvious segregation of the Nb, Ti, and C elements at the grain boundaries. However, as shown in Figure 3 and Figure 4, such micro-segregation effect is reducing under lower heat inputs of 280 J/m and 210 J/m, respectively. Results illustrated in Figure 4 show that, for low heat input 210 J/m that leads to a high cooling rate, there is almost no segregation during solidification. Hence, it can be inferred that LPBF processes performed under higher laser heat input (i.e., slower solidification speeds) will produce more intensive micro segregation of the elements. This intensive micro segregation may result in carbide or other secondary phase formation at the grain boundaries especially with the presence of Nb and Ti. Nb is founded as a strong carbide former [19]. In addition, based on the previous research, Ti is also known to control the formation of carbide during the solidification [20]. Then, segregation of both Nb and Ti during the solidification is important and even a small difference may result in different conditions.
A detailed inspection of the simulation results presented in Figure 2, Figure 3 and Figure 4 shows that not all the grain boundaries exhibit the same amount of segregation. In general, grains with a larger size inevitably accrue a greater amount of segregation in front of their solid–liquid interface. When the segregated liquid is confined by other grains in the upstream region of the melt pool, the segregated elements are confined at the interface between them, and hence a region of high element concentration is formed. This is why most of the segregation happens at the boundary of large grains especially for heat inputs 360 J/m.
Although the present model cannot simulate crack formation but is based on previous studies [18,19,20], there is a correlation between elements’ segregations and crack formation, which shows that the present model can predict the crack formation qualitatively. According to the simulation results, the faster cooling rate suppresses element segregation at the grain boundaries and generates a more uniform element distribution. As a result, the formation of an undesired phase, which leads to crack initiation, is reduced. To verify the role of element segregation in prompting crack formation in the present samples, six samples in the form of single track or bulk cubic samples are made with different heat inputs which results in a different cooling rate, and then crack density is calculated for these three cases. Figure 5a–f presents optical microscope (OM) images of the ground and polished IN713LC samples printed using heat inputs of 360, 280, and 210 J/m, respectively. Figure 5a–c were obtained from a single track experiment while samples shown in Figure 5d–f belong to bulk cubic samples. It is seen that all the samples contain cracks of various lengths.
For the single track experiment, the crack density and average crack length reduce from 0.062% and 63 µm for the heat input 360 J/m to 0.006% and 15 µm for a heat input of 210 J/m. For bulk cubic samples, the crack density and average crack length reduce from 0.103% and 79 μm for the heat inputs of 360 J/m to 0.029% and 62 μm for an energy density of 210 J/m. In addition, a detailed EDS analysis was performed at selected points inside and outside of the cracks formed in the sample built with a high heat input of 360 J/m. The analysis points and corresponding EDS results are presented in Figure 5g,h. As predicted by the simulation results, both crack regions exhibit a high segregation rate of Nb, Ti, Al, and C. In particular, the Ti, Nb, Al, and C contents increase from 0.77, 2.0, 6.2, and 0.05 wt.% in the original IN713LC powder to 24.42, 11.54, 16.08, and 21.54 wt.%, respectively, within the crack. The high concentration of metallic elements implies the formation of MC carbides within the crack, and is hence consistent with the simulation results for the non-equilibrium element partition coefficients listed in Table 3.
In general, the simulation and experimental results presented above indicate that a lower heat input (i.e., a faster solidification rate) is beneficial in suppressing the segregation and then crack formation during the LPBF process of IN713LC components. Accordingly, a further sample was printed using a laser power of 120 W and a scanning speed of 700 mm/s, corresponding to a reduced energy density of around 170 J/m. Figure 6 presents an OM image of the built sample. It is seen that the surface contains neither cracks nor visible pores. In other words, the feasibility of LPBF for the processing of IN713LC is confirmed given a suitable low value of the laser energy density. It is noted, however, that reducing the energy density below a certain critical value may potentially induce new defects such as ‘void formation’ due to melt pool shrinkage under low energy conditions [40]. Here, to eliminate the sub-micrometric spherical pores at low energy density, the scan spacing was reduced to compensate for the shrinking of the melt pool. Accordingly, determining the optimal value of the energy density is an essential requirement for future studies. The same conclusion is obtained by Rashid et al. [41], where the heat input and energy per layer is found to be a critical parameter on the density and microstructure of final products during the LPBF process.

4. Conclusions

In conclusion, a modified CA model has been developed to predict the microstructure and micro segregation behavior of IN713LC nickel alloy during the solidification stage of the LPBF process. The below conclusions can be extracted from the results:
(1)
Solidification speed can be controlled by heat input. Faster cooling rate and solidification speed are obtained by decreasing the laser heat input.
(2)
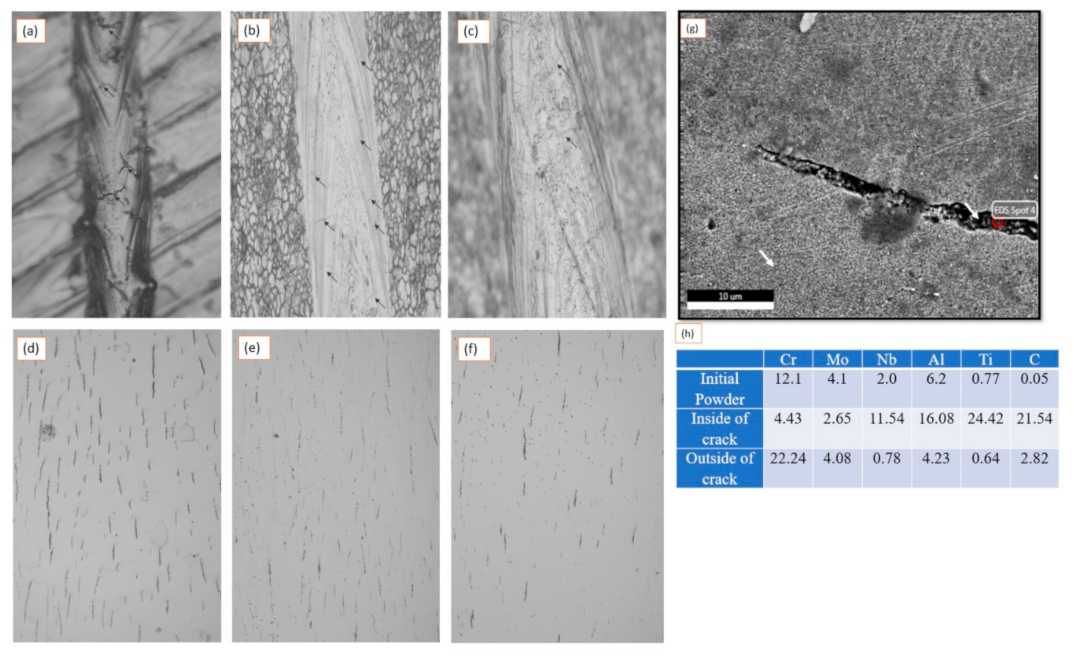
The simulation results show that the micro segregation phenomenon is a diffusion-controlled process, in which the elements with a lower partition coefficient and higher diffusivity experience a higher rate of segregation.
(3)
It is shown that element segregation is enhanced under a slower solidification rate since the elements spend a longer time in their respective precipitation windows and thus have sufficient time to move from the solid phase to the liquid phase.
(4)
As the laser heat input reduces, the solidification speed increases and the element partitioning coefficients approach unity. Consequently, a more uniform solid phase is formed with only minimal segregation at the grain boundaries.
(5)
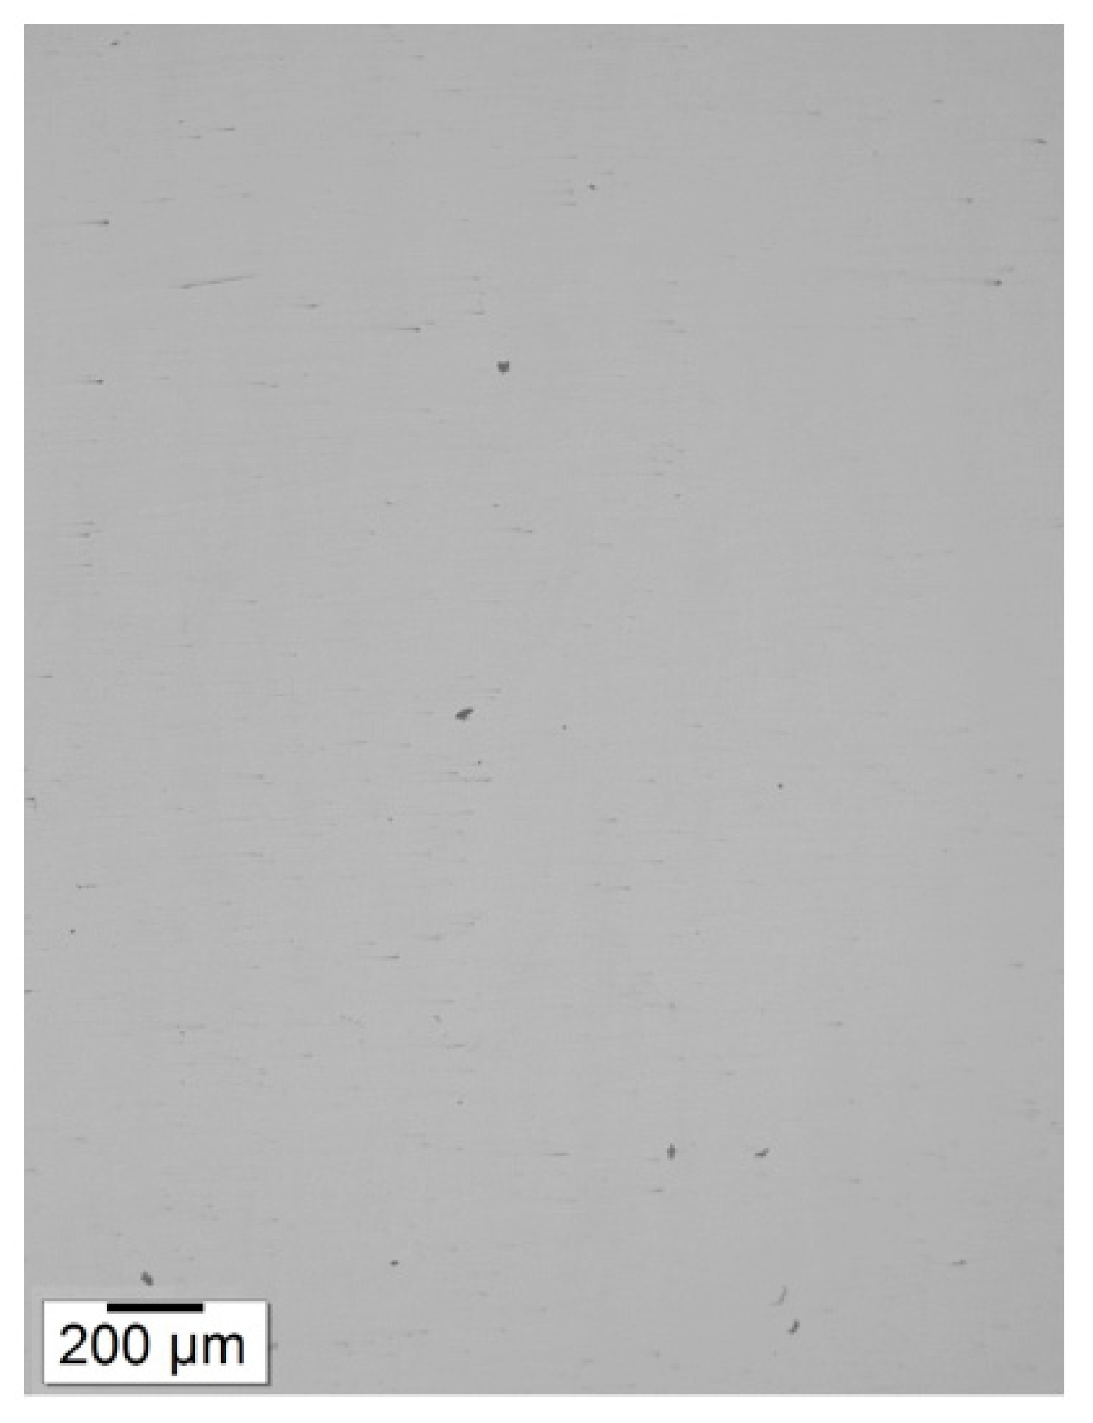
It has been shown that the crack length and crack density decrease with a reducing laser heat input.
Notably, the experimental results carried out using the concepts of the present model have demonstrated the feasibility of fabricating crack-free IN713LC components using the LPBF process given a suitable low value of the energy density (e.g., 170 J/m in the present case). For future work, the present model can be used in machine learning and digital twining models and help to predict elements concentration and optimization of the LPBF process.

Author Contributions

Conceptualization, Y.-L.L., A.R.A.D., and M.M.R.; methodology, M.M.R.; software, A.R.A.D.; validation, A.R.A.D. and M.M.R.; formal analysis, A.R.A.D.; investigation, A.R.A.D. and M.M.R.; writing—original draft preparation, A.R.A.D.; writing—review and editing, A.R.A.D.; visualization, A.R.A.D.; supervision, Y.-L.L.; project administration, Y.-L.L.; funding acquisition, Y.-L.L. All authors have read and agreed to the published version of the manuscript.

Funding

This work was supported by the Ministry of Science and Technology of Taiwan under Grant [Nos. MOST 108-2218-E-006-026].

Institutional Review Board Statement

Not applicable.

Informed Consent Statement

Not applicable.

Acknowledgments

The authors gratefully acknowledge the financial support provided to this study by the Ministry of Science and Technology of Taiwan. The research was also supported in part by the funding provided by the Ministry of Education, Taiwan, Headquarters of University Advancement, to the Intelligent Manufacturing Research Center (iMRC) at National Cheng Kung University (NCKU).

Conflicts of Interest

The authors declare no conflict of interest.

References

  1. Cantó, J.S.; Winwood, S.; Rhodes, K.; Birosca, S. A study of low cycle fatigue life and its correlation with microstructural parameters in IN713C nickel based superalloy. Mater. Sci. Eng. A 2018, 718, 19–32. [Google Scholar] [CrossRef] [Green Version]
  2. Kunz, L.; Lukáš, P.; Konečná, R.; Fintová, S. Casting defects and high temperature fatigue life of IN 713LC superalloy. Int. J. Fatigue 2012, 41, 47–51. [Google Scholar] [CrossRef]
  3. Matysiak, H.; Zagorska, M.; Balkowiec, A.; Adamczyk-Cieslak, B.; Cygan, R.; Cwajna, J.; Nawrocki, J.; Kurzydłowski, K.J. The Microstructure Degradation of the IN 713C Nickel-Based Superalloy after the Stress Rupture Tests. J. Mater. Eng. Perform. 2014, 23, 3305–3313. [Google Scholar] [CrossRef] [Green Version]
  4. Amirjan, M.; Bozorg, M.; Sakiani, H. Investigation of microstructure and corrosion behavior of IN718 superalloy fabricated by selective laser melting. Mater. Chem. Phys. 2021, 263, 124368. [Google Scholar] [CrossRef]
  5. Wang, Z.; Guan, K.; Gao, M.; Li, X.; Chen, X.; Zeng, X. The microstructure and mechanical properties of deposited-IN718 by selective laser melting. J. Alloy. Compd. 2012, 513, 518–523. [Google Scholar] [CrossRef]
  6. Li, S.; Wei, Q.; Shi, Y.; Zhu, Z.; Zhang, D. Microstructure Characteristics of Inconel 625 Superalloy Manufactured by Selective Laser Melting. J. Mater. Sci. Technol. 2015, 31, 946–952. [Google Scholar] [CrossRef]
  7. Tian, Y.; Tomus, D.; Rometsch, P.; Wu, X. Influences of processing parameters on surface roughness of Hastelloy X produced by selective laser melting. Addit. Manuf. 2017, 13, 103–112. [Google Scholar] [CrossRef]
  8. Shepeleva, L.; Medres, B.; Kaplan, W.; Bamberger, M.; Weisheit, A. Laser cladding of turbine blades. Surf. Coat. Technol. 2000, 125, 45–48. [Google Scholar] [CrossRef]
  9. Łyczkowska, K.; Adamiec, J.; Jachym, R.; Kwieciński, K. Properties of the Inconel 713 Alloy Within the High Temperature Brittleness Range. Arch. Foundry Eng. 2017, 17, 103–108. [Google Scholar] [CrossRef] [Green Version]
  10. Dezfoli, A.R.A.; Hwang, W.-S.; Huang, W.-C.; Tsai, T.-W. Determination and controlling of grain structure of metals after laser incidence: Theoretical approach. Sci. Rep. 2017, 7, srep41527. [Google Scholar] [CrossRef] [Green Version]
  11. Zhang, F.; Liu, D.; Yang, Y.; Liu, C.; Zhang, Z.; Wang, H.; Wang, J. Investigation on the meta-dynamic recrystallization behavior of Inconel 718 superalloy in the presence of δ phase through a modified cellular automaton model. J. Alloy. Compd. 2020, 817, 152773. [Google Scholar] [CrossRef]
  12. Yang, J.; Yu, H.; Yang, H.; Li, F.; Wang, Z.; Zeng, X. Prediction of microstructure in selective laser melted Ti6Al4V alloy by cellular automaton. J. Alloys Compd. 2018, 748, 281–290. [Google Scholar]
  13. Michael, A.; Zhou, Y.; Yavuz, M.; Khan, M. Modelling the alloy element composition change in NiTi achieved through laser induced vaporization. Mater. Chem. Phys. 2019, 231, 87–94. [Google Scholar] [CrossRef]
  14. Ao, X.; Xia, H.; Liu, J.; He, Q. Simulations of microstructure coupling with moving molten pool by selective laser melting using a cellular automaton. Mater. Des. 2020, 185, 108230. [Google Scholar] [CrossRef]
  15. Trivedi, R. Morphological stability of a solid particle growing from a binary alloy melt. J. Cryst. Growth 1980, 48, 93–99. [Google Scholar] [CrossRef]
  16. Zinoviev, A.; Zinovieva, O.; Ploshikhin, V.; Romanova, V.; Balokhonov, R. Evolution of grain structure during laser additive manufacturing. Simulation by a cellular automata method. Mater. Des. 2016, 106, 321–329. [Google Scholar] [CrossRef]
  17. Lian, Y.; Gan, Z.; Yu, C.; Kats, D.; Liu, W.K.; Wagner, G.J. A cellular automaton finite volume method for microstructure evolution during additive manufacturing. Mater. Des. 2019, 169, 107672. [Google Scholar] [CrossRef]
  18. Simonelli, M.; McCartney, D.G.; Barriobero-Vila, P.; Aboulkhair, N.T.; Tse, Y.Y.; Clare, A.; Hague, R. The Influence of Iron in Minimizing the Microstructural Anisotropy of Ti-6Al-4V Produced by Laser Powder-Bed Fusion. Metall. Mater. Trans. A 2020, 51, 2444–2459. [Google Scholar] [CrossRef] [Green Version]
  19. Chamanfar, A.; Jahazi, M.; Bonakdar, A.; Morin, E.; Firoozrai, A. Cracking in fusion zone and heat affected zone of electron beam welded Inconel-713LC gas turbine blades. Mater. Sci. Eng. A 2015, 642, 230–240. [Google Scholar] [CrossRef]
  20. Xu, J.; Lin, X.; Guo, P.; Hu, Y.; Wen, X.; Xue, L.; Liu, J.; Huang, W. The effect of preheating on microstructure and mechanical properties of laser solid forming IN-738LC alloy. Mater. Sci. Eng. A 2017, 691, 71–80. [Google Scholar] [CrossRef]
  21. Andreotta, R.; Ladani, L.; Brindley, W. Finite element simulation of laser additive melting and solidification of Inconel 718 with experimentally tested thermal properties. Finite Elem. Anal. Des. 2017, 135, 36–43. [Google Scholar] [CrossRef]
  22. Hirt, C.; Amsden, A.; Cook, J. An arbitrary Lagrangian-Eulerian computing method for all flow speeds. J. Comput. Phys. 1974, 14, 227–253. [Google Scholar] [CrossRef]
  23. De Baere, D.; Bayat, M.; Mohanty, S.; Hattel, J. Thermo-fluid-metallurgical modelling of the selective laser melting process chain. Procedia CIRP 2018, 74, 87–91. [Google Scholar] [CrossRef]
  24. Morville, S.; Carin, M.; Muller, M.; Gharbi, M.; Peyre, P.; Carron, D.; Masson, P.L.E.; Fabbro, R. 2D axial-symmetric model for fluid flow and heat transfer in the melting and resolidification of a vertical cylinder. In Proceedings of the COMSOL Conference, Paris, France, 17–19 November 2010. [Google Scholar]
  25. Li, S.; Xiao, H.; Liu, K.; Xiao, W.; Li, Y.; Han, X.; Mazumder, J.; Song, L. Melt-pool motion, temperature variation and dendritic morphology of Inconel 718 during pulsed- and continuous-wave laser additive manufacturing: A comparative study. Mater. Des. 2017, 119, 351–360. [Google Scholar] [CrossRef]
  26. Swinehart, D.F. The Beer-Lambert Law. J. Chem. Educ. 1962, 39, 333. [Google Scholar] [CrossRef]
  27. Xiang, Z.; Yin, M.; Dong, G.; Mei, X.; Yin, G. Modeling of the thermal physical process and study on the reliability of linear energy density for selective laser melting. Results Phys. 2018, 9, 939–946. [Google Scholar] [CrossRef]
  28. Zhang, P.; Zhang, D.; Liu, Z.; Kang, Z.; Gao, Y.; Li, L. Microscopic simulation of the effect of process parameters by the Marangoni convection on the temperature field of Inconel 718 alloy using selective laser melting. In: Advanced Laser Processing and Manufacturing II. Int. Soc. Opt. Photonics 2018, 108130. [Google Scholar]
  29. Sih, S.S.; Barlow, J.W. The Prediction of the Emissivity and Thermal Conductivity of Powder Beds. Part. Sci. Technol. 2004, 22, 427–440. [Google Scholar] [CrossRef]
  30. Loh, L.-E.; Chua, C.-K.; Yeong, W.Y.; Song, J.; Mapar, M.; Sing, S.L.; Liu, Z.-H.; Zhang, D.-Q. Numerical investigation and an effective modelling on the Selective Laser Melting (SLM) process with aluminium alloy 6061. Int. J. Heat Mass Transf. 2015, 80, 288–300. [Google Scholar] [CrossRef]
  31. Trivedi, R.; Kurz, W. Dendritic growth. Int. Mat. Rev. 1994, 39, 49–74. [Google Scholar] [CrossRef]
  32. Kurz, W.; Fisher, D. Dendrite growth at the limit of stability: Tip radius and spacing. Acta Metall. 1981, 29, 11–20. [Google Scholar] [CrossRef]
  33. Tsai, D.C.; Hwang, W.S. Numerical simulation of solidification morphologies of Cu-0.6 Cr casting alloy using modified cellular automaton model. Trans. Nonferrous Metals Soc. China 2010, 20, 1072–1077. [Google Scholar] [CrossRef]
  34. Zlá, S.; Smetana, B.; Žaludová, M.; Dobrovská, J.; Vodárek, V.; Konečná, K.; Matějka, V.; Francová, H. Determination of thermophysical properties of high temperature alloy IN713LC by thermal analysis. J. Therm. Anal. Calorim. 2012, 110, 211–219. [Google Scholar] [CrossRef] [Green Version]
  35. Queva, A.; Guillemot, G.; Moriconi, C.; Metton, C.; Bellet, M. Numerical study of the impact of vaporisation on melt pool dynamics in Laser Powder Bed Fusion—Application to IN718 and Ti-6Al-4V. Addit. Manuf. 2020, 35, 101249. [Google Scholar] [CrossRef]
  36. Krajewski, W.K.; Piwowarski, G.; Buraś, J.; Rutkowski, P.; Szeliga, D. Thermo-Physical Properties of Selected Inconel. Arch. Metall. Mater. 2014, 59, 1055–1058. [Google Scholar] [CrossRef]
  37. Mills, K.C. Recommended Values of Thermophysical Properties for Selected Commercial Alloys; Woodhead Publishing: Cambridge, UK, 2002. [Google Scholar]
  38. Queva, A.; Mayi, Y.; Bellet, M.; Guillemot, G.; Peyre, P.; Dal, M.; Moriconi, C.; Metton, C. Thermo-Mechanical Simulation of Track Development in the Laser Beam Melting Process-Effect of Laser-Metal Interaction. IOP Conf. Ser. Mater. Sci. Eng. 2019, 529, 012005. [Google Scholar] [CrossRef]
  39. Kundin, J.; Mushongera, L.; Emmerich, H. Phase-field modeling of microstructure formation during rapid solidification in Inconel 718 superalloy. Acta Mater. 2015, 95, 343–356. [Google Scholar] [CrossRef]
  40. Wang, H.-Y.; Lo, Y.-L.; Tran, H.-C.; Raza, M.M.; Le, T.-N. Systematic Approach for Reducing Micro-Crack Formation in Inconel 713LC Components Fabricated by Laser Powder Bed Fusion. Rapid Prototype J. 2021, 27, 1548–1561. [Google Scholar] [CrossRef]
  41. Rashid, R.; Masood, S.; Ruan, D.; Palanisamy, S.; Elambasseril, J.; Brandt, M. Effect of energy per layer on the anisotropy of selective laser melted AlSi12 aluminium alloy. Addit. Manuf. 2018, 22, 426–439. [Google Scholar] [CrossRef]
Figure 1. Temperature distribution and track morphology, (a) 3D temperature distribution of single track fabricated at laser power 250 W and scanning speed 700 mm/s, (b) experimental OM image of cross-section of single track morphology, and (c) simulation results for a cross-section of single track morphology; the grain boundaries of experimental results are indicated by a white line.
Crystals 11 01065 g001
Figure 2. Simulation results for solidification behavior at 360 J/m. (a) grain structure inside the track; (b) Nb concentration after laser melting; (c) Ti concentration after laser melting; (d) C concentration after laser melting.
Crystals 11 01065 g002
Figure 3. Simulation results for solidification behavior at 280 J/m. (a) Grain structure inside the track, (b) Nb concentration after laser melting; (c) Ti concentration after laser melting; (d) C concentration after laser melting.
Crystals 11 01065 g003
Figure 4. Simulation results for solidification behavior at 210 J/m. (a) Grain structure inside the track; (b) Nb concentration after laser melting; (c) Ti concentration after laser melting; (d) C concentration after laser melting.
Crystals 11 01065 g004
Figure 5. OM images of ground and polished IN713LC samples (a) single track made by energy input 360 J/m; (b) single track made by energy input 280 J/m; (c) single track made by energy input 210 J/m; (d) bulk cubic sample made by energy input 360 J/m; (e) bulk cubic sample made by energy input 280 J/m; (f) bulk cubic sample made by energy input 210 J/m; (g) points selected for EDS analysis in in IN713LC sample fabricated using energy density of 360 J/m; (h) alloying element concentrations inside and outside of the crack.
Crystals 11 01065 g005
Figure 6. IN713LC sample fabricated using low energy density of 170 J/m.
Crystals 11 01065 g006
Table 1. Parameters used in the micro-segregation model for different alloying elements of IN713LC.
ParameterCrMoNbAlTiC
C0 × % [mass]12.14.102.06.20.770.05
DL × 1010 [m2/s] [39]8.9810.7610.5311.1010.9943.0
k [16]0.960.820.460.830.550.12
Table 2. Physical parameters used in the CA model.
Property (Unit) ValueReference
Liquidus temperature [°C]Tl1349[34]
Solidus temperature [°C]Ts1250[34]
Density of liquid [kg.m3] ρ l 7300[35]
Density of solid [kg.m3] ρ s 8190[35]
Thermal Conductivity [J/m.s.K] k l ,   k s −1.9 × 10⁻⁸T3 + 2.6×10⁻⁵T2 + 1.7 × 10⁻²T + 9.53[36]
Specific heat [J/kg.K] c l , c s 2.9 × 10⁻¹⁰T3 − 4.1 × 10⁻⁷T2 + 5.5 × 10⁻⁴T + 4.210−1[36]
Latent heat of fusion [KJ/kg] H m 236[37]
Viscosity [kg/ms]µ7.8 × 10−3[38]
Surface tension [N/m] γ 1.89[38]
Marangoni coefficient [N/m.K] γ T −1.1 × 10⁻⁴[38]
Absorption (liquid) [mm−1]A25[35,38]
Reflection coefficientR0.7[35]
CA cell length [µm] l c e l l 0.2-
Laser radius [µm] r 0 50-
Table 3. Average IN713LC element partition coefficients under different solidification rates.
Heat Input
[J/m]
CrMoNbAlTiC
3600.970.870.600.840.710.15
2800.980.890.630.850.730.17
2100.980.900.710.860.760.21
Publisher’s Note: MDPI stays neutral with regard to jurisdictional claims in published maps and institutional affiliations.

