Article

Polymorphic Crystallization Design to Prevent the Degradation of the β-Lactam Structure of a Carbapenem

1
Department of Applied Chemistry and Bioengineering, Graduate School of Engineering, Osaka City University, Osaka 558-8585, Japan
2
Kansai Chemical Engineering Co., Ltd., Amagasaki 660-0053, Japan
*
Authors to whom correspondence should be addressed.
Crystals 2021, 11(8), 931; https://doi.org/10.3390/cryst11080931
Submission received: 30 June 2021 / Revised: 7 August 2021 / Accepted: 9 August 2021 / Published: 11 August 2021
(This article belongs to the Special Issue Pharmaceutical Crystallization)

Abstract

:
The cooling crystallization of carbapenem CS-023 was performed at 25 °C in an aqueous solution. Tetrahydrate crystals (form H) were obtained. Hydrate crystals are promising drugs, but there has been problems in manufacturing such crystals. During cooling crystallization, a dissolution process at a high temperature of 70 °C was utilized. The main problem in manufacturing was that the degradation rate of CS-023 at 70 °C was high, as expressed in the half-life period of 2.97 h. Poor solvent crystallization using ethanol was observed at 25 °C. Thus, a different polymorph (Form A) was obtained. Form A comprised CS-023, 5/2 ethanol, and 1/2 H2O. Form A, containing ethanol, is not suitable as a drug. Form A was then transformed to another polymorph of hydrate crystals or tetrahydrate Form H. Another hydrate polymorph, Form B, was obtained through the solid phase transformation of Form A and further transformed to the tetrahydrate Form H, at high humidity over 80% RH. This process, which proceeded at the low temperature of 25 °C, helped to prevent the degradation of CS-023, thereby avoiding wastage. Furthermore, the solid-phase transition could be controlled with vapor composition.

1. Introduction

Crystal polymorphism is an important topic in the pharmaceutical industry because polymorphic crystals possess various physicochemical properties (e.g., solubility and dissolution rate). Differences in the characteristics of crystals of drug substances conclusively influence the bioavailability of the drug. Therefore, the optimal polymorph should be carefully selected for drug development. Polymorphism may include solvation and hydration products, known as pseudo-polymorphs. The appearance of pseudo-polymorphs during crystallization is not a unique phenomenon. However, all the organic solvents, including ethanol, should be reduced below a certain level in crystals. This is regulated by the Good Manufacturing Practice (GMP), International Council for Harmonization, Q3C [1], and other quality standards. According to Q3C, the ethanol content must be restrained to less than 0.5%. On the other hand, hydrates can be used as drugs. The reproducibility of crystallization and the stability of drug substances must be guaranteed in the case of anhydrous and hydrated crystals.
Antibiotics with a β-lactam structure are often crystallized as hydrates. Hickey et al. reported, based on Physician’s Desk References (2006), that ~45% of β-lactam compounds on the market (e.g., cephalosporin and penicillin), exist as crystalline hydrates [2]. Meropenem [3] and imipenem [4], listed as carbapenems, were trihydrate and monohydrate, respectively. Crystalline doripenem, a carbapenem, exists as an anhydrate, monohydrate, and trihydrate [5]. Interestingly, owing to the ring strain in β-lactam structure, β-lactam compounds become weak [6], but several crystalline hydrates of β-lactam compounds are stable for hydrolysis in the solid state [2]. This means that crystal water may not be included in the hydrolysis of the β-lactam ring. However, in the crystallization of β-lactam compounds, there remains a question as to whether the compound dissolved in solution may be quickly degraded during crystallization. Vangala et al. found that, upon desolvation, cocrystal solvates of antibacterial agent nitrofurantoin produced novel anhydrous cocrystal. They suggested that cocrystal solvates could be an alternative route to prepare anhydrous cocrystals [7]. Their suggestion included the possibility that there may be a crystallization method suitable for unstable β-lactam compounds.
In this study, a carbapenem antibiotic, CS-023 with a β-lactam structure, was crystallized, in order to consider the recovery of a stable crystalline hydrate without CS-023 wastage based on degradation during crystallization.

2. Materials and Methods

2.1. Materials

Carbapenem (CS-023), with the chemical structure shown in Figure 1, was supplied by Daiichi Sankyo Co., Ltd. (Tokyo, Japan) [8,9]. The purity was determined to be 99.5% using a reverse-phase column based on the HPLC analysis and was used without further purification. Analytical reagent grade ethanol was bought from Wako Pure Chemical Industries (Osaka, Japan). Ultrapure water was prepared in the laboratory.

2.2. Crystallization

The cooling batch crystallization of CS-023 was carried out in an aqueous solution. We added 10 g of CS-023 to 50 mL of water and completely dissolved it by heating the solution to 70 °C. The solution was then filtered using a 0.2-μm membrane filter. The solution was immediately cooled to 25 °C under agitation using a magnetic stirrer. As the solubility of CS-023 in the water was 25.9 g/L at 25 °C and 280.1 g/L at 70 °C, the initial supersaturation ratio (C/Cs: C is the concentration of CS-023, and Cs is the solubility) was 7.7. After an induction period of ~1.5 h, crystals appeared. After 6.5 h, the crystals were filtered through a 0.2-μm membrane filter and dried at 25 °C and 1.2 kPa. This cooling crystallization process included two operations at 70 °C: complete dissolution of CS-023 and the filtration of possible sediments from the solution. At such a high temperature, there was the possibility that the CS-023 may significantly decompose during the operation. Moreover, CS-023 is unstable in an aqueous solution. This issue may be overcome in a small-scale experiment in a laboratory, but may not be possible in industrial-scale manufacturing.
Another crystallization process was conducted. Poor solvent crystallization was observed at a constant temperature of 25 °C. Ethanol was used as a poor solvent; 10 g of CS-023 was dissolved in water (400 mL) instead of dissolving at a high temperature, and 1600 mL of ethanol was then rapidly added as the solution was being stirred. As the solubility of CS-023 in water at 25 °C was low (as described above), a large volume of water was required to dissolve 10 g of CS-023. However, the solubility of CS-023 in 80 v/v% ethanol was even lower (0.277 g/L) at 25 °C. Therefore, we can consider a large initial supersaturation ratio of 18.1 to sufficiently recover large amounts of crystals. Crystals appeared immediately, and after 15 min, the crystals were filtered, washed with ethanol, and dried at 25 °C and 6.2 kPa.
The amorphous powder of CS-023 was prepared for controlling the crystals by freeze-drying the aqueous solution.

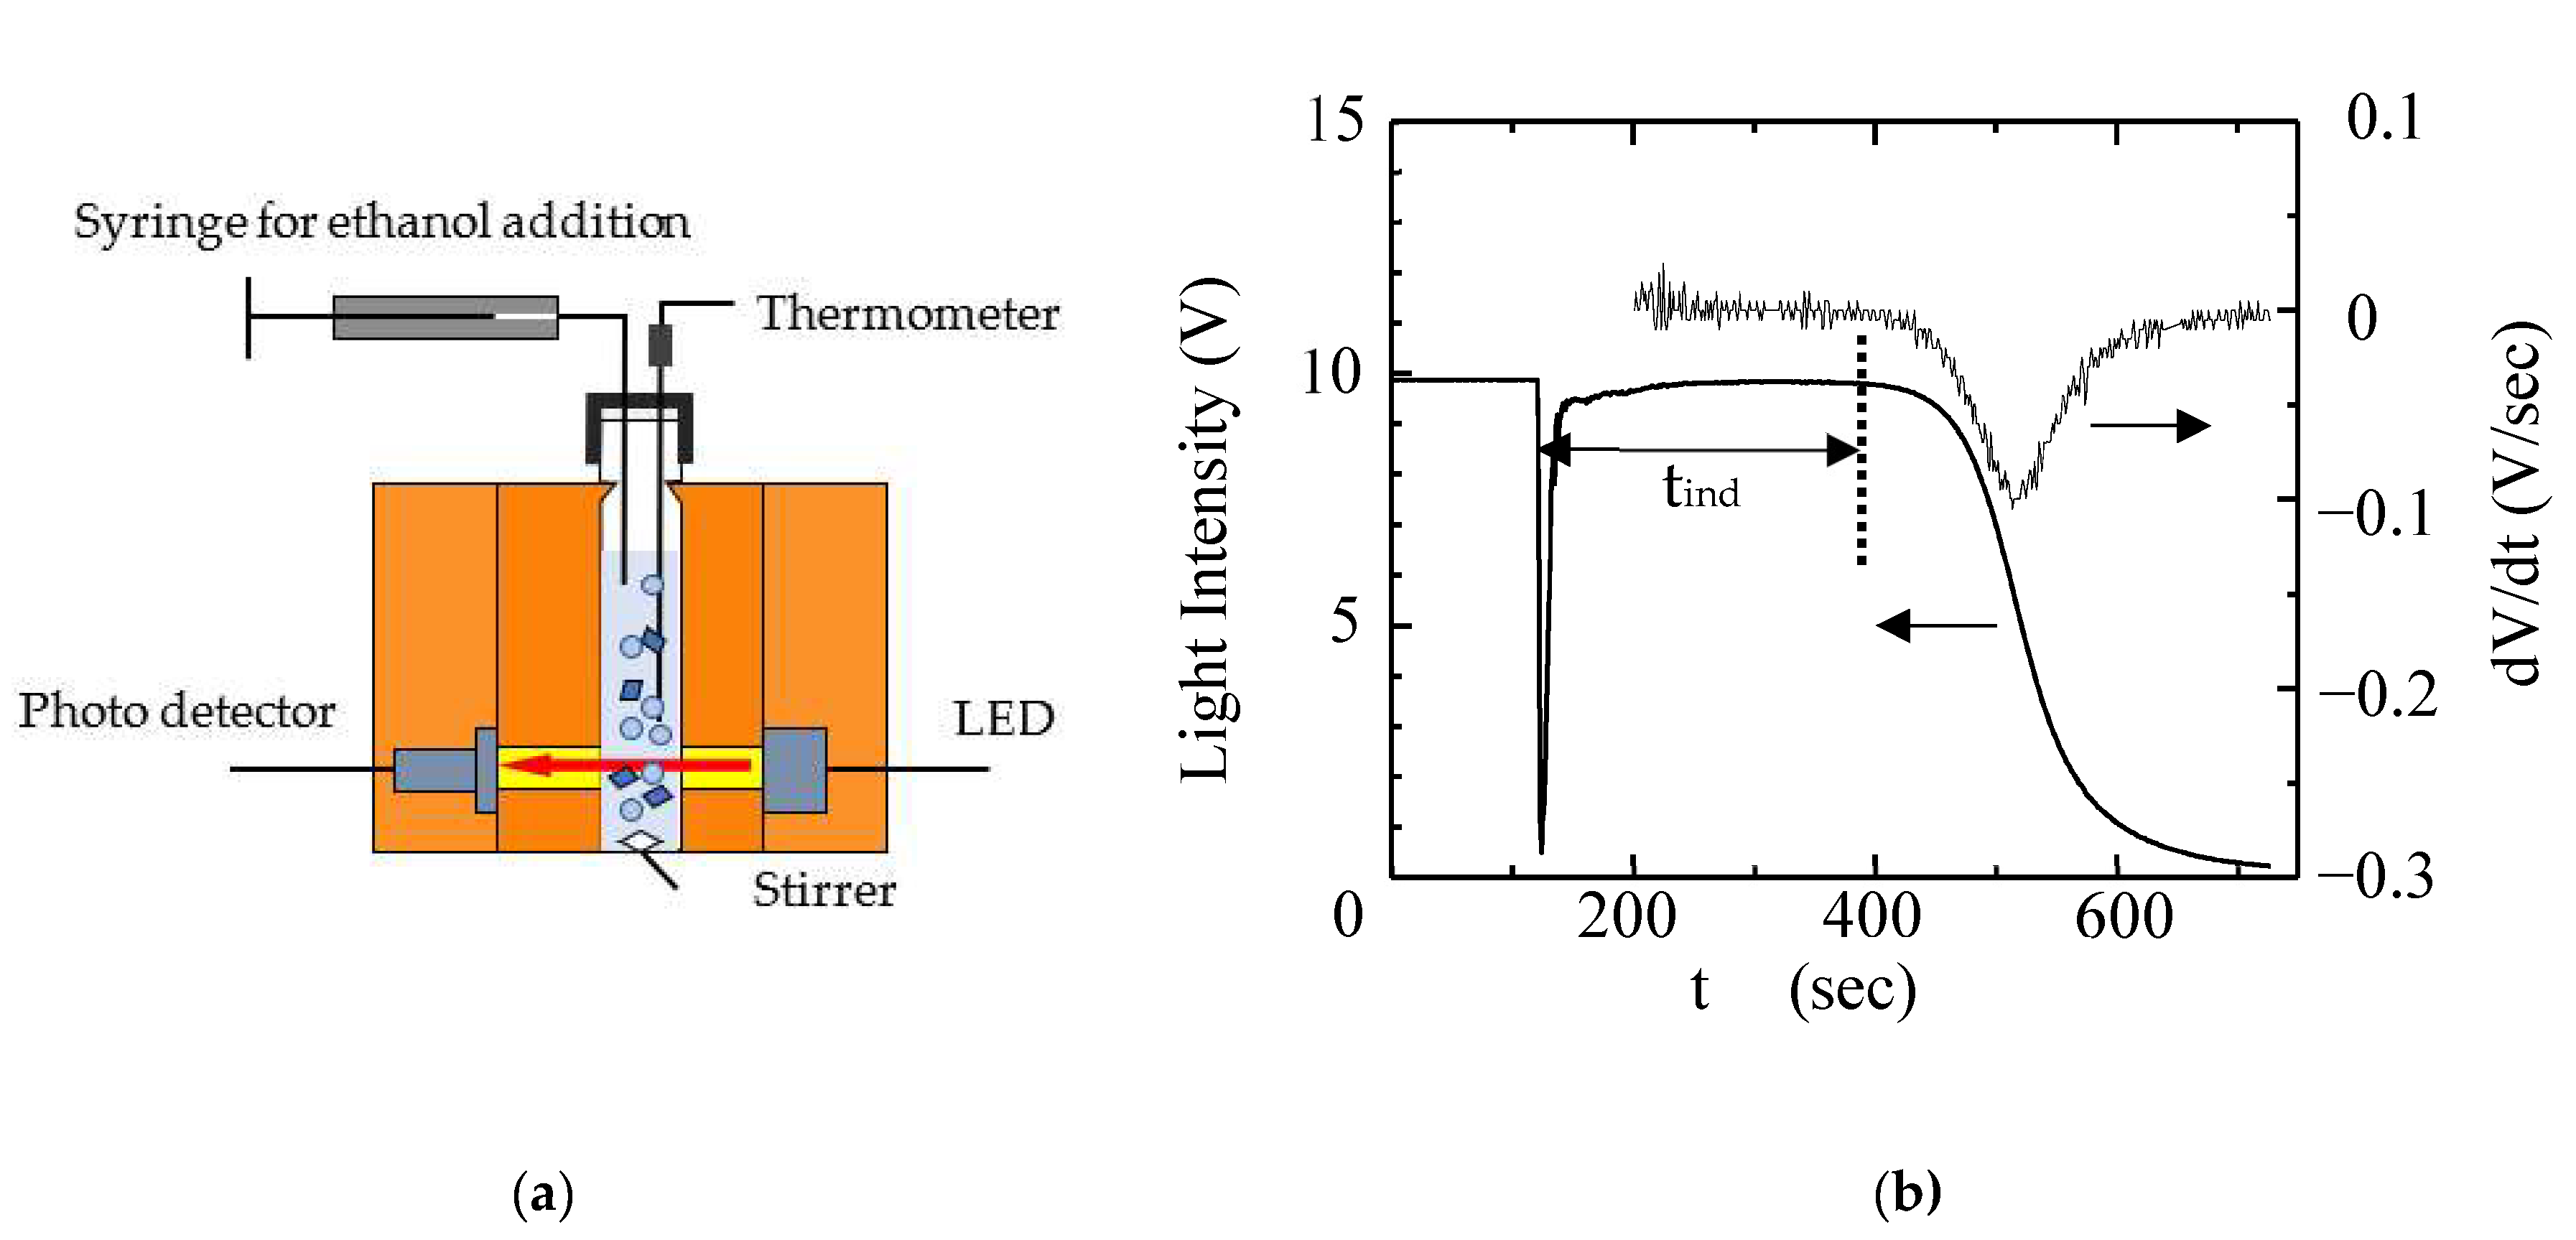
2.3. Determination of the Induction Period (tind)

The induction period was determined for the cooling crystallization and poor solvent crystallization. The experiment was performed under different supersaturation ratios, where the same experiments were repeated three times for each supersaturation ratio. The induction time was determined as the average of these results. The temperature of the solution was continuously measured, recorded, and controlled within a tolerance of ±0.1 °C using a Peltier element. Figure 2a presents a diagram of the apparatus used to measure the induction period. A specified amount of CS-023 crystals was placed in a 2-mL glass cell, and water was added. The slurry was rapidly heated to 80 °C and held for 90 s in order to dissolve the crystals. Subsequently, the slurry was rapidly cooled to 25 °C. Raising and lowering the temperatures took 90 and 120 s, respectively. In the poor solvent crystallization method, ethanol was added after cooling to 25 °C. The solution was agitated using a magnetic stirrer. In both the crystallization methods, the turbidity was recorded using a light transmittance measurement system equipped with a fiber probe attached to a digital amplifier (OPTEX FA Co., Ltd., Kyoto, Japan). The detection limit of turbidity was examined using a Formazin standard and determined to be 0.1 ppm for 1-μm particles. Figure 2b shows the light intensity change during poor solvent crystallization. When ethanol was added to the CS-23 aqueous solution, the light intensity rapidly dropped to zero, owing to the emission of air from ethanol into the ethanol/water mixture. The air emission was caused by the difference in the air solubility between ethanol and water. The composition of air dissolved in ethanol at 25 °C is potentially 22 times higher than that in water. The induction period is defined as the time from the quick-intensity drop point to the point at which the light intensity decreases. In cooling crystallization, the induction period began when the solution temperature reached 20 °C, although the temperature change was not observed.
In both the crystallization process, CS-023 was initially dissolved at 80 °C. This operation carries the risk that some amount of CS-023 may be decomposed. However, the incubation duration at 80 °C is 90 s; therefore, the degradation of CS-023 during the operation at 80 °C was estimated to be negligible.

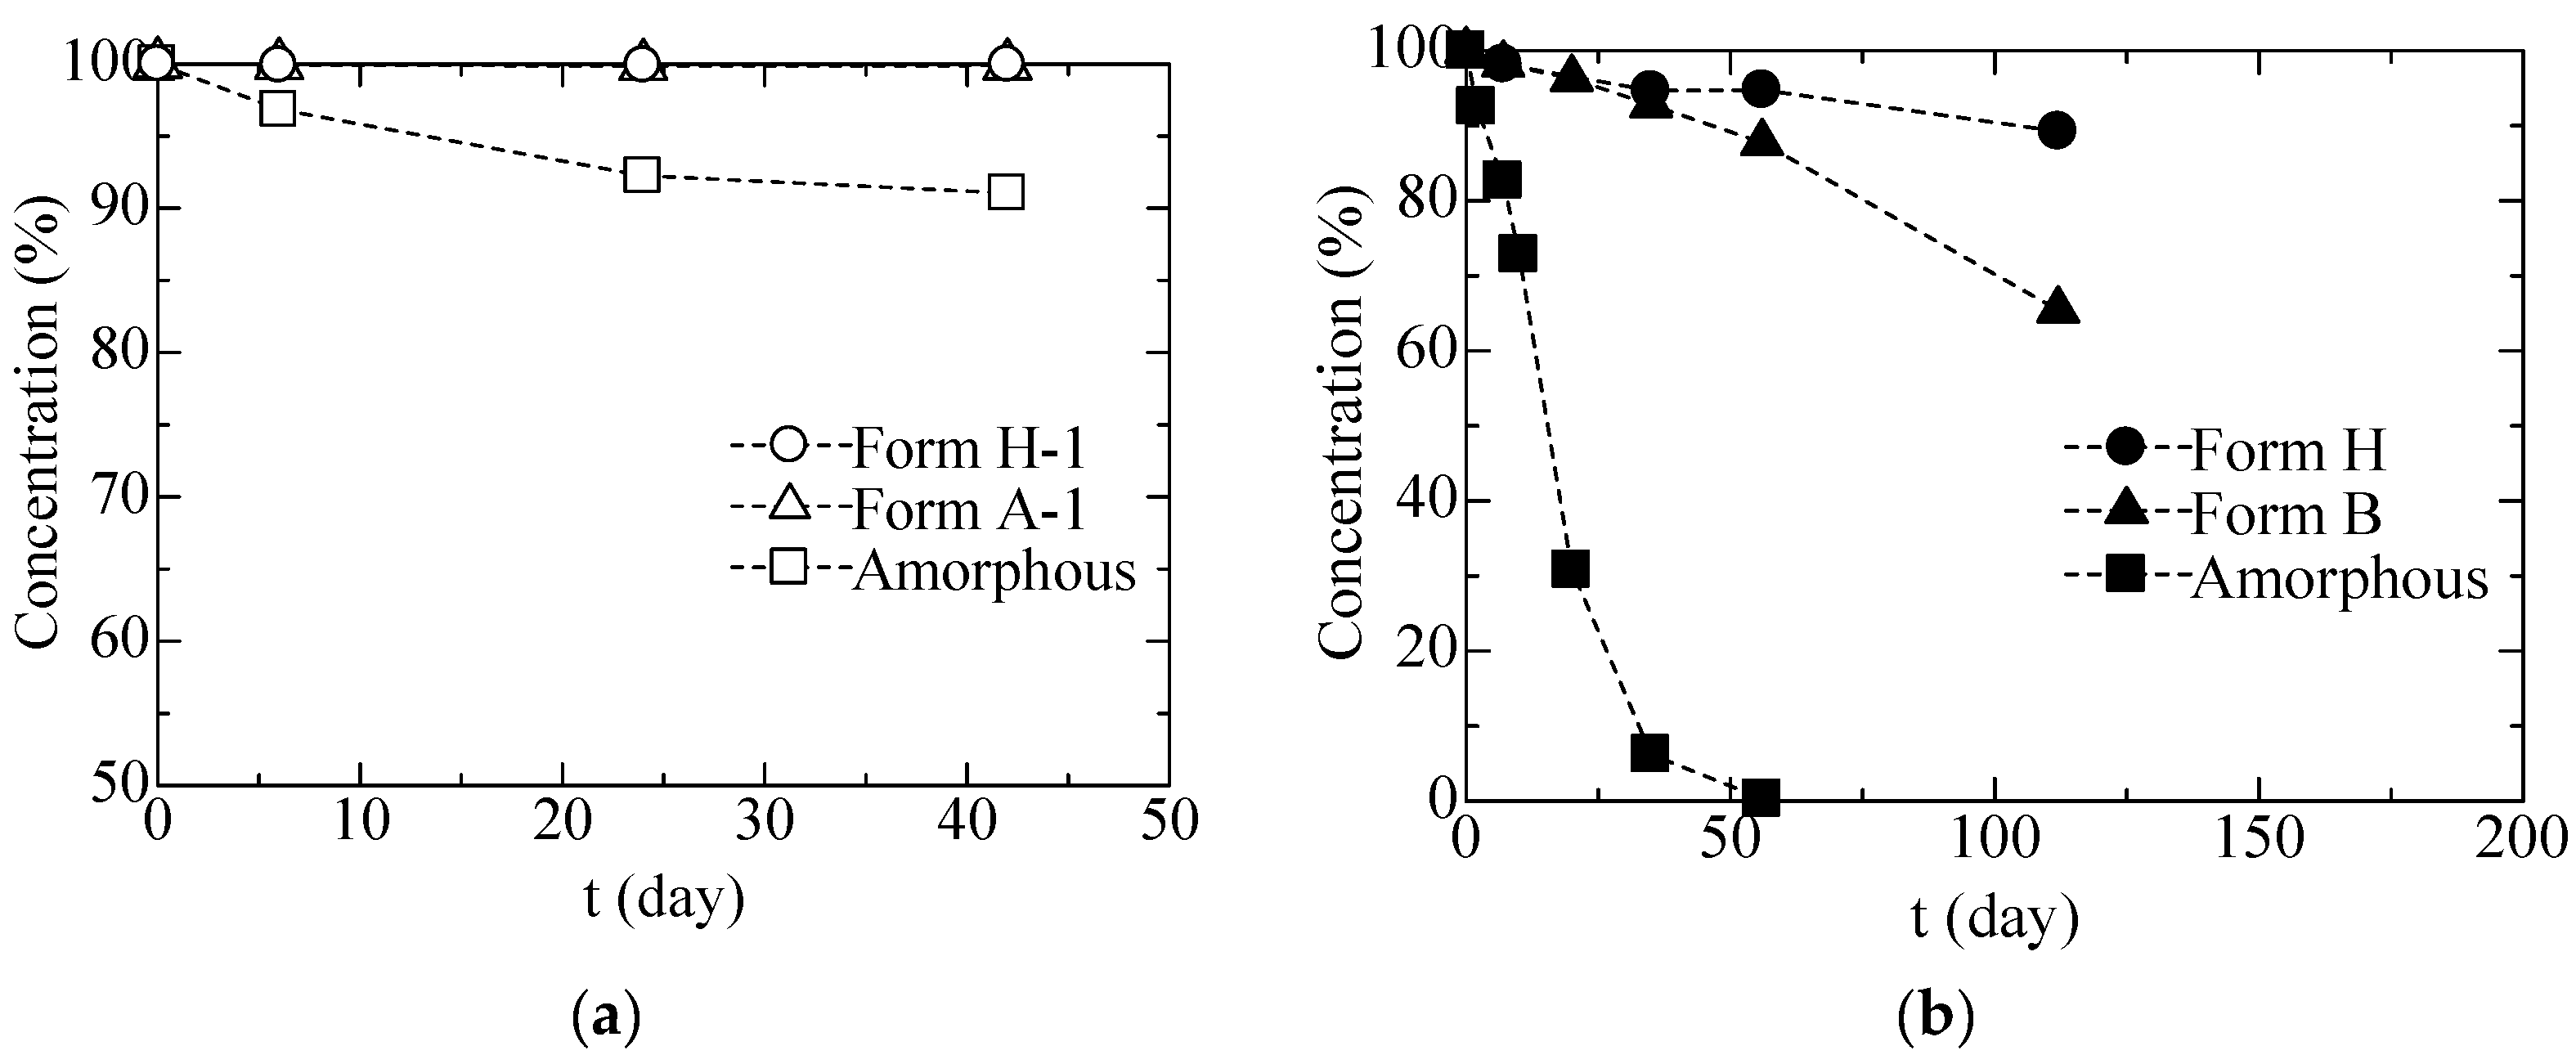
2.4. Measurement of the Stability of CS-023 Dissolved in Water and Crystalline Products

The stability of CS-023 was measured in an aqueous solution; 1 g of CS-023 was dissolved in 40 mL of water, and the solution was filtered using a 0.2-μm membrane filter; 2 mL of the solution was poured into a test tube and incubated at 40 °C in a water bath, stirred with a magnetic stirrer. Aliquots (20 μL) were withdrawn at a given interval, and the concentration of CS-023 was analyzed using HPLC.
The stability of the amorphous and crystalline solid of CS-023 was measured. Hickey et al. found that the hydrolysis of β-lactam crystals under a given humidity mostly occurs at the surface of the crystal [2]. Kishi and Matsuoka reported that the polymorphic transition of Theophylline Form I to Form II under dry conditions starts at the nucleation of Form II on the surface of Form I and penetrates Form I [10]. They successfully expressed the transition process of Form I using the penetration kinetics. These results suggest that the stability of solids may depend on the surface area of the particles (i.e., the particle size). In this study, to avoid the effect of the particle size on the stability of the solid, size-controlled particles were used to analyze stability. The size-controlled particles were prepared as follows: The solid slurry was pulverized with a wet jet mill (Nano Jet Pal JN 20, JOKOH, Co., Ltd., Tokyo, Japan), filtered, and dried to prepare the sample. For drying, the methods described in Section 2.2 were adopted. A laser diffraction analyzer (LA 960, HORIBA Ltd., Kyoto, Japan) was used to measure the particle size. Thus, particles with a median diameter of 6.2 ± 0.2 μm were used to analyze the stability of the solid stability. Following this, 1 g of the solid was placed in a glass container without a lid and allowed to stand in a temperature-controlled incubator under given humidity; 50 mg of the solid sample was dissolved in 50 mL of water and was immediately analyzed using HPLC.

2.5. Thermal Analysis

Thermogravimetry (TG) differential thermal analysis was performed using an EXSTAR TG/DTA7200 (Hitachi High-Technologies Co., Tokyo, Japan). The samples (20–30 mg) were placed on open aluminum pans and heated from 25 to 180 °C at a rate of 10 °C/min under a nitrogen flow of 100 mL/min to measure the weight loss before melting at 190 °C.
Substances that lost weight during thermal gravimetric analysis were identified separately. Each sample of CS-023 solids was heated at a rate of 5 °C/min using a shelf-type dryer; after reaching 100, 120, and 150 °C, the amount of water and ethanol in the solid was determined using Karl Fisher titrator MKA-610 (Kyoto Electronics MFG. Co., Ltd., Kyoto, Japan) and gas chromatography (6890N, Agilent Technologies, Santa Clara, CA, USA) with headspace sampler G1880 (Agilent Technologies, Santa Clara, CA, USA).

2.6. Phase Transition on Instrumental Analysis

A powder X-ray diffraction (PXRD) device considering an adjustable temperature and humidity was used for the phase transition experiment. The PXRD patterns were derived using BrukerD8 Advance (Bruker AXS GmbH, Karlsruhe, Germany) with Cu K_ radiation (1.5418 Å) at 40 kV and 40 mA. The patterns were recorded between 2° and 42° considering a step of 0.02°. For the in situ temperature and humidity diffraction measurements, a domed hot-stage DHS900 (Anton Paar, Graz, Austria) was attached. Humidity was controlled using SRG-1R (SHINEI, Kobe, Japan) at 25 °C.

2.7. Phase Transition by Absorption and Emission of Water and Ethanol

Vapor absorption and emission isotherms of crystalline materials were determined using DVS advantage-1 (Surface Measurement Systems Ltd., London, UK) in the relative humidity range of 0–95% at intervals of 5%. The equilibrium criterion for each step is that the weight change should be less than 0.001% for 5 min.

3. Results and Discussion

3.1. Cooling Crystallization Based on an Aqueous Solution

As described in the introduction section, it is important for crystals of the drug substance to contain no organic solvent beyond the regulation level. Therefore, cooling crystallization based on an aqueous solution was attempted initially.

3.1.1. Crystal Polymorphs Obtained using Cooling Crystallization

Figure 3 shows the CS-023 crystals obtained using cooling crystallization. Approximately 80% of the crystals were agglomerated, and the size was ~30 μm. Figure 4 shows the TG diagram of crystals obtained using cooling crystallization as a solid curve, as well as the results for crystals obtained by poor solvent crystallization. The weight loss shown by the solid curve was analyzed using a separate experiment that is described in the experimental section of this paper. It was confirmed that the weight loss is caused by the emission of water, and the amount is the equivalent of 4.3 water molecules per one CS-023 molecule. This result suggests that the crystals were tetrahydrate. The tetrahydrate crystal was named as polymorph Form H. However, there are questions which remain. The value of 4.3 was not expected. A part of the weight loss may have been caused by water being tightly adsorbed on the outer surface of the crystals (and not by crystal water) and/or water being incorporated between agglomerated crystals. Figure 5 shows the PXRD pattern of Form H, and the pattern is compared with that of the amorphous powder. Moreover, Figure 5 shows the XRD data for other polymorphs obtained using poor solvent crystallization, but the details are not explained here. Figure 6 shows the water emission and absorption isotherms in the humidity range of 0–90% RH, which were determined for the crystals obtained from the aqueous solution, where the solid and dotted curves represent the emission and absorption isotherms, respectively. A slow emission of water from 90% RH was observed at 21% RH. This can be estimated as a change corresponding to the desorption of water from the surface of the crystals and/or water being incorporated between agglomerated crystals. This confirms that Form H is a tetrahydrate crystal; namely, CS-023. 4H2O. Figure 6 shows that the water content decreases from 13.4% based on the mass of CS-023 at 21% RH to 0 at 0% RH. The anhydrous solid obtained at 0% RH exhibited a crystalline structure, as confirmed by the XRD data explained below. The crystalline solid obtained at 0% was named Form H-1. Form H-1 absorbed water, which increases humidity, and transformed into Form H. Figure 7 shows the changes in the XRD patterns corresponding to the reversible change from Form H to Form H-1 and again to Form H. The XRD patterns changed as follows: (bottom) the original crystal Form H at 80% RH, (the third from the bottom) Form H-1 at 0% RH, and (the top) the restored Form H at 80% RH. The change in the XRD pattern is consistent with the water emission and absorption isotherms shown in Figure 6. The XRD pattern of Form H-1 was similar to that of Form H. This means that the emission of crystal water did not significantly change the solid structure. The peaks of Form H-1 in the range of 2θ from 10° to 15° shifted toward the direction presenting a shorter distance between the adjacent lattice layers. The changes in the distance between the adjacent layers are caused by the emission of the crystal water. Afterward, these peaks returned to the original positions of Form H when the humidity was adjusted to >50% RH. This means that Form H-1 became Form H again. These results show that the solid phase transition between Form H and Form H-1 is reversible, depending on the humidity.

3.1.2. Stabilities of CS-023 Molecules in Aqueous Solution and the Polymorph Form H Crystal

Hydrate can be used as a drug, if it is stable against hydrolysis, oxidation and photodegradation [11]. As such, the stabilities of CS-023 molecules, amorphous solid and polymorph Form H were examined in an aqueous solution or under given humidity.
Figure 8a,b present the stability of CS-023 in water, where C is the concentration of CS-023 and C0 is the initial concentration. The stability in 80 v/v% ethanol is also presented in Figure 8b and is discussed below. Figure 8a,b show that the degradation rate of CS-023 does not depend on the initial concentration, but instead depends on the temperature and solvent. The higher the temperature, the faster the degradation rate becomes. Figure 8 suggests that the degradation rate can be expressed with the first order kinetics, namely:
dC/dt = kdC
where kd is the degradation rate constant. The degradation rate constant can be estimated to be 8.6 × 10⁻³ h−1 at 25 °C and 0.23 h−1 at 70 °C in water from the slope of each straight line, as shown in Figure 8b. This means that the half-life period, τ1/2 of degradation is 80.6 h at 25 °C and 2.97 h at 70 °C. CS-023 dissolved in water at 70 °C is 27 times more unstable than at 25 °C.
Figure 9a,b present the stability of solid CS-023 at 40 °C under 0% RH and 75% RH, respectively. In Figure 9, the data for other polymorphs obtained later were also presented. The crystalline solid, Form H-1 was stable under 0% RH. The amorphous solid was degraded even at 0% RH and the degradation product was identified as a mixture of hydrolyzed CS-023 and a dimer of CS-023, as shown in Figure 10. Hydrolysis of the amorphous solid at 0% RH may be caused by water being tightly adsorbed on CS-023 powder. Form H was 10% degraded at 100 days under 75% RH. According to the chemical analysis of the degradation product, the degradation was hydrolysis at the β-lactam site. Amorphous powder of CS-023 was more quickly degraded under 75% RH, and the ratio of hydrolysis at the β-lactam site was 90%, with the other being a dimer.

3.2. Poor Solvent Crystallization

Form H was moderately stable against hydrolysis, but the CS-023 molecules dissolved in water were unstable at a high temperature, 70 °C, that was a condition of the cooling crystallization. Another crystallization process with poor solvent crystallization was then developed for recovering Form H.

3.2.1. Appearance of New Polymorph Form A

Poor solvent crystallization was observed at 25 °C by adding ethanol to an aqueous solution. The working concentration of ethanol in crystallization was 80 v/v%. It was found in Figure 8b that the degradation of CS-023 in 80 v/v% ethanol was faster than that in water. The main degradation was alcoholysis at the guanidyl group of CS-023, although the chemical structure of the degradation product is not shown here. A part of the degradation, 7.3%, was hydrolysis. Thus, the degradation of CS-023 molecules in 80 v/v% ethanol may be severe in the manufacturing of CS-023 crystals. On the other hand, the induction period in the poor solvent crystallization was short, and the crystallization ended in a short time. These results suggest that the degradation of CS-023 molecules during the poor solvent crystallization is neglectable.
Figure 11 presents an optical micrograph of crystals obtained by the poor solvent crystallization. As described above, the initial supersaturation ratio in the poor solvent crystallization was large, at 18.1. Furthermore, the crystallization was completed within a short time frame of only 15 min. Figure 12 shows that the induction period in the poor solvent crystallization is shorter than that in the cooling crystallization. These facts lead us to expect the fast nucleation rate and formation of many tiny crystals in the poor solvent crystallization. Despite this expectation, large crystals were obtained. The total mass of crystals recovered in both the crystallizations was almost identical, namely 8.71 and 9.45 g, respectively. Therefore, the slow nucleation and fast crystal growth must explain the large crystals that are shown in Figure 11. It is noted that the inverse of the induction period is not always in proportion to the nucleation rate. However, this is what has been assumed for the simple expression of nucleation event in the classical theory of homogeneous nucleation, which takes ideal steady-state conditions and predicts primary nucleation once supersaturation is achieved [12]. Instead, it is essential to understand what is happening in the supersaturated solution during the induction period. In previous work [13], a long induction period of 17 h was observed in the cooling crystallization of p-acetanisidide, but once crystals appeared, the crystallization ended rapidly. During the induction period before nucleation, the solute molecules were making aggregates using intra- and inter-molecular interactions, such as hydrogen bonding, and the structure of the molecular aggregates was similar to that of crystals, but not the same. This observation strongly suggested that the structure of the molecular aggregates needs to change to the structure of crystals in order to nucleate some time. In the crystallization of drug substances [14,15], the appearing polymorph was controlled by the conformation of solute molecules in the solution. The repeated crystallization using the same supersaturated solution made the nucleation smooth, accompanied by a short induction time [16]. This was explained with the formation of an optimal solution structure for nucleation. The slow nucleation in the poor solvent crystallization may be considered from the viewpoint of the solution structure as follows: when ethanol was quickly added to aqueous CS-023 solution, the conformation of CS-023 molecules and structure of molecular aggregates formed in water may not quickly change to those that must be reconstructed in 80 v/v% ethanol. As a result, the nucleation of new crystals was delayed, causing the formation of large crystals.
The XRD pattern of the crystals recovered in the poor solvent crystallization showed the new polymorphic crystal, Form A, as shown in Figure 5. The TG data was also presented in Figure 4 (dotted curve). Form A can be identified as a solvate of 5/2 ethanol and 1/2 hydrate, namely CS-023. 5/2EtOH. 1/2H2O. Unfortunately, Form A is not suitable for drugs because it contains ethanol in the crystal. The transition of Form A to another polymorph was then conducted.

3.2.2. Solid Phase Transition of Form A to a New Hydrate Crystal Form B

As Form A must be avoided being suspended in an ethanol solution for a long time, the solid phase transition was attempted. Figure 13 presents the diagram of the transition of Form A to Form A-1 (CS-023. 1/2EtOH. 1/2H2O). Form A released two ethanol molecules under less than 30%-saturated ethanol vapor pressure. The XRD pattern of Form A-1 was presented in Figure 14 (b; the second from the bottom). Form A-1 reversely returned to Form A over 70%-saturated ethanol vapor pressure. Form A-1 never changed to another polymorph due to the humidity and ethanol partial pressure control. At attempt was made to heat to the temperature just before melting. When Form A-1 was heated to 170 °C, it released all crystal ethanol and water and became the dry powder. The dry powder was not amorphous, as the XRD pattern showed a crystalline structure in Figure 14 (the pattern, c) and named Form A-2. The XRD pattern of Form A-2 at 25 °C (pattern, d) looks the same as that measured at 170 °C, except for a slight shift of peaks appearing at the diffraction angle over 18°. The shift suggested that the spaces corresponding to those peaks were expanded. Form A-2 was placed under controlled humidity at 25 °C. Form A-2 then changed to Form B when the humidity was over 30% RH. The XRD pattern of Form B is presented in Figure 14 (the pattern, e). Form B is reversely returned to Form A-2 under 30% RH. Thus, the new hydrate crystal, Form B (CS-023. 3/2 H2O), was prepared. The stability of Form B was examined and found to be less stable than Form H at 75% RH, as shown in Figure 8b. Unfortunately, we concluded that Form B is not suitable for a drug. However, Form B quickly changes to the tetrahydrate Form H by placing it in water or a high humidity circumstance over 80% RH, as shown in Figure 13 and Figure 15. The XRD pattern of the restored Form H was shown in Figure 14 (pattern, f). The pattern “g” is the one initially determined for the crystals (Form H), recovered from the cooling crystallization from an aqueous solution.
The crystallization process shown in Figure 12 does not include the steps at which the degradation of CS-023 is significant. The purity of the starting polymorph, Form A, was 99.6% determined with HPLC, and the purity of finally obtained polymorph Form H was the same as Form A, at 99.6%. The purity of CS-023 was 99.5%, as described in the material section. The increase in purity observed in Form A and Form H is due to the purification effect of crystallization.
Furthermore, this process is composed of the clear and simply-controllable solid phase transition.

4. Conclusions

Cooling crystallization of a carbapenem CS-023 was performed at 25 °C in an aqueous solution. Tetrahydrate crystals (Form H) were obtained. Hydrate crystals are promising drugs, but there is a problem in manufacturing such crystals. In the cooling crystallization, a dissolution process at a high temperature of 70 °C was included. As the solubility of CS-023 in water is high even at the crystallization temperature of 25 °C, a large amount of CS-023 must be initially dissolved in water at a high temperature in order to obtain enough product. The main problem was that the degradation rate of CS-023 at 70 °C was high, as expressed in the half-life period of 2.97 h. The stability of the amorphous and crystalline solid of CS-023 was examined, where size-controlled particles (6.2 ± 0.2 μm in a median diameter) were used to analyze the stability of the solids. This was done because it was suggested in previous articles that the stability of solids may depend on the surface area of the particles (i.e., the particle size). The amorphous CS-023 solid was unstable, as shown in Figure 9a. On the other hand, form H was stable enough to develop as a drug, as shown in Figure 9b.
Poor solvent crystallization using ethanol was observed at 25 °C as another process. Another polymorph (Form A) was obtained. Form A was comprised of CS-023, 5/2 ethanol, and 1/2 H2O.
Form A containing ethanol is not suitable as a drug. It was then transformed to another polymorph of hydrate crystals or tetrahydrate (Form H). Another hydrate polymorph, Form B, was obtained through the solid phase transformation. This process was shown in Figure 13. Form B was further transformed at a high humidity over 80% RH to the tetrahydrate Form H. The transition process was expressed in Figure 13.
This process, which proceeded at the low temperature of 25 °C, helped to prevent the degradation of CS-023, thereby avoiding wastage. Furthermore, the solid-phase transition could be controlled with vaper composition.

Author Contributions

Writing—original draft, S.M.; Writing—review & editing, K.I., M.A. and H.O. All authors have read and agreed to the published version of the manuscript.

Funding

This research received no external funding.

Institutional Review Board Statement

Not applicable.

Informed Consent Statement

Not applicable.

Data Availability Statement

Data can be obtained by contacting the corresponding author.

Acknowledgments

The authors would like to thank Daiichi Sankyo Co., Ltd., Tokyo, Japan for supplying CS-023.

Conflicts of Interest

The authors declare no conflict of interest.

References

  1. International Council for Harmonisation of Technical Requirements for Pharmaceuticals for Human Use, Q3C. Impurities: Guideline for Residual Solvents. Available online: https://www.pmda.go.jp/int-activities/int-harmony/ich/0043.html (accessed on 18 July 2021).
  2. Hickey, M.B.; Peterson, M.L.; Manas, E.S.; Alvarez, J.; Haeffner, F.; Almarsson, Ö. Hydrates and Solid-State Reactivity, A Survey of β-Lactam Antibiotics. J. Pharm. Sci. 2007, 96, 1090–1099. [Google Scholar] [CrossRef] [PubMed]
  3. Takeuchi, Y.; Takebayashi, Y.; Sunagawa, M.; Isobe, Y.; Hamazume, Y.; Uemura, A.; Noguchi, T. The stability of a novel carbapenem antibiotic, meropenem (SM-7338), in a solid-state formulation for injection. Chem. Pharm. Bull. 1993, 41, 1998–2002. [Google Scholar] [CrossRef] [PubMed] [Green Version]
  4. Needham, F.; Crowder, C.E.; Reid, J.W.; Fawcett, T.G.; Faber, J. X-ray powder diffraction analysis of imipenem monohydrate. Powder Diffr. 2012, 27, 20–24. [Google Scholar] [CrossRef]
  5. Valentina, C.; Norberto, M.; Giovanni, P. Crystal Chemistry of the Antibiotic Doripenem. J. Pharm. Sci. 2014, 103, 3641–3647. [Google Scholar]
  6. Nangia, A.; Biradha, K.; Desiraju, G.R. Correlation of biological activity in β-lactam antibiotics with Woodward and Cohen structural parameters: A Cambridge database study. J. Chem. Soc. Perkin Trans. 2 1996, 5, 943–953. [Google Scholar] [CrossRef]
  7. Vangala, V.R.; Chow, P.S.; Tan, R.B.H. The solvates and salt of antibiotic agent, nitrofurantoin: Structural, thermochemical and desolvation studies. CrystEngComm 2013, 15, 878–889. [Google Scholar] [CrossRef]
  8. Kawamoto, I.; Shimoji, Y.; Kanno, O.; Kojima, K.; Ishikawa, K.; Matsuyama, E.; Ashida, Y.; Shibayama, T.; Fukuoka, T.; Ohya, S. Synthesis and structure-activity relationships of novel parenteral carbapenems, CS-023 (R-115685) and related compounds containing an amidine moiety. J. Antibiot. 2003, 56, 565–579. [Google Scholar] [CrossRef] [PubMed] [Green Version]
  9. Shibayama, T.; Sugiyama, D.; Kamiyama, E.; Tokui, T.; Hirota, T.; Ikeda, T. Characterization of CS-023 (RO4908463), a Novel Parenteral Carbapenem Antibiotic, and Meropenem as Substrates. Drug Metab. Pharmacokinet. 2007, 22, 41–47. [Google Scholar] [CrossRef] [PubMed] [Green Version]
  10. Yoshifumi, K.; Masakuni, M. Surface Phenomena and Mechanism of Polymorphic Transition in Theophylline. J. Chem. Eng. Jpn. 2010, 43, 253–260. [Google Scholar]
  11. Loftsson, T. Drug Stability for Pharmaceutical Scientists, 1st ed.; Academic Press: Oxford, UK, 2014; pp. 63–102. [Google Scholar]
  12. Mullin, J.W. Crystallization, 4th ed.; Butterworth-Heinemann: Oxford, UK, 2001; pp. 181–215. [Google Scholar]
  13. Saito, A.; Igarashi, K.; Azuma, M.; Ooshima, H. Aggregation of p-Acetanisidide Molecules in the Under- and Super-saturated Solution and Its Effect on Crystallization. J. Chem. Eng. Jpn. 2002, 35, 1133–1139. [Google Scholar] [CrossRef]
  14. Maruyama, S.; Ooshima, H.; Kato, J. Crystal structures and solvent-mediated transformation of Taltirelin polymorphs. Chem. Eng. J. 1999, 75, 193–200. [Google Scholar] [CrossRef]
  15. Hirano, M.; Igarashi, K.; Machiya, K.; Tamura, R.; Tue, H.; Ooshima, H. Relationship between Crystal Polymorphism and Solution Structure of an Imidazopyridine Derivative as a Drug Substance for Osteoporosis. J. Chem. Eng. Jpn. 2009, 42, 204–211. [Google Scholar] [CrossRef]
  16. Xing, Z.; Igarashi, K.; Morioka, A.; Ooshima, H. Repeated Cooling Crystallization for Production of Microcrystals with a Narrow Size Distribution. J. Chem. Eng. Jpn. 2012, 45, 811–815. [Google Scholar] [CrossRef] [Green Version]
Figure 1. Chemical structure of CS-023.
Crystals 11 00931 g001
Figure 2. (a) Apparatus to measure the induction time; (b) Light intensity change to determine induction period (tind) in the poor solvent crystallization.
Crystals 11 00931 g002
Figure 3. Optical micrograph of crystals obtained using cooling crystallization based on the aqueous solution.
Crystals 11 00931 g003
Figure 4. TG diagrams of crystals obtained from aqueous solution (solid curve) and 80% ethanol solution (dotted curve). Refer to the text about the belonging of weight.
Crystals 11 00931 g004
Figure 5. Powder XRD patterns of amorphous CS-023 and three kinds of polymorphs.
Crystals 11 00931 g005
Figure 6. Emission isotherm of water pertaining to Form H (solid curve) and absorption isotherm of water pertaining to Form H-1 (dotted curve).
Crystals 11 00931 g006
Figure 7. Reversible transition between Form H and Form H-1 shown in PXRD patterns. XRD patterns: (the bottom) the original Form H, (the third from the bottom) Form H-1 at zero % RH, and (the top) the restored Form H.
Crystals 11 00931 g007
Figure 8. Stability of CS-023 in aqueous solution and 80 v/v% ethanol solution: (a) Dependence on initial concentration of CS-023, (b) Dependence on temperature.
Crystals 11 00931 g008
Figure 9. Stability of solid CS-023 at 40 °C under humidity at: (a) 0% RH, (b) 75% RH.
Crystals 11 00931 g009
Figure 10. Chemical structure of the degradation product of amorphous CS-023, dimer, recovered after incubation at 0% RH.
Crystals 11 00931 g010
Figure 11. Optical micrograph of Form A obtained by the poor solvent crystallization from 80 v/v% ethanol.
Crystals 11 00931 g011
Figure 12. Induction period, tind, in the cooling and poor solvent crystallization at 25 °C.
Crystals 11 00931 g012
Figure 13. A solid-phase transition diagram from Form A prepared by poor solvent crystallization to Form H.
Crystals 11 00931 g013
Figure 14. XRD patterns of polymorphs appeared during transition of Form A to Form H; (a) Form A, at the start of standing in 80% EtOH partial pressure environment, (b) Form A-1, standing at a partial pressure of 0% RH, (c) Form A-2, at 170 °C, (d) Form A-2, at 25 °C, (e) Form B, standing at 70% RH, (f) Form H, standing at 90% RH, (g) Form H, as a reference.
Crystals 11 00931 g014
Figure 15. Water absorption of Form A-2 along the dashed-dotted curve. Form A-2 finally changed to Form H via Form B at 25 °C.
Crystals 11 00931 g015
Publisher’s Note: MDPI stays neutral with regard to jurisdictional claims in published maps and institutional affiliations.

