Article

N-Doped Carbon Quantum Dots as Fluorescent Bioimaging Agents

1
Department of Mold and Die Engineering, National Kaohsiung University of Science and Technology, Kaohsiung 80778, Taiwan
2
Department of SeaFood Science, National Kaohsiung University of Science, Kaohsiung 81157, Taiwan
3
Department of Safety, Health, and Environmental Engineering, National Kaohsiung University of Science and Technology, Kaohsiung 81164, Taiwan
4
Department of Chemical Engineering and Materials Science, Yuan Ze University, Taoyuan 32003, Taiwan
5
Department of Chemical and Materials Engineering, Chang Gung University, Guishan, Taoyuan 33302, Taiwan
6
Division of Nephrology, Department of Internal Medicine, Chung Gung Memorial Hospital, Linkou, Taoyuan 333, Taiwan
*
Author to whom correspondence should be addressed.
Crystals 2021, 11(7), 789; https://doi.org/10.3390/cryst11070789
Submission received: 23 May 2021 / Revised: 26 June 2021 / Accepted: 5 July 2021 / Published: 6 July 2021
(This article belongs to the Special Issue Nanocarbon Materials for Biological Application)

Abstract

:
Graphene quantum dots, carbon nanomaterials with excellent fluorescence characteristics, are advantageous for use in biological systems owing to their small size, non-toxicity, and biocompatibility. We used the hydrothermal method to prepare functional N-doped carbon quantum dots (N-CQDs) from 1,3,6-trinitropyrene and analyzed their ability to fluorescently stain various bacteria. Our results showed that N-CQDs stain the cell septa and membrane of the Gram-negative bacteria Escherichia coli, Salmonella enteritidis, and Vibrio parahaemolyticus and the Gram-positive bacteria Bacillus subtilis, Listeria monocytogenes, and Staphylococcus aureus. The optimal concentration of N-CQDs was approximately 500 ppm for Gram-negative bacteria and 1000 ppm for Gram-positive bacteria, and the exposure times varied with bacteria. N-Doped carbon quantum dots have better light stability and higher photobleaching resistance than the commercially available FM4-64. When excited at two different wavelengths, N-CQDs can emit light of both red and green wavelengths, making them ideal for bioimaging. They can also specifically stain Gram-positive and Gram-negative bacterial cell membranes. We developed an inexpensive, relatively easy, and bio-friendly method to synthesize an N-CQD composite. Additionally, they can serve as a universal bacterial membrane-staining dye, with better photobleaching resistance than commercial dyes.

1. Introduction

Graphene quantum dots (GQDs) are a three-dimensional material made of graphene or graphite and other graphite derivatives and are synthesized using top–down methods [1,2,3,4]. The material usually has a layered structure, with a lateral size of up to 20 nm [4,5]. The physical and chemical characteristics of GQDs are the same as those of graphene. Graphene quantum dots formed from graphene sheets have a lateral size of <20 nm; however, as the sheets are prepared using the bottom–up method, the maximum size reached is less than 10 nm [6]. Carbon nanodots (CDs) of a diameter less than 10 nm are also called carbon quantum dots (CQDs) [7].
Carbon quantum dots have potential applications in biomedicine [3,8,9,10,11,12] owing to their attractive fluorescent properties such as photostability and excitation-related emission. Recently, they have been increasingly used as nanometers in sensing, photocatalysis, and optoelectronics [3,13,14,15,16,17,18]. Carbon quantum dots not only exhibit excellent optical properties of traditional semiconductors but also offer advantages of low cytotoxicity and less environmental hazards [19,20,21,22,23,24,25]. They can be multifunctionally conjugated with other nanoparticles. Such quantum dots have favorable water solubility, biocompatibility, and size; moreover, they are easy to modify and inexpensive to produce. Carbon nanodots, GQDs, and polymer dots possess similar photoelectrochemical properties, despite differences in size and the internal and surface structures [10,26,27]. For these materials to fluoresce effectively, their size and surface chemical groups must be carefully modulated to fine-tune the electronic structures.
The most attractive feature of CQDs is their photoluminescent (PL) property [28,29]. Due to the π-π* transition of the sp2-conjugated carbon and the n-π* transition of hybridization with N, S, P, N, and other atoms, the absorption peak of CQDs falls within the ultraviolet–visible (UV–vis) region [30].
Carbon nanodots from different materials have been developed for fluorescent labeling in various bacterial species. Wang et al. used fluorine-doped carbon nitride (FC3N4) powder as the precursor and ethylene glycol as the solvent to synthesize quantum dots at a large scale using a simple glycol-assisted ultrasonic method [31]. They produced a high-quality FC3N4 quantum dot of uniform size 1.5–2.0 nm. Doping FC3N4 with fluorine can adjust its band gap, thereby changing the emission peak position (434.5 nm) and increasing the fluorescence intensity. It could be used as a blue, fluorescent probe for Escherichia coli; however, the fluorescent images differed in brightness and were unsuitable for detecting bacterial infection. Weng et al. used a simple dry heating method to synthesize mannose-modified fluorescent CQDs (Man-CQDs) from solid citrate amine and mannose [32]. The average Man-CQD particle size was 3.1 ± 1.2 nm; Man-CQDs showed high solubility, with excitation and emission wavelengths of 365 and 450 nm, respectively. Fluorescent Man-CQDs can stain E. coli K12 flagella. The combination of E. coli FimH and its ligand mannose enabled to quantitatively detect bacteria in laboratory samples with as few as 450 colony-forming units.
Das et al. heated gram shells at 315 °C for 3 h to synthesize CDs that could bind to bacterial cell surfaces and performed multicolor imaging of E. coli cells after incubating the cells with the CDs for 3 h [33]. Pal et al. prepared N-doped CDs from a mixture of curcumin and polyethyleneimine using a hydrothermal method and obtained multicolor-stained cell membranes in live E. coli and Staphylococcus aureus by incubating the cells with the N-doped CDs for 3 h [34]. Baig and Chen synthesized CDs from egg whites and used them for successful multicolor imaging of E. coli and S. aureus [35]. These CDs at a lower volume, just 1 μL of a 0.1 mg mL−1 CD solution, offered faster labeling.
In addition, N, S-co-doped CDs were synthesized by microwave heating a tris-acetate-ethylenediamine buffer and a thiourea mixture, and they showed bioactive labeling properties [36]. These CDs could effectively label E. coli, S. aureus, and Pseudomonas aeruginosa, but were unable to efficiently label Klebsiella pneumoniae, likely due to the high diversity of bacterial membrane structures. Wang et al. prepared excitation-independent CDs using sodium citrate, urea, and thiourea that stained live Xanthomonas axonopodis cells with a blue fluorescence under UV after 3 h of incubation [37]. Yang et al. autoclaved a glycerol and 3-[2-(2-aminoethyl amino)ethylamino]propyl-trimethoxysilane mixture for 12 h at 260 °C to synthesize CDs and functionalized these CDs with positively charged moieties of quaternary ammonium lauryl betaine on the CD surface [38]. This type of CD could efficiently label the Gram-positive species Micrococcus luteus, S. aureus, and Bacillus subtilis, but not some Gram-negative bacteria such as E. coli, P. aeruginosa, and Proteus vulgaris. Nandi et al. carbonized the 6-O-acylated fatty acid ester of D-glucose to synthesize amphiphilic CDs and successfully labeled both Gram-positive and Gram-negative bacteria. These CDs only non-specifically stained whole cells; they did not specifically stain bacterial membranes [39].
Imaging bacteria is important for various research purposes. Several parameters can affect imaging outcomes, including the surface charge of the CDs and the structural characteristics of the cellular membranes. It is important to develop a universal fluorescent dye for use in both Gram-positive and Gram-negative bacteria that have similar staining loci. Here, we used 1,3,6-trinitropyrene (TNP) to prepare functional N-doped CQDs (N-CQDs), using the hydrothermal method, for the universal staining of cell membranes in various bacteria. For this purpose, we analyzed the fluorescent staining of Gram-positive bacteria B. subtilis, S. aureus, and L. monocytogenes and the Gram-negative bacteria E. coli, S. enteritidis, and V. parahaemolyticus with two fluorescent colors.

2. Materials and Methods

2.1. Bacterial Strains and Growth Conditions

Bacterial strains including B. subtilis NCIB 3610 [40], S. aureus USA300 [38], Listeria monocytogenes BCRC 14930, E. coli K12 [41], S. enteritidis ATCC 13076, and Vibrio parahaemolyticus BCRC 12870 were grown in Luria Bertani (LB) broth (Difco, Becton Dickinson, Franklin Lakes, NJ, USA) and on LB agar plates (1.5% Bacto agar) at 37 °C. For an N-CQD, 4′,6-diamidino-2-phenylindole (DAPI), and FM4-64 dye staining, the bacteria were grown on LB agar plates and in LB broth at 37 °C and 180 rpm until the optical density at 600 nm (OD600) reached around 1.0.

2.2. One-Pot Hydrothermal Synthesis of N-CQDs

To synthesize N-CQDs, we adapted previously published hydrothermal methods [42,43]. Two gram of pyrene was added to 240 mL of 16 M nitric acid and stirred well at 200 rpm and 80 °C for 48 h. One liter of ddH2O was added to the solution and stirred at 150 rpm for another hour. The solution was then filtered and dried to obtain TNP. Next, 2 g of TNP was mixed with 70 mL of dimethylformamide and ultrasonicated for 1 h. The solution was hydrothermally reacted in a stainless-steel autoclave at 180 °C for 12 h to obtain N-CQDs. To separate large particles and obtain a supernatant, the N-CQD sample was centrifuged three times at 13,000 rpm for 5 min each. The supernatant was filtered using a membrane filter (0.22-micrometer) and dried under heating at 50 °C. The yield of the N-CQD composites was approximately 69 wt.%.

2.3. N-CQD Characterization

A transmission electron microscope (JEM3010; JOEL, Tokyo, Japan) operating at 200 kV was used to analyze the N-CQD samples. The chemical composition of the samples was analyzed using an X-ray photoelectron spectrometer (XPS, Fison VG ESCA210; West Sussex, UK) equipped with a Mg-Kα radiation emitter. The C1s, N1s, and O1s spectra were de-convolved using a nonlinear least squares fitting algorithm with a symmetric Gaussian function. A Jasco FP-8200 spectrometer was used to record the UV–vis spectrum of the N-CQD suspension, with the wavelength scan rate set to 60 nm/min.
The PL emission spectrum of each suspension was recorded using a fluorescence spectrometer (F-7000 FLS920P; Hitachi, Tokyo, Japan) at 360, 490, and 557 nm. All experimental data represent three independent experiments.

2.4. N-CQD Staining

Bacterial cells were grown to OD600~1.0, and 3 mL aliquots were centrifuged and pelleted at 12,800× g (rcf) for 3 min. The cell pellets were then washed with 1× TBS buffer and stained with 50 μL of N-CQDs at 0, 500, 1000, and 5000 ppm for 3 min at 25 °C in the dark. For DAPI and N-CQD co-staining, the bacteria were incubated with 5 μL of DAPI for 3 min, and then with N-CQDs for another 3 min in the dark. The bacterial cultures were centrifuged at 90× g (rcf) for 20 s, and supernatants were used for microscopic observation. For FM4-64 staining, the bacteria were stained with 50 μL of FM-4-64 for 3 min in the dark and centrifuged at 90× g (rcf) for 20 s; the supernatants were used for microscopic observation.
Eight microliters of the stained cells were spot on a glass slide and covered with a poly-L-lysine-treated coverslip. A fluorescence microscope (Axioscope 5 Pol TL LED; Carl Zeiss, Göttingen, Germany) fitted with a Zeiss Axiocam 305 color camera (Carl Zeiss) and an attached X-Cite 120PCQ fluorescence illuminator (Excelitas Technologies Corp., Pleasanton, CA, USA) was used to capture microscopic imagines. All experimental data represent three independent experiments.

2.5. Analysis of Fluorescent Labeling Different Bacteria

Stained cells were visualized using red TRITC-A-Basic-000, green FITC-A-Basic-000, and blue BFP-A-Basic-000 fluorescent filter sets (IDEX Health & Science, LLC, Rochester, NY, USA) at the excitation and emission wavelengths of 542 ± 10 and 620 ± 26, 475 ± 17.5 and 530 ± 21.5, and 390 ± 9 and 460 ± 30 nm, respectively. A fluorescence microscope was used to acquire the images. At a 4000 mini second exposure time, green images of all the bacteria were acquired. At 450, 760, 1500, 400, 1500, and 640 mini second exposure times, red images of B. subtilis, E. coli, S. enteritidis, S. aureus, L. monocytogenes, and V. parahaemolyticus, respectively, were acquired. At a 35 mini second exposure time, blue images of all the bacteria were acquired.
To quench the experiment, the cells stained with FM4-64 and N-CQDs were irradiated with light by coupling with a red TRITC-A-Basic-000 filter for 3 and 30 s, respectively, and then the cells were re-imaged using the TRITC-A-Basic-000 filter, as described above [44]. All experimental data represent the results of three independent experiments.

3. Results and Discussion

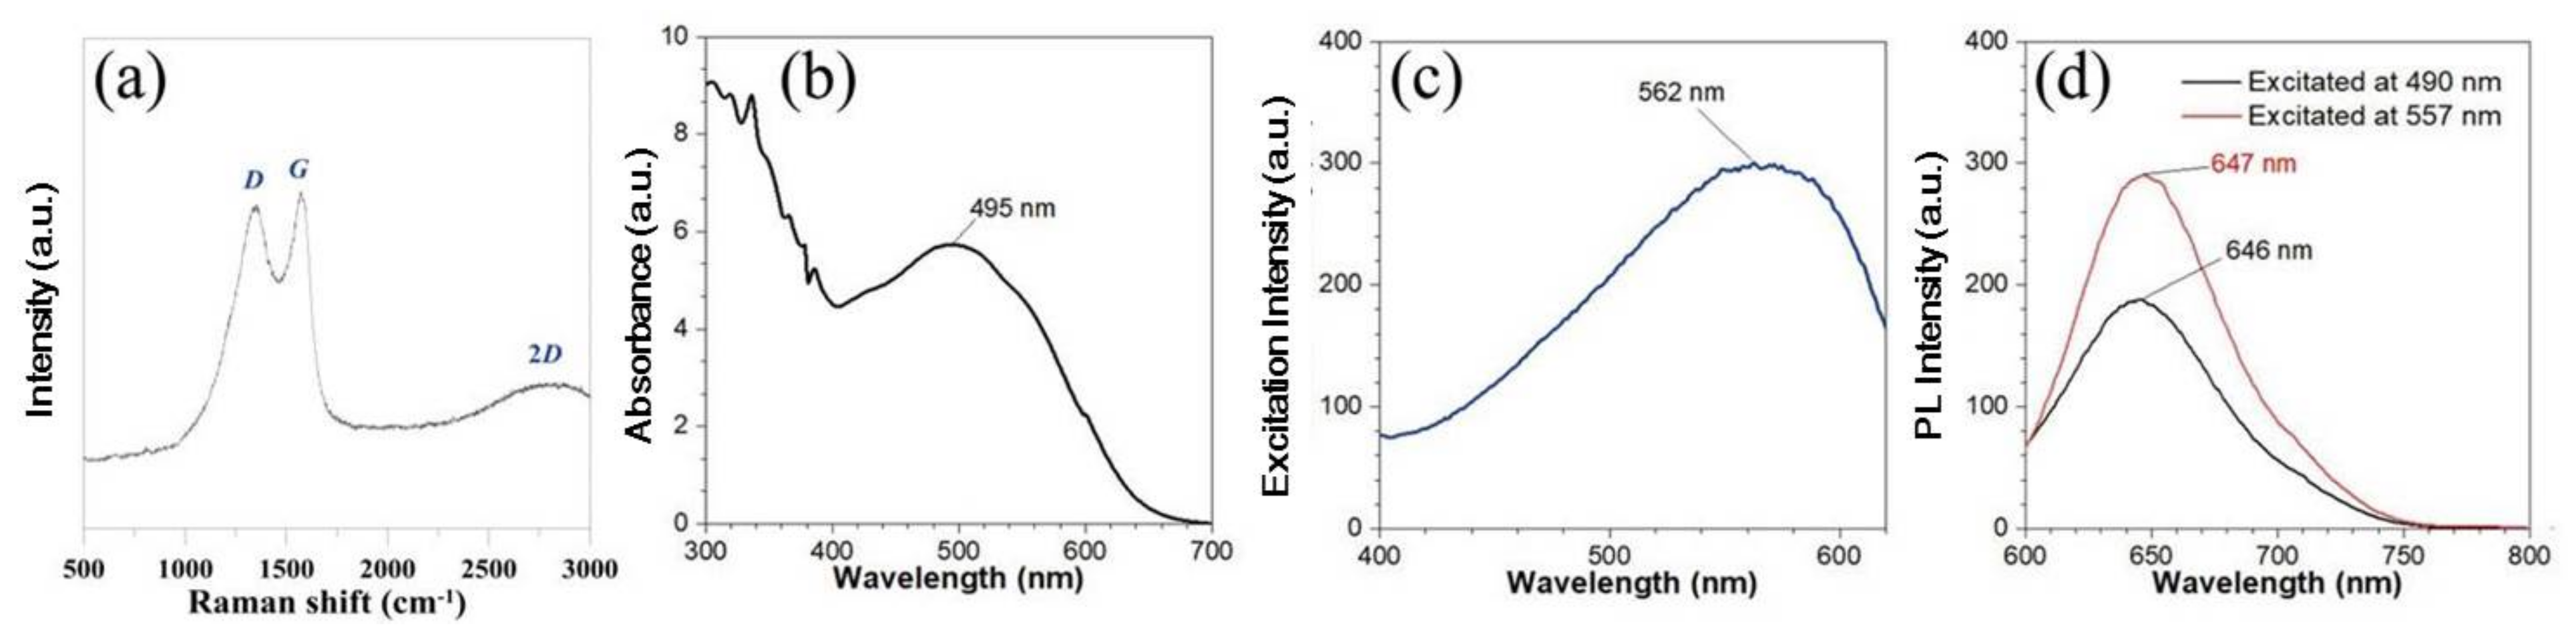
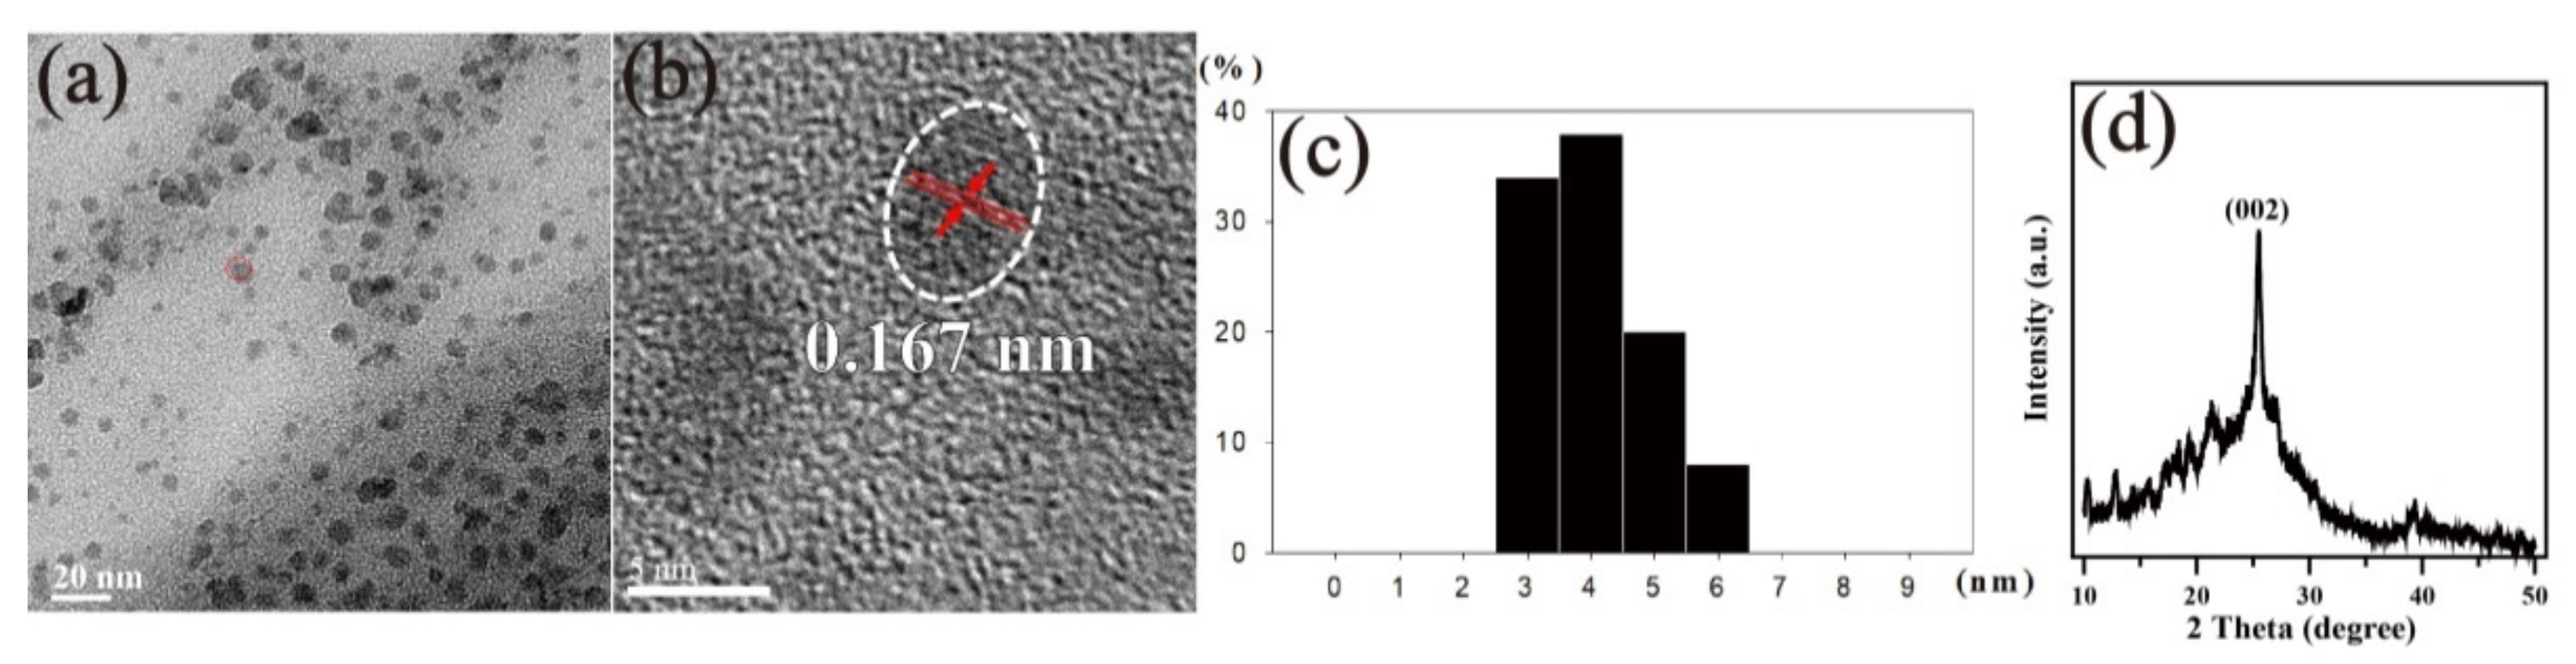
3.1. Structural and PL Analysis of N-CQDs

In this study, we used a hydrothermal method to synthesize N-CQD nanomaterials. Transmission electron microscope (TEM) and X-ray diffraction (XRD) were used to analyze their crystal structures by analytical scanning, as shown in Figure 1a,b. The particle size of N-CQDs showed a quasi-Gaussian distribution (Figure 1c), with an average size of approximately 4.02 nm. As shown in Figure 1b, the N-CQDs were spherical, and the lattice fringes of the N-CQD samples were localized within a well-resolved lattice spacing of 0.167 nm corresponding to the (100) facet of graphite.
Next, we performed the XRD analysis of the N-CQD samples; it showed a peak at 25.2°, attributed to the (002) crystal plane of the graphite structure (Figure 1d). The Raman spectrum analysis showed that N-CQDs have two peaks at 1359 cm−1 (D) and 1598 cm−1 (G), whereas the 2D peak was at 2700 cm−1, as shown in Figure 2a. Generally, in Raman analysis, the G band at ~1580 cm−1 is a single crystallite of graphite, but the D band at ~1350 cm−1 is attributed to amorphous carbon or deformation vibrations of a hexagonal ring.
The ID/IG ratio was approximately 0.95 (Figure 1a), and it showed that the N-CQD composite has mixed crystallinity with highly amorphous carbons. In the UV–vis absorbance spectrum analysis, an n-π* transition absorption peak between 300–350 nm is because of C=O/C=N bonding. In Figure 2b, a band-gap transition absorption band is caused by the n-π * transition of the non-bonded electrons of atoms near 500–600 nm in the center or at the absorption edge of the surface molecule. The PL spectrum indicates the optimal excitation wavelength and the strongest emission range of phosphor. As shown in Figure 2c, the spectrum revealed a broad range at approximately 500–620 nm and a sharp peak at 562 nm. Therefore, it is suitable to be excited at around 490 and 557 nm.
The excitation spectrum analysis of the N-CQD composite at 490 and 557 nm (commonly used for in bio-fluorescence microscopy) is shown in Figure 2d. Our results showed that N-CQDs had an excitation wavelength of 490 nm, corresponding to an emission wavelength of approximately 560 and 600 nm (at FTIC filter range excitation/emission: 465–495 nm/515–555 nm), and an excitation wavelength of 557 nm corresponding to an emission at 613 nm (at TRITC filter range excitation/emission: 527.5–552.5 nm/590–650 nm).

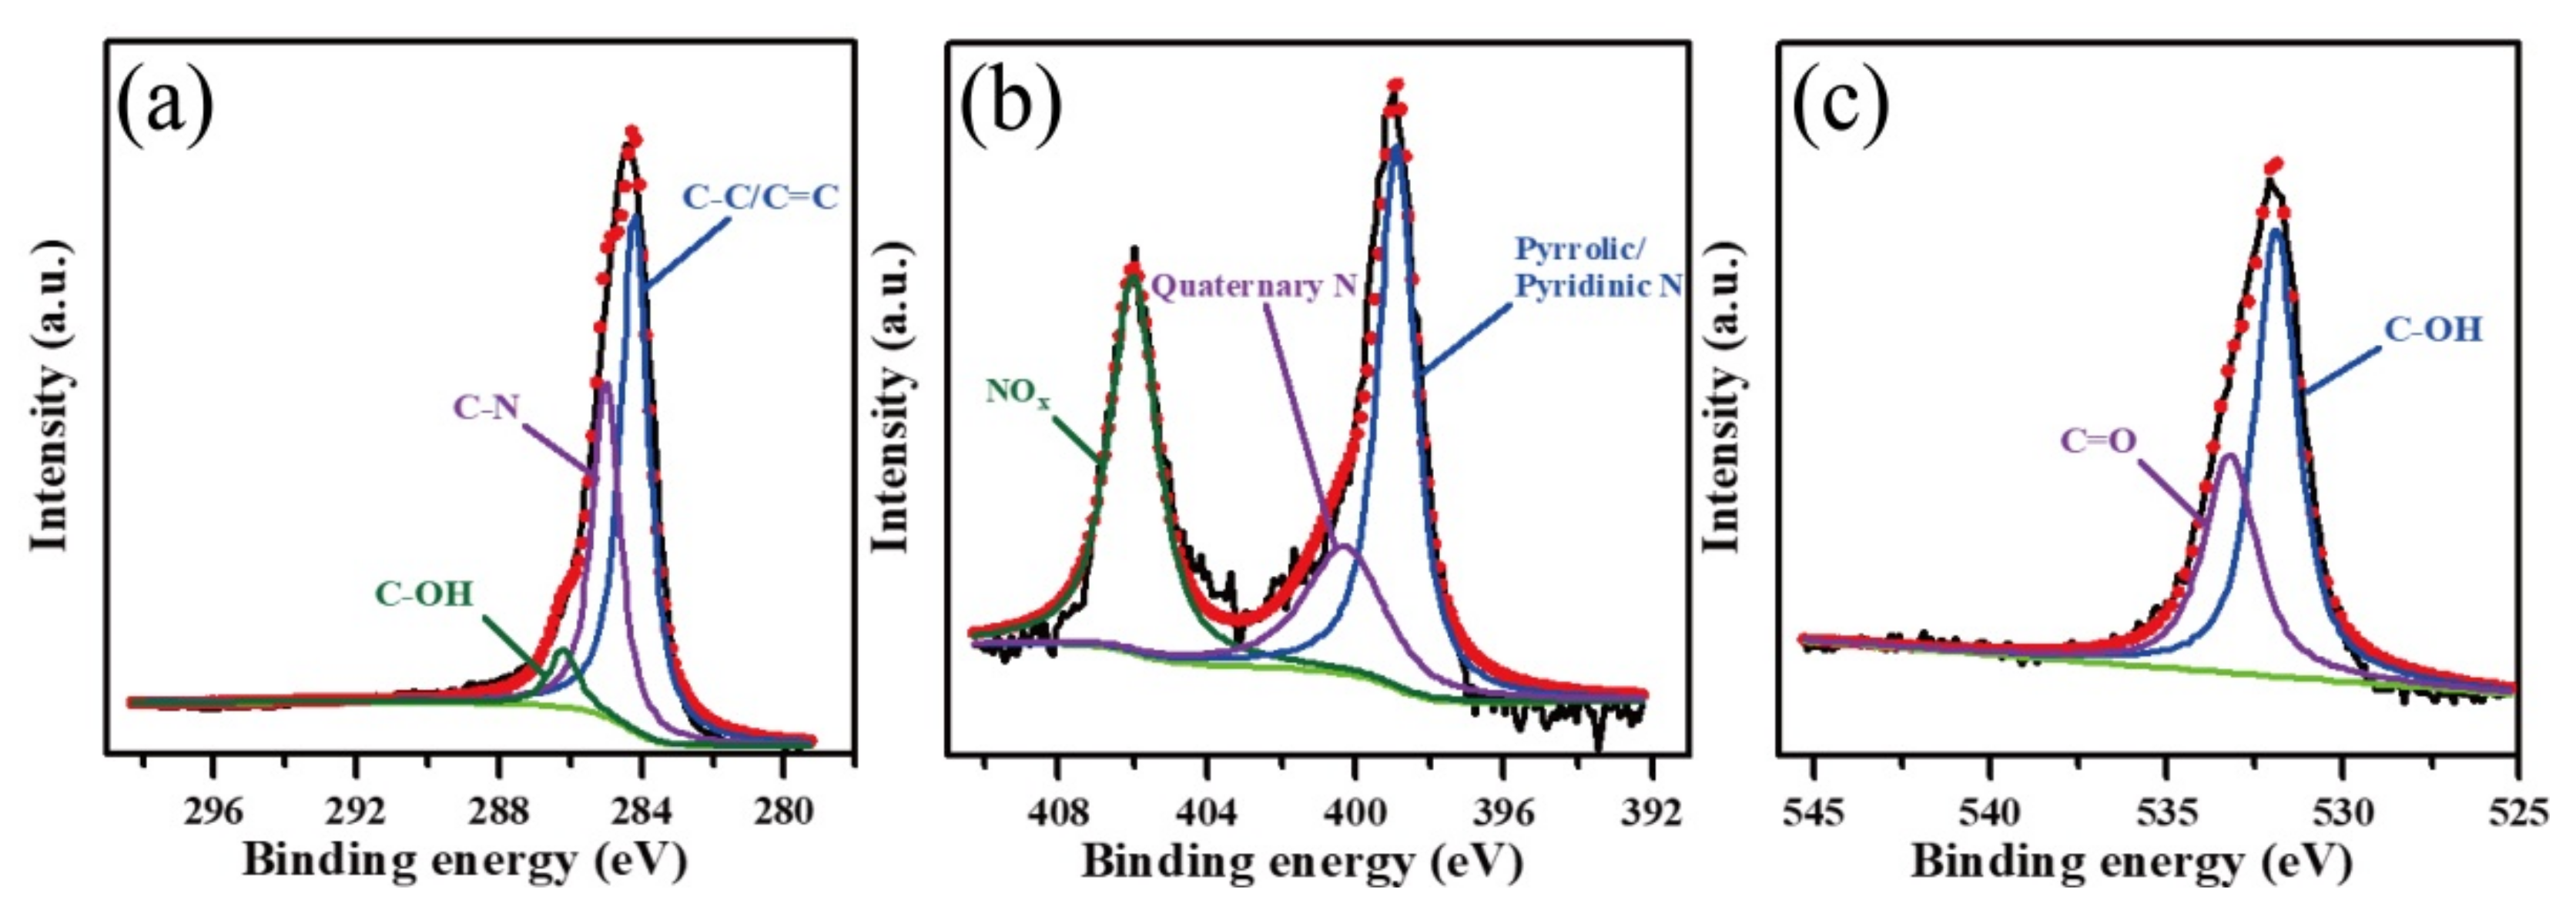
3.2. X-ray Photoelectron Spectroscopy (XPS) Analysis of N-CQDs

To determine the surface chemical composition of N-CQDs, we performed the XPS analysis. As shown in Figure 3a, the C–C/C=C peak was at 284.5 eV, and the C–N and C–OH peaks were at 285.2 and 286.2 eV, respectively. In Figure 3b, the characteristic peaks at 398.6, 400.6, and 406.0 eV indicated the presence of pyrrole/pyridine N, quaternary N, and NOx, respectively. In addition, the high-intensity peaks at approximately 531.8 and 533 eV indicated C–OH and C=O, respectively (Figure 3c).
In Table 1, the molar percentage of C–C/C=C, C–N, C–OH, and C=O was 57.09, 36.21, 4.16, and 2.54%, respectively. Among other functional groups, the proportion of the C–N groups was as high as 36.21%, indicating the presence of N dopants in the carbocyclic structure. The ratio of quaternary N atoms in pyrrole and pyridine was 36.97%:42.04%, and NOx comprised 20.99%. These findings indicate that in the subsequent process, the formation of CD included four or five carbocyclic rings and N dopants and that NOx might have existed at the edge of carbocyclic rings. N-Doping into four or five carbocyclic rings tends to be positively charged and attracted to negative lipid bilayer membranes.

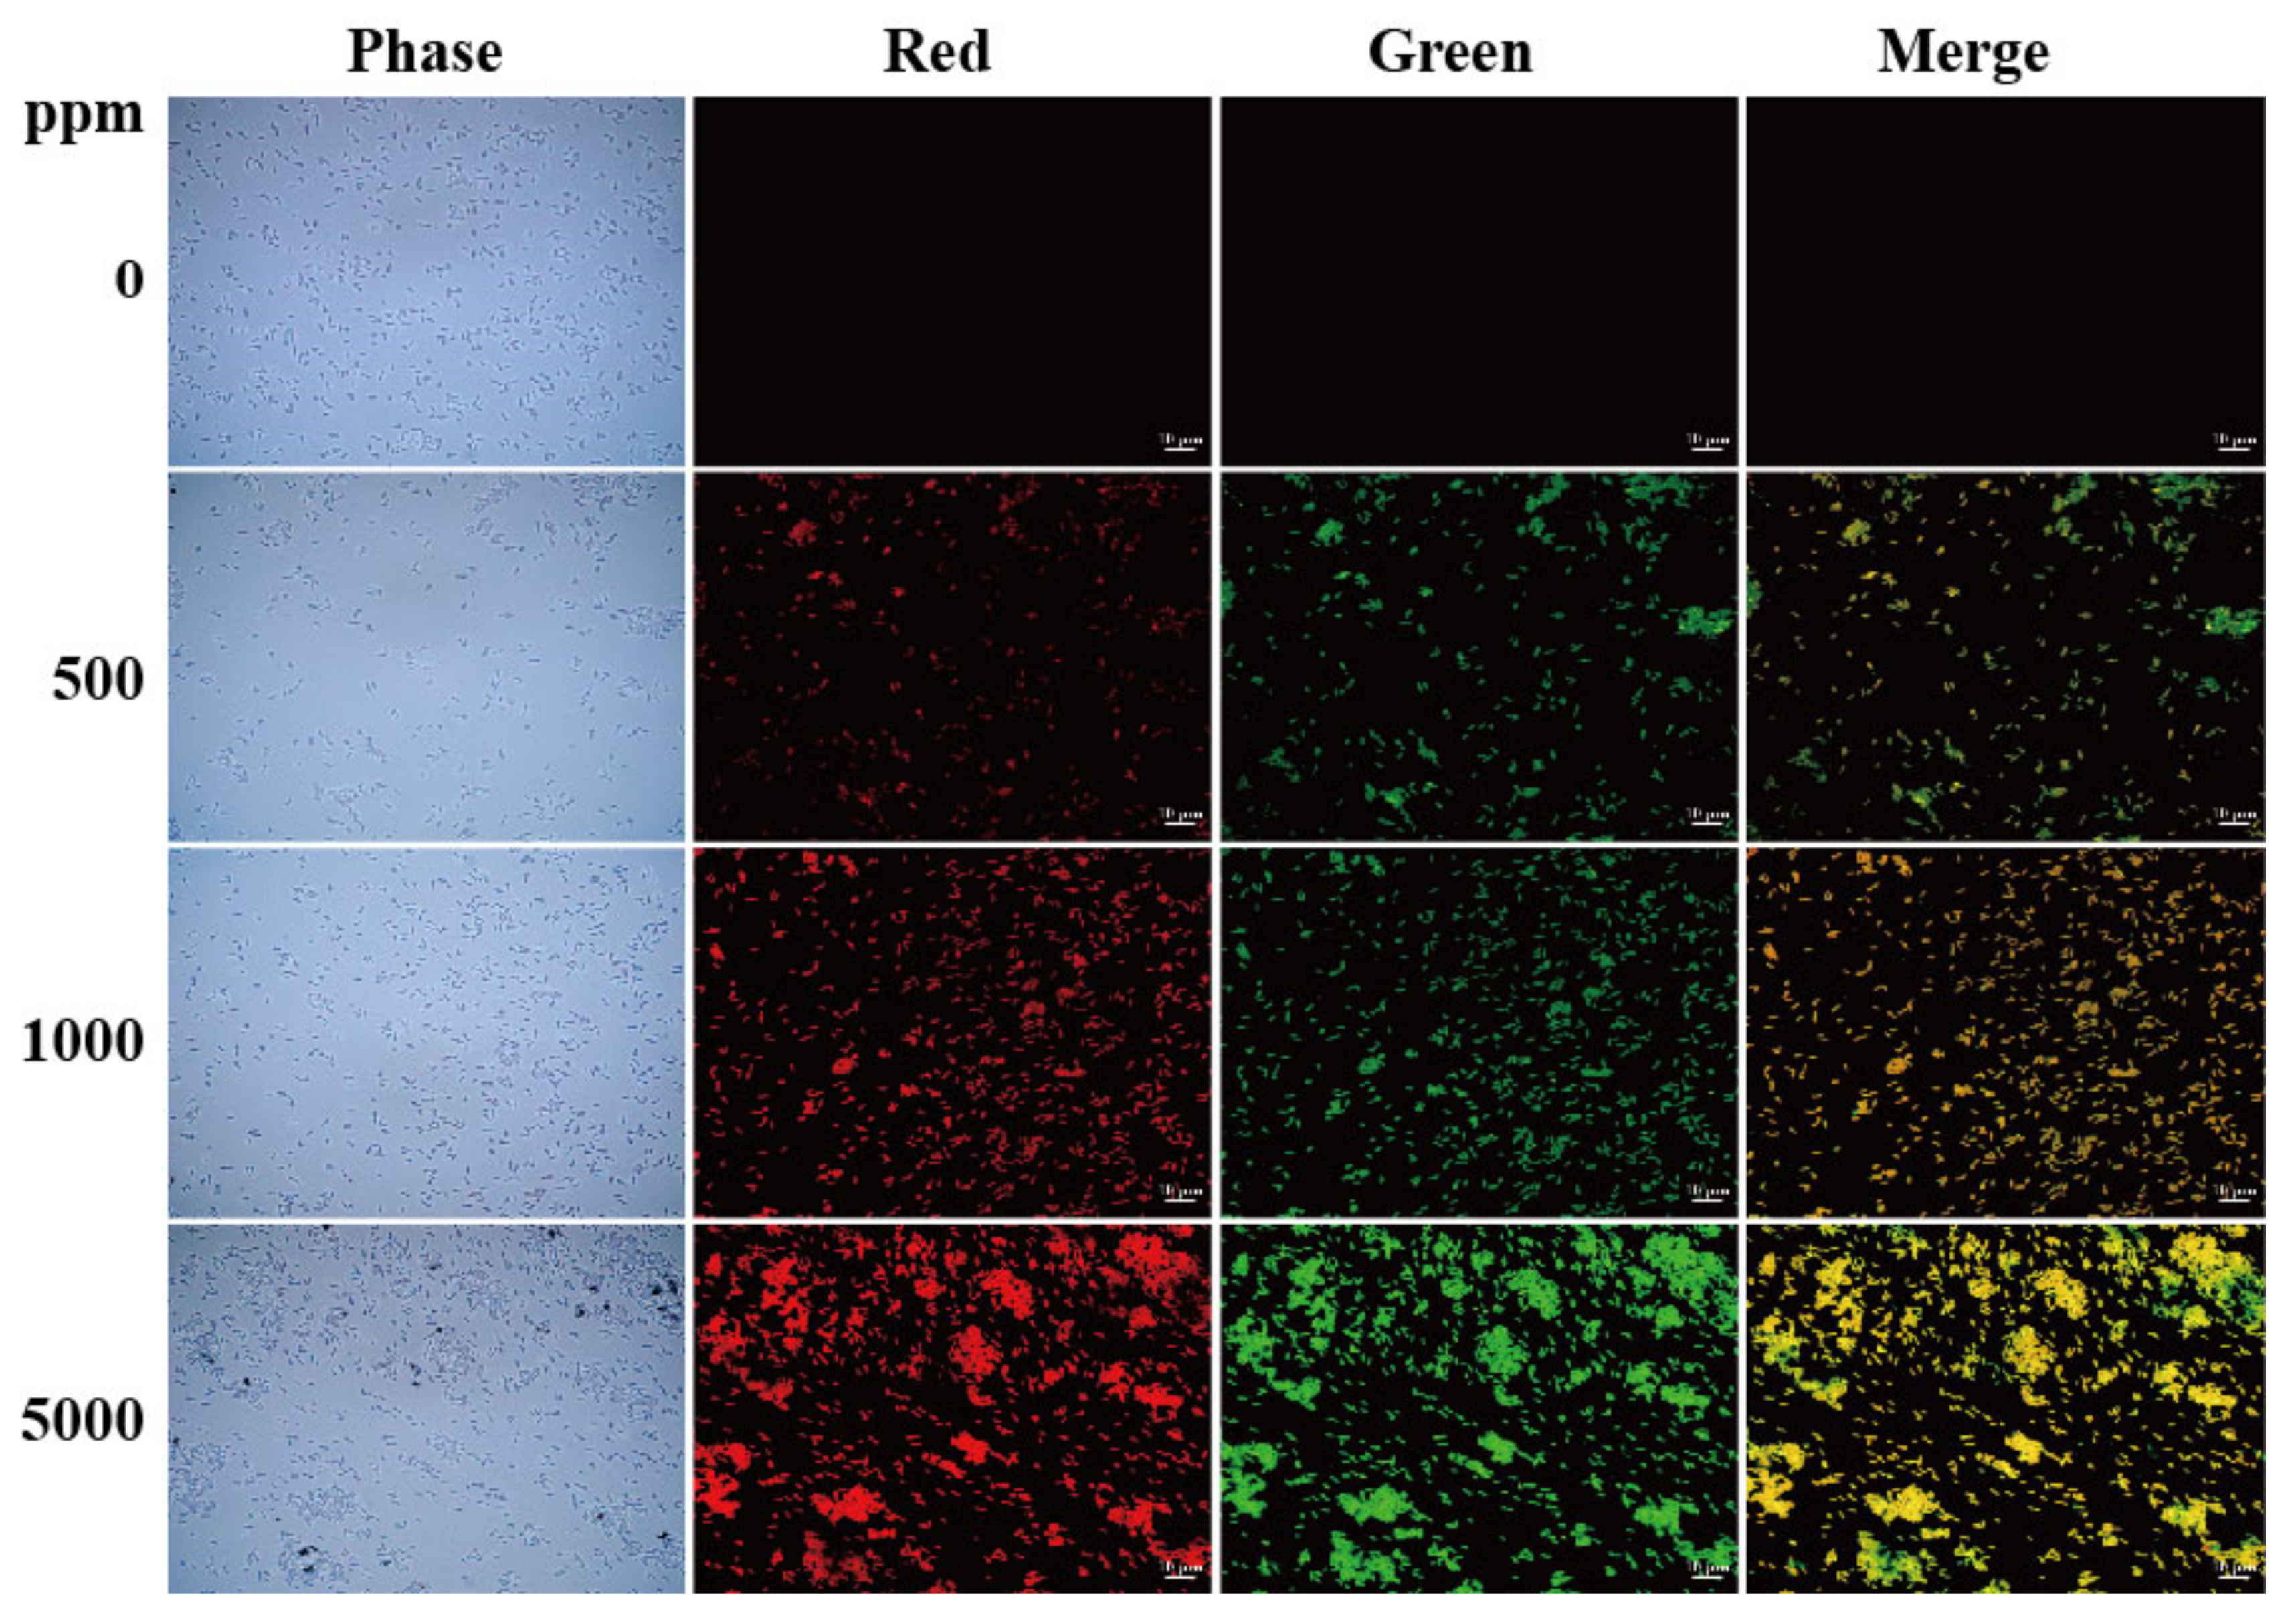
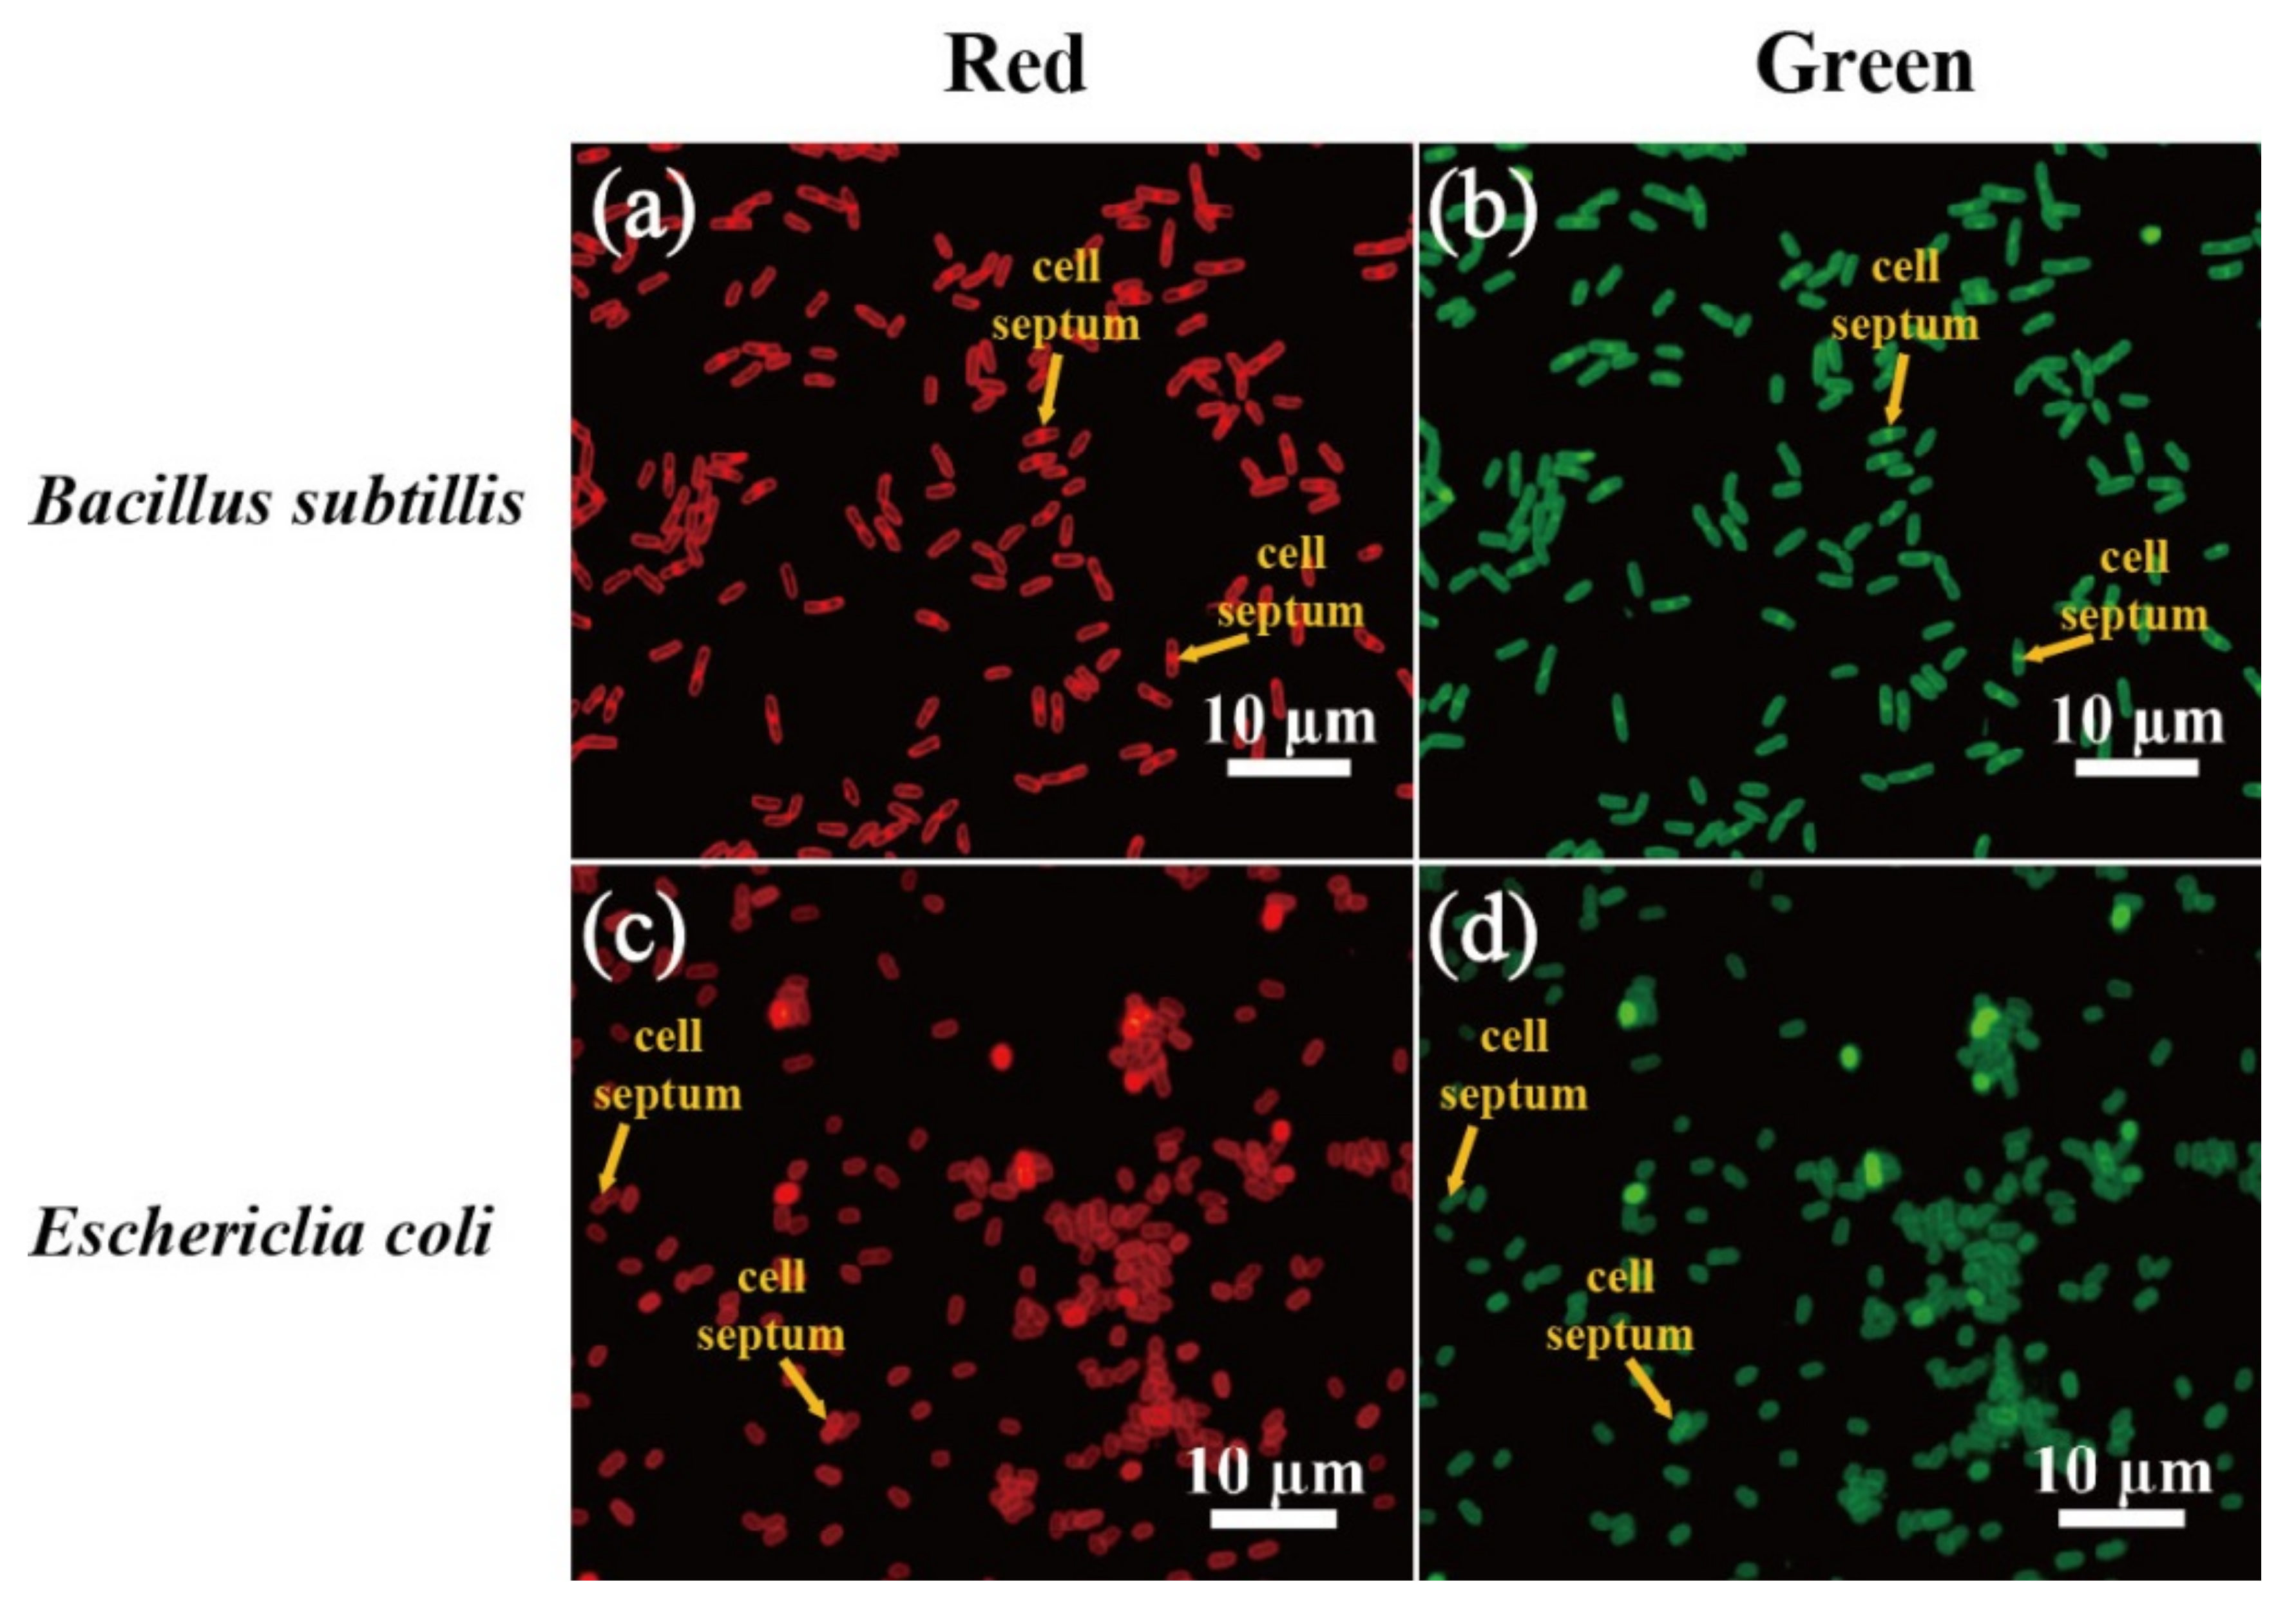
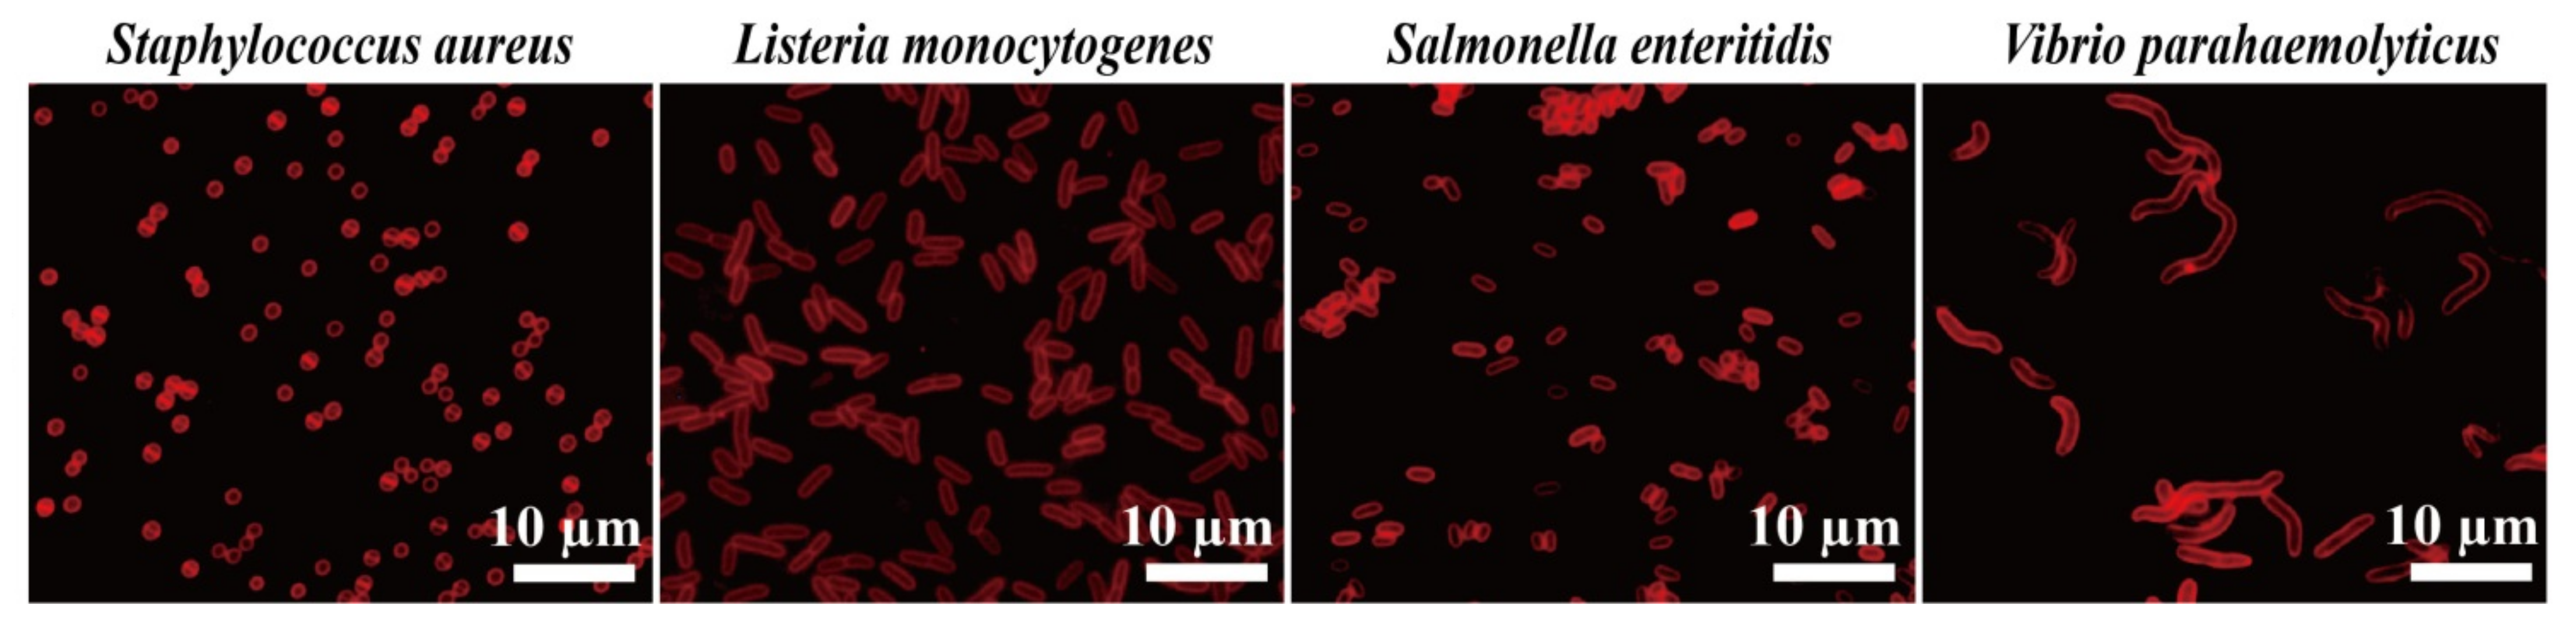
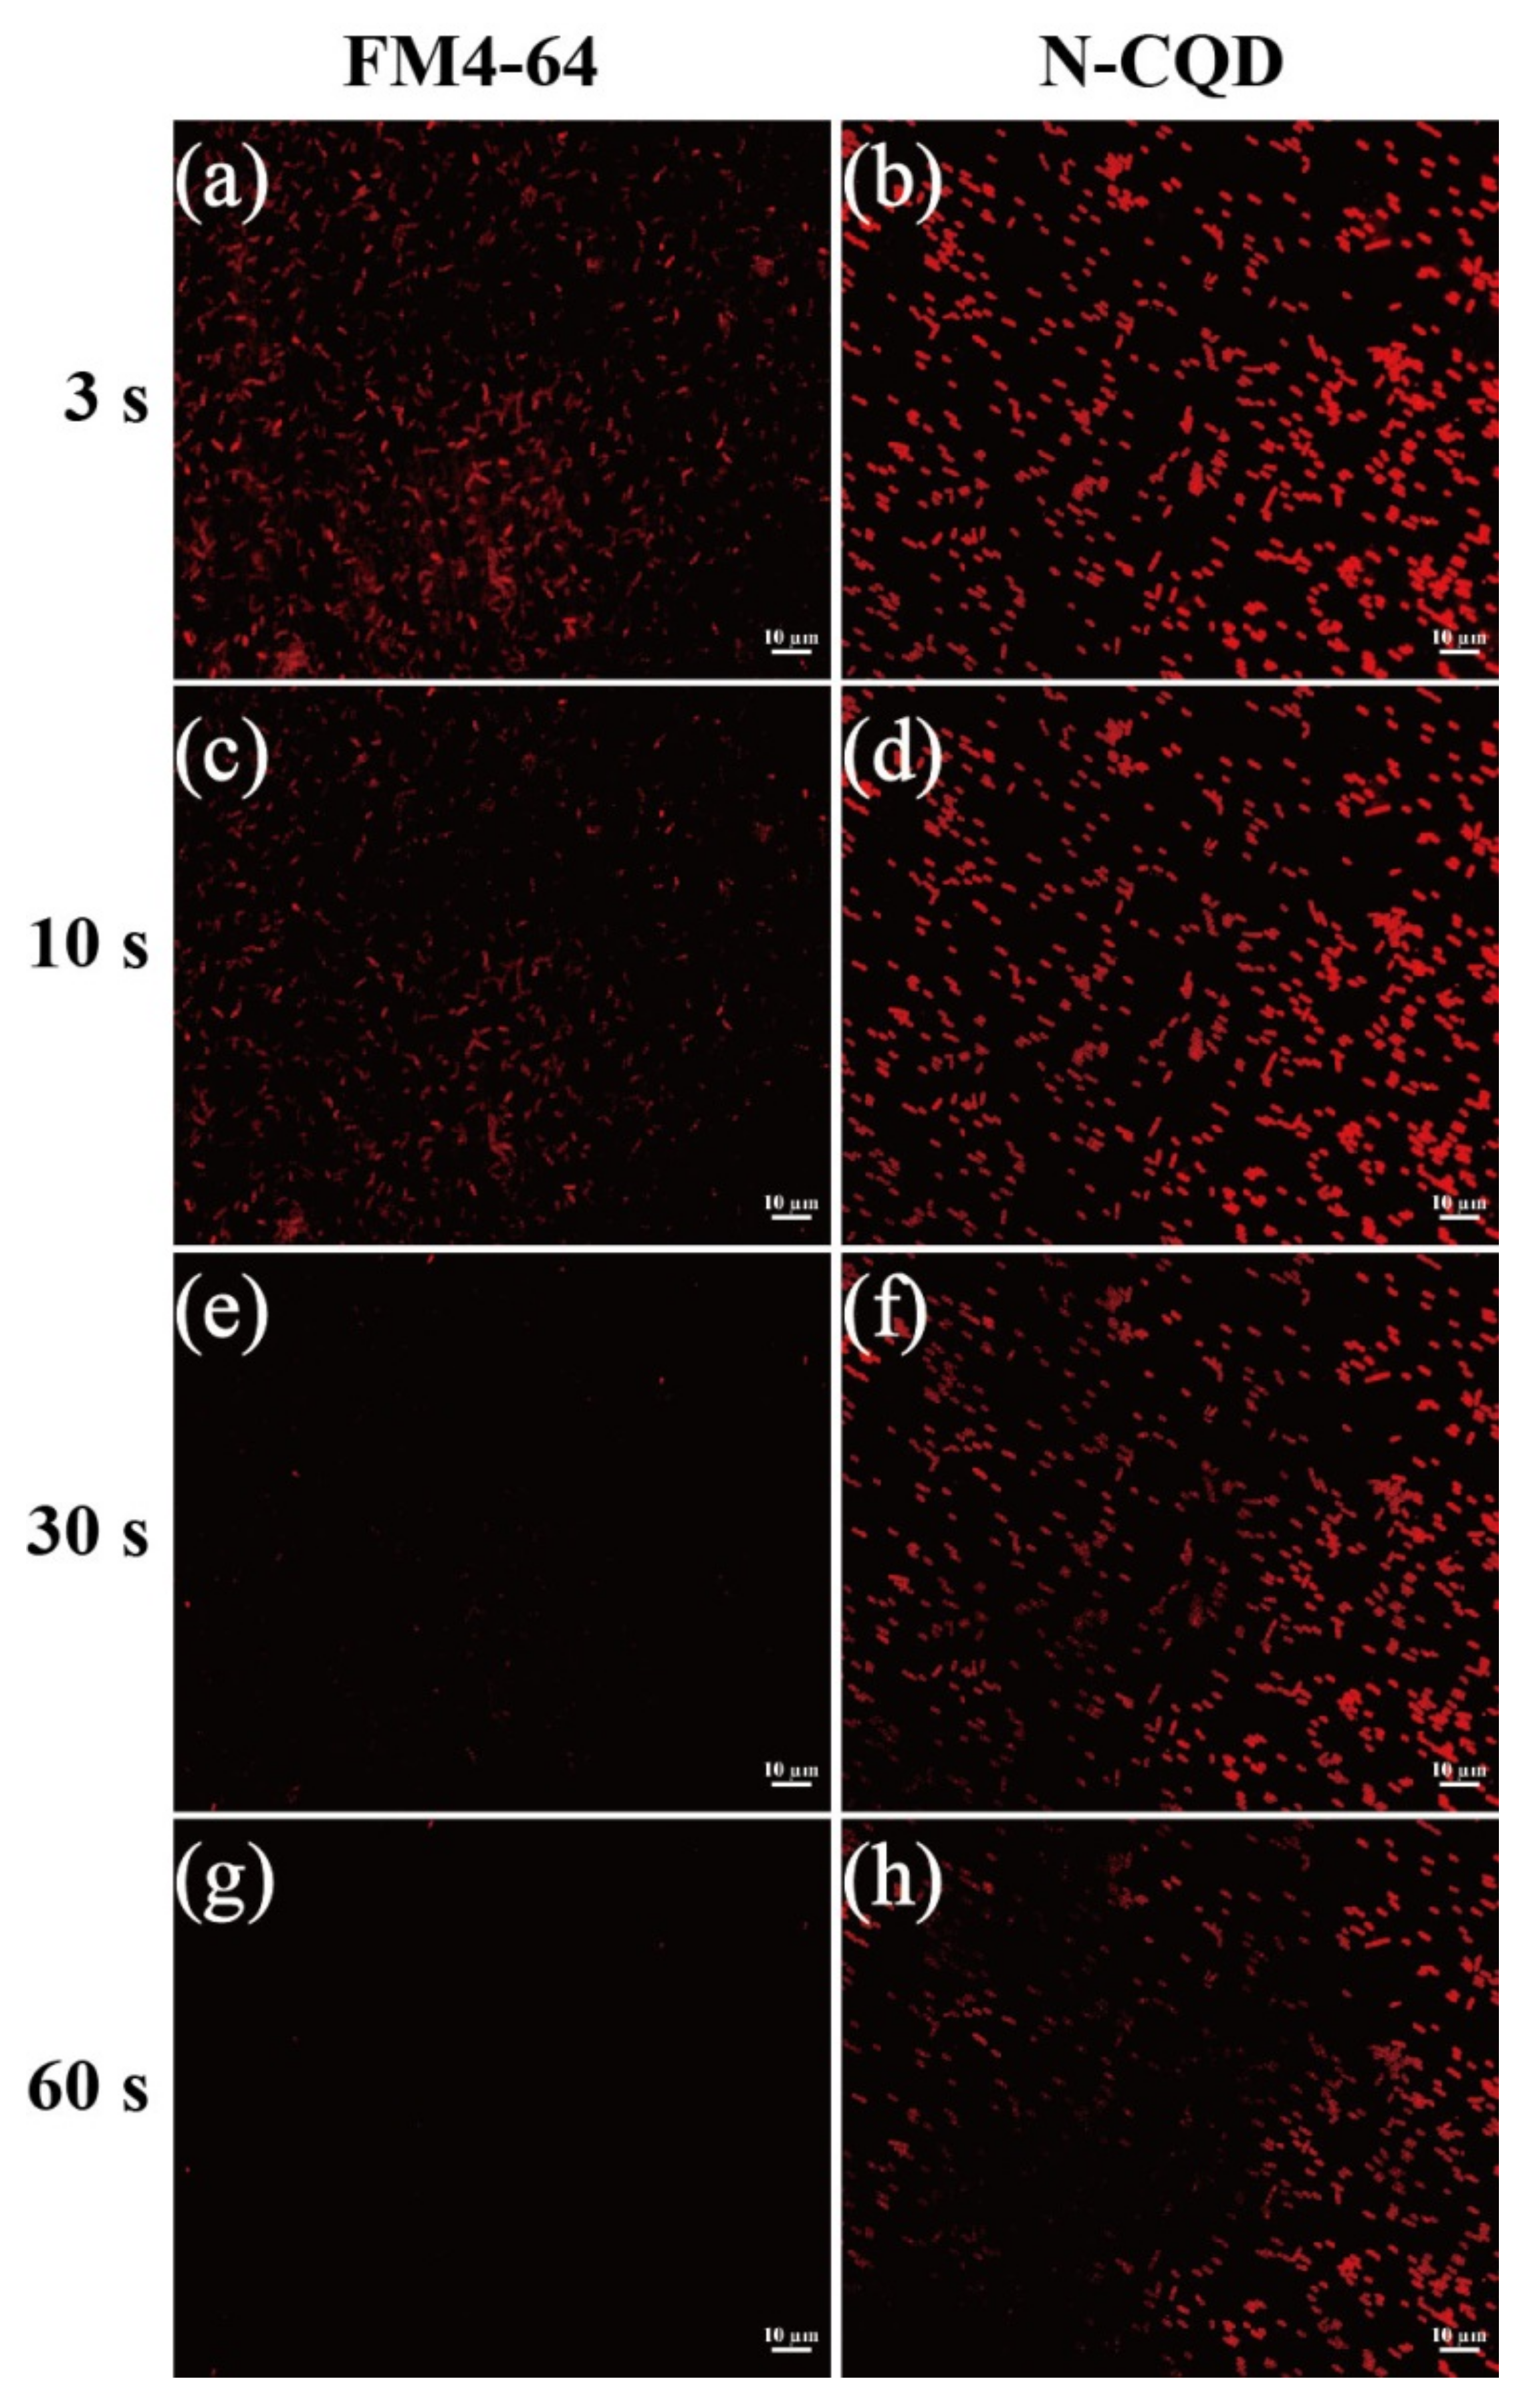
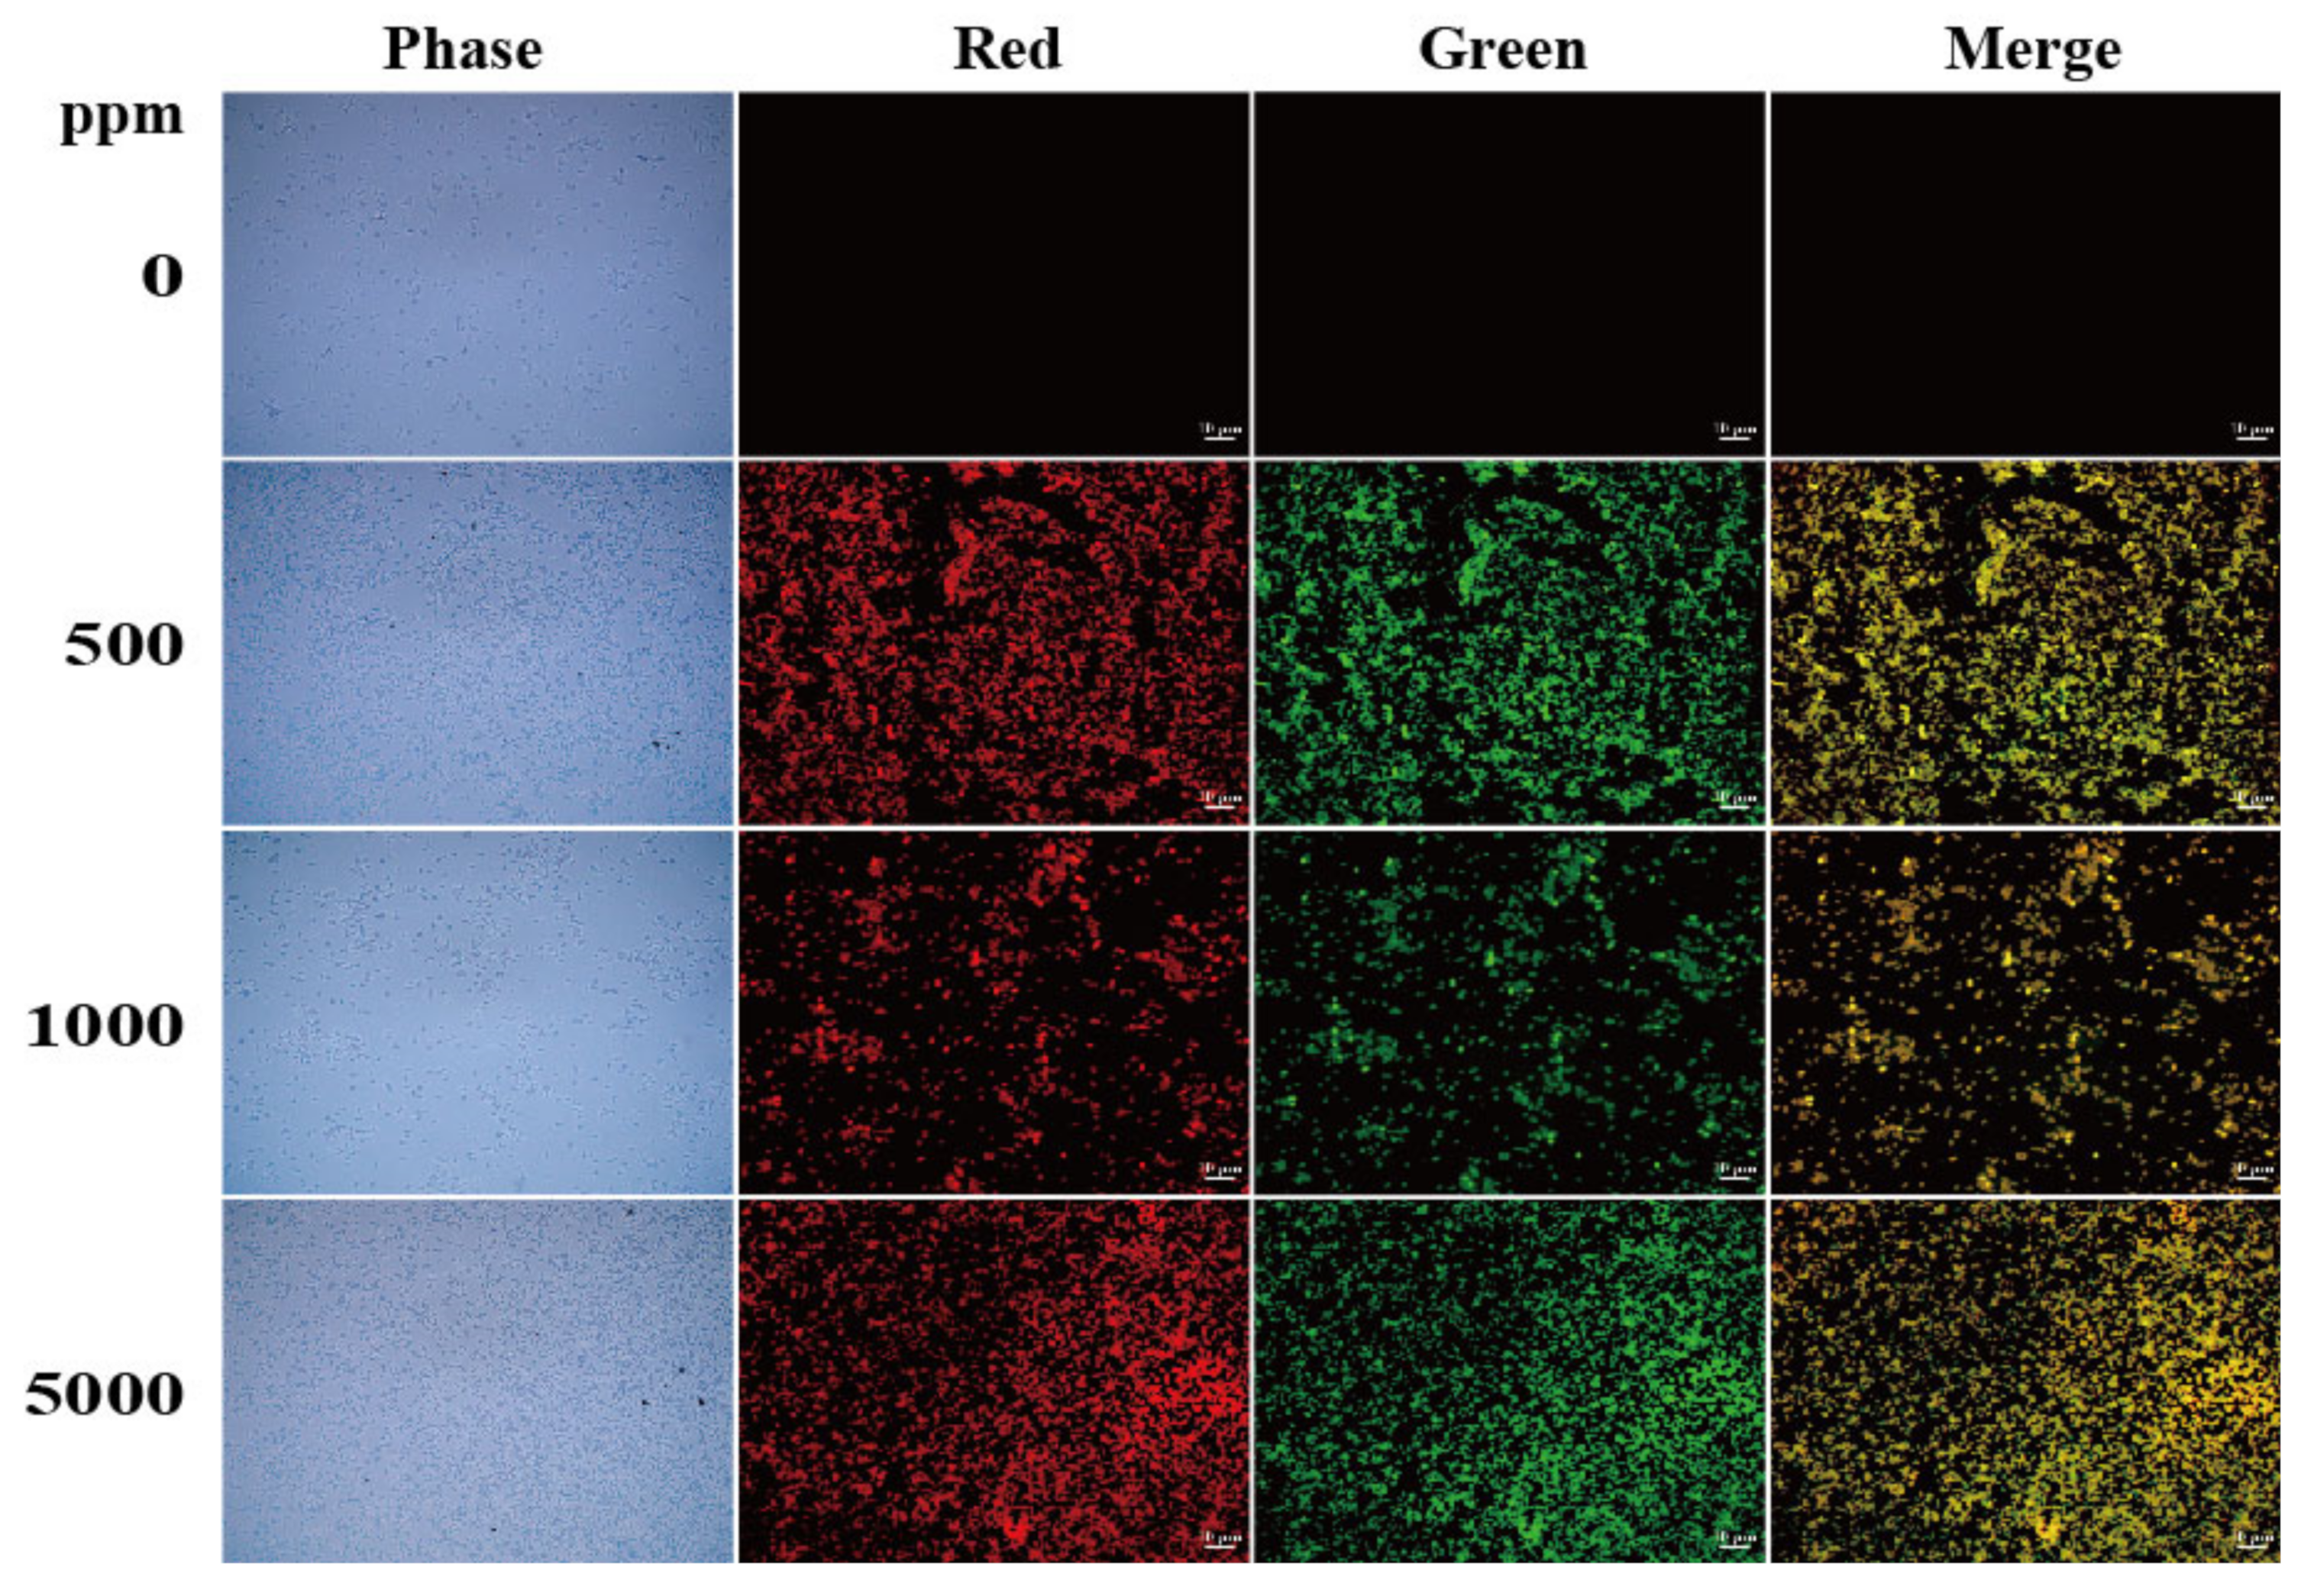
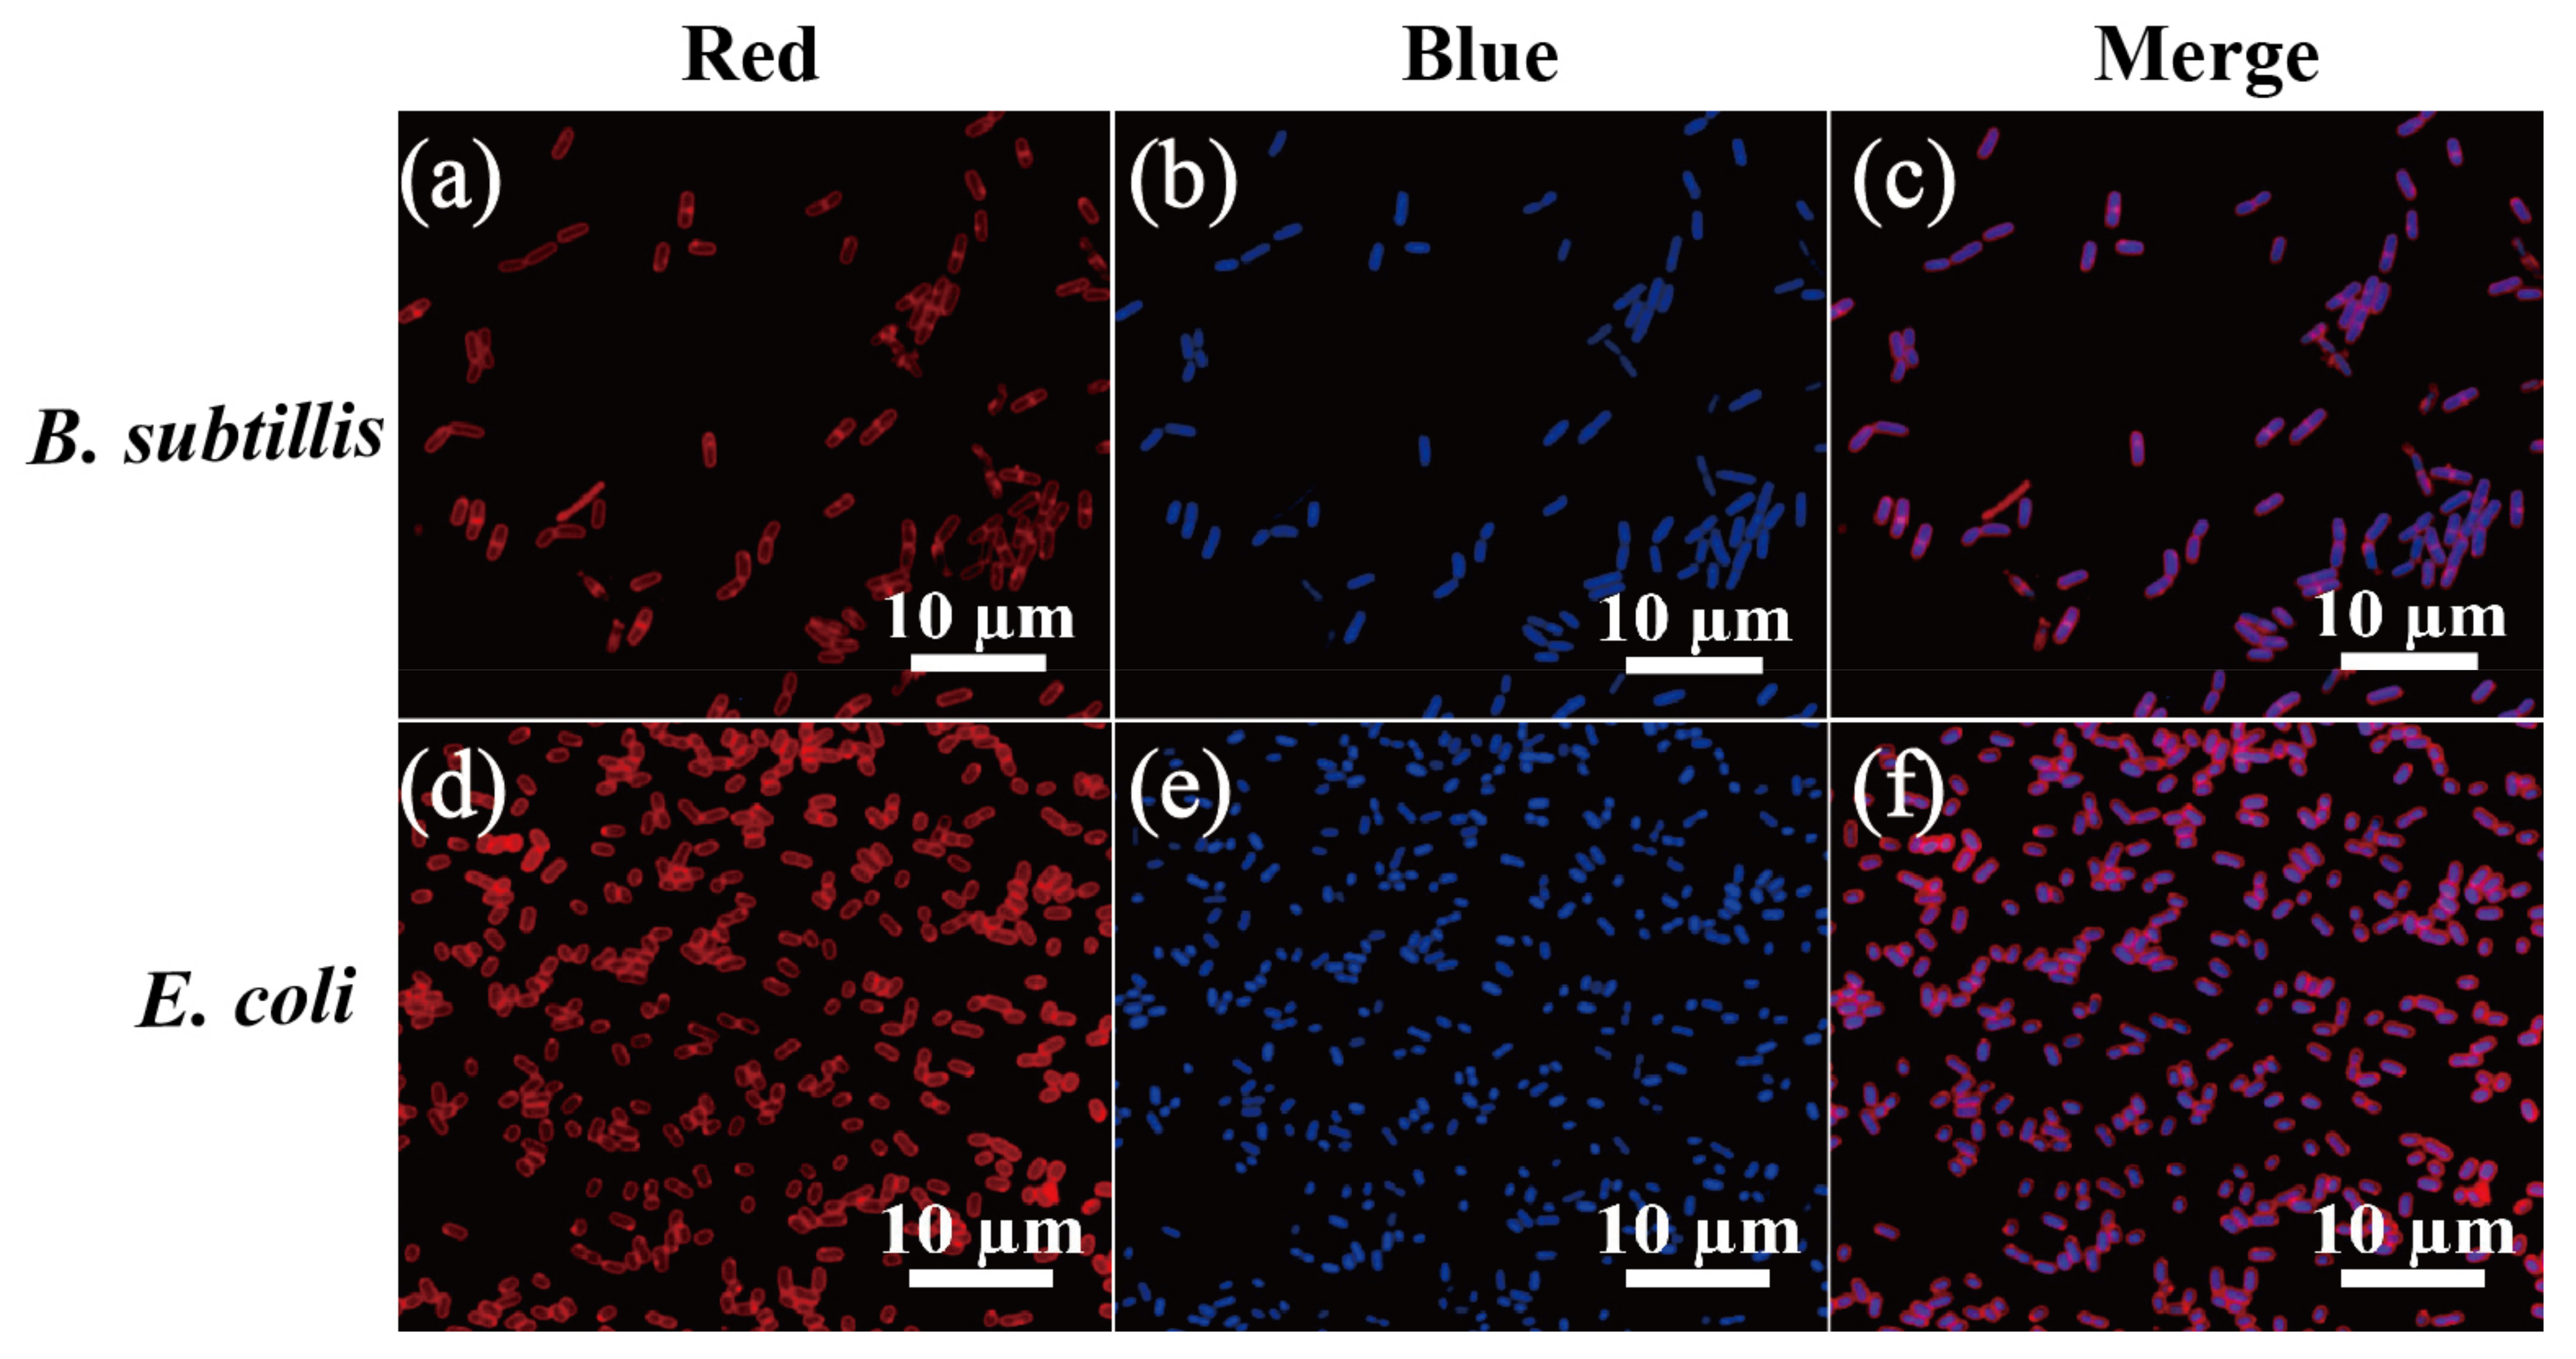
3.3. Fluorescent Bioimaging Using N-CQDs

To elucidate the effects of N-CQDs on bacterial cell staining, we used 0, 500, 1000, and 5000 ppm N-CQDs to stain the Gram-positive bacterium B. subtilis and Gram-negative bacterium E. coli at 25 °C. A Zeiss fluorescence microscope was used to analyze the cells, as shown in Figure 4 and Figure 5. The best staining of B. subtilis and E. coli was observed with 1000 ppm N-CQDs with the TRITC filter and 500 ppm N-CQDs with the FITC filter, respectively. We found that N-CQDs stained B. subtilis and E. coli cell membrane and septa (Figure 6a–d). The staining results of Gram-positive and Gram-negative bacteria at different concentrations of N-CQDs can be attributed to their different membrane structures.
In addition, we tested the ability of the N-CQD composite to stain Gram-positive bacteria S. aureus and L. monocytogenes, and Gram-negative bacteria S. enteritidis and V. parahaemolyticus (Figure 7). The results were similar to those of the E. coli and B. subtilis strains; N-CQDs could only stain the cell membrane and septa (Figure 6). In addition, we coupled N-CQDs with DAPI dye, a chromosomal dye, and found that DAPI stained the inner side of the cells but not the cell membrane, whereas N-CQDs stained the cell membrane but not the inner side of the cells (Figure 8).
The XPS of N-CQDs showed that, in the C1s peak, C–C or C=C, C–N, C–OH, and C=O accounted for 57.09, 36.21, 4.16, and 2.54%, respectively (Table 1). In the N1s peak, pyrrolic/pyridinic N, quaternary N, and NOx corresponded to 36.97, 42.04, and 20.99%, respectively (Table 1). Functional groups such as C–N, C–OH, C=O, and NOx can interact with proteins in the membranes and septa; the hydrogen bonds in C–OH, C=O, and NOx can interact with NH3 in polypeptides; and C–N can interact with COOH in polypeptides. In addition, we found the percentage of NOx in the total N content was around 20.99%, which might lead to an increase in the interaction between NOx and NH3 and cause N-CQDs to be bound to the cell membrane. Gram-negative bacteria have double lipid bilayer membranes, which may make it more difficult for N-CQDs to penetrate. However, N-CQDs can still stain both Gram-positive and Gram-negative bacteria. This suggests that N-CQDs can interact with not only the outer lipid bilayer membranes of Gram-negative bacteria but also the outer layer peptidoglycans in Gram-positive bacterial cell membranes.
Compared with the findings of our previous study using PEG6000/CDs as the bioimaging dye, here, we found that N-CQDs can stain both Gram-positive and Gram-negative bacterial membrane and septa, whereas PEG6000/CDs stain the entire Gram-negative bacteria, including the membrane. In addition, we found that the NOx content in N-CQDs was around 20.99%, but PEG6000/CDs lack NOx. The C–OH and O–C=O content in PEG6000/CDs was over 60% in the C1S peak, whereas that in N-CQDs was only around 7%. This suggests that NOx may play a key role in membrane binding but may not penetrate cellular membranes.
Finally, to understand N-CQD photo-stability, we performed a fluorescence quenching experiment to analyze FM4-64 and N-CQDs in B. subtilis cells exposed to fluorescent light at 557 nm for 3, 10, and 30 s. FM4-64 dye was bleached after 10 s of irradiation, whereas the cells retained the N-CQD stain, indicating that an N-CQD is more stable to irradiation as a potential bio-labeling agent (Figure 9). An N-CQD has 10–20 more aromatic condensed rings than FM4-64, which only has two aromatic carbon rings that respond to fluorescent light emission. This might explain why FM4-64 is easier to quench than an N-CQD and suggests that it interacts with cell membranes in both Gram-positive and Gram-negative bacteria because of its high content of NOx and low content of C–OH and O–C=O. Perhaps NOx is better for interacting with cell membranes, but it does not easily penetrate cell membranes.

4. Conclusions

We developed a simple and easy-to-use hydrothermal method for the synthesis of an N-CQD composite and evaluated its function in the biological labeling of different bacteria. Our results indicate that the fluorescence properties of N-CQDs facilitate the staining of the cell membrane and septa of both Gram-positive and Gram-negative bacteria. In addition, our results showed that the best staining concentration for Gram-positive bacteria is approximately 1000 ppm and that for Gram-negative bacteria it is approximately 500 ppm. The N-CQD composite has better light stability and higher photobleaching resistance than the commercially available membrane dye FM4-64. In addition, N-CQDs can emit red and green fluorescence when exposed to two different wavelengths. Our results show that N-CQDs can be synthesized using a one-step hydrothermal process and their optical properties make them suitable as biological fluorescent labeling agents.

Author Contributions

Conceptualization, Y.-H.H.; methodology, Y.-H.H.; resources, Y.-H.H., R.-S.J., C.-T.H., C.-H.W., S.-T.C., and S.-F.O.; data curation, S.-F.O., Y.-Y.Z., S.-J.L., and P.-Z.P.; writing—original draft preparation, Y.-H.H. and S.-F.O. All authors have read and agreed to the published version of the manuscript.

Funding

This research was funded by the Ministry of Science and Technology of Taiwan to Yi-Huang Hsueh, grant number MOST 109-2637-E-992-005.

Data Availability Statement

Not applicable.

Conflicts of Interest

The authors declare no conflict of interest.

References

  1. Chen, W.; Lv, G.; Hu, W.; Li, D.; Chen, S.; Dai, Z. Synthesis and applications of graphene quantum dots: A review. Nanotechnol. Rev. 2018, 7, 157–185. [Google Scholar] [CrossRef]
  2. Li, M.; Chen, T.; Gooding, J.J.; Liu, J. Review of carbon and graphene quantum dots for sensing. ACS Sens. 2019, 4, 1732–1748. [Google Scholar] [CrossRef] [PubMed]
  3. Tajik, S.; Dourandish, Z.; Zhang, K.; Beitollahi, H.; Van Le, Q.; Jang, H.W.; Shokouhimehr, M. Carbon and graphene quantum dots: A review on syntheses, characterization, biological and sensing applications for neurotransmitter determination. RSC Adv. 2020, 10, 15406–15429. [Google Scholar] [CrossRef] [Green Version]
  4. Zheng, X.T.; Ananthanarayanan, A.; Luo, K.Q.; Chen, P. Glowing graphene quantum dots and carbon dots: Properties, syntheses, and biological applications. Small 2015, 11, 1620–1636. [Google Scholar] [CrossRef]
  5. Baker, S.N.; Baker, G.A. Luminescent carbon nanodots: Emergent nanolights. Angew. Chem. Int. Ed. 2010, 49, 6726–6744. [Google Scholar] [CrossRef]
  6. Li, K.; Liu, W.; Ni, Y.; Li, D.; Lin, D.; Su, Z.; Wei, G. Technical synthesis and biomedical applications of graphene quantum dots. J. Mater. Chem. B 2017, 5, 4811–4826. [Google Scholar] [CrossRef]
  7. Pan, M.; Xie, X.; Liu, K.; Yang, J.; Hong, L.; Wang, S. Fluorescent carbon quantum dots—Synthesis, functionalization and sensing application in food analysis. Nanomaterials 2020, 10, 930. [Google Scholar] [CrossRef]
  8. Molaei, M.J. Carbon quantum dots and their biomedical and therapeutic applications: A review. RSC Adv. 2019, 9, 6460–6481. [Google Scholar] [CrossRef]
  9. Su, W.; Wu, H.; Xu, H.; Zhang, Y.; Li, Y.; Li, X.; Fan, L. Carbon dots: A booming material for biomedical applications. Mater. Chem. Front. 2020, 4, 821–836. [Google Scholar] [CrossRef]
  10. Zhu, S.; Song, Y.; Zhao, X.; Shao, J.; Zhang, J.; Yang, B. The photoluminescence mechanism in carbon dots (graphene quantum dots, carbon nanodots, and polymer dots): Current state and future perspective. Nano Res. 2015, 8, 355–381. [Google Scholar] [CrossRef]
  11. Atchudan, R.; Edison, T.N.J.I.; Mani, S.; Perumal, S.; Thirunavukkarasu, S.; Lee, Y.-R. Sustainable synthesis of carbon quantum dots from banana peel waste using hydrothermal process for in vivo bioimaging. Phys. E 2021, 126, 114417. [Google Scholar] [CrossRef]
  12. Edison, T.N.J.I.; Atchudan, R.; Karthik, N.; Xiong, D.-S.; Lee, Y.-R. Facile hydrothermal synthesis of nitrogen rich blue fluorescent carbon dots for cell bio-imaging of Candida albicans. Process Biochem. 2020, 88, 113–119. [Google Scholar] [CrossRef]
  13. Xu, Y.; Liu, J.; Gao, C.; Wang, E. Applications of carbon quantum dots in electrochemiluminescence: A mini review. Electrochem. Commun. 2014, 48, 151–154. [Google Scholar] [CrossRef]
  14. Das, R.; Bandyopadhyay, R.; Pramanik, P. Carbon quantum dots from natural resource: A review. Mater. Today Chem. 2018, 8, 96–109. [Google Scholar] [CrossRef]
  15. Yoo, D.; Park, Y.; Cheon, B.; Park, M.H. Carbon dots as an effective fluorescent sensing platform for metal ion detection. Nanoscale Res. Lett. 2019, 14, 1–13. [Google Scholar] [CrossRef] [Green Version]
  16. Fan, H.; Zhang, M.; Bhandari, B.; Yang, C.H. Food waste as a carbon source in carbon quantum dots technology and their applications in food safety detection. Trends Food Sci. Technol. 2020, 95, 86–96. [Google Scholar] [CrossRef]
  17. Wang, X.; Feng, Y.; Dong, P.; Huang, J. A mini review on carbon quantum dots: Preparation, properties, and electrocatalytic application. Front. Chem. 2019, 7, 671. [Google Scholar] [CrossRef]
  18. Atchudan, R.; Edison, T.N.J.I.; Mani, S.; Perumal, S.; Vinodh, R.; Thirunavukkarasu, S.; Lee, Y.-R. Facile synthesis of a novel nitrogen-doped carbon dot adorned zinc oxide composite for photodegradation of methylene blue. Dalton Trans 2020, 49, 17725–17736. [Google Scholar] [CrossRef]
  19. Zhang, Z.; Zhang, J.; Chen, N.; Qu, L. Graphene quantum dots: An emerging material for energy-related applications and beyond. Energy Environ. Sci. 2012, 5, 8869–8890. [Google Scholar] [CrossRef]
  20. Nikazar, S.; Sivasankarapillai, V.S.; Rahdar, A.; Gasmi, S.; Anumol, P.; Shanavas, M.S. Revisiting the cytotoxicity of quantum dots: An in-depth overview. Biophys. Rev. 2020, 12, 703–718. [Google Scholar] [CrossRef]
  21. Wang, Z.; Tang, M. The cytotoxicity of core-shell or non-shell structure quantum dots and reflection on environmental friendly: A review. Environ. Res. 2020, 194, 110593. [Google Scholar]
  22. Song, Y.; Wu, Y.; Wang, H.; Liu, S.; Song, L.; Li, S.; Tan, M. Carbon quantum dots from roasted Atlantic salmon (Salmo salar L.): Formation, biodistribution and cytotoxicity. Food Chem. 2019, 293, 387–395. [Google Scholar] [CrossRef] [PubMed]
  23. Fatahi, Z.; Esfandiari, N.; Ehtesabi, H.; Bagheri, Z.; Tavana, H.; Ranjbar, Z.; Latifi, H. Physicochemical and cytotoxicity analysis of green synthesis carbon dots for cell imaging. EXCLI J. 2019, 18, 454. [Google Scholar]
  24. Li, D.; Na, X.; Wang, H.; Xie, Y.; Cong, S.; Song, Y.; Xu, X.; Zhu, B.-W.; Tan, M. Fluorescent carbon dots derived from maillard reaction products: Their properties, biodistribution, cytotoxicity, and antioxidant activity. J. Agric. Food Chem. 2018, 66, 1569–1575. [Google Scholar] [CrossRef] [PubMed]
  25. Chung, Y.J.; Kim, K.; Lee, B.I.; Park, C.B. Carbon Nanodot-sensitized modulation of Alzheimer’s β-Amyloid self-Assembly, disassembly, and toxicity. Small 2017, 13, 1700983. [Google Scholar] [CrossRef] [PubMed]
  26. Han, M.; Zhu, S.; Lu, S.; Song, Y.; Feng, T.; Tao, S.; Liu, J.; Yang, B. Recent progress on the photocatalysis of carbon dots: Classification, mechanism and applications. Nano Today 2018, 19, 201–218. [Google Scholar] [CrossRef]
  27. Sciortino, A.; Cannizzo, A.; Messina, F. Carbon nanodots: A review—From the current understanding of the fundamental photophysics to the full control of the optical response. C J. Carbon Res. 2018, 4, 67. [Google Scholar] [CrossRef] [Green Version]
  28. Bacon, M.; Bradley, S.J.; Nann, T. Graphene quantum dots. Part. Part. Syst. Char. 2014, 31, 415–428. [Google Scholar] [CrossRef]
  29. Chandra, S.; Pathan, S.H.; Mitra, S.; Modha, B.H.; Goswami, A.; Pramanik, P. Tuning of photoluminescence on different surface functionalized carbon quantum dots. RSC Adv. 2012, 2, 3602–3606. [Google Scholar] [CrossRef]
  30. Liu, Z.; Zou, H.; Wang, N.; Yang, T.; Peng, Z.; Wang, J.; Li, N.; Huang, C. Photoluminescence of carbon quantum dots: Coarsely adjusted by quantum confinement effects and finely by surface trap states. Sci. China Chem. 2018, 61, 490–496. [Google Scholar] [CrossRef]
  31. Wang, N.; Fan, H.; Sun, J.; Han, Z.; Dong, J.; Ai, S. Fluorine-doped carbon nitride quantum dots: Ethylene glycol-assisted synthesis, fluorescent properties, and their application for bacterial imaging. Carbon 2016, 109, 141–148. [Google Scholar] [CrossRef]
  32. Weng, C.-I.; Chang, H.-T.; Lin, C.-H.; Shen, Y.-W.; Unnikrishnan, B.; Li, Y.-J.; Huang, C.-C. One-step synthesis of biofunctional carbon quantum dots for bacterial labeling. Biosens. Bioelectron. 2015, 68, 1–6. [Google Scholar] [CrossRef]
  33. Das, P.; Bose, M.; Ganguly, S.; Mondal, S.; Das, A.K.; Banerjee, S.; Das, N.C. Green approach to photoluminescent carbon dots for imaging of gram-negative bacteria Escherichia coli. Nanotechnology 2017, 28, 195501. [Google Scholar] [CrossRef]
  34. Pal, T.; Mohiyuddin, S.; Packirisamy, G. Facile and green synthesis of multicolor fluorescence carbon dots from curcumin: In vitro and in vivo bioimaging and other applications. ACS Omega 2018, 3, 831–843. [Google Scholar] [CrossRef] [Green Version]
  35. Baig, M.M.F.; Chen, Y.-C. Bright carbon dots as fluorescence sensing agents for bacteria and curcumin. J. Colloid Interface Sci. 2017, 501, 341–349. [Google Scholar] [CrossRef]
  36. Pathak, A.; Suneesh, P.; Stanley, J.; Babu, T.S. Multicolor emitting N/S-doped carbon dots as a fluorescent probe for imaging pathogenic bacteria and human buccal epithelial cells. Microchim. Acta 2019, 186, 157. [Google Scholar]
  37. Wang, J.; Xiang, X.; Milcovich, G.; Chen, J.; Chen, C.; Feng, J.; Hudson, S.P.; Weng, X.; Ruan, Y. Nitrogen and sulfur co-doped carbon nanodots toward bovine hemoglobin: A fluorescence quenching mechanism investigation. J. Mol. Recognit. 2019, 32, e2761. [Google Scholar] [CrossRef]
  38. Yang, J.; Zhang, X.; Ma, Y.-H.; Gao, G.; Chen, X.; Jia, H.-R.; Li, Y.-H.; Chen, Z.; Wu, F.-G. Carbon dot-based platform for simultaneous bacterial distinguishment and antibacterial applications. ACS Appl. Mater. Interfaces 2016, 8, 32170–32181. [Google Scholar] [CrossRef]
  39. Nandi, S.; Ritenberg, M.; Jelinek, R. Bacterial detection with amphiphilic carbon dots. Analyst 2015, 140, 4232–4237. [Google Scholar] [CrossRef] [Green Version]
  40. Hsueh, Y.-H.; Lin, K.-S.; Ke, W.-J.; Hsieh, C.-T.; Chiang, C.-L.; Tzou, D.-Y.; Liu, S.-T. The antimicrobial properties of silver nanoparticles in Bacillus subtilis are mediated by released Ag+ ions. PLoS ONE 2015, 10, e0144306. [Google Scholar]
  41. Hsueh, Y.-H.; Tsai, P.-H.; Lin, K.-S. Ph-dependent antimicrobial properties of copper oxide nanoparticles in Staphylococcus aureus. Int. J. Mol. Sci. 2017, 18, 793. [Google Scholar] [CrossRef] [PubMed] [Green Version]
  42. Wang, L.; Wang, Y.; Xu, T.; Liao, H.; Yao, C.; Liu, Y.; Li, Z.; Chen, Z.; Pan, D.; Sun, L. Gram-scale synthesis of single-crystalline graphene quantum dots with superior optical properties. Nat. Commun. 2014, 5, 1–9. [Google Scholar] [CrossRef] [PubMed] [Green Version]
  43. Juang, R.-S.; Fu, C.-C.; Hsieh, C.-T.; Gu, S.; Gandomi, Y.A.; Liu, S.-H. Highly luminescent aggregate-induced emission from polyethylene glycol-coated carbon quantum dot clusters under blue light illumination. J. Mater. Chem. C 2020, 8, 16569–16576. [Google Scholar] [CrossRef]
  44. Fu, C.-C.; Wu, C.-Y.; Chien, C.-C.; Hsu, T.-H.; Ou, S.-F.; Chen, S.-T.; Wu, C.-H.; Hsieh, C.-T.; Juang, R.-S.; Hsueh, Y.-H. Polyethylene Glycol6000/carbon nanodots as fluorescent bioimaging agents. Nanomaterials 2020, 10, 677. [Google Scholar] [CrossRef] [Green Version]
Figure 1. Analytical transmission electron microscopy (TEM) micrographs of N-doped carbon quantum dot (N-CQD) particles (a) at a low magnification (100 K), (b) with crystalline lattice of a single N-CQD (500 K). (c) The particle size distribution of N-CQD particles and (d) X-ray diffraction (XRD) pattern of N-CQD composite.
Crystals 11 00789 g001
Figure 2. (a) Raman spectra of N-CQD sample measured with 514-nanometer argon laser at 10 mW power, (b) UV–vis absorbance spectrum, (c) photoluminescence (PL) excitation, and (d) PL emission spectra of N-CQDs excited at 490 and 557 nm.
Crystals 11 00789 g002
Figure 3. XPS spectra of N-CQD sample: (a) C1s peak, (b) N1s peak, and (c) O1s peak, deconvoluted by a multiple Gaussian function.
Crystals 11 00789 g003
Figure 4. Fluorescence images of B. subtilis stained with N-CQDs at different concentrations. Bacillus cells were stained with 500, 1000, and 5000 ppm N-CQDs. Control was cells not stained with N-CQDs. TRITC filter detected red fluorescence, whereas FITC filter detected green fluorescence. Scale bar represents 10 μm.
Crystals 11 00789 g004
Figure 5. Microscopic fluorescence images of E. coli stained with N-CQDs. The cells were stained with N-CQDs at concentrations of 0, 500, 1000, and 5000 ppm. Control cells were assayed similarly without adding N-CQDs. Red fluorescence was detected under TRITC filter set, whereas green fluorescence was detected under FITC filter set. Scale bar represents 10 μm.
Crystals 11 00789 g005
Figure 6. Fluorescence microscopy images of B. subtilis and E. coli cells stained with 1000 ppm N-CQDs. Red fluorescence (a,c) were detected under TRITC filter set, whereas green fluorescence (b,d) were detected under FITC filter set. Scale bar represents 10 μm. Yellow arrow indicates cell septum.
Crystals 11 00789 g006
Figure 7. Fluorescence microscopy images of S. aureus, L. monocytogenes, S. enteritidis, and V. parahaemolyticus cells stained with 1000 ppm N-CQDs. Red fluorescence was detected under TRITC filter set. Scale bar represents 10 μm.
Crystals 11 00789 g007
Figure 8. Fluorescence microscopy images of B. subtilis, and E. coli stained with N-CQDs. The cells were stained with 1000 ppm N-CQDs (a,d) and DAPI (b,e) and merge (c,f) fluorescent dye. Red fluorescence was detected under TRITC filter set, whereas DAPI filter detected blue fluorescence. Scale bar represents 10 μm.
Crystals 11 00789 g008
Figure 9. Fluorescence microscopy images of B. subtilis stained with N-CQDs (b,d,f,h) and FM4-64 (a,c,e,g) membrane dye after 3 and 30 s of excitation at 490 nm. Bacillus cells were stained with 1000 ppm N-CQDs. Red fluorescence was detected under TRITC filter set. Scale bar represents 10 μm.
Crystals 11 00789 g009
Table 1. XPS analysis showing different percentages of bonding groups in the N-CQD sample.
Synthesized SampleElement Ratio (mol %)
C 1s peak
Total100.00
C=C or C-C57.09
C-N36.21
C-OH4.16
C=O2.54
N 1s peak
Total100.00
Pyrrolic/
pyridinic N
36.97
Quaternary N42.04
NOx20.99
Publisher’s Note: MDPI stays neutral with regard to jurisdictional claims in published maps and institutional affiliations.

