Article

Investigations of LiNb1−xTaxO3 Nanopowders Obtained with Mechanochemical Method

1
Department of Semiconductor Electronics, Lviv Polytechnic National University, 12, Bandery Str., 79013 Lviv, Ukraine
2
Institute for Sorption and Problems of Endoecology, NASU, 13 Gen. Naumov St., 03164 Kyiv, Ukraine
3
G.V. Kurdyumov Institute of Metal Physics NASU, 36 Acad. Vernadsky Bvd., 03142 Kyiv, Ukraine
4
Institute for Energy Research and Physical Technologies, Clausthal University of Technology, Am Stollen 19B, 38640 Goslar, Germany
5
Division of physics and technology of wide-band-gap semiconductor nanostructures, Institute of Physics PAS, 32/46 Al. Lotników, 02668 Warsaw, Poland
6
Scientific Research Company ‘Electron-Carat’, 202 Stryjska St., 79031 Lviv, Ukraine
*
Author to whom correspondence should be addressed.
Crystals 2021, 11(7), 755; https://doi.org/10.3390/cryst11070755
Submission received: 21 May 2021 / Revised: 23 June 2021 / Accepted: 25 June 2021 / Published: 28 June 2021
(This article belongs to the Special Issue New Trends in Lithium Niobate: From Bulk to Nanocrystals)

Abstract

:
Nanocrystalline compounds LiNb1−xTaxO3 of various compositions (x = 0, 0.25, 0.5, 0.75, 1) were synthesized by high-energy ball milling of the initial materials (Li2CO3, Nb2O5, Ta2O5) and subsequent high-temperature annealing of the resulting powders. Data on the phase composition of the nanopowders were obtained by X-ray diffraction methods, and the dependence of the structural parameters of LiNb1−xTaxO3 compounds on the value of x was established. As a result of the experiments, the optimal parameters of the milling and annealing runs were determined, which made it possible to obtain single-phase compounds. The Raman scattering spectra of LiNb1−xTaxO3 compounds (x = 0, 0.25, 0.5, 0.75, 1) have been investigated. Preliminary experiments have been carried out to study the temperature dependences of their electrical conductivity.

1. Introduction

Lithium niobate (LiNbO3, LN) and tantalate (LiTaO3, LT) are among the most studied oxide compounds in modern materials science. This interest is due to the widest application of these materials in functional electronics. Analytical studies of the global market for LN and LT sales performed by various marketing agencies [1,2,3,4] show that as of the end of 2020, their consumption in monetary terms exceeded $40 billion per year, and by 2027, it may reach more than $75 billion. Such impressive sales are due to the variety of electronics industry branches and devices that use LN and LT. Accordingly, the forms in which these materials are used in practice are also different—single crystals, thin films, micro- and nanopowders, ceramics. Moreover, they can have a different chemical composition—congruent, stoichiometric, and contain various dopants of metal ions. It is obvious that such a variety of forms and applications again requires research to modify and optimize material properties.
LiNb1−xTaxO3 (LN-LT) solid solutions have recently been studied (see, for example, [5,6,7,8]), while they open up prospects for combining the advantages of both materials. In particular, the LN-LT can be expected to exhibit high piezoelectric coefficients (close to LN) and the temperature stability of the LT properties. However, the growth of LN-LT single crystals is challenging because of the deviation from stoichiometry inherent in LN and LT crystals, the uneven distribution of cations caused by fluctuations in the temperature fields in the crystal growth zone, and differences in the melting temperatures Tm of both end components of the system (Tm(LiNbO3) = 1240 °C; Tm(LiTaO3) = 1650 °C).
Meanwhile, LN-LT nanoparticles can be attractive both for practical application and from the point of view of fundamental research, for example, to determine the dependence of the LiNb1−xTaxO3 structural characteristics depending on the composition.
Today, wet chemistry methods are most commonly used to obtain LN and LT nanoparticles. Among them, the sol–gel method predominates, when Nb or Ta pentaetoxides and Li ethoxide or salts—acetates, citrates, nitrates [1,2,3,4,5,9,10,11,12,13,14]—are chosen as starting materials for obtaining xerogels. Since alcoxides are extremely sensitive to moisture and susceptible to hydrolysis, the entire synthesis procedure must be carried out in a box filled with pure dry N2 or Ar. In [7,15], LN nanoparticles were synthesized by the sol–gel method using a solution of NbCl5 in toluol and LiNO3 as starting materials. However, even in this case, part of the technological operations must be performed in a dry N2 or Ar environment. In addition, in the sol–gel method, NbF5 or TaF5, obtained by the action of HF on niobium and tantalum oxides, can be used as starting materials (see, e.g., [16,17]).
Another method to obtain LN nanoparticles is the solution combustion method. For example, the authors of [18] have successfully synthesized LiNbO3 and LiNbO3:Fe nanopowders. The starting materials were LiNO3, aqueous iron nitrate Fe(NO3)3·9H2O, ammonium niobium (V) oxalate hydrate C4H4NNbO9·nH2O, and glycine C2H5NO2. After mixing and long stirring of the starting materials, a precursor was formed, which was calcinated at a temperature of 600 °C for 1 h in an O2 atmosphere.
Another wet method is solvothermal synthesis, which was used to obtain LiTaO3 nanopowders [19]. The authors used an autoclave, 80% of the volume of which was filled with a Li2CO3 solution in a mixture of distilled water and glycol with the addition of an appropriate amount of Ta2O5. The autoclave was kept at 240 °C, and the contents were constantly stirred for 12 h under autogenous pressure. The resulting LT nanopowders were washed, centrifuged, and calcinated.
The preparation of LN and LT nanoparticles by wet chemistry shows that there are certain difficulties in their application. First of all, this is the multistage nature of technological processes (dissolution, mixing, stirring, centrifugation, high-temperature treatment, calcination, etc.): the use of a large number of organic and inorganic reagents, including hazardous; performing synthesis in a special environment; use of relatively high temperatures. These factors make the process of obtaining nanoparticles time-consuming and expensive. In addition, an increase in the number of technological operations and the number of reagents used increases the probability of errors in the synthesis. Finally, the production of nanopowders in large quantities is complicated using the methods described above.
In contrast to wet chemistry methods, high-energy ball milling with subsequent annealing of powders looks promising from a technological point of view with relatively simple production organization. The synthesis process consists of only two stages—milling and subsequent annealing, which could be performed in air. Only Li2CO3, Nb2O5, and Ta2O5 can be used as starting materials. Today, we are aware of only three works that describe the successful synthesis of LN nanopowders by the mechanochemical method [20,21,22].
In addition, in [23,24], in order to obtain nanocrystals of lithium niobate, the preliminary synthesized LiNbO3 phase was milled. In [23], LN obtained by the solid-phase reaction between lithium carbonate and niobium pentoxide was subjected to milling. In [24], the remnants of the melt solidified in the crucible after the completion of the procedure for growing the LN single crystal by the Czochralski method were used for milling. To the best of our knowledge, there are no works devoted to the mechanochemical synthesis of LT nanopowders. Furthermore, the synthesis and properties of nanopowders of LiNb1−xTaxO3 solid solutions, with 0 < x <1, remain completely unexplored.
This work focuses on the preparation of LiNb1−xTaxO3 nanopowders of different compositions (x = 0, 0.25, 0.5, 0.75, 1), using the mechanochemical synthesis method (high-energy ball milling of the starting materials Li2CO3, Nb2O5, Ta2O5 and subsequent annealing). Furthermore, the crystal structure, Raman spectra, and electrophysical properties of obtained LN-LT compounds are studied.

2. Materials and Methods

The mixed lithium niobate–tantalate nanopowders with nominal compositions LiNb1−xTaxO3 (x = 0, 0.25, 0.5, 0.75 and 1) were obtained by high-energy ball milling mixtures of Li2CO3, Nb2O5, and Ta2O5 powders (manufactured by Alfa Aesar, purity 4N) taken in molar ratios corresponding to stoichiometric compositions. The masses of the components for obtaining compounds with a certain x value are given in Table 1.
The synthesis was performed with the planetary ball mill machine Pulverisette-7. The rotation speed was equal to 600 rpm, and the duration of milling was about 10–15 h. A total of 134 balls of zirconium dioxide with a diameter of 5 mm and total weight of 91.5 g were used as working bodies. The mass ratio ball/sample was about 10. Milling was performed in 15 min cycles; subsequently, a reverse was carried out after each cycle. Based on the results of previous investigations (see, e.g., [21] where LiNbO3 nanoparticles were synthesized by a mechanochemical technique), one can assume that the surfaces of particles are activated, but the synthesis exactly of an LN-LT compound was not fully completed after milling. This is confirmed by X-ray analysis of the powders performed after milling. As an example, Figure 1 shows a diffraction pattern of a powder with x = 0.5 compared to the reference pattern of a lithium niobate powder from the PDF database. The results of X-ray phase analysis indicate the formation of a predominantly amorphous precursor and partially a perovskite-like phase of lithium niobate.
To obtain nanocrystalline LN-LT particles, subsequent annealing of powders was performed. To determine the range for selecting the optimal annealing temperature, thermal analysis curves of the powders after milling were recorded. These dependences for all samples had a similar character. As an example, Figure 2 shows the thermogravimetric curves for milled mixture corresponding to LiNb0.5Ta0.5O3 powder. As can be seen, sharp mass loss is observed within 400–550 °C (TG and DTG curves). This event corresponds to the decomposition of lithium carbonate according to (1):
Li2CO3 = Li2O + CO2
At the same time, it is known that lithium carbonate decomposes above 800 °C [25]. Therefore, significant lowering of the temperature of this process is observed after milling the reaction mixture. In addition, the experimental value of mass loss in the temperature range 400–550 °C is about 20% of the theoretical value calculated by (1). The latter indicates that about 80% of lithium carbonate is decomposed at the stage of milling. Above 550 °C, the interaction of the formed lithium oxide with niobium (tantalum) oxides according to Reaction (2) occurs:
Li2O + Nb2O5(Ta2O5) = 2LiNb(Ta)O3.
Based on the obtained results, three annealing temperatures in air were chosen for the experiments—550, 700, and 800 °C.
Phase compositions of obtained nanoparticles were studied by X-ray phase analysis using the modernized DRON-3M diffractometer. Crystal structure parameters (unit cell dimensions, positional and displacement parameters of atoms) of both series of the materials were derived by full profile Rietveld refinement by using the WinCSD program package for structural analysis [26].
The micro-Raman spectra of LN-LT nanopowders were registered by confocal Raman microscope spectrometer MonoVista CRS+. The laser beam (λ = 532 nm) was focused in a 1 mm spot on the surface of pressured nanopowder.
Temperature dependencies of electrical conductivity in the range from 300 to 820 °C were obtained via impedance measurements in the frequency range from 1 Hz to 1 MHz using impedance gain-phase analyzer (Solartron 1260, Ametek Scientific Instruments, Hampshire, UK). For this experiment, pressed pellets with thickness varying from 1.25 to 1.7 mm and diameter of 10 mm were formed from LiNbxTa1−xO3 nanopowders with x = 0, 0.25, 0.5, 0.75, and 1. Throughout the preparation process, the samples were heated up to 210 °C at the rate of 2 °C/min, while the pressure applied was 190 MPa at all times. Additionally, a constant voltage of 1 kV has been applied to the samples with an intention to electrically polarize them. The so-obtained pellets were subsequently annealed in air at 600 °C for 6 h. Platinum electrodes (5 mm in diameter) were deposited on both sides of each sample via screen printing (print ink: Ferro Corporation, No. 6412 0410). The samples were subsequently thermally treated for 1 h at 800 °C to ensure electrode adhesion.
Scanning electron microscopy (SEM) imaging of LiNb0.5Ta0.5O3 sample has been performed after initial annealing at 600 °C (Figure 3) and after impedance measurements (Figure 4). The comparison of these two images reveals an increase in average grain size from approximately 100 to 200 nm due to temperature treatment during electrode preparation and the impedance studies. The SEM analysis after the impedance spectroscopy experiment, performed on a larger fragment of the sample, also demonstrates a high homogeneity of grain size distribution along the area.
Obtained impedance spectra of LiNbxTa1−xO3 pressed samples are represented in form of Nyquist diagrams. Subsequently, an electrical equivalent-circuit model consisting of a constant phase element (CPE) connected in parallel with a bulk resistance RB is fitted to the measured data. The intercepts of semicircles in the range of low frequencies are interpreted as samples resistance and subsequently converted to conductivity using the relation σ = t(A × RB)−1, where t and A are the thickness of the sample and the electrode area, respectively.

3. Results and Discussion

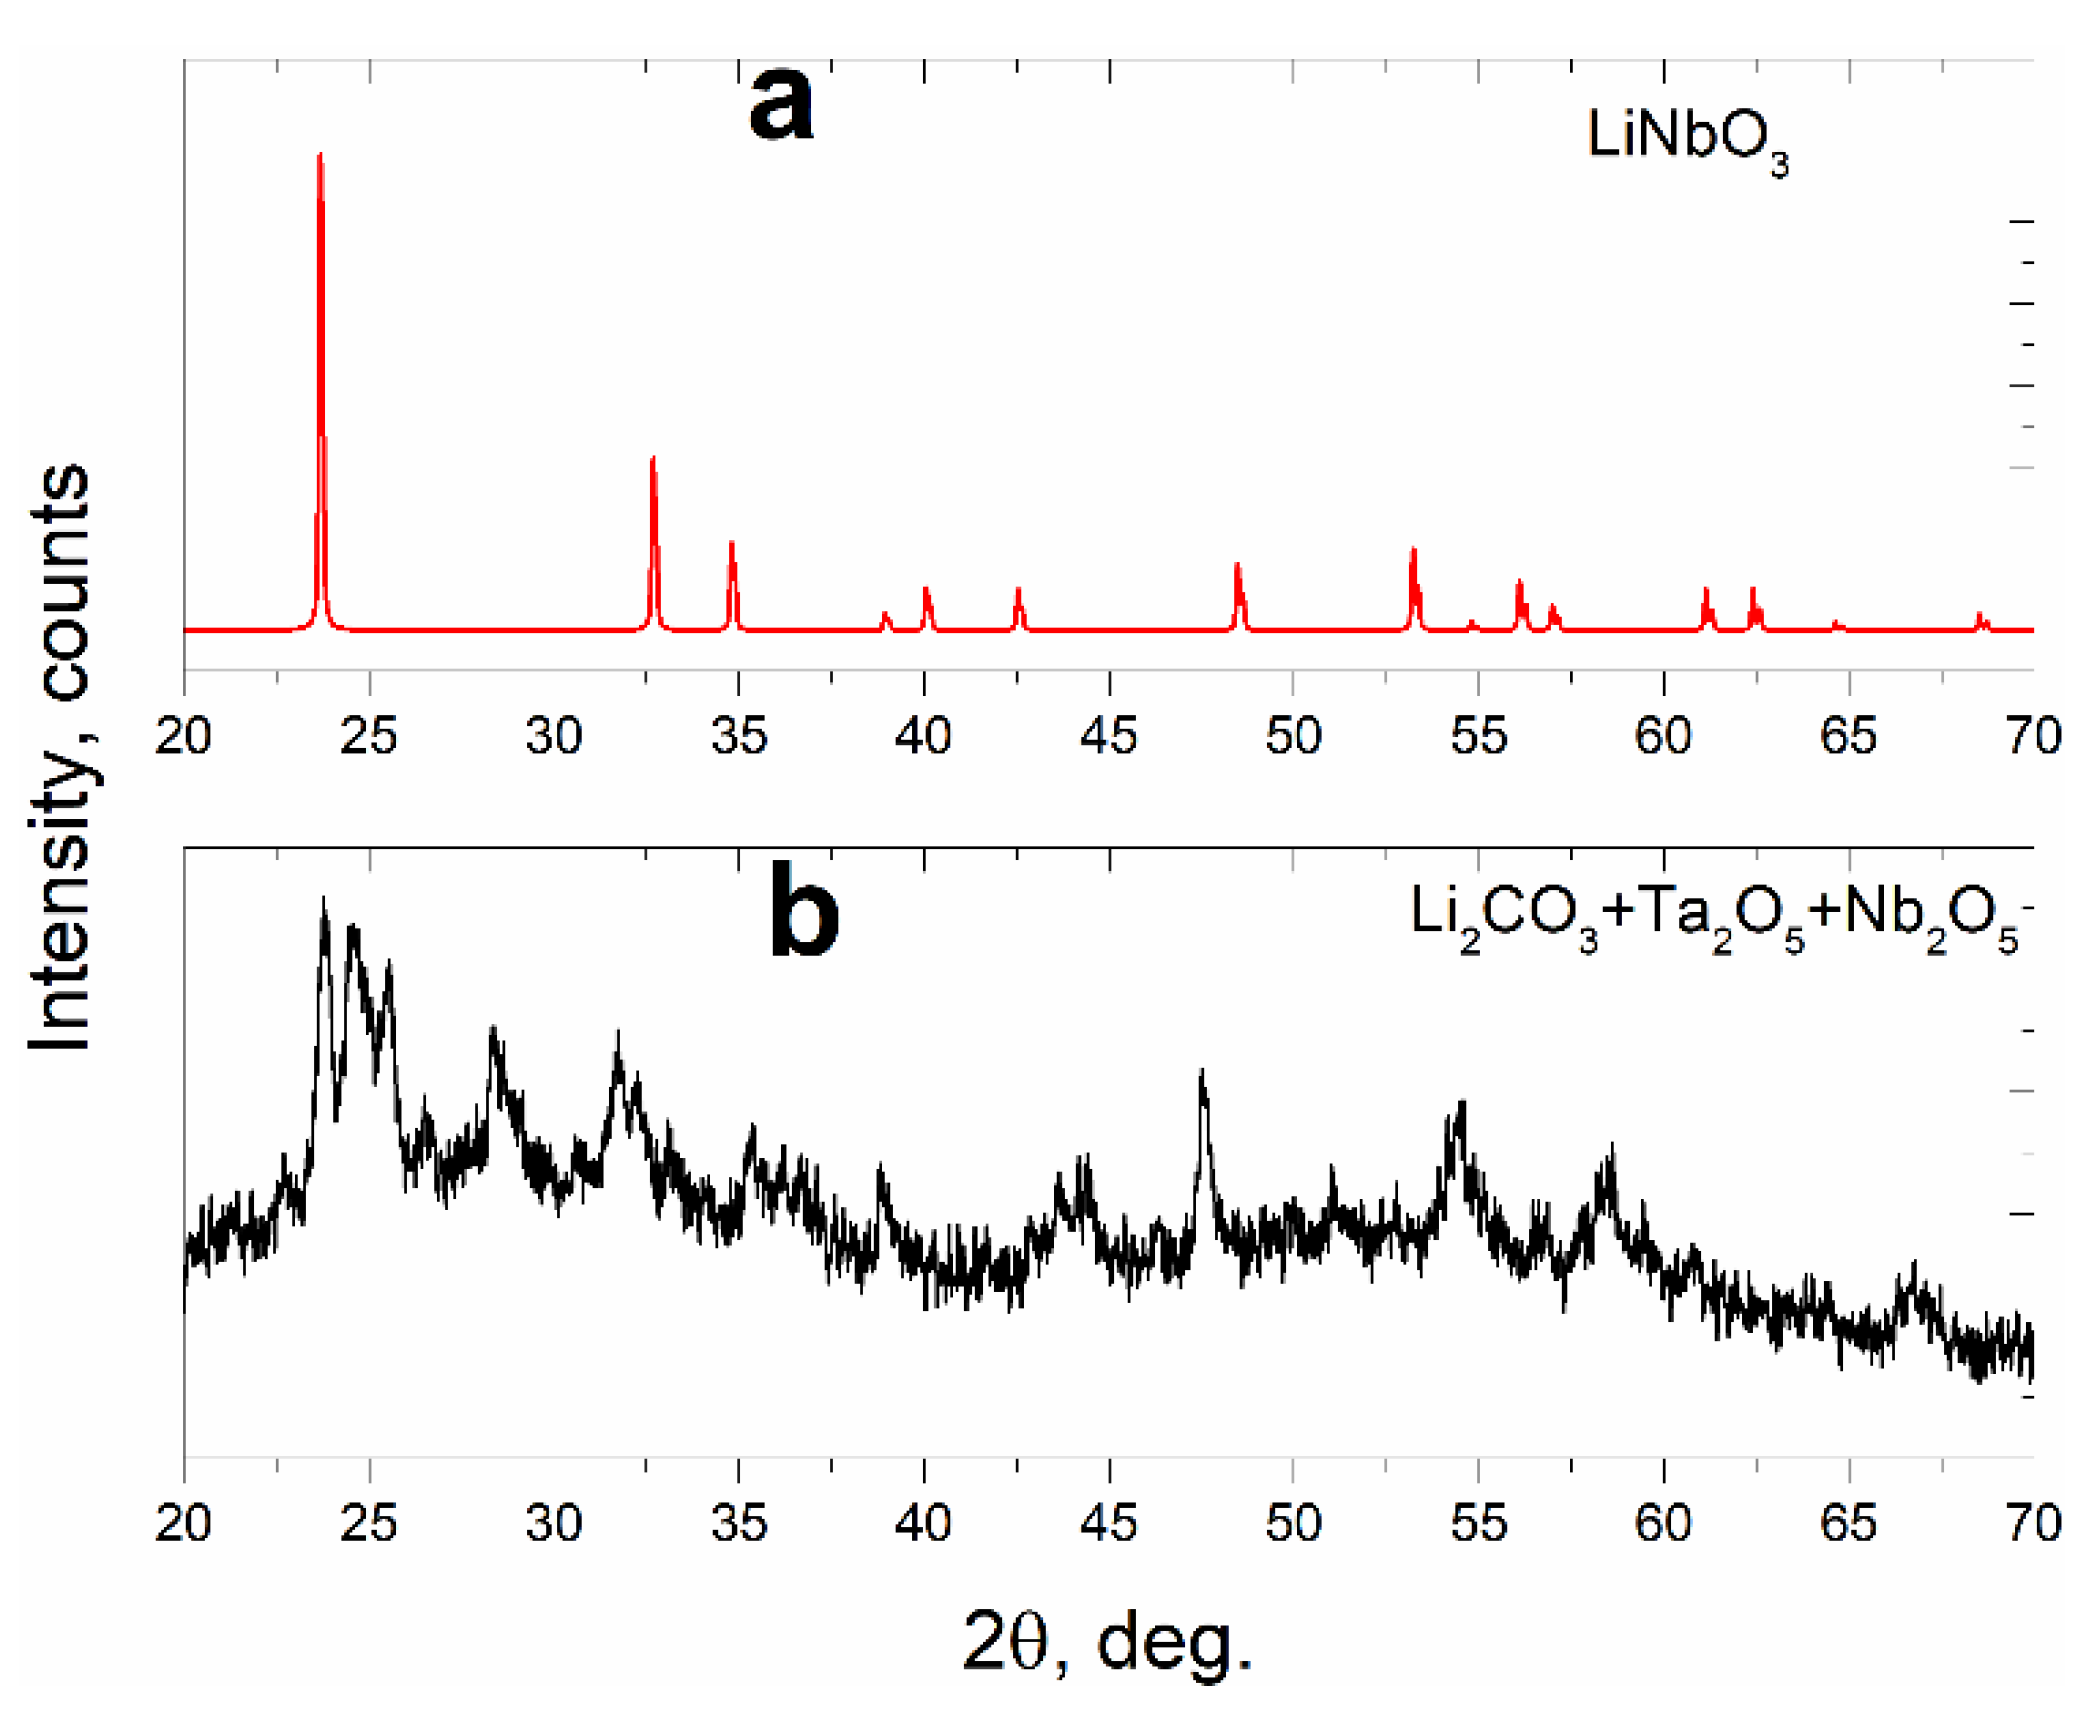
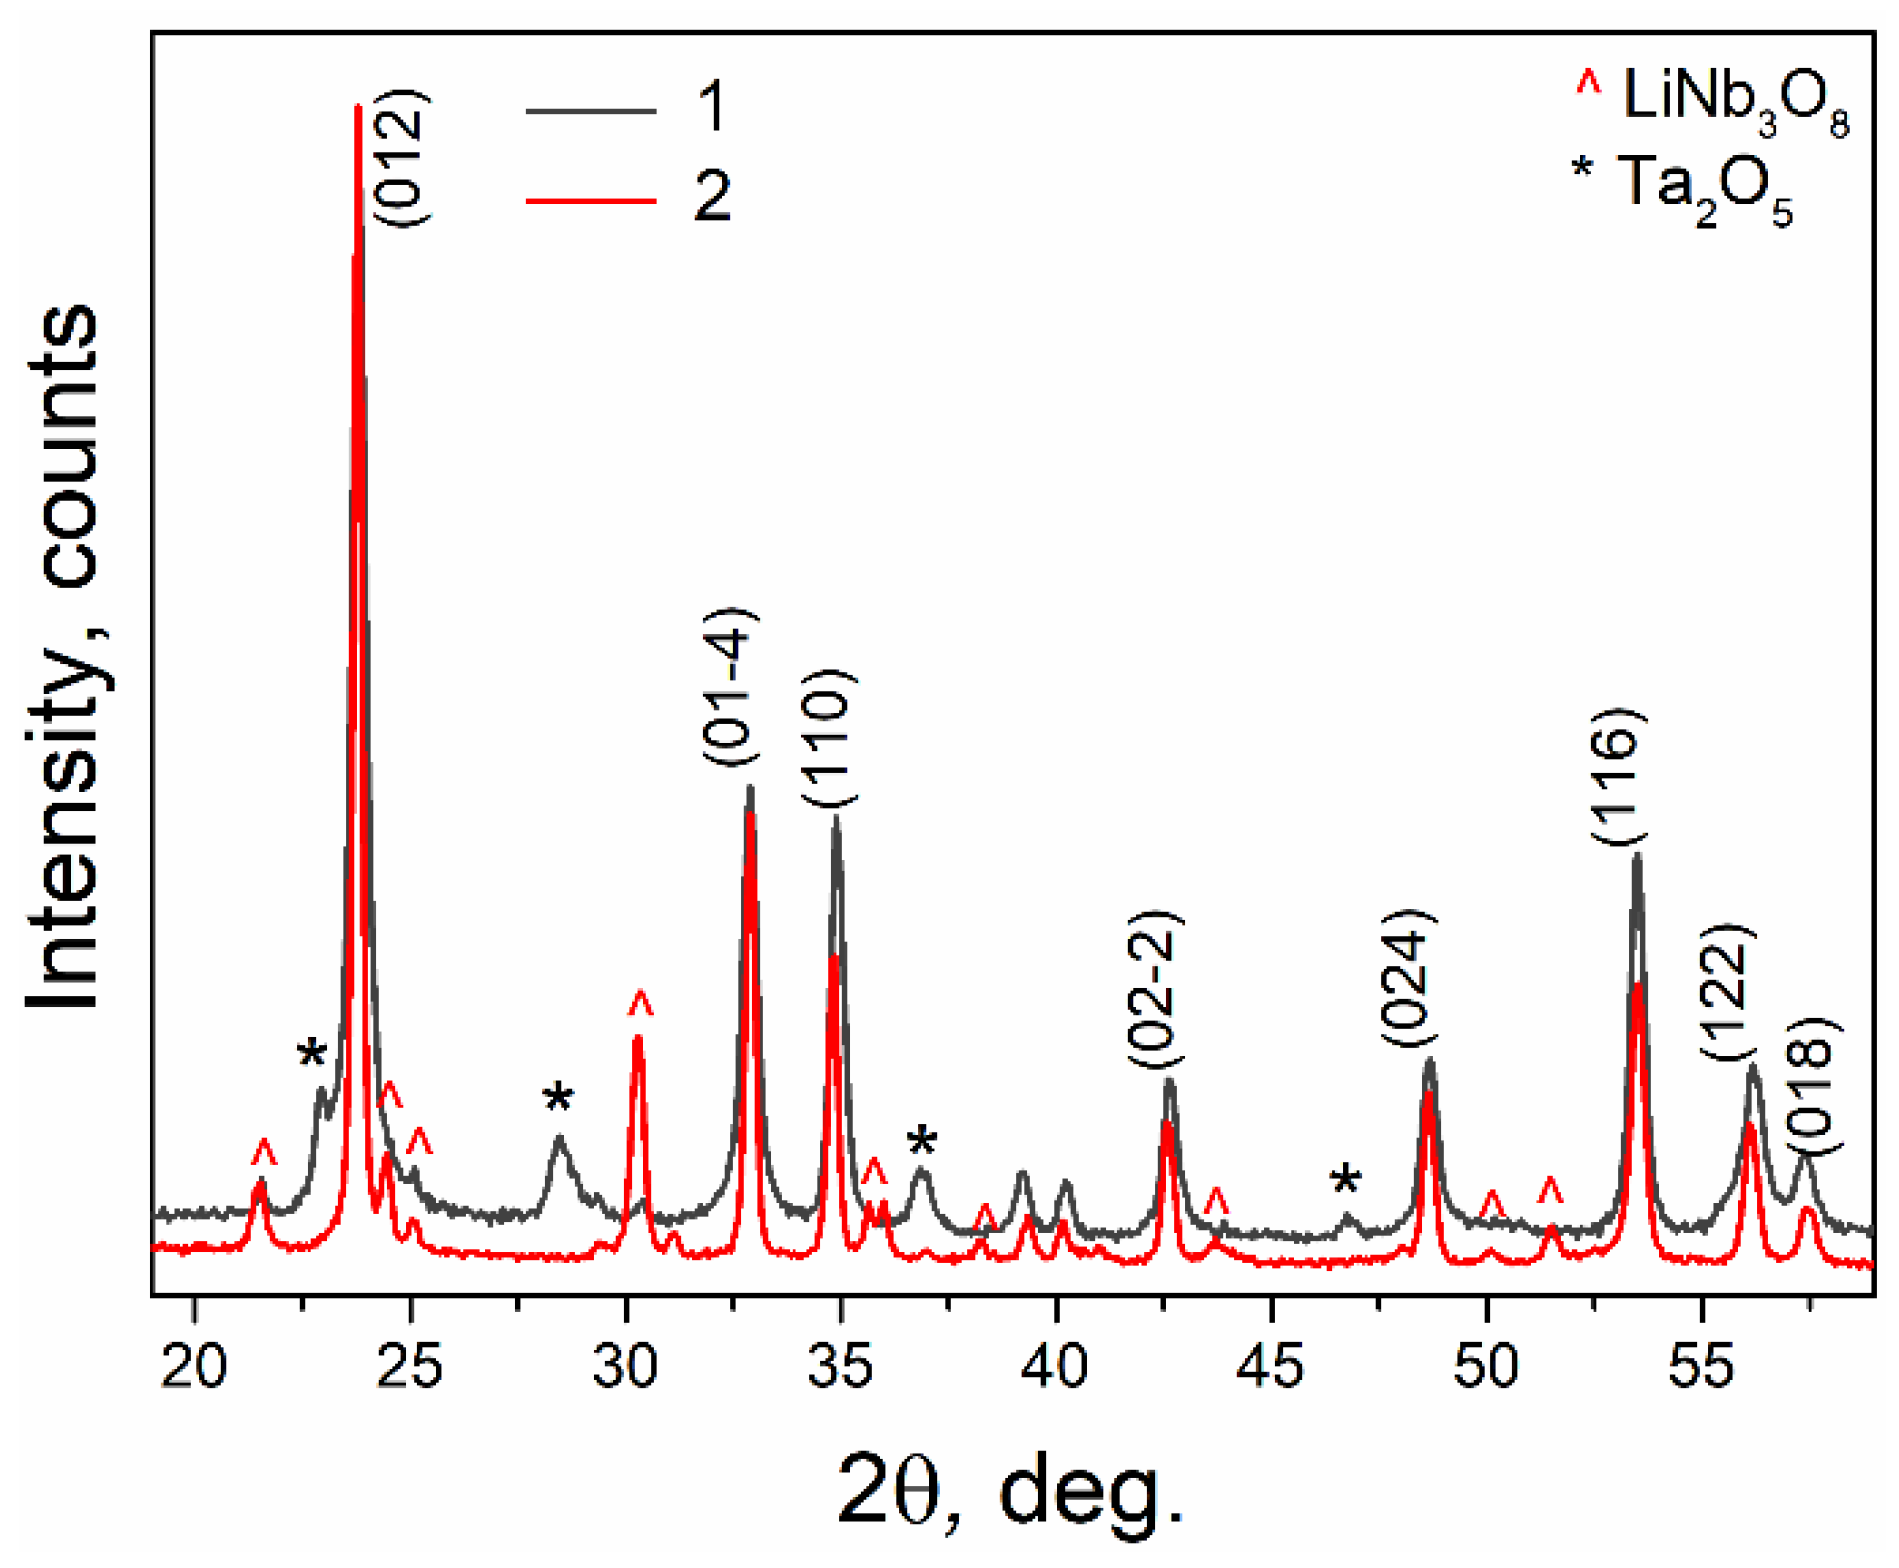
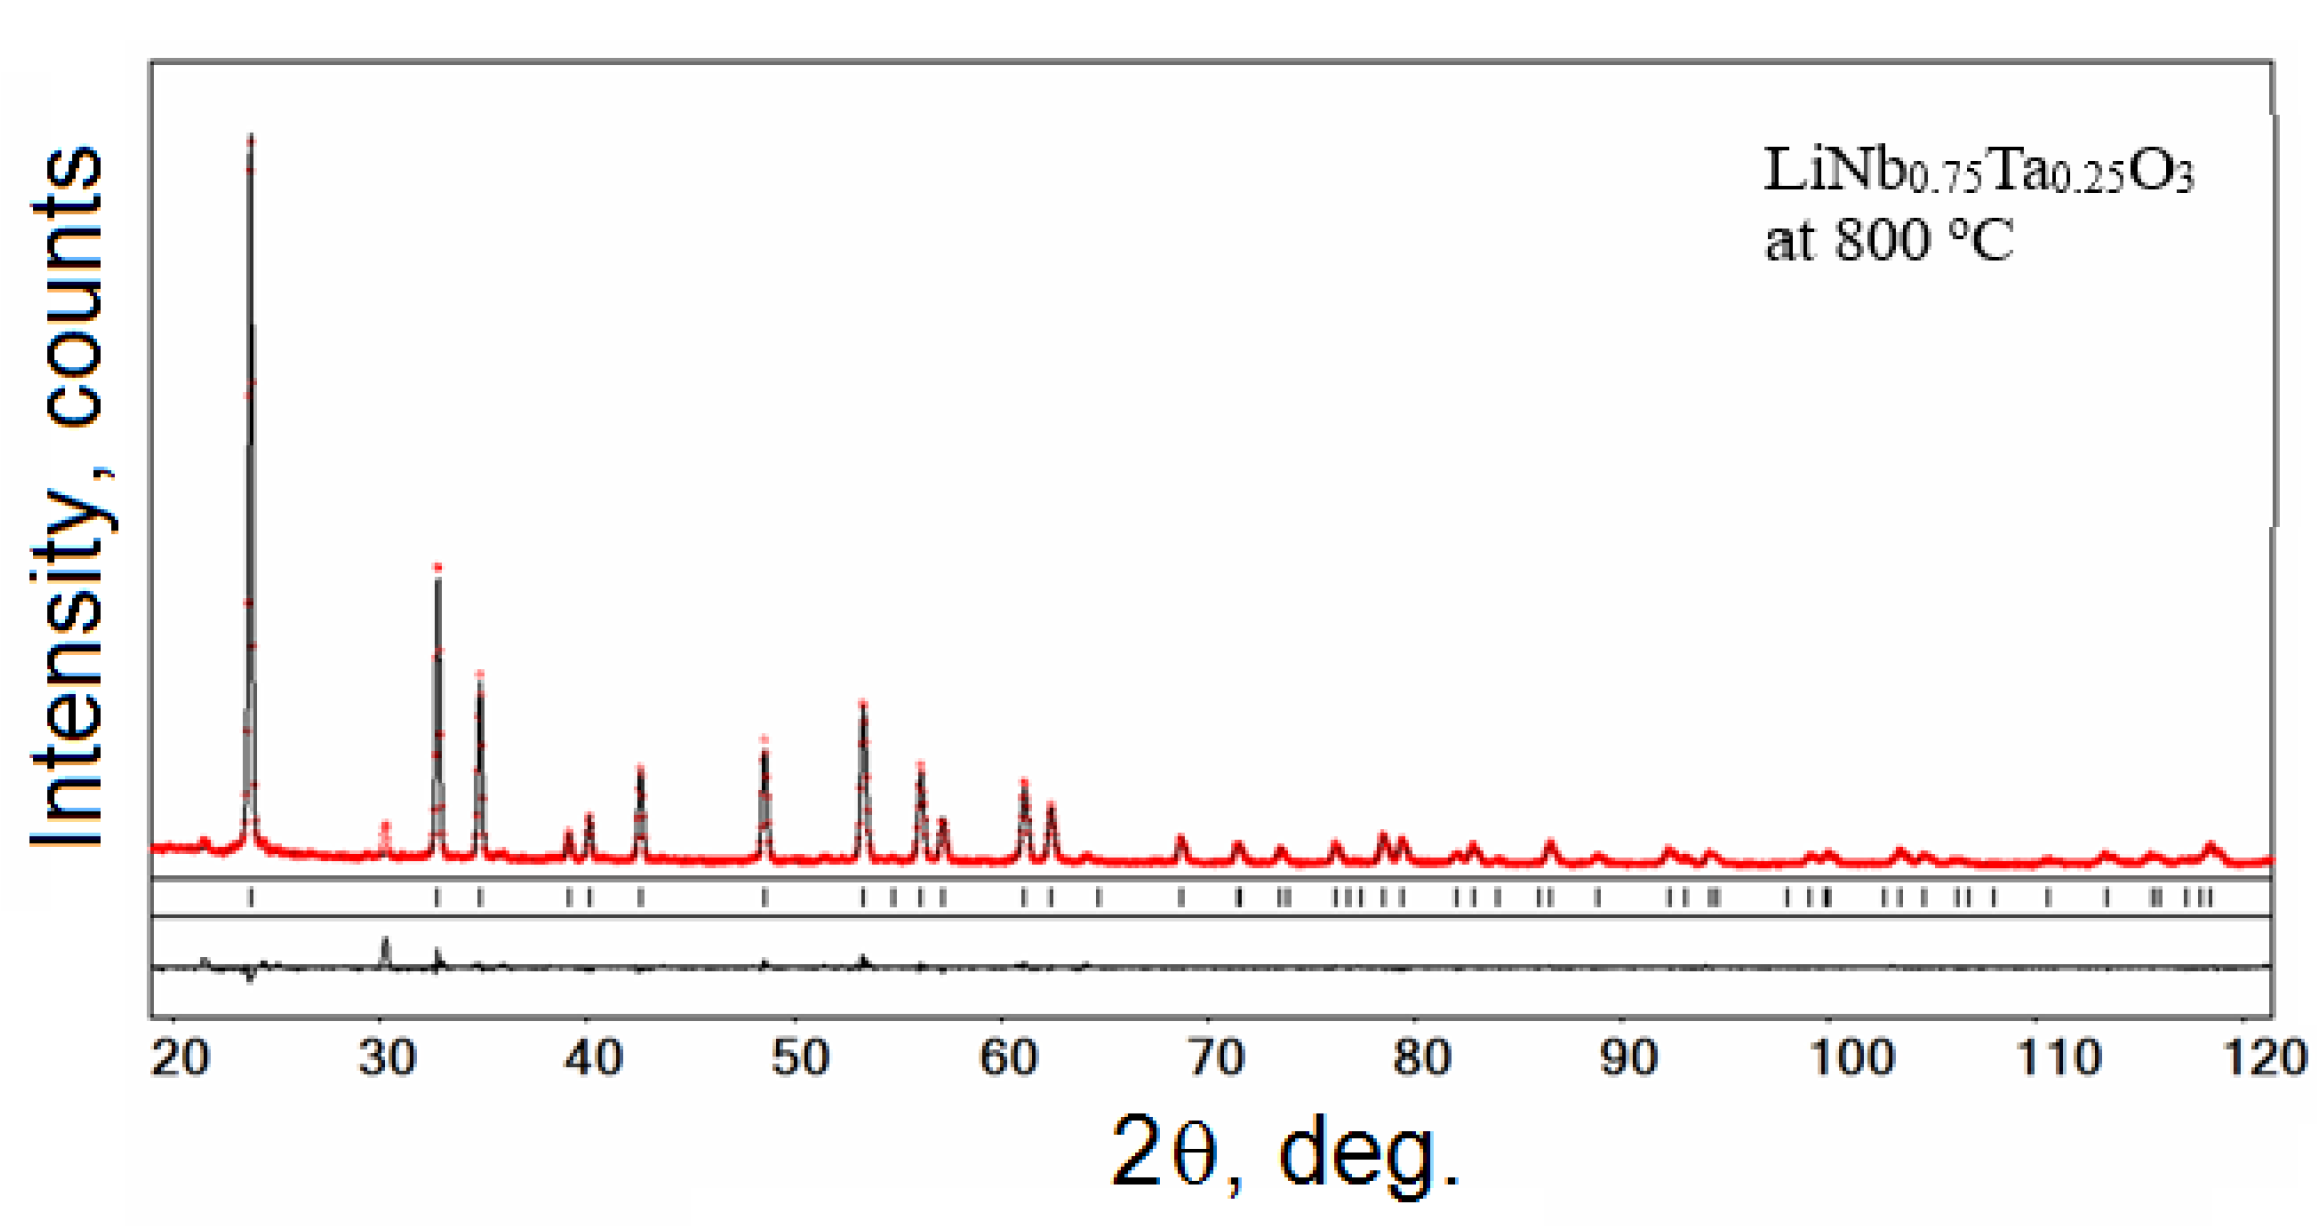
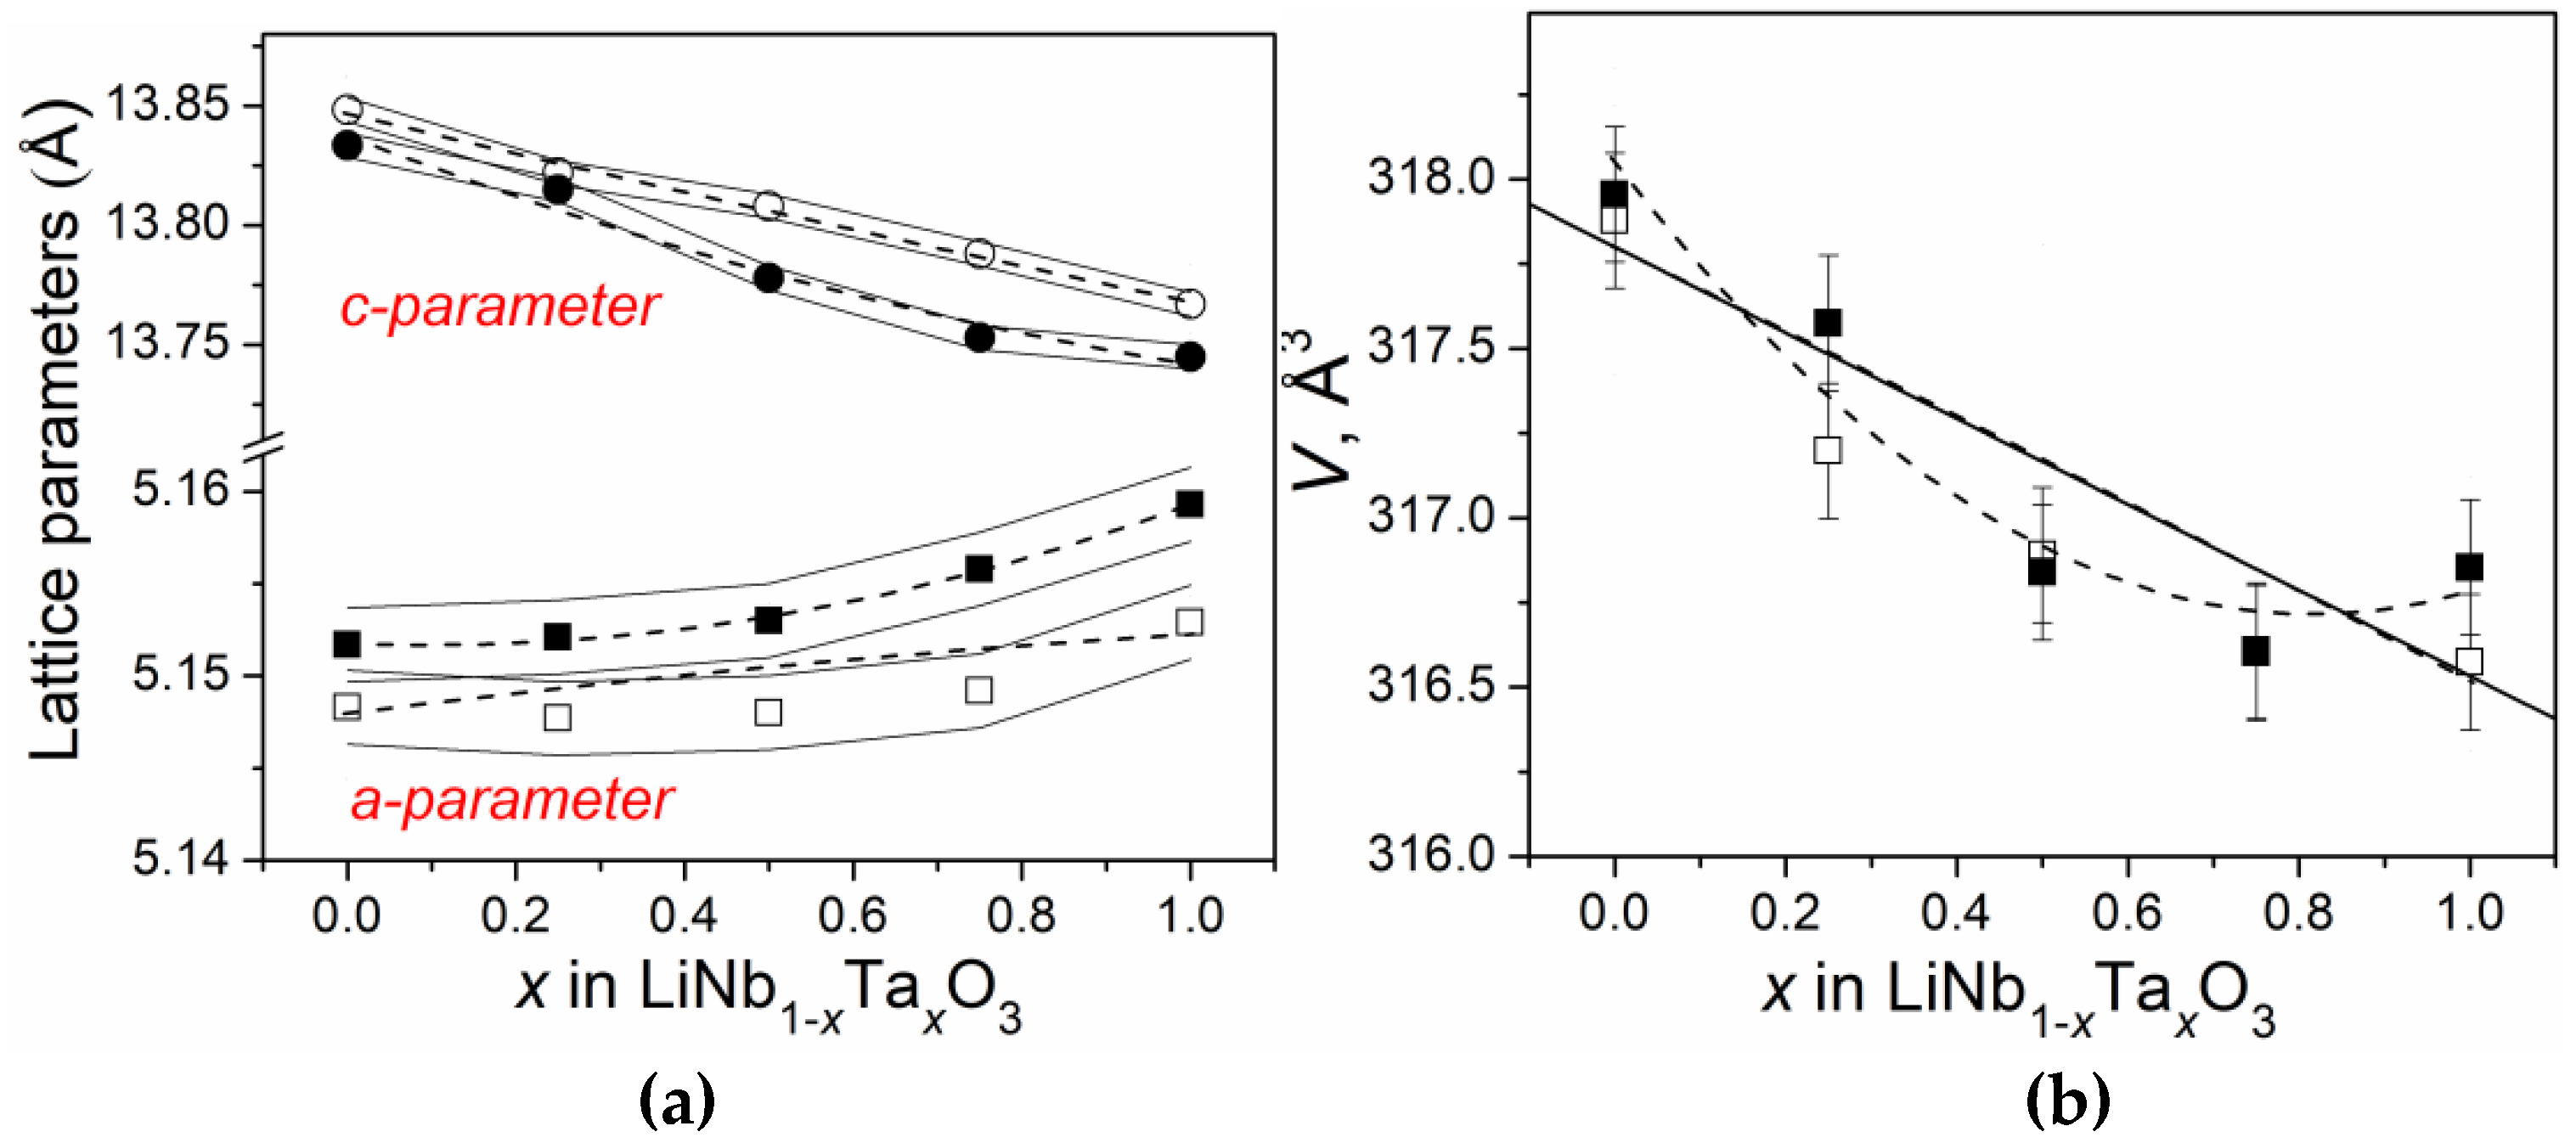
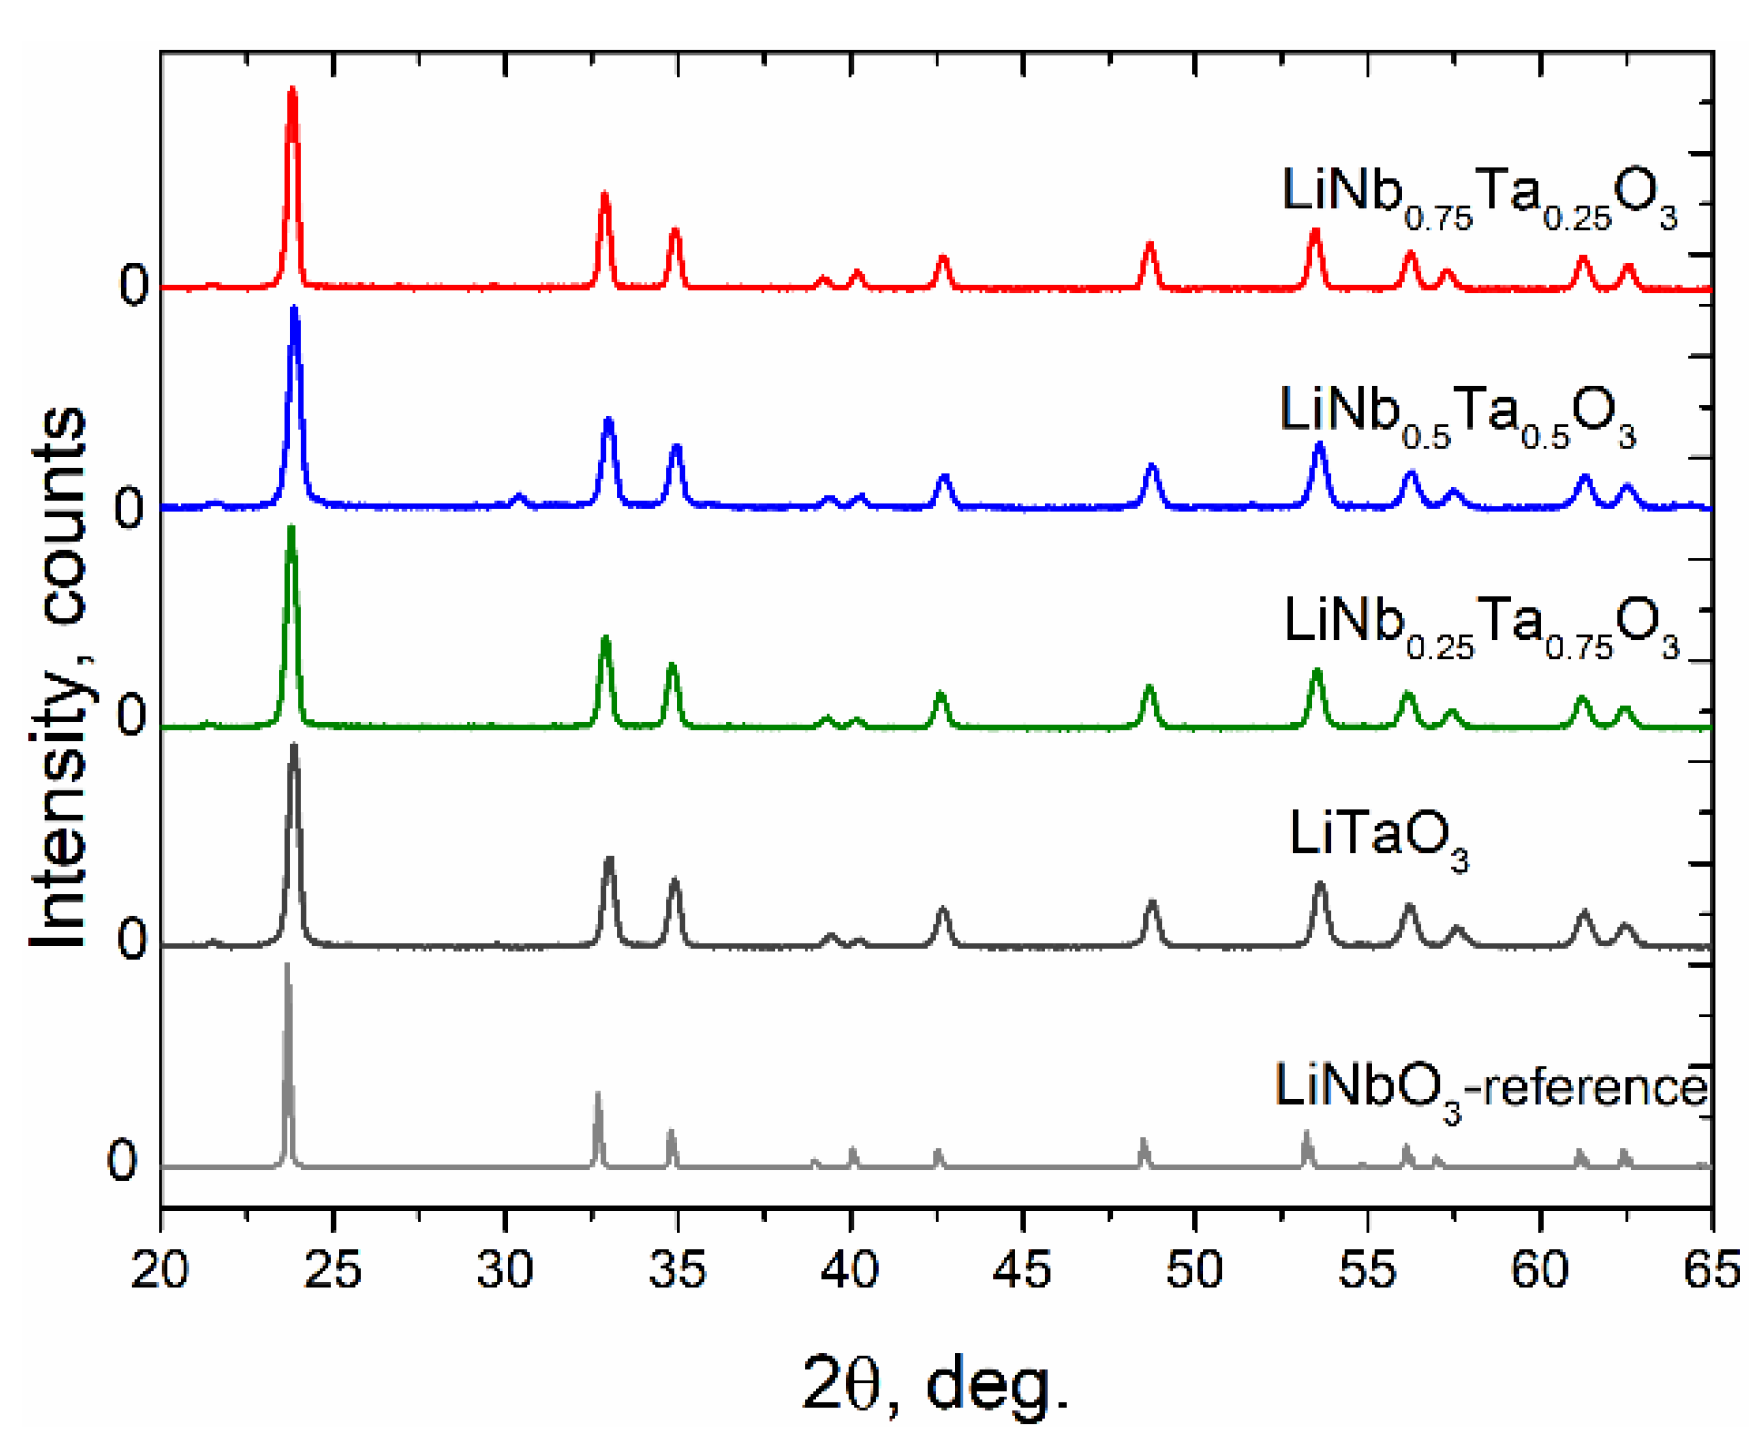
3.1. X-ray Diffraction

X-ray diffraction (XRD) study of all the LiNb1−xTaxO3 samples annealed at 550 °C revealed a rhombohedral LiNbO3-type structure as the main phase with some amount of the parasitic phase Li(Nb,Ta)3O8, and unreacted Ta2O5 and Nb2O5 (Table 2). Only the sample with x = 0 that corresponds to the ‘pure’ LiNbO3 shows single phase composition as in work [21].
Observable broadening of the Bragg’s peaks on the nanocrystalline character for the powders was revealed. Additional heat treatment of the materials at 800 °C led to the narrowing of the diffraction peaks and to the considerable change of the phase composition of the LiNb1−xTaxO3 samples with x from 0.5 to 1, in which the increase of monoclinic LiNb3O8 or Li(Nb,Ta)3O8 phases and disappearing of individual Ta2O5 and Nb2O5 oxides were detected (see, e.g., Figure 5). No significant changes of the phase composition in the samples with x = 0 and 0.25 were observed after such annealing of the samples.
As an example, Figure 6 demonstrates graphical results of Rietveld refinement of LiNb0.75Ta0.25O3 material heat treated at 800 °C.
The WinCSD programme package was also used for the evaluation of microstructural parameters of the powders, as presented in Table 1. The average grain size and microstrains <ε> = <Δd>/d associated with the dispersion of interplanar distances d were derived from the analysis of angular dependence of the Bragg’s peaks profiles. For the correction of instrumental broadening, the LaB6 external standard was used. It was revealed that the average grain size of the LiNb1−xTaxO3 powders annealed at 550 °C is between 31 and 66 nm. Increase of thermal annealing temperature led to essential growth of grain size, being especially pronounced for the nominally pure LiNbO3 and LiNb0.75Ta0.25O3 sample. Corresponding changes for tantalum-reach materials are much less pronounced: the average grain size of LiNb1−xTaxO3 at 800 °C powders with x from 0.5 to 1 lies between 80 and 97 nm (see Table 2).
Analysis of the obtained structural parameters revealed that an increase of Ta content in both of the LiNb1−xTaxO3 specimens treated at 550 and 800 °C leads to the increase of the a-parameter and simultaneous decrease of the c-parameter (Figure 7a). As a result, a significant decrease of the c/a ratio and minor decrease of the unit cell volume in both LiNb1−xTaxO3 series is observed. It is observed that similar to the compositional effect on the unit cell dimensions of LiNb1−xTaxO3 materials, there is an increase of the heat treatment temperature from 550 to 800 °C, which led to increase of the a-parameter and simultaneous reduction of the c-parameter (see Figure 7).
The comparison of the obtained structural parameters of LN-LT samples with the corresponding structural data for nominally pure LN and LT [27,28,29,30,31,32,33] points to the formation of the continuous LiNb1−xTaxO3 solid solution.
As can be seen from the results presented in Table 2 and Figure 7, after annealing at T = 550 °C, the phase analysis indicates that niobium and/or tantalum oxides prevail among the traces of parasitic phases in the resulting nanopowders with the lithium niobate structure. At the same time, after annealing at T = 800 °C, the predominant parasitic phase is the compound Li(Nb,Ta)3O8, which, as compared to Li(Nb,Ta)O3, contains less lithium. The latter is due to the sublimation of lithium in the form of oxide [34]. This result indicates that the optimal annealing temperature of nanopowders lies in the range of 550–800 °C. In order to optimize the heat treatment conditions for obtaining single-phase nanocrystalline powders, a number of experiments were carried out on the milling and annealing of equiatomic lithium niobate–tantalate LiNb0.5Ta0.5O3 at different milling times and different annealing temperatures.
Based on the data of X-ray phase analysis of the synthesized compounds, it was found that the best results were achieved with a milling time of 12–15 h and a heat treatment temperature of 650–700 °C for 5 h. Such modes ensure the absence of parasitic phases (within the accuracy of the measurement method) and the absence of violation of stoichiometric ratio Li/Nb. Diffraction patterns of powders obtained in optimal conditions are shown in Figure 8.

3.2. Raman Spectra

The micro-Raman spectra of LN-LT nanopowders with different Nb and Ta content, annealed at 550 °C, are shown in Figure 9, and the positions of the observed bands are indicated in Table 3. As it is seen from Figure 9, the Raman spectra of LN-LT with different x are generally similar; however, some peculiarities are observed. Particularly, in the spectrum of pure LN, 15 Raman bands can be distinguished, 11 of which can be attributed to A1 and E vibrational modes. The A1 modes are polarized along the Z-axis, while the doubly degenerate E modes correspond to ionic motions along the X or Y-axis [35,36]. In the spectrum of LN-LT (x = 0.25), 25 Raman bands can be distinguished; for x = 0.5, the number of bands is equal to 20, for x = 0.75 to 15 and for pure LT to 17 (see Table 3). The differences in the number of distinguished bands could probably be caused by the overlapping of some bands with those with higher intensity. The observed differences are associated with different compositions of the nanopowders as well as with probably non-optimal technology regimes of nanopowders synthesis. Particularly, the following main specific features of the LN-LT nanopowders Raman spectra were revealed.
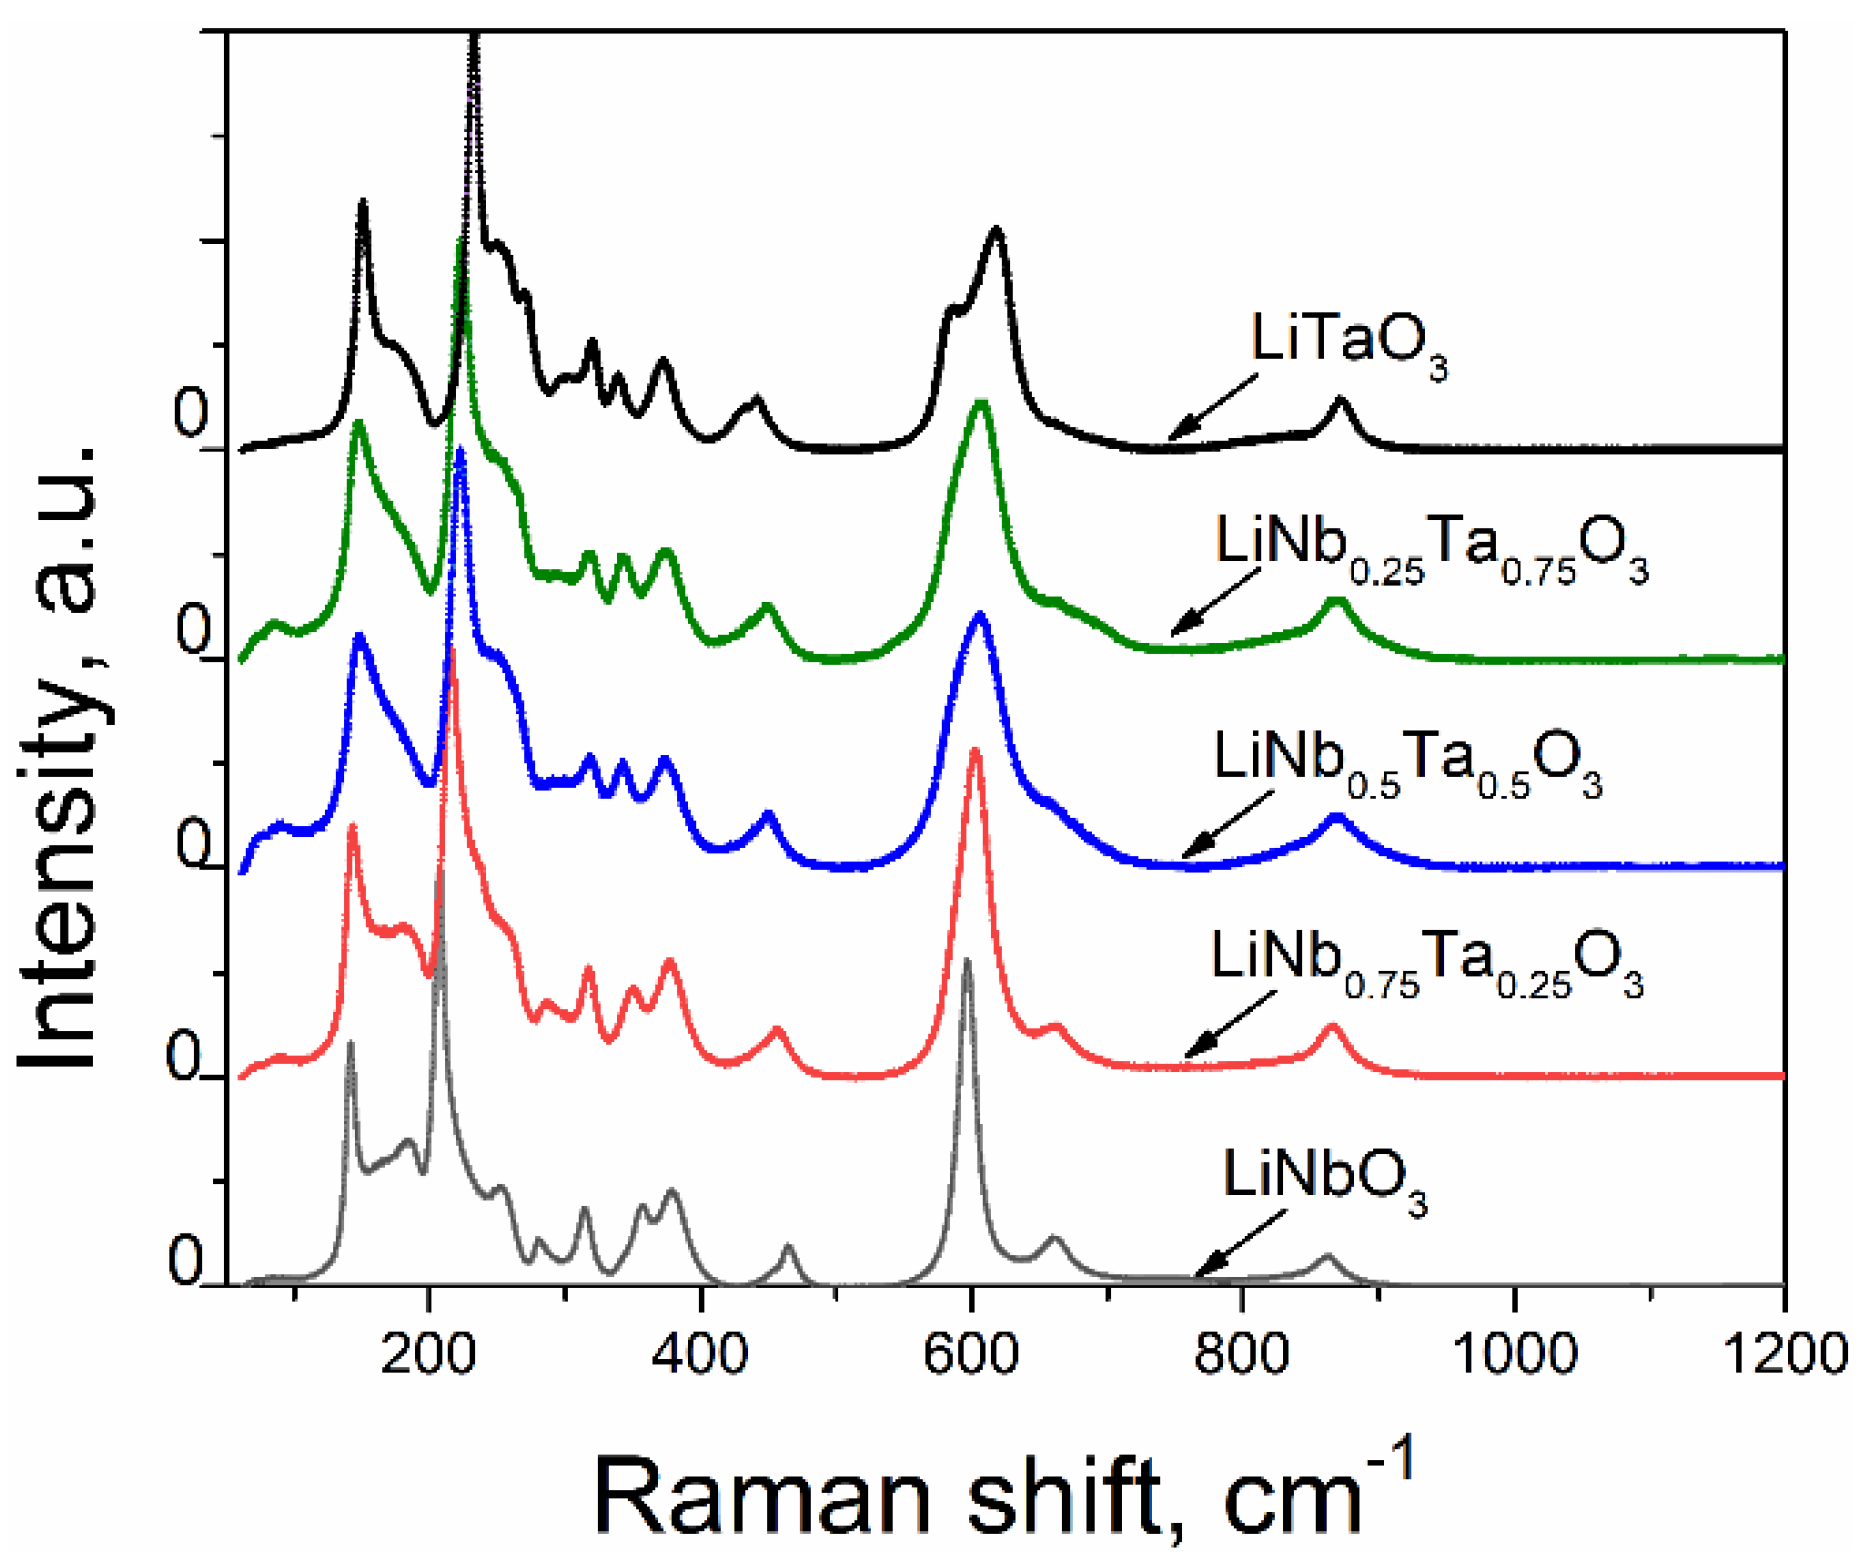
  • Few low-frequency bands near 73–75 and 90–97 cm−1 are observed for the nanopowders with x ≠ 0. These bands cannot be linked with known Raman bands of LT [35,36,37]. In accordance with the results of [38], these bands could be induced by the presence of Li(Nb,Ta)3O8 phase, as identified by X-ray diffraction technique (see Table 2).
  • A more intensive band near 117–125 cm−1 is observed only for the LN-LT sample with x = 0.5. The presence of this band could be attributed to the contribution of Li(Nb,Ta)3O8 and Ta2O5 additional phases in this sample. Note that the authors in [38] observed the close bands at 116 and 136 cm−1 and attributed them to LiNb3O8. The bands near 100 cm−1 were attributed to Ta2O5 by the authors of [39]. As it is followed from the XRD data (see Table 1), the simultaneous presence of Li(Nb,Ta)3O8 and Ta2O5 phases occurs only in the sample with x = 0.5, so the overlay of corresponding bands can result in a peculiar form of its spectrum. Furthermore, the sample with x = 0.5, i.e., with the composition intermediate between pure LN and pure LT, ought to essentially reveal the bands of both crystals, so it is no wonder that the spectrum of this sample has the most complex character.
    Furthermore, the sample with x = 0.5 reveals a significant increase of the bands’ intensities near 260 and 630–670 cm−1 that visually looks like a widening of intensive neighboring peaks. This result is in good agreement with [40], where two intensive neighboring bands in the region of 600 cm−1 were also observed for the LN-LT sample with x = 0.553.
    Finally, it should be noted that the bands near 600 cm−1 are considerably broad for all investigated samples in comparison with the other observed bands. This is consistent with the results in [41] where it is concluded that the band at 600 cm−1 is broader for non-poled LN samples (particularly, nanopowders) than for polarized.
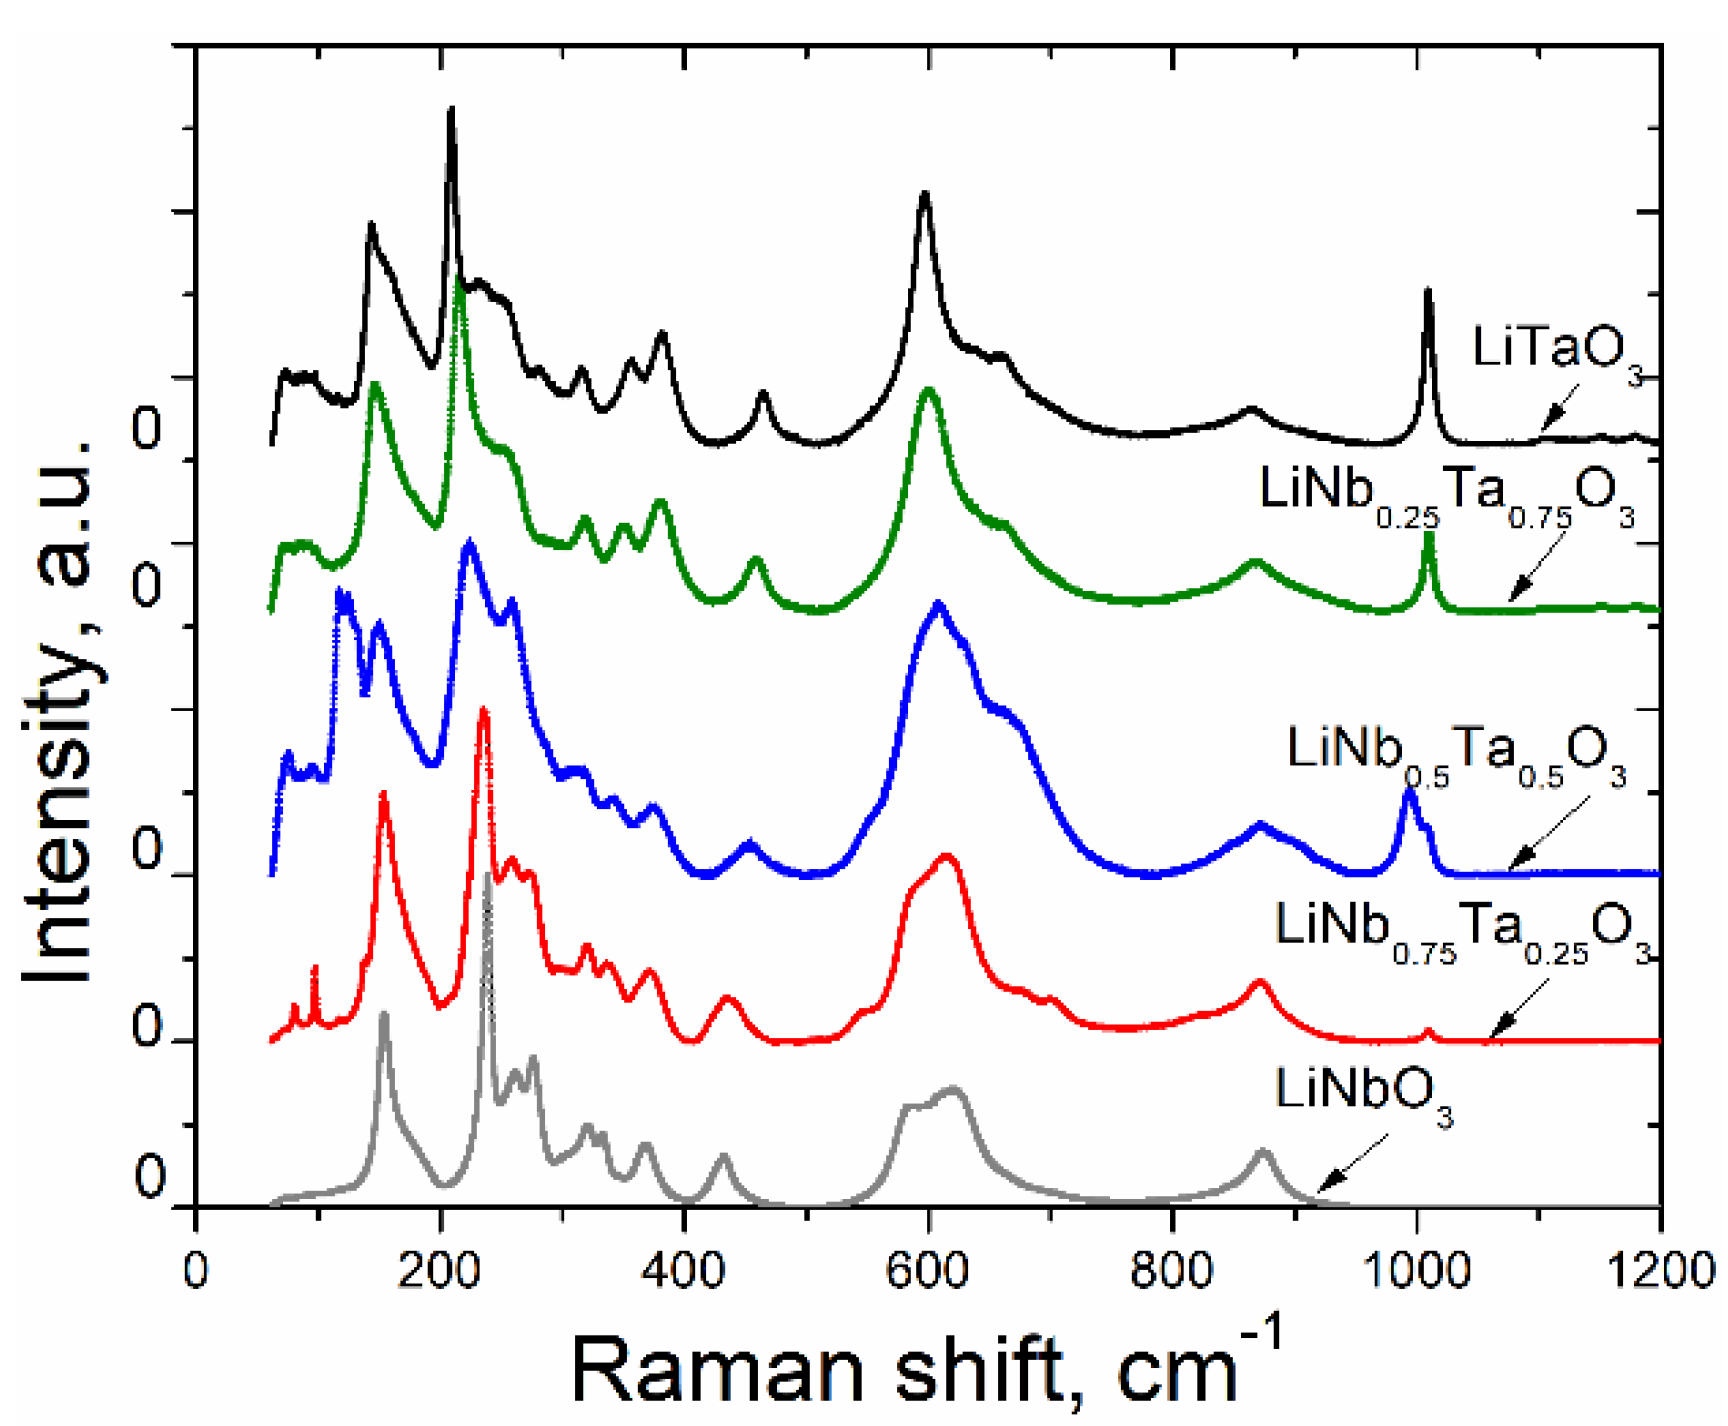
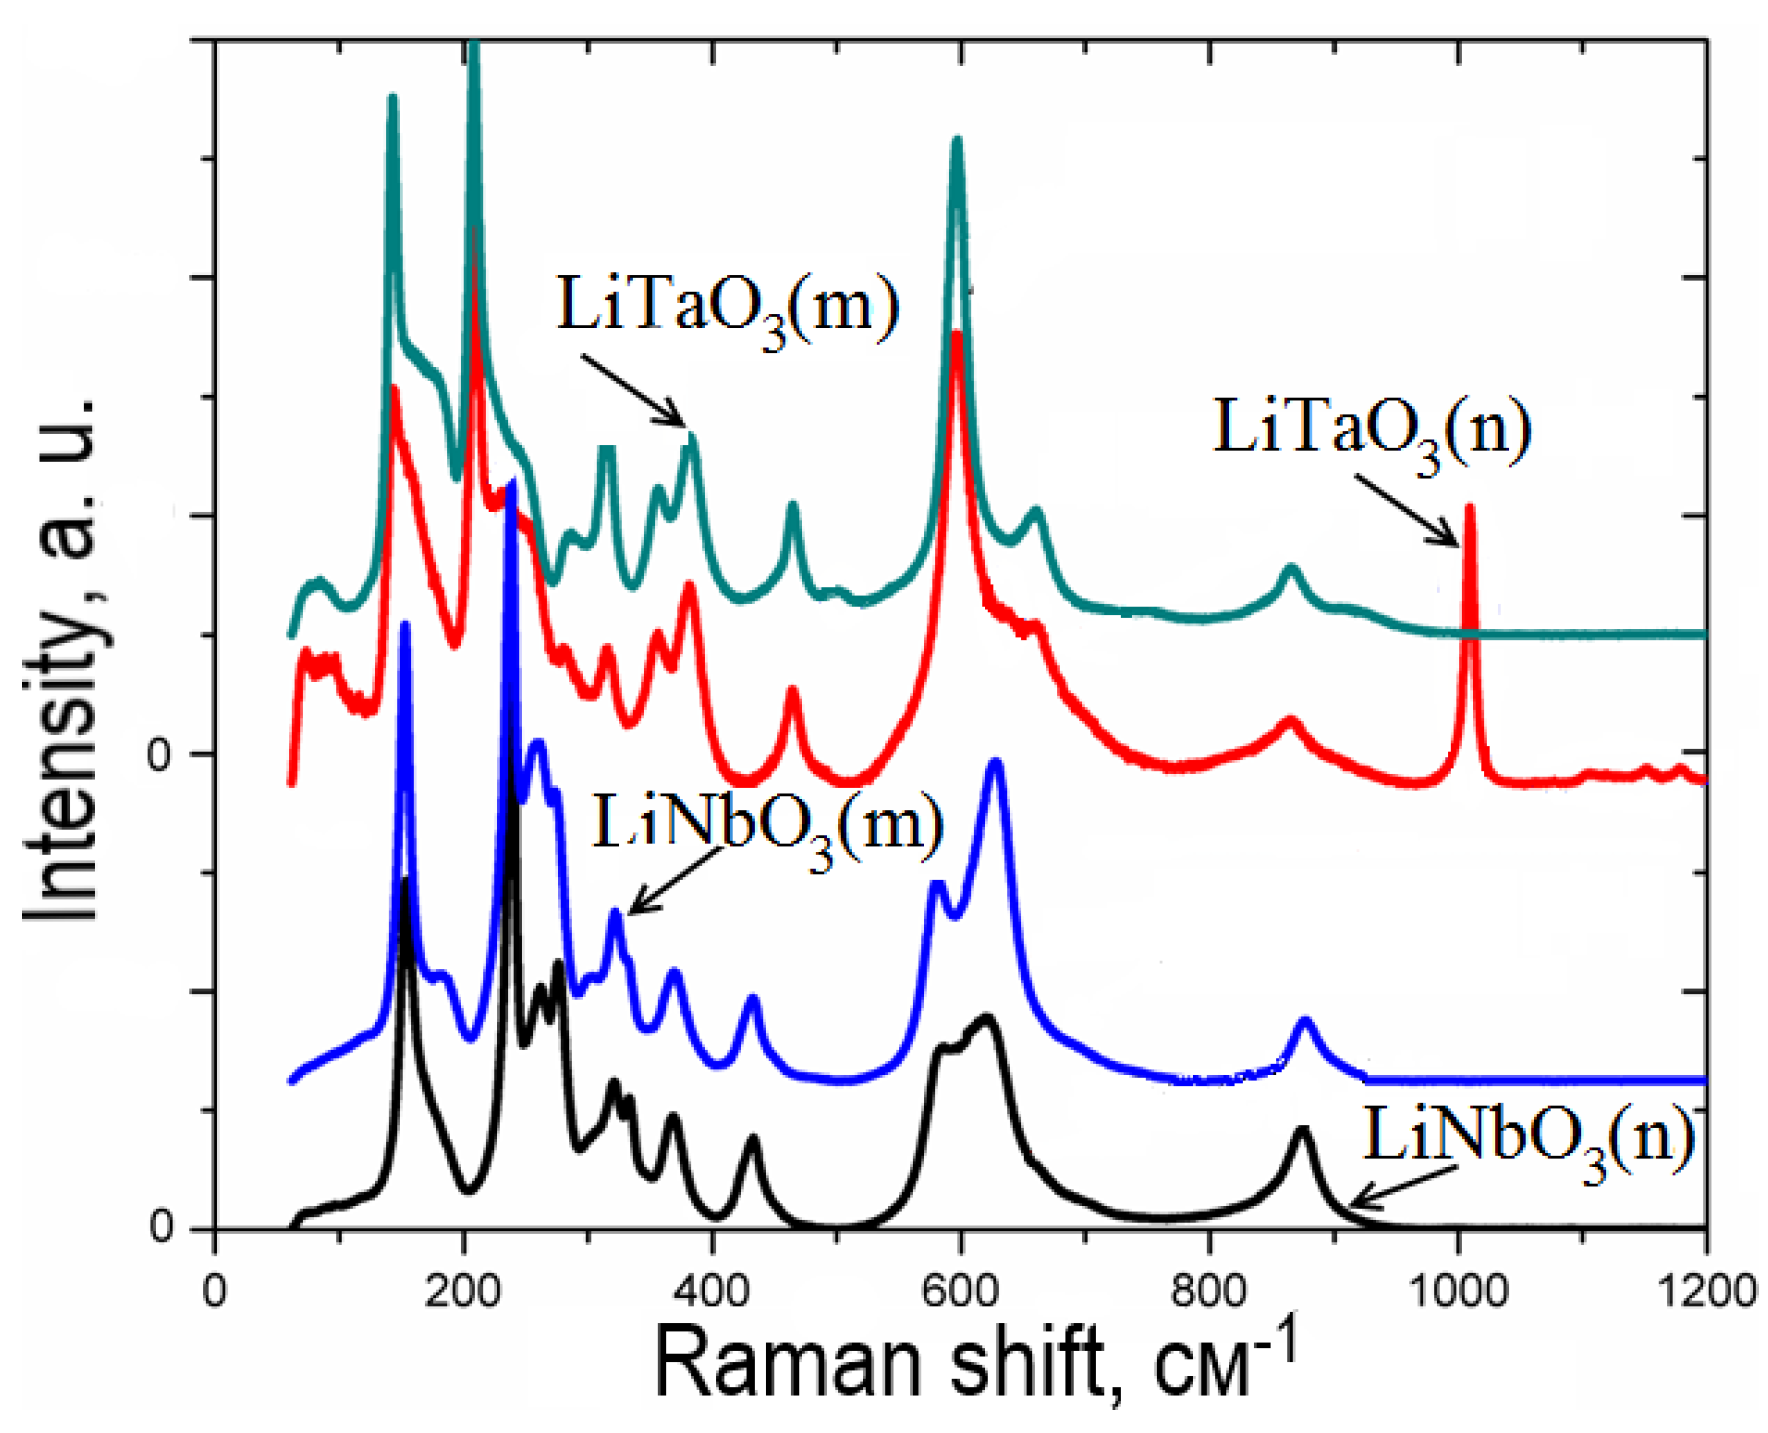
  • The Raman spectra of LN and LT nano- and micropowders are shown in Figure 10 for comparison purposes. The latter were obtained by the crushing of LN and LT single crystals grown at SRC ‘Electron-Carat’. As seen from Figure 10, the band observed at about 1008–1009 cm−1 for LT nanopowder is not pronounced for LT micropowder as well as for LN compounds. The similar band can be observed in Figure 9 for nanopowders with x≠ 0. As it is seen from Figure 9, the intensity of this band increases with increasing of x. Moreover, for x = 0.5, this band splits into two with the frequencies of 994 and 1008 cm−1. As it is shown in [39], this band is absent in Ta2O5 Raman spectrum. Since the data about Raman scattering in LiNb3O8 are not available in this spectral range, we cannot exclude that this band is linked with the LiNb3O8 (or LiTa3O8) phase. However, as it is seen from Table 2, the LiTa3O8 phase is absent in the pure LT sample annealed at 550 °C as well as in the sample with x = 0.75 (within the limits of accuracy). Thus, we have to conclude that the nature of this band cannot be clearly determined from current experiments and requires additional studies.
  • Contrary to the results in [42], we did not observe any remarkable effect of grain size reduction, i.e., decreasing of the intensities of all Raman bands caused by grain size decrease (see Figure 10).
  • Increasing the spectral range up to 4000 cm−1 allows revealing the weak vibrations at 1600 and 3400 cm−1 (looking as low-intensive wide bands) that can be caused by the traces of OH– groups, which are always present in LN and LT as well as the traces of HCO3 groups (near 1750 and 2900 cm−1) present in synthesized compounds, which is probably due to the use of lithium carbonate as a component of the initial mixture.
Similarly to X-ray studies, we have measured the Raman spectra of nanopowder samples obtained under optimal conditions. These spectra are shown in Figure 11.
As seen from Figure 11, the spectra for the LiNb1−xTaxO3 are generally consistent with those recorded for samples, which were obtained in non-optimal conditions (see also Figure 9). The only difference is the band observed near 1000 cm−1 for the LiNb1−xTaxO3 specimens with x = 0.25, 0.5, 0.75, and 1, obtained in a non-optimal regime (Figure 9). This band vanishes from the spectra of specimens, which are obtained in optimal regimes. The nature of this band remains not clear and requires additional studies.

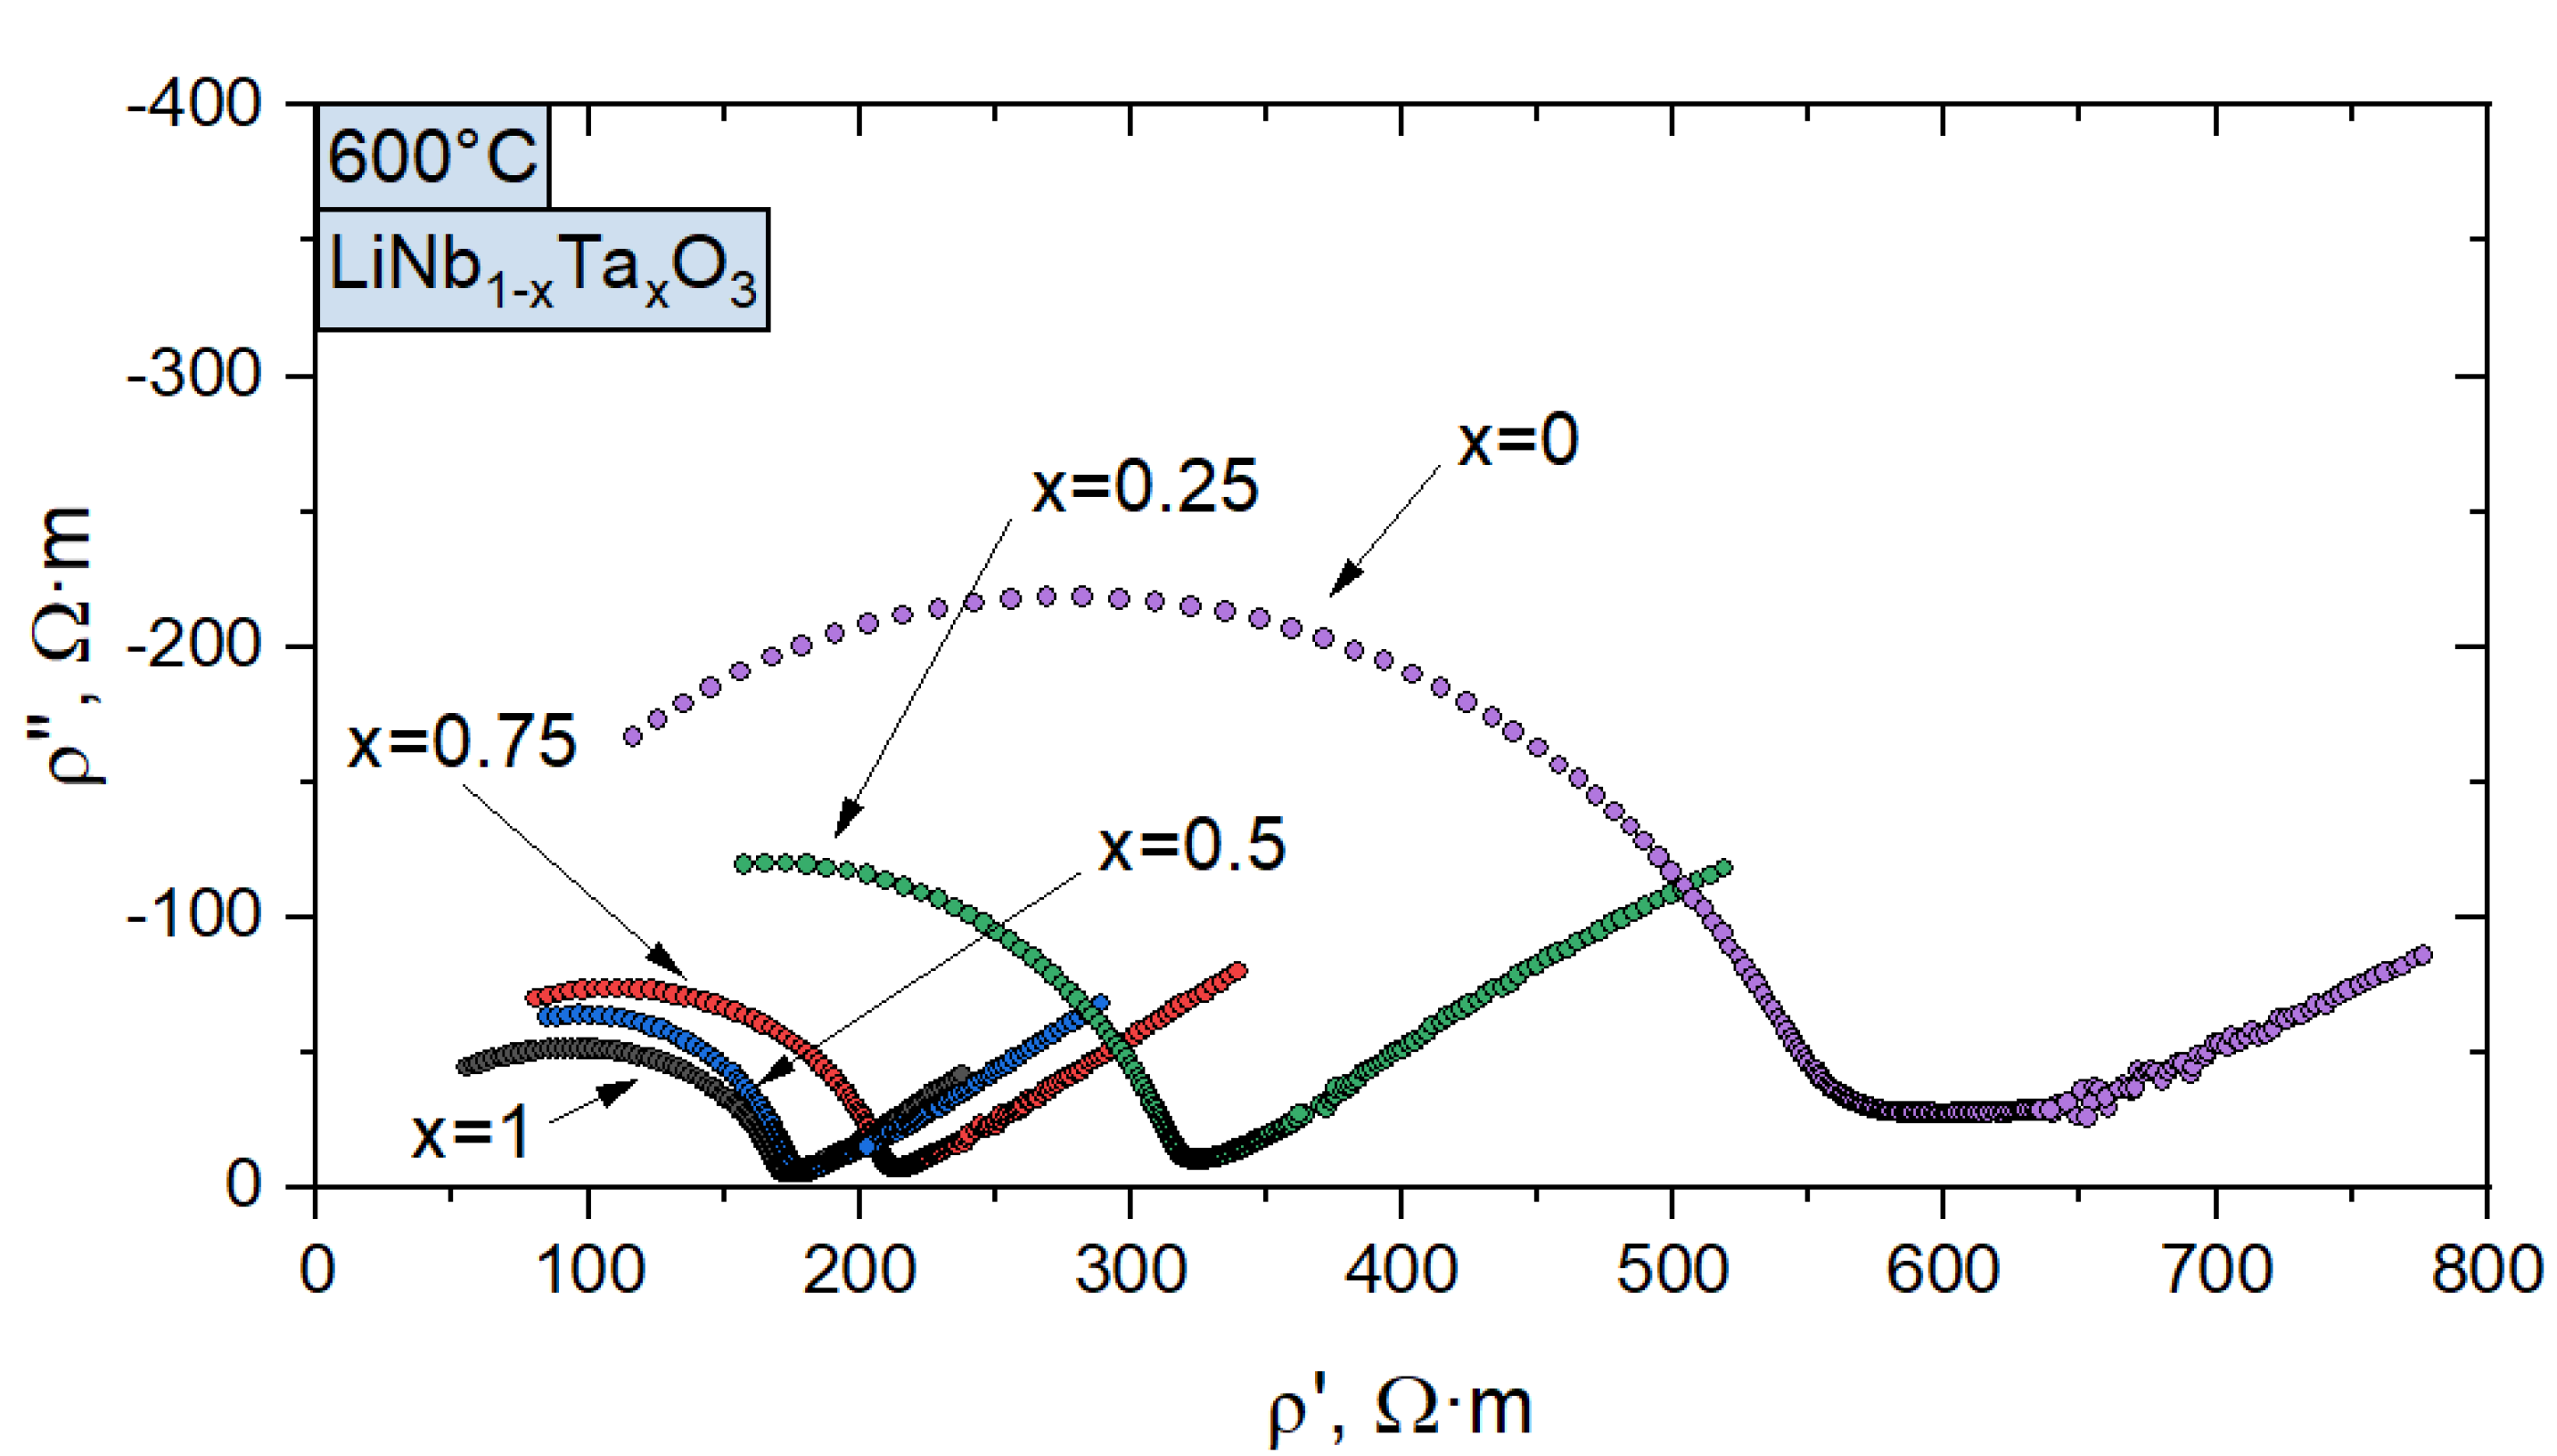
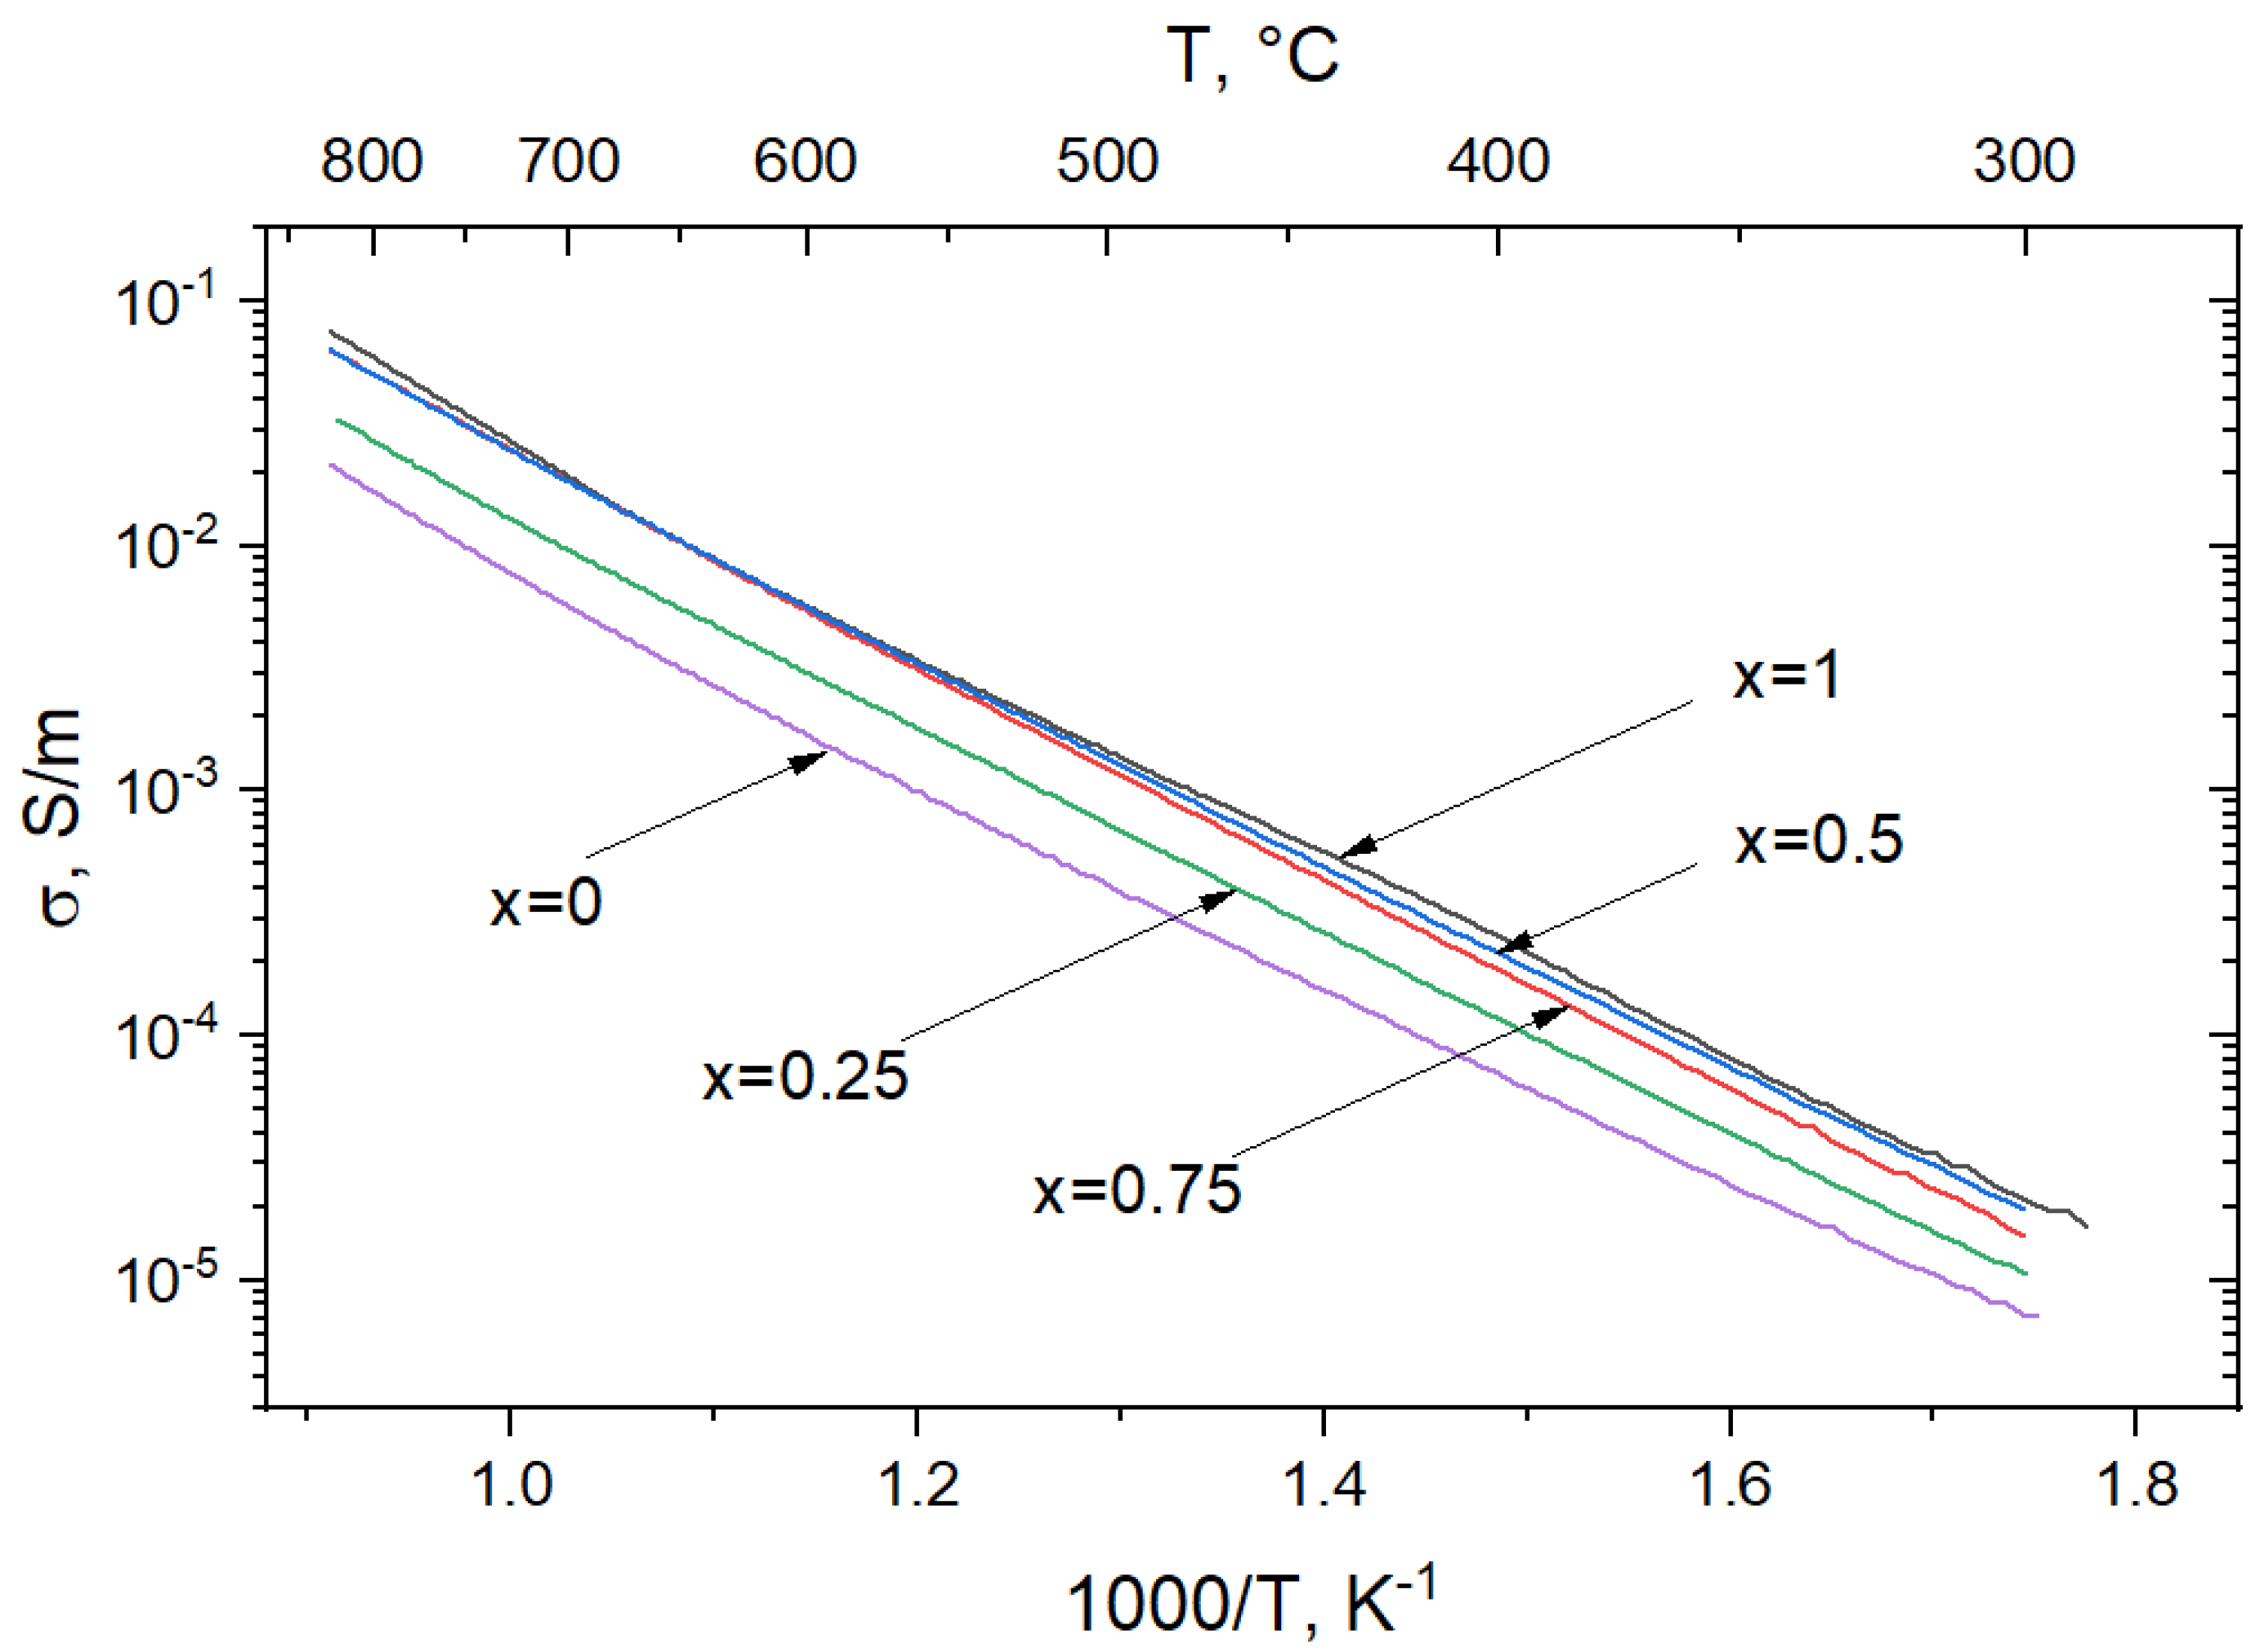
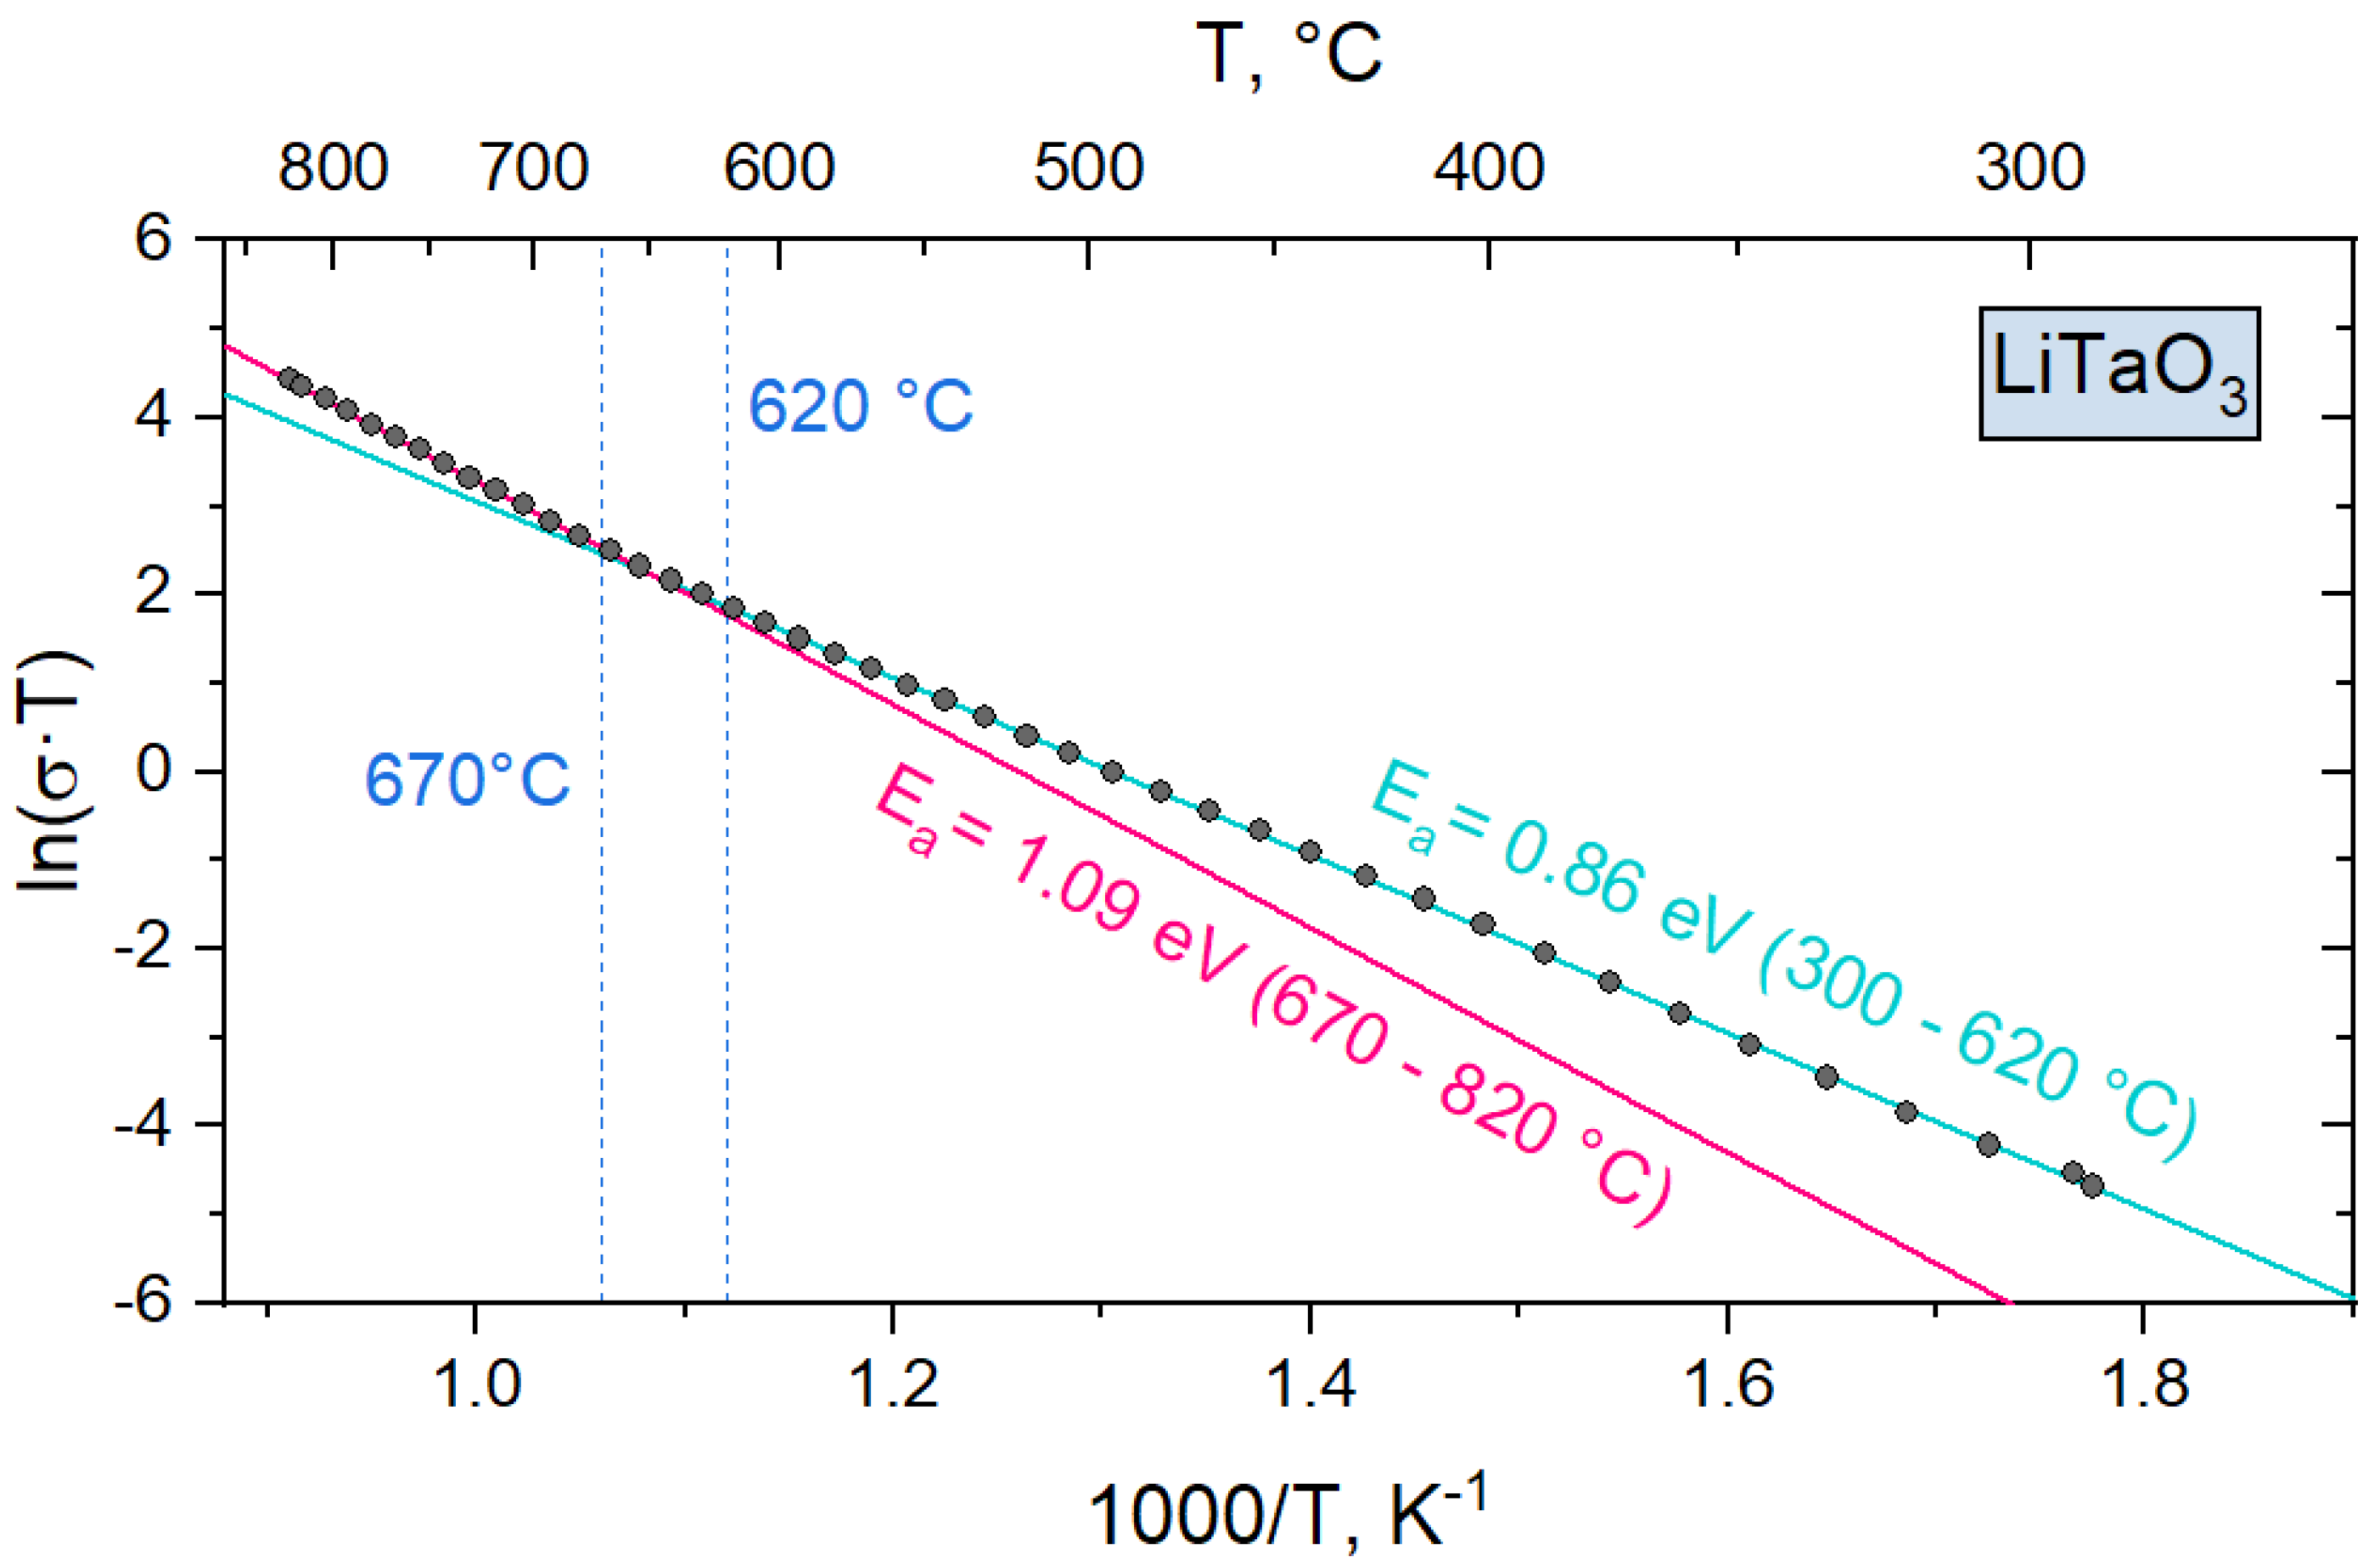
3.3. Electrical Conductivity

Impedance data of the pressed LiNbxTa1−xO3 samples are exemplarily shown for 400 °C (Figure 12) and 600 °C (Figure 13) in the form of Nyquist diagrams. The representation of the resistivity is chosen to eliminate the geometrical factors of the samples (thickness and area). At 400 °C, the impedance data of all samples show a slightly depressed single arc semicircle. Such depression could be attributed to the non-ideal capacitance of the samples, which corresponds to low values of the CPE exponents obtained from fitting of an Rb-CPE equivalent circuit model to experimental data. In particular, at 400 °C, exponent values vary between 0.74 (LiTaO3) and 0.85 (LiNb0.75Ta0.25O3) and slightly decrease with the temperature increase. Another possible interpretation implies that the obtained impedance spectra may consist of two overlapping semicircles, with similar relaxation times, representing grain interior and grain boundary conduction mechanisms, respectively [43]. We note that in case of nanostructured materials, the grain boundary contributions may significantly overlap with that of the grain interiors, making it hard to distinguish between them [43,44].
Impedance spectra of all samples at temperatures above 500 °C reveal the existence of linear region of ρ’’(ρ’) dependence, which follows the semicircle intercept at lower frequencies. This is exemplarily shown in Nyquist diagram at 600 °C (Figure 13). At this temperature, the impedance of the samples has been additionally measured down to 0.01 Hz in order to examine the low-frequency region of the ρ’’(ρ’) dependence in more detail; however, no changes in the line slope were observed. According to [45], such peculiarity at low frequencies can be attributed to the electrode effect, which is typical for an ionic conductor: mobile charge carriers in form of ions are blocking the metal–sample interface. On the other hand, a similar behavior of Z″(Z′) dependence at low frequencies, which was observed in [46] for polycrystalline lithium niobate samples at temperatures above 550 °C, was associated with a grain boundaries conduction mechanism.
The temperature dependencies of LiNbxTa1−xO3 conductivity are shown in Figure 14 in form of Arrhenius plots. Generally, the behavior of conductivity is similar to that of single crystalline LiNbxTa1−xO3 reported in [47]. Furthermore, the conductivity tends to correlate with Nb/Ta ratio, increasing with an increase of Ta content and reaching the values at 820 °C of 0.022 S/m and 0.076 S/m for x = 0 and x = 1, respectively. However, the conductivity of LiNbxTa1−xO3 specimen with x = 0.5 deviates from this correlation, which could not be solely attributed to experiment uncertainty. The latter, according to our estimations, is approximately 6% at 800 °C. This issue requires additional studies and will be a subject of subsequent investigations.
The absolute values of conductivity (Figure 14) are generally higher, comparing to the obtained previously for single crystalline and polycrystalline LiNbO3 and LiTaO3 [45,46,47,48,49,50,51,52]. As reported in [51], such a difference is associated with a greater number of free ions in polycrystalline LiNbO3 and LiTaO3 due to a developed system of grain boundaries and much more defective structure in general [51]. Consequently, the variation of conductivity, reported for different polycrystalline samples, can be attributed to differences in the average grain size in particular.
The conductivity of all samples increases linearly in Arrhenius presentation up to around 620 °C. After a transition temperature range of 620–670 °C, we observed the conductivity increase as linear again; however, the slope changes (see mark in Figure 14). This indicates that the conductivity is governed by a different process than that at lower temperatures. The obtained results enable the determination of activation energy, EA using the relation:
σ = σ 0 T e E A k T
where σ0, T, EA, and k represent the pre-exponential constant, absolute temperature, activation energy, and the Boltzmann constant, respectively. Activation energies and pre-exponential factors, obtained by fitting the Arrhenius equation to the measured conductivity data, as well as the temperature ranges for fitting are summarized in Table 4. The corresponding fits for low and high-temperature regions are exemplarily shown for the LiTaO3 specimen in Figure 15.
Generally, the activation energies obtained in our study (Table 4) are consistent with the values obtained previously for polycrystalline lithium niobate and/or lithium tantalate [43,46,50,51,52,53], varying from 0.63 to 1.25 eV. It should be noted that the wide range of activation energies reported [43,46,50,51,52,53] is associated with their strong dependence on samples grain size, which is in particular shown in a comparative impedance spectroscopy study of single-, micro-, nanocrystalline, and amorphous lithium niobate [43]. Similar to our study, the authors in [43] observed slightly depressed semicircles on ρ’’(ρ’) dependence of nanocrystalline LiNbO3 and attributed such depression to the superposition of two conduction mechanisms, arising from the grain interior and grain boundary, respectively. The nanopowders studied in [43] were obtained by high-energy ball milling with the grains size of about 20 nm.
Qualitatively similar dependencies were observed for polycrystalline samples of non-stoichiometric LiNbO3 in [53]. Here, the authors have obtained the LiNbO3 micropowders by the ball milling technique with the grain sizes varying from 2 to 3 m. Obtained powders were subsequently annealed and isostatically pressed in pellets at 2500 bars [53]. It is assumed in [53] that the conductivity of LiNbO3 in low and high-temperature regions is governed by the polaronic and ionic conduction mechanisms, respectively. The activation energies obtained in [53] vary from 0.78 to 0.88 eV for the low-temperature region and from 1.07 to 1.20 eV for the high-temperature region, which is in good correlation with the values obtained in our study.
Furthermore, the authors in [51] studied the electrical properties of polycrystalline LiNbO3 up to 800 K and obtained the activation energy of 0.88 eV, which is very close to the corresponding value in our work. The sol–gel method was applied for the synthesis of nanopowders. Subsequently, the powders were annealed at 1200 °C for 3 h and pressed in pellets [51]. The average grain size was between 0.2 and 2 m. Since the measurements in [51] did not extend to higher temperatures, no evidence of a second conducting mechanism was observed.

4. Conclusions

In summary, it is shown in the current study that the mechanosynthesis is the most simple and most accessible method of lithium niobate and tantalate nanoparticles production. This method allows obtaining LiNb1−xTaxO3 nanopowders in only two stages: high-energy ball milling of the raw powders (Li2CO3, Nb2O5, Ta2O5) and subsequent annealing of the obtained precursors. Furthermore, this method allows completely excluding usually undesirable wet chemistry procedures from the technological process.
A number of LiNb1−xTaxO3 nanopowders (x = 0, 0.25, 0.5, 0.75, 1) is obtained by means of the mechanosynthesis technique for the first time, to the best of our knowledge.
The X-ray analysis of LiNb1−xTaxO3 nanopowders obtained at different conditions allowed for determination of the optimal parameters for milling and annealing runs: milling at 600 rpm for 12–15 h and subsequent annealing of powders in air at temperatures 650–700 °C for 5 h. This allowed obtaining single-phase LiNb1−xTaxO3 nanopowders for all the studied values of x.
The crystal structure of the samples was determined by the X-ray diffraction technique. The full-profile Ritveld refinement was used for determination of the crystal structure parameters and micro-structure parameters of LiNb1−xTaxO3 nanopowders. It is shown that the replacement of niobium by tantalum in the LiNb1−xTaxO3 structure asymmetrically influences the parameters of the unit cell: increasing the Ta content x leads to increasing the lattice parameter a and the simultaneous decreasing of parameter c accompanied by a slight decreasing of the unit cell volume. It is shown that the average size of crystallites varies from 31 nm (treatment only at 550 °C) to 206 nm (additional treatment at 800 °C) for different samples.
Raman scattering in LiNb1−xTaxO3 nanopowders (x = 0, 0.25, 0.5, 0.75, 1) obtained by mechanosynthesis was studied, to the best of our knowledge, for the first time. It is shown that the obtained Raman spectra are generally similar. Some features (band shifts, changes in their intensity, the formation of new bands) are attributed to the different values of x. For samples obtained in non-optimal milling and annealing runs, bands typical for the parasitic phases LiNb(Ta)3O8, Nb2O5, and/or Ta2O5 are observed in the spectra.
The measured temperature dependence of electrical conductivity in air up to 820 °C shows similar behavior for all studied LiNb1−xTaxO3 samples and tends to correlate with the Nb/Ta ratio. Two linear regions are observed in the Arrhenius presentation, which is attributed to different conductivity mechanisms. Activation energies vary from 0.86 ± 0.015 eV to 0.91 ± 0.015 eV for different compositions in the low-temperature region and from 0.99 ± 0.069 eV to 1.09 ± 0.072 eV at high temperatures.

Author Contributions

Conceptualization, D.S.; Data curation, S.H. and U.Y.; Investigation, L.V., Y.S., D.W., S.H. and Y.Z.; Methodology, V.S. and A.L.; Resources, I.I.S. and I.S.; Writing—original draft, O.B.; Writing—review and editing, A.S. and H.F. All authors have read and agreed to the published version of the manuscript.

Funding

Research grants from the Bundesministerium für Bildung und Forschung (BMBF, Federal Ministry of Education and research, FKZ: 01DK20009) and Ministry of Education and Science of Ukraine (M/48-2020) in frames of the joint German-Ukrainian project ‘Nanocrystalline piezoelectric compounds LiNb1−xTaxO3 for high-temperature applications’ supported this work. Furthermore, the work was partially supported by the Polish National Science Center (grant No. 2019/33/B/ST8/02142) and by the Deutsche Forschungsgemeinschaft (DFG, German Research Foundation, www.for5044.de; SU1261/1-1, FR1301/42-1).

Data Availability Statement

All relevant data presented in the article are stored according to institutional requirements and as such are not available online. However, all data used in this manuscript can be made available upon request to the authors.

Acknowledgments

Stepan Hurskyj and Uliana Yakhnevych acknowledge the partial support of the Ukrainian Ministry of Education and Science through the project DB/KINETYKA (No 0119U002249). The authors from Clausthal University of Technology acknowledge the support of the Energie-Forschungszentrum Niedersachsen, Goslar, Germany. The authors acknowledge support by Open Access Publishing Fund of Clausthal University of Technology.

Conflicts of Interest

The authors declare no conflict of interest.

References

  1. LiNbO3 Crystal Market by Type (Acoustic Grade, Optical Grade, Others), by Application (Electro-Optical, Surface Acoustic Wave, Piezoelectric Sensors, Non-Linear Optical, Other) and Region—Global Forecasts to 2027. Available online: https://www.reportsanddata.com/report-detail/global-linbo3-crystal-market-by-manufacturers-countries-type-and-application-forecast-to-2022 (accessed on 21 May 2021).
  2. Lithium Niobate Modulator Market—Global Industry Analysis, Size, Share, Growth, Trends, and Forecast. 2019–2027. Available online: https://www.transparencymarketresearch.com/lithium-niobate-modulator-market.html (accessed on 21 May 2021).
  3. Global Lithium Tantalate Crystal Market 2019–2027—Industry Analysis, Size, Share, Growth, Trends and Forecast. Available online: https://www.prnewswire.com/news-releases/global-lithium-tantalate-crystal-market-2019–2027--industry-analysis-size-share-growth-trends-and-forecast-300980802.html (accessed on 21 May 2021).
  4. Lithium Tantalate Crystal Market (Grade: Optical Grade, SAW Grade, and Others; and Application: Electro-Optical Modulators, Pyroelectric Detectors, Piezoelectric Transducers, Acoustic Wave Devices, and Others)—Global Industry Analysis, Size, Share, Growth, Trends, and Forecast. 2019–2027. Available online: https://www.transparencymarketresearch.com/lithium-tantalate-crystal-market.html (accessed on 21 May 2021).
  5. Xue, D.; Betzler, K.; Hesse, H. Dielectric properties of lithium niobate-tantalate crystals. Solid State Commun. 2000, 115, 581–585. [Google Scholar] [CrossRef]
  6. Wood, I.G.; Daniels, P.; Brown, R.H.; Glazer, A.M. Optical birefringence study of the ferroelectric phase transition in lithium niobate tantalate mixed crystals: LiNb1-xTaxO3. J. Phys. Condens. Matter 2008, 20, 235237. [Google Scholar] [CrossRef] [PubMed]
  7. Bartasyte, A.; Glazer, A.M.; Wondre, F.; Prabhakaran, D.; Thomas, P.A.; Huband, S.; Keebleand, D.S.; Margueron, S. Growth of LiNb1−xTaxO3 solid solution crystals. Mater. Chem. Phys. 2012, 134, 728–735. [Google Scholar] [CrossRef]
  8. Roshchupkin, D.; Emelin, E.; Plotitcyna, O.; Fahrtdinov, R.; Irzhak, D.; Karandashev, V.; Orlova, T.; Targonskaya, N.; Sakharov, S.; Mololkin, A.; et al. Single crystals of ferroelectric lithium niobate–tantalate LiNb1–xTaxO3 solid solutions for high-temperature sensor and actuator applications. Acta Crystallogr. B 2020, 76, 1071–1076. [Google Scholar] [CrossRef]
  9. Nashimoto, K.; Cima, M.J. Epitaxial LiNbO3 thin films prepared by a sol-gel process. Mat. Lett. 1991, 10, 348–354. [Google Scholar] [CrossRef]
  10. Hirano, S.; Yogo, T.; Kikuta, K.; Morishita, T.; Ito, Y.; Hirano, S.; Yogo, T.; Kikuta, K.; Morishita, T. Preparation of potassium tantalate niobate by sol-gel method. J. Amer. Cer. Soc. 1992, 75, 1701–1704. [Google Scholar] [CrossRef]
  11. Ono, S.; Hirano, S. Processing of highly oriented lithium tantalate films by chemical solution deposition. J. Mater. Res. 2002, 17, 2532–2539. [Google Scholar] [CrossRef]
  12. Takahashi, M.; Yamauchi, K.; Yagi, T.; Nishiwaki, A.; Wakita, K.; Ohnishi, N.; Hotta, K.; Sahashi, I. Preparation and characterization of high-quality stoichiometric LiNbO3 thick films prepared by the sol–gel method. Thin Solid Film. 2004, 458, 108–113. [Google Scholar] [CrossRef]
  13. Satapathy, S.; Gupta, P.K.; Srivastava, H.; Srivastava, A.K.; Wadhawan, V.K.; Varma, K.B.R.; Sathe, V.G. Effect of capping ligands on the synthesis and on the physical properties of the nanoparticles of LiTaO3. J. Cryst. Growth 2007, 307, 185–191. [Google Scholar] [CrossRef]
  14. Gou, J.; Wang, J.; Huang, Z.H.; Jiang, Y.D. Preparation of LiTaO3 nano-crystalline films by sol-gel process. Key Engin. Mat. 2013, 531–532, 446–449. [Google Scholar] [CrossRef]
  15. Johann, F.; Jungk, T.; Lisinski, S.; Hoffmann, Á.; Ratke, L.; Soergel, E. Sol-gel derived ferroelectric nanoparticles investigated by piezoresponse force microscopy. Appl. Phys. Lett. 2009, 95, 202901. [Google Scholar] [CrossRef] [Green Version]
  16. Liu, Y.G.; Hu, J.H.; Huang, Z.H.; Fang, M.H. Preparation of LiTaO3 nanoparticles by a sol–gel route. J. Sol. Gel. Sci. Technol. 2011, 58, 664–668. [Google Scholar] [CrossRef]
  17. Mathew, T.V.; Kuriakose, S. Synthesis and characterization of sodium–lithium niobate ceramic structures and their composites with biopolymers. J. Adv. Cer. 2013, 2, 11–20. [Google Scholar] [CrossRef] [Green Version]
  18. Li, Y.-Y.; Chen, H.-L.; Chen, G.-J.; Kuo, C.-L.; Hsieh, P.-H.; Hwang, W.-S. Investigation of the defect structure of congruent and Fe-doped LiNbO3 powders synthesized by the combustion method. Materials 2017, 10, 380. [Google Scholar] [CrossRef] [Green Version]
  19. Gao, L.; Chen, H.; Wang, Z.; Zou, X. Solvothermal synthesis and characterization of lithium tantalate nanoparticles. Key Eng. Mater. 2014, 602–603, 19–22. [Google Scholar] [CrossRef]
  20. de Figueiredo, R.S.; Messai, A.; Hernandes, A.C.; Sombra, A.S.B. Piezoelectric lithium niobate obtained by mechanical alloying. J. Mater. Sci. Lett. 1998, 17, 449–451. [Google Scholar] [CrossRef]
  21. Khalameida, S.; Sydorchuk, V.; Leboda, R.; Skubiszewska-Zięba, J.; Zazhigalov, V. Preparation of nano-dispersed lithium niobate by mechanochemical route. J. Therm. Anal. Calorim. 2014, 115, 579–586. [Google Scholar] [CrossRef]
  22. Fierro-Ruiz, C.D.; Sánchez-Dena, O.; Cabral-Larquier, E.M.; Elizalde-Galindo, J.T.; Farías, R. Structural and magnetic behavior of oxidized and reduced Fe doped LiNbO3 powders. Crystals 2018, 8, 108. [Google Scholar] [CrossRef] [Green Version]
  23. Kar, S.; Logad, S.; Choudhary, O.P.; Debnath, C.; Verma, S.; Bartwal, K.S. Preparation of lithium niobate nanoparticles by high energy ball milling and their characterization. Univers. J. Mater. Sci. 2013, 1, 18–24. [Google Scholar] [CrossRef]
  24. Kocsor, L.; Péter, L.; Corradi, G.; Kis, Z.; Gubicza, J.; Kovács, L. Mechanochemical reactions of lithium niobate induced by high-energy ball-milling. Crystals 2019, 9, 334. [Google Scholar] [CrossRef] [Green Version]
  25. Timoshevskii, A.N.; Ktalkherman, M.G.; Emel’kin, V.A.; Pozdnyakov, B.A.; Zamyatin, A.P. High-temperature decomposition of lithium carbonate at atmospheric pressure. High. Temperature 2008, 46, 414–421. [Google Scholar] [CrossRef]
  26. Akselrud, L.; Grin, Y. WinCSD: Software package for crystallographic calculations (Version 4). J. Appl. Crystallogr. 2014, 47, 803–805. [Google Scholar] [CrossRef]
  27. Abrahams, S.C.; Marsh, P. Defect structure dependence on composition in lithium niobate. Acta Crystallogr. Sect. B Struct. Sci. 1986, 42, 61–68. [Google Scholar] [CrossRef]
  28. Ohgaki, M.; Tanaka, K.; Marumo, F. Structure refinement of lithium (I) niobium (V) trioxide, LiNbO3, withanharmonic thermal vibration model. Mineral. J. 1992, 16, 150–160. [Google Scholar] [CrossRef] [Green Version]
  29. Zotov, N.; Boysen, H.; Schneider, J.; Frey, F. Application of combined neutron and X-ray powder diffraction refinements to the structure of congruent lithium niobate. Mater. Sci. Forum 1994, 166, 631–636. [Google Scholar] [CrossRef]
  30. Abrahams, S.C.; Reddy, J.M.; Bernstein, J.L. Ferroelectric lithium niobate. 3. Single crystal X-ray diffraction study at 24 °C. J. Phys. Chem. Solids 1966, 27, 997–1012. [Google Scholar] [CrossRef]
  31. Iyi, N.; Kitamura, K.; Izumi, F.; Yamamoto, J.K.; Hayashi, T.; Asano, H.; Kimura, S. Comparative study of defect structures in lithium niobate with different compositions. J. Solid State Chem. 1992, 101, 340–352. [Google Scholar] [CrossRef]
  32. Abrahams, S.C.; Bernstein, J.L. Ferroelectric lithium tantalate. 1. single crystal X-ray diffraction study at 24 °C. J. Phys. Chem. Solids 1967, 28, 1685–1692. [Google Scholar] [CrossRef]
  33. Abrahams, S.C.; Hamilton, W.C.; Sequeira, A. Ferroelectric lithium tantalate. 2. Single crystal neutron diffraction study at 24 °C. J. Phys. Chem. Solids 1967, 28, 1693–1698. [Google Scholar] [CrossRef]
  34. Wang, S.Y.; Jiang, H. Synthesis and Characterization of LiNbO3 Powders by Thermal Decomposition Method at Low Temperature. Ferroelectrics 2011, 413, 212–219. [Google Scholar] [CrossRef]
  35. Gorelik, V.S.; Abdurakhmonov, S.D.; Sidorov, N.V.; Palatnikov, M.N. Raman scattering in lithium niobate and lithium tantalate single crystals and ceramics. Inorg. Mater. 2019, 55, 524–532. [Google Scholar] [CrossRef]
  36. Ridah, A.; Bourson, P.; Fontana, M.D.; Malovichko, G. The composition dependence of the Raman spectrum and new assignment of the phonons in LiNbO3. J. Phys. Cond. Matter 1997, 9, 9687–9693. [Google Scholar] [CrossRef]
  37. Repelin, Y.; Husson, E.; Bennani, F.; Proust, C. Raman spectroscopy of lithium niobate and lithium tantalate. Force field calculations. J. Phys. Chem. Solids 1999, 60, 819–825. [Google Scholar] [CrossRef]
  38. Bartasyte, A.; Plausinaitiene, V.; Abrutis, A.; Stanionyte, S.; Margueron, S.; Boulet, P.; Kobata, T.; Uesu, Y.; Gleize, J. Identification of LiNbO3, LiNb3O8 and Li3NbO4 phases in thin films synthesized with different deposition techniques by means of XRD and Raman spectroscopy. J. Phys.: Condens. Matter. 2013, 25, 205901. [Google Scholar] [CrossRef]
  39. Verma, N.; Mari, B.; Singh, K.C.; Jindal, J.; Mollar, M.; Rana, R.; Pereira, A.L.J.; Manjón, F.J. Structural and optical properties of Ta2O5:Eu3+: Mg2+ or Ca2+ phosphor prepared by molten salt method. AIP Conf. Proc. 2016, 1724, 020082. [Google Scholar] [CrossRef]
  40. Rüsing, M.; Sanna, S.; Neufeld, S.; Berth, G.; Schmidt, W.G.; Zrenner, A.; Yu, H.; Wang, Y.; Zhang, H. Vibrational properties of LiNb1-xTaxO3 mixed crystals. Phys. Rev. B. 2016, 93, 284305. [Google Scholar] [CrossRef]
  41. Golubović, A.; Gajić, R.; Hinić, I.; Šćepanović, M. IR and Raman spectra of poled and unpoled LiNbO3 single crystals. J. Alloy. Comp. 2008, 460, 74–78. [Google Scholar] [CrossRef]
  42. Heitjans, P.; Masoud, M.; Feldhoff, M.; Wilkening, M. NMR and impedance studies of nanocrystalline and amorphous ion conductors: Lithium niobate as a model system. Faraday Discuss. 2007, 134, 67–82. [Google Scholar] [CrossRef] [Green Version]
  43. Chen, R.H.; Chen, L.F.; Chia, C.T. Impedance spectroscopic studies on congruent LiNbO3 single crystal. J. Phys. Condens. Matter 2007, 19, 086225. [Google Scholar] [CrossRef]
  44. Huanosta, A.; West, A.R. The electrical properties of ferroelectric LiTaO3 and its solid solutions. J. Appl. Phys. 1987, 61, 5386–5391. [Google Scholar] [CrossRef]
  45. Lanfredi, S.M.; Rodrigues, A.C. Impedance spectroscopy study of the electrical conductivity and dielectric constant of polycrystalline. J. Appl. Phys. 1999, 86, 2215–2219. [Google Scholar] [CrossRef]
  46. Suhak, Y.; Roshchupkin, D.; Redkin, B.; Kabir, A.; Jerliu, B.; Ganschow, S.; Fritze, H. Correlation of Electrical Properties and Acoustic Loss in Single Crystalline Lithium Niobate-Tantalate Solid Solutions at Elevated Temperatures. Crystals 2021, 11, 398. [Google Scholar] [CrossRef]
  47. Rahn, J.; Huger, E.; Dorrer, L.; Ruprecht, B.; Heitjans, P.; Schmidt, H. Li self-diffusion in lithium niobate single crystals at low temperatures. Phys. Chem. Chem. Phys. 2012, 14, 2427–2433. [Google Scholar] [CrossRef] [PubMed] [Green Version]
  48. Weidenfelder, A.; Schulz, M.; Fielitz, P.; Shi, J.; Borchardt, G.; Becker, K.-D.; Fritze, H. Electronic and Ionic Transport Mechanisms of Stoichiometric Lithium Niobate at High-Temperatures. MRS Online Proc. Libr. 2013, 1519, 330. [Google Scholar] [CrossRef]
  49. Barik, R.; Satpathy, S.K.; Behera, B.; Biswal, S.K.; Mohapatra, R.K. Synthesis and Spectral Characterizations of Nano-Sized Lithium Niobate (LiNbO3) Ceramic. Micro Nanosyst. 2020, 12, 1–6. [Google Scholar] [CrossRef]
  50. Efremov, V.V.; Shcherbina, O.B.; Palatnikov, M.N.; Masloboeva, S.M. Comparative investigation of electrophysical characteristics of ceramic and single crystal LiNbO3. J. Phys. Conf. Ser. 2020, 1658, 012010. [Google Scholar] [CrossRef]
  51. El Bachiri, A.; Bennani, F.; Bousselamti, M. Dielectric and electrical properties of LiNbO3 ceramics. J. Asian Ceram. Soc. 2016, 4, 46–54. [Google Scholar] [CrossRef] [Green Version]
  52. Masoud, M.; Heitjans, P. Impedance Spectroscopy Study of Li Ion Dynamics in Single Crystal, Microcrystalline, Nanocrystalline and Amorphous LiNbO3. Defect Diffus. Forum 2005, 237–240, 1016–1021. [Google Scholar] [CrossRef]
  53. El Bachiri, A.; Bennani, F.; Bousselamti, M. Dielectric and electrical properties of LiNbO3 ceramics. J. Asian Ceram. Soc. 2016, 4, 46–54. [Google Scholar] [CrossRef] [Green Version]
Figure 1. Reference diffraction patterns of lithium niobate (a) and diffraction patterns of the precursor obtained after milling a mixture of powders of lithium carbonate, niobium pentoxide, and tantalum pentoxide (b).
Crystals 11 00755 g001
Figure 2. DTA–DTG curves obtained for LiNb0,5Ta0,5O3 powders, which underwent a high-energy ball milling process for 15 h at a rotation speed of 600 rpm (1—DTA; 2—DTG; 3—TG).
Crystals 11 00755 g002
Figure 3. Scanning electron microscopy image of pressed LiNb0.5Ta0.5O3 after initial annealing at 600 °C.
Crystals 11 00755 g003
Figure 4. Scanning electron microscopy image of pressed LiNb0.5Ta0.5O3 after impedance measurements performed at 820 °C.
Crystals 11 00755 g004
Figure 5. XRD patterns of the “S04” sample with a nominal composition LiNb0.25Ta0.75O3 heat treated at 550 °C and 800 °C. For the main rhombohedral LN-LT phase, the Miller’s indices are given (1—S04 at 550 °C; 2—S04 at 800 °C).
Crystals 11 00755 g005
Figure 6. Results of Rietveld refinement of the LiNb0.75Ta0.25O3 material heat treated at 800 °C. An experimental XRD pattern (dots) is shown in comparison with the calculated pattern. The difference between measured and calculated profiles is shown as a curve below the diagram. Short vertical bars indicate the positions of diffraction maxima in space group R3c.
Crystals 11 00755 g006
Figure 7. Concentration dependence of the lattice parameters (a) and unit cell volume (b) in LiNb1−xTaxO3 at 550 °C and LiNb1−xTaxO3 at 800 °C series. The dashed lines are a guide for eyes (empty symbols—samples annealed at 550 °C; solid symbols—samples annealed at 800 °C).
Crystals 11 00755 g007
Figure 8. Diffraction patterns of LiNb1−xTaxO3 nanopowders (x = 0.25; 0.5; 0.75; 1) obtained by mechanosynthesis in optimal modes (milling speed—600 rpm, milling time—15 h, annealing at 700 °C for 5 h), as well as the reference diffractogram of LiNbO3.
Crystals 11 00755 g008
Figure 9. Raman spectra of LiNb1−xTaxO3 nanopowders obtained in non-optimal synthesis conditions.
Crystals 11 00755 g009
Figure 10. Raman spectra of nanopowders (n) of LiNbO3 and LiTaO3 synthesized by mechanochemical treatment and the ones of micropowders (m) of LiNbO3 and LiTaO3 obtained by crushing.
Crystals 11 00755 g010
Figure 11. Raman spectra of LiNb1−xTaxO3 nanopowders obtained in optimal synthesis conditions.
Crystals 11 00755 g011
Figure 12. Complex impedance of pressed LiNb1−xTaxO3 samples measured at 400 °C.
Crystals 11 00755 g012
Figure 13. Complex impedance of the pressed LiNb1−xTaxO3 samples measured at 600 °C.
Crystals 11 00755 g013
Figure 14. Temperature dependence of conductivity of LiNb1−xTaxO3 pressed pellets.
Crystals 11 00755 g014
Figure 15. ln(σ·T) vs. 1000/T dependence of LiTaO3 samples (dots) and linear fits of its separate regions (lines).
Crystals 11 00755 g015
Table 1. Weights of reagents Li2CO3, Nb2O5, and Ta2O5, calculated to obtain 10 g of stoichiometric compounds LiNb1−xTaxO3.
Sample No.CompositionWeight, g
Li2CO3Nb2O5Ta2O5
S01 (x = 0) LiNbO324998989
S02 (x = 0.25)LiNb0.75Ta0.25O3217558683252
S03 (x = 0.5)LiNb0.5Ta0.5O3192634635758
S04 (x = 0.75)LiNb0.25Ta0.75O3172715547748
S05 (x = 1)LiTaO315669367
Table 2. Lattice parameters (a, c), average grain size, and microstrains values (<ε>) of two LiNb1−xTaxO3 series heat treated at 550 and 800 °C.
SamplexT, °CParasitic Phasesa, Åc, ÅDave, nm<ε>, %
S0105505.1483(3)13.8484(9)410.088
8005.1517(2)13.8335(7)2060.108
S020.25550Li(Nb,Ta)3O85.1477(3)13.822(1)500.143
800Li(Nb,Ta)3O85.1521(3)13.8148(8)1710.105
S030.5550Ta2O5 + LiNb3O85.1534(4)13.808(1)630.107
800Li(Nb,Ta)3O85.153(1)13.778(3)970.128
S040.75550Ta2O55.149(2)13.788(5)310.093
800Li(Nb,Ta)3O85.1558(7)13.753(2)920.139
S051550Ta2O55.1529(6)13.767(2)660.114
800Li(Nb,Ta)3O85.1593(4)13.745(2)800.135
Table 3. The observed bands in Raman spectra of LiNb1−xTaxO3 nanopowders.
x = 0x = 0.25x = 0.5x = 0.75x = 1
Raman Shift, cm−1Intensity, a. u.Raman Shift, cm−1Intensity, a. u.Raman Shift, cm−1Intensity, a. u.Raman Shift, cm−1Intensity, a. u.Raman Shift, cm−1Intensity, a. u.
117.355663.515175.5377973.8203773.12275
153.8587373.239195.8332790.22046972194
180108980.81117117.18657146.96845143.26681
238.810,00297.52255124.28534168.441151624985
262.64068117.77151317601215.310,093209.110,133
276.744811382445150.27676240.25079232.54917
3031582153.87500224.310,117252.74891250.54384
3212491168.84176258.383753192778280.82294
3332220208.61390312.43266351.125503162327
3691904235.99978342.32388380.53293356.22579
432.815502595508375.72129458.31570381.53387
584.63074272.75113453.1997600.16663465.11618
621.33557298.62242608.48264660.725985977575
700.8464320.82914629.77113868.215356372886
8751681336.42391664.149781009.72344660.22741
371.72150849.61035 865.81122
4361339872.91571 1009.24684
547.3945906954
597.75018994.12675
615.556081008.11536
6761572
7001300
821.8808
8721841
1009.7341
Table 4. Activation energies EA and pre-exponential coefficients σ0 for conductivity of LiNb1−xTaxO3 pressed pellets at different temperatures.
Composition300 ÷ 620 °C670 ÷ 820 °C
EA, eVσ0, ·106 S/mEA, eV σ0, ·106 S/m
LiNbO30.88 ± 0.0310.171.05 ± 0.0711.54
LiNb0.75Ta0.25O30.88 ± 0.0110.321.01 ± 0.0731.59
LiNb0.5Ta0.5O30.88 ± 0.0150.581 ± 0.072.61
LiNb0.25Ta0.75O30.91 ± 0.0150.830.99 ± 0.0692.58
LiTaO30.86 ± 0.0150.481.09 ± 0.0728.33
Publisher’s Note: MDPI stays neutral with regard to jurisdictional claims in published maps and institutional affiliations.

