Abstract
This study discusses whether the prism used in a Kretschmann-based surface plasmon sensor can be fabricated from a thermotropic liquid crystal (TLC) material. The refractive index of the TLC prism can be thermally tuned to match the excitation requirements for the surface plasmon modes along the metal–TLC interface of the proposed sensing platform. The TLC material was chemically prepared in vitro and was thermally and optically characterized. The measurements reported a wide mesophase temperature range ΔT (~35 °C) and a relatively high clearing temperature TC (~84 °C) which constitutes a stable thermal control for the TLC optical parameters. The experimentally measured refractive indices of the TLC material reflect a linear change in line with the temperatures at several selected wavelengths in the visible region. A design of the surface plasmon sensor was proposed, which provided a linear response to the investigated analytes refractive index. This work highlights the importance of employing TLC material in designs compatible with detecting refractive index changes by thermal tuning and presents refractive index interrogation as an alternative method for exciting surface plasmon modes.
1. Introduction
Surface plasmon polariton (SPP) excitation via the evanescent coupling technique has attracted interest concerning the employment of several optical materials [1,2], developing the design structure [3,4], and enhancing the detection process [5]. The prism-coupling method is a well-known method of exciting SPP on flat metal surfaces [6,7]. It is based on generating an evanescent optical field via total reflection at the base of a prism in contact with a metal film. Usually, the thin metal film is evaporated on the prism base. When an optical beam is incident on the base of the prism at an angle slightly larger than critical, the tail of the evanescent transmitted wave penetrates the thin metal film and excites the SPP waves. Many authors have investigated the excitation of SPP using the Kretschmann configuration [6,8]. They obtained a dark line in the reflected beam (minimum reflectivity) from the prism base, which indicates the excitation of the guided SPP mode [8]. The most straightforward method to achieve this dip (minimum reflectivity) is established to be varying the angle of incidence of a well-collimated optical beam on the prism base; this is known as angular interrogation [6,7,8,9]. However, it is possible to change the light wavelength until the excitation condition is verified, and this is known as spectral interrogation [8,9]. In this work, the designed prism made of a liquid crystal (LC) material was suggested, whose refractive index can be tuned thermally to the required value that meets the phase matching condition of the incident beam and the SPP mode.
Synthesizing organic LCs shows intermediate phases between the crystalline solid and the amorphous liquid, and this transition is based on thermal processes. The importance of organic LCs stems from the response of optical parameters to ambient temperatures [10,11,12,13], while other applications rely on the LC response to an applied electric and magnetic field. The study of optical parameters, and in particular the average refractive index (ARI) and thus the dispersion parameters, has received widespread attention for many optical applications, such as surface plasmon resonance (SPR) [14,15,16,17,18] and localized surface plasmon resonance (LSPR) [19,20,21]. In this work, we exploited the thermal tunability and the ease of shaping of LC materials in small dimensions to investigate the feasibility of an efficient Kretschmann-type sensor.
In this work a lab-prepared organic LC compound (4-nitrophenyl-4-(dodecanoyloxy) benzoate) was fabricated and its chemical composition was investigated using Fourier-transform infrared spectroscopy (FTIR), 1H Nuclear Magnetic Resonance (1H NMR), and a mass spectrometer. Thereafter, the mesophase state was thermally determined with the aid of two different techniques: a differential scanning calorimeter (DSC) during the heating process, and an image analysis of the obtained optical texture with a polarized optical microscope (POM) during the cooling process. The optical ARI was measured utilizing an Abbe refractometer that was equipped with different optical transmission filters and a hot water circulation system to carry out temperature-dependent measurements at several wavelengths during the cooling process. The dispersion curves were fitted based on the ARI data obtained at different temperatures, and the Abbe number (VD) was determined to describe the dependence of ARI on the wavelength and the temperature. A thermal Kretschmann-based surface plasmon sensor design was presented, exploiting the measured ARI results to study the sensor response at various analytes’ refractive indices.
2. Theoretical Consideration
2.1. Optical Dispersion Relations
The real part of the refractive index, n, can be described by the Cauchy equation as [22,23]:
The Abbe number is a parameter that is used to measure the dispersion of transparent materials in the visible part of the spectrum, it is given by [24]:
where, nD, nF and nC are the refractive indices at the wavelengths of the Fraunhofer D, F and C spectral lines (589.3 nm, 486.1 nm and 656.3 nm, respectively). The difference (nF−nC) is defined as the principal dispersion. The reciprocal of the Abbe number is called the dispersive power. Materials that show a high Abbe number (VD) have a lower degree of dispersion and chromatic aberration.
2.2. Chemical Materials
2.2.1. Material and Methods
All reagents and solvents were of analytical grade and were purchased from Sigma–Aldrich (Saint Louis, MI, USA). The melting points (MPs) were measured using a Gallenkamp electric melting point apparatus. The infrared (IR) spectra were recorded on a PyeUnicam SP-3-300 infrared spectrophotometer using potassium bromide (KBr) disks. The 1H Nuclear Magnetic Resonance (1H NMR) spectra were run at 400 MHz on a Varian Mercury VX-300 NMR spectrometer (Varian UK) using tetra methyl silane (TMS) as the internal standard in deuterated chloroform or deuterated dimethyl sulphoxide, the chemical shifts (δ) were reported in ppm, and the coupling constants (J) in Hertz. The mass spectra were recorded using a Shimadzu GCMS-QP-1000EX mass spectrometer (Shimadzu, Japan) at an ionization energy of 70 eV with the source at 200 °C and an accelerative voltage of 8 kV. All the spectral measurements were carried out at the Central Laboratory (Faculty of Science and Faculty of Pharmacy, Ain Shams University, Egypt). Samples were introduced by a standard direct insertion probe. The purity of the synthesized compounds was checked by thin layer chromatography.
2.2.2. Procedure
a-4-(Dodecanoyloxy) Benzoic Acid (2)
Lauroyl chloride was added to a solution of 4-hydroxybenzoic acid (1) in dry pyridine under reflux. The reaction mixture was refluxed for 7 h, cooled to room temperature, and acidified by diluted HCl. The precipitated product was collected by filtration then recrystallized from light petroleum ether at 60–80 °C to give 4-(dodecanoyloxy) benzoic acid (2) as white crystals. Yield: 82%; MP: 135–137 °C. FT-IR (KBr, cm−1): 3402 ν OH, 3079 ν(CH aromatic), 2955 and 2921 ν(CH aliphatic), 1757 νC=O ester, 1685 νC = O acid. 1HNMR (400 MHz, CDCl3,δ, ppm): 12.85 (s, 1H, COOH, exchangeable D2O), 8.15 (dd, 2H, Ar-H, J = 8.8 Hz), 7.23 (dd, 2H, Ar-H, J = 8.8 Hz), 2.58 (t, 2H, COCH2, J = 7.2 Hz), 1.79–1.64 (m, 2H, COCH2CH2), 1.38–1.27 (m, 16H, 8CH2), 0.88 (t, 3H, CH2CH3, J = 6.4 Hz). MS (m/z (%)): 320 (M∔, 6.4), 303 (1.3), 291 (6.9), 220 (56.6), 219 (99.9), 190 (35.7), 138 (47.3), 122 (75.0), 121 (78.9), 109 (59.1), 93 (8.2), 77 (3.1).
b-4-Nitrophenyl-4-(dodecanoyloxy) Benzoate (3)
To a solution of 4-(dodecanoyloxy) benzoic acid (2) (12 mmol), 4-nitrophenol (12 mmol) in dry DCM (50 mL), dicyclohexylcarbodiimide (DCC) (14.4 mmol) and 4-(dimethylamino) pyridine (DMAP) (0.08 g) was added. The reaction mixture was stirred for 7 h at room temperature and then the precipitate was filtered and the solvent was distilled off the filtrate. The residue was recrystallized from light petroleum ether 60–80 °C to give 4-nitrophenyl-4-(dodecanoyloxy) benzoate (3) as yellow crystals. Yield: 70%; MP: 69–70 °C. FT-IR (KBr, cm−1): 3115 ν(CH aromatic), 2921 and 2851 ν(CH aliphatic), 1759 and 1735 νC=O esters. 1HNMR (400 MHz, CDCl3, δ, ppm): 8.25–8.02 (m, 4H, Ar-H), 7.35–-7.15 (m, 4H, Ar-H), 2.50 (t, 2H, COCH2), 1.65 (m, 2H, COCH2CH2), 1.30(m, 2H, COCH2CH2CH2), 1.15–1.25 (m, 14H, 7CH2), 0.75 (t, 3H, CH2CH3). MS (m/z (%)): 441 (M∔, not observed), 355 (0.2), 320 (0.5), 276 (3.8), 219 (11.4), 200 (11.3), 183 (69.7), 139 (84.7), 122 (6.1), 109 (95.2), 94 (81.4), 93 (29.5), 77 (11.2), 65 (99.9).
2.3. Optical Measurements
The ARI of the prepared LC material was measured using an Abbe refractometer (Reichert Abbe Mark II Refractometer, Reichert, Depew, NY, USA) with an accuracy of 0.001 in the range of 1.3200–1.7000. The temperature of the refractometer was controlled by circulating water in a water bath temperature controller. To measure the temperature, a thermometer with an accuracy of ± 0.1 °C was placed close to the sample.
2.4. Mesophase Temperature Detection
Differential scanning calorimetry (DSC-50 SHIMADZU) measurement was carried out on a small sample (2–3 mg) placed in a sealed aluminum pan. A thermogram was obtained at a heating rate of 10 °C/min in an inert atmosphere of nitrogen gas (10 mL/min). A sandwich-like cell was made from two cleaned optical glass substrates without any kind of surface treatment and was assembled after inserting a spacer to ensure a homogenous thickness. The LC material was injected into the LC cell using a capillary action after heating beyond the isotropic temperature in order to avoid the possible alignment that could take place in the filling direction. Transition temperatures were checked and types of mesophases identified for the prepared sample with a standard POM (Wild, Germany) attached to a homemade hot stage. The temperature was measured by a thermo-couple attached to a temperature controller. MATLAB software was used to digitally process the captured images and calculate the transmitted brightness corresponding to the change in temperature. Temperatures obtained from the prepared material, as measured by both DSC and POM, were agreed within 2–3 °C.
3. Results
3.1. Chemical Preparation
In a new one-pot methodology to synthesize our target organic LC compound (3) in excellent yield, 4-(dodecanoyloxy) benzoic acid (2) was allowed to react with 4-nitrophenol in the presence of a catalytic amount of dicyclohexylcarbodiimide (DCC) and 4-(dimethylamino) pyridine (DMAP) in a dry DCM with stirring at room temperature, as shown in Figure 1. This approach takes advantage of the DCC binding with water, and further, the formation of an easily removable product, dicyclohexylurea. The structural features of compound (3) were established by 1H NMR, IR and mass spectral data. The IR spectrum displayed absorption bands attributable to two νC=O ester groups at 1759 and 1735 cm−1 and the disappearance of the νOH band. The 1HNMR spectrum proves the presence of the C11 tail. It was found that compound (2) was obtained upon the reaction of 4-hydroxybenzoic acid (1) with acid chloride, namely, lauroyl chloride in dry pyridine. The IR spectrum showed a broad peak centered at 3402 due to the νOH and νC = O ester and νC = O acid at 1757 and 1685 cm−1, respectively. 1H NMR displayed two doublet signals at 8.15 and 7.23 ppm for Ar-H with J coupling = 8.8 Hz; two triplet signals at 2.58 and 0.88 ppm for COCH2 and CH2CH3, respectively; and two multiplet signals at 1.79–1.64 ppm and 1.38–1.27 ppm, for COCH2CH2 and 8CH2, respectively. The organic LC compound (3) had been previously prepared [25] in a multistep process via the conversion of 4-(dodecanoyloxy) benzoic acid (2) to its corresponding acid chloride, then with 4-nitrophenol.
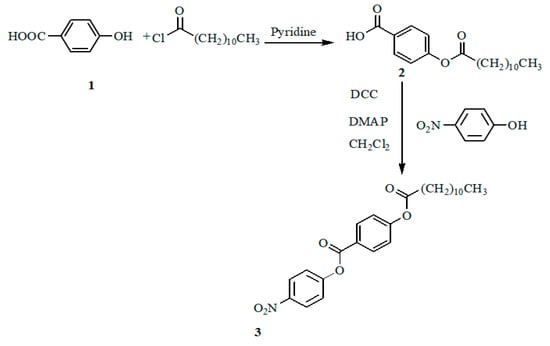
Figure 1.
Chemical preparation steps of 4-nitrophenyl-4-(dodecanoyloxy) benzoate.
3.2. Mesophase Temperature Detection
The formation of the liquid crystal phase is temperature-dependent for many synthesized compounds and contains many sub-phases throughout the transformation by heating, from a completely ordered crystalline phase and eventually to a completely disordered isotopic phase at which the clearing temperature, TC, is obtained. Measurement of the phase transition temperatures and the clearing temperatures allows researchers who are interested in thermotropic LC materials to exploit them in applications that require a wide range of operating temperatures and a clearing temperature as far as possible from room temperature so as not to be affected by climate temperature changes. In this work, the heat flow of the prepared sample, which is the heat power absorbed by the LC sample during the change of temperature, showed a single intermediate phase, and the measured phase transition temperatures were 48.73 °C at the transformation from the crystal phase to the LC phase, and 82.78 °C at the transformation from the LC phase to the isotropic phase, as shown in Figure 2a. To check the mentioned results, another study, based on the optical measurement of the images of the LC textures captured during the transformation, was performed during the cooling rate process (Figure 2b). The resultant captured images were processed to quantify the transmitted brightness, which is the average of the pixel values at each single temperature, as shown in Figure 2c.
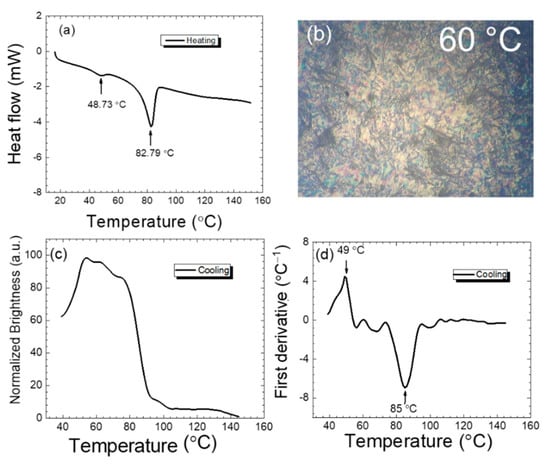
Figure 2.
(a) Heat flow of 4-nitrophenyl-4-(dodecanoyloxy) benzoate with a heating rate of 10 °C/min. (b) Optical texture image at 60 °C. (c) Normalized brightness of POM images captured during the cooling process with a rate of 1 °C/min. (d) The first derivative of the normalized brightness.
The first mathematical derivative of the obtained curve in Figure 2c was performed to study the change in the normalized brightness with the applied temperatures, and this was an effective step in order to accurately determine the phase transformation temperature, as reported in Figure 2d. The study of the phase transformation during heating and cooling was important to confirm the tunability of the refractive index changing between these two opposite paths. Table 1 summarizes the obtained temperatures and a slight but acceptable difference in temperature between the two methods is noticed, where the temperature difference between heating (DSC) and cooling (POM) was ~0.27 °C at the transition from the crystal to the LC phase and ~2.21 °C at the transformation from the LC to the isotropic phase. The LC phase temperature width, ~35 °C, is wider than other synthetic LC materials and the clearing temperature, ~84°C, is sufficiently higher than the climate temperature changes to provide a widely thermal tunable device that can operate with stable performance.

Table 1.
Phase transition temperatures of the LC compound (4-nitrophenyl-4-(dodecanoyloxy) benzoate) during heating and cooling.
3.3. Optical Parameters
The measurement of the ARI of the prepared material was carried out during the change in temperature during the cooling process, which is slower than the heating process, to acquire more accurate results. The obtained data were within the LC phase temperatures, bearing in mind that the molecules are not aligned with any of the commonly used methods to observe the direct influence of the applied heat energy changes on the measured ARI.
In Figure 3a, the linear decrease in the ARI with the change in temperature is shown, and it can be described by the following Equation [26,27].
where n0 is the refractive index at absolute zero Kelvin and s is the slope of the fitted line, which is called the thermo-optic coefficient (dn/dT) [28], and both of them are listed in Table 2.
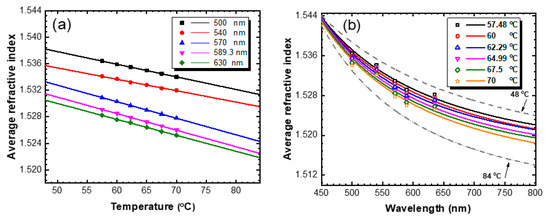
Figure 3.
(a) Dependence of average refractive index on the temperature at different wavelengths: the experimental data are presented as symbols, and the solid lines are the linear fitted lines based on Equation (3). (b) Dispersion of the average refractive index at different temperatures: the experimental data are presented as symbols, and the solid lines are the fitted curves based on Equation (1).
Table 2.
Fitting parameters of the measured ARI with the change in temperature.
Table 3 summarizes the Abbe number values and Cauchy equation parameters that were obtained by least squares fitting, as shown in Figure 3b. The dispersion curve study was performed inside the LC phase temperature range of 48–84 °C, which is marked by the fitted gray-dashed lines. The Abbe number values were calculated using Equation (2) after the estimation of nF, nC and nD using the Cauchy equation. Generally, the difference between the nF and nC describes the flatness of the dispersion curve, i.e., if this difference is relatively small, the dispersion curve changes with small values of the refractive index relative to the wavelength and vice versa. In our experimental data, it is found that the obtained Abbe number values showed an obvious decrease with the increase in temperature and consequently the difference between nF and nC increased. Therefore, the flatness of the dispersion curve at low temperatures is more pronounced than that at high temperatures, which confirms that the separation of the refractive index values increases as long as the applied temperature increases. The determination of the Cauchy parameters and Abbe numbers equipped us with a complete description of our material, to be exploited in the proposed design of a thermal-tunable sensor that can be operated at different wavelengths under the control of temperature.
Table 3.
Cauchy equation parameters and Abbe numbers of (4-nitro phenyl- 4′-(dodecanoyloxy) benzoate) at different temperatures.
3.4. Refractive Index Sensing Application
As an application for analyte refractive index sensing, the LC material data were employed in a prism in the Kretschmann configuration. In Figure 4, the refractive index of the LC varies within the range of the refractive index of the most popular glass prisms [29]. This motivated us to exploit the LC material as a prism in the Kretschmann sensor configuration based on the resonant excitation of the SPP polariton field to detect minute changes in the analytes refractive index [8]. The prism refractive index, n1 (adopted from the measured data of the LC material), is varied thermally until the resonant excitation condition of the SPP mode is verified [18].
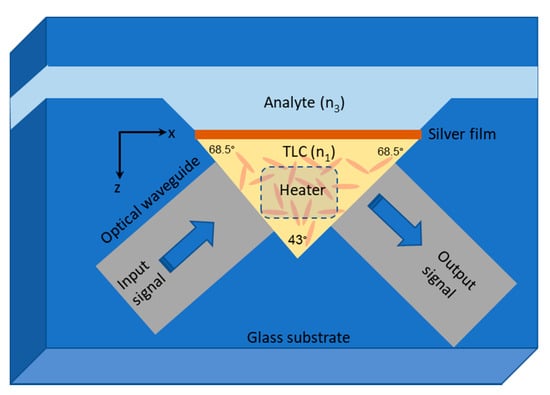
Figure 4.
A top view of the proposed integrated optical Kretschmann sensor with LC prism fabricated on a glass substrate; the prism index of refraction is tuned via heater electrode.
Figure 4 depicts the design of the proposed sensor. A groove is made inside a glass substrate in the shape of a triangle and filled with the LC material to form a liquid crystal prism (LCP). The anchoring surface strength inside the LCP groove is not supported with the commonly used aligning material and the LC molecules do not have a unified orientation to show the average refractive index for the propagating light waves. Two optical waveguides are embedded inside the glass substrate in direct contact with the LCP, in order to send the input signal and receive the output signal. A thin metallic film is placed at the LCP base and the analyte solution is allowed to flow inside a designed channel at the other side of the metallic film. A heater is positioned at the top and the bottom of the lateral surfaces of the LCP. The optical response of the three-layer configuration (LC/metallic film/analyte solution) is described by the reflectivity (R), which can be calculated from the three-layer Fresnel equation of transverse magnetic (TM) plane waves as [30]:
where , , and
where ε1, ε2, and ε3 are the dielectric constants of the LC material, the metallic film, and the analyte solution, respectively; C is the speed of light in vacuum; θi is the angle of incidence; kx is the propagation vector along the x-axis; while k1z, k2z, k3z are the propagation vectors along the z-axis in the LC material, the metallic film, and the analyte solution, respectively.
The thermal control of the LCP stimulates the minimum reflectivity that occurs when the SPP is excited at a certain prism refractive index, which we shall call prism index interrogation. In Figure 5, the metallic film used is made of silver with a refractive index n2 = 0.143 − j 3.7873, at a wavelength of 630 nm [31]; the dip (minimum reflectivity) in the reflected intensity can be observed when the SPP mode was excited in the metallic film. The dip occurred at an LCP refractive index of n1 = 1.518 RIU (dip location), when the input light signal (λ = 630 nm) was incident on the LCP base with an angle of 68.5°, which matches with the analyte refractive index n3 = 1.33. The reflectivity values were calculated on the basis of the thermal variation of the LCP refractive index, as shown before in Figure 3a.

Figure 5.
The reflectivity (R) vs. the prism refractive index at wavelength 630 nm when the incidence light beam is projected at the LCP base with an angle of 68.5°, and the analyte refractive index is n3 = 1.33. The dip occurred at n1 = 1.518.
The advantage of this method is the ability to choose the appropriate LC material that matches with the resonance angle of the SPP mode according to the analyte material under test. Moreover, the LC refractive index can be fine-tuned thermally (or via electric field). Figure 6a illustrates the scanning of the heat energy applied to the LCP to detect the dip location (the resonance refractive index of the LCP) in case of the varying of the analyte refractive index within the range of 1.25–1.36 RIU, and this scanning was performed at different optical signal wavelengths. Evidently, while the analyte refractive index changes, the reflectivity dip shifts, as illustrated in Figure 6b. The dip location shift can be utilized to establish the analyte refractive index. We found that the resonance value, n1, of the LC prism varies linearly with the analyte refractive index, n3, and the gray band in Figure 6a denotes the measured refractive index range of the LC material used in this work. This linearity renders the proposed sensor an attractive candidate for a new class of optical sensors. Indeed, the proposed interrogation technique of SPP excitation is simpler and more compact than the angular interrogation technique. Moreover, the proposed technique is suitable for fiber optics excitation of surface plasmons [32]. The focus of this work was to exploit the LC material as a bulk material with LC molecules with a non-specified direction in order to minimize the state of polarization sensitivity of the received optical signal [33]. However, the sensing process can be improved by considering one of the two LC refractive indices (extraordinary or ordinary) components to avoid signal scattering at the LC–metal interface, via applying an in-plane (tangential) electric field or introducing a rubbed polyimide layer, leading to a reduction in the randomness of the main LC orientation, although the state of polarization of the incident light should be taken under consideration. Such sensor is very useful and efficient in ultra-fast optical switching and sensing [34,35,36,37,38,39,40].
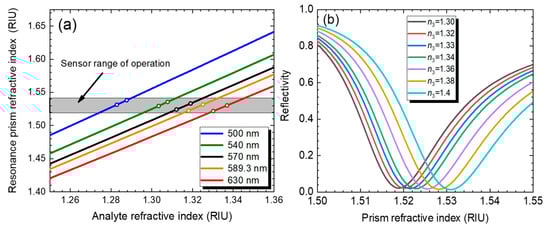
Figure 6.
(a) The resonance prism refractive index vs. the analyte refractive index at 500, 540, 570, 589.3, and 630 nm. (b) The shift in the reflectivity dip corresponding to different analyte refractive indices at a wavelength of 630 nm.
4. Conclusions
In this work, the concept of demonstrating SPP resonance in terms of the thermally controlled prism’s refractive index was studied. The novelty of the sensor lies in the fact that the SPP could be excited over a realistic range of analyte refractive index material by thermally varying the prism’s refractive index. The chemically prepared LC compound was investigated thermally and optically to fulfill the requirements for plasmonic mode excitation. The calculations showed a linear relationship between the resonance prism’s refractive index and the refractive index measured throughout the visible range of the optical spectrum. This design enables the use of several compositions of thermotropic liquid crystals at the higher detection ranges of the analyte refractive index.
Author Contributions
M.S.S. prepared the LC material, H.S. and A.S. performed calculations and writing. L.R.G., M.M. and Y.-C.D. reviewed and edited. All authors have read and agreed to the final manuscript.
Funding
This research was supported in part by Higher Education Sprout Project, Ministry of Education to the Headquarters of University Advancement at National Cheng Kung University (NCKU) and the Ministry of Science and Technology, Taiwan (MOST 108-2221-E-006-231-MY3).
Institutional Review Board Statement
Not applicable.
Informed Consent Statement
Not applicable.
Conflicts of Interest
The authors declare no conflict of interest.
References
- Bao, J.; Zong, X.; Li, L.; Yu, K.; Liu, Y. Liquid crystal filled dual-channel self-calibration optical-fiber surface plasmon resonance thermometer. Appl. Opt. 2020, 59, 720–725. [Google Scholar] [CrossRef]
- Tabassum, R.; Kant, R. Recent trends in surface plasmon resonance based fiber–optic gas sensors utilizing metal oxides and carbon nanomaterials as functional entities. Sens. Actuators B Chem. 2020, 310, 127813. [Google Scholar] [CrossRef]
- Tao, F.; Zhang, H.-F.; Yang, X.-H.; Cao, D. Surface plasmon polaritons of the metamaterial four-layered structures. JOSA B 2009, 26, 50–59. [Google Scholar] [CrossRef]
- Liu, Z.; Feng, W.; Huang, Z.; Guo, L.J. Polarization-controlled efficient and unidirectional surface plasmon polariton excitation enabled by metagratings in a generalized Kretschmann configuration. Opt. Express 2021, 29, 3659–3668. [Google Scholar] [CrossRef] [PubMed]
- Joseph, S.; Sarkar, S.; Joseph, J. Grating-Coupled Surface Plasmon-Polariton Sensing at a Flat Metal--Analyte Interface in a Hybrid-Configuration. ACS Appl. Mater. Interfaces 2020, 12, 46519–46529. [Google Scholar] [CrossRef]
- Kretschmann, E.; Raether, H.; Institut für Angewandte Physik der Universität Hamburg. Radiative decay of non-radiative surface plasmons excited by light. Z. Naturforsch. A 1968, 23, 2135–2136. [Google Scholar] [CrossRef]
- Genchev, Z.D.; Nedelchev, N.M.; Mateev, E.; Stoyanov, H.Y. Analytical approach to the prism coupling problem in the Kretschmann configuration. Plasmonics 2008, 3, 21–26. [Google Scholar] [CrossRef]
- Gupta, B.D.; Srivastava, S.K.; Verma, R. Fiber Optic Sensors Based on Plasmonics; World Scientific: Singapore, 2015. [Google Scholar]
- Gwon, H.R.; Lee, S.H. Spectral and angular responses of surface plasmon resonance based on the Kretschmann prism configuration. Mater. Trans. 2010, 51, 1150–1155. [Google Scholar] [CrossRef]
- Pawlik, G.; Walasik, W.; Jarema, M.; Mitus, A.C.; Khoo, I.C. Temperature dependence of refractive index gradient in nanosphere dispersed liquid crystal (NDLC) metamaterial at infrared frequencies: Monte Carlo study. Opt. Mater. 2012, 34, 1656–1659. [Google Scholar] [CrossRef]
- Hu, D.J.J.; Shum, P.; Lu, C.; Sun, X.; Ren, G.; Yu, X.; Wang, G. Design and analysis of thermally tunable liquid crystal filled hybrid photonic crystal fiber coupler. Opt. Commun. 2009, 282, 2343–2347. [Google Scholar] [CrossRef]
- Yakuphanoglu, F.; Durmuş, M.; Okutan, M.; Köysal, O.; Ahsen, V. The refractive index dispersion and the optical constants of liquid crystal metal-free and nickel(II) phthalocyanines. Phys. B Condens. Matter 2006, 373, 262–266. [Google Scholar] [CrossRef]
- Okutan, M.; San, S.E.; Köysal, O.; Yakuphanoglu, F. Investigation of refractive index dispersion and electrical properties in carbon nano-balls’ doped nematic liquid crystals. Phys. B Condens. Matter 2005, 362, 180–186. [Google Scholar] [CrossRef]
- Guo, Y.; Li, J.; Li, S.; Liu, Y.; Meng, X.; Bi, W.; Lu, H.; Cheng, T.; Hao, R. Amphibious sensor of temperature and refractive index based on D-shaped photonic crystal fibre filled with liquid crystal. Liq. Cryst. 2020, 47, 882–894. [Google Scholar] [CrossRef]
- Kieser, B.; Pauluth, D.; Gauglitz, G. Nematic liquid crystals as sensitive layers for surface plasmon resonance sensors. Anal. Chim. Acta 2001, 434, 231–237. [Google Scholar] [CrossRef]
- Liu, C.; Wang, F.; Lv, J.; Sun, T.; Liu, Q.; Fu, C.; Mu, H.; Chu, P.K. A highly temperature-sensitive photonic crystal fiber based on surface plasmon resonance. Opt. Commun. 2016, 359, 378–382. [Google Scholar] [CrossRef]
- Watad, I.; Abdulhalim, I. Phase-shifted polarimetric surface plasmon resonance sensor using a liquid crystal retarder and a diverging beam. Opt. Lett. 2019, 44, 1607–1610. [Google Scholar] [CrossRef] [PubMed]
- Lu, M.; Zhang, X.; Liang, Y.; Li, L.; Masson, J.-F.; Peng, W. Liquid crystal filled surface plasmon resonance thermometer. Opt. Express 2016, 24, 10904. [Google Scholar] [CrossRef] [PubMed]
- Lee, S.; Song, H.; Ahn, H.; Kim, S.; Choi, J.; Kim, K. Fiber-Optic Localized Surface Plasmon Resonance Sensors Based on Nanomaterials. Sensors 2021, 21, 819. [Google Scholar] [CrossRef]
- Algorri, J.F.; García-Cámara, B.; García-García, A.; Urruchi, V.; Sánchez-Pena, J.M. Fiber optic temperature sensor based on amplitude modulation of metallic and semiconductor nanoparticles in a liquid crystal mixture. J. Light. Technol. 2015, 33, 2451–2455. [Google Scholar] [CrossRef]
- Algorri, J.F.; Garcia-Camara, B.; Urruchi, V.; Sánchez-Pena, J.M. High-sensitivity Fabry-Pérot temperature sensor based on liquid crystal doped with nanoparticles. IEEE Photonics Technol. Lett. 2014, 27, 292–295. [Google Scholar] [CrossRef]
- Smith, D.Y.; Inokuti, M.; Karstens, W. A generalized cauchy dispersion formula and the refractivity of elemental semiconductors. J. Phys. Condens. Matter 2001, 13, 3883–3893. [Google Scholar] [CrossRef]
- Ghosh, G. Dispersion-equation coefficients for the refractive index and birefringence of calcite and quartz crystals. Opt. Commun. 1999, 163, 95–102. [Google Scholar] [CrossRef]
- Wondraczek, L.; Gross, G.-P.; Heide, G.; Kloess, G.; Frischat, G.H. Abbe numbers and refractive indices of tektites and volcanic glasses. J. Non. Cryst. Solids 2003, 323, 127–130. [Google Scholar] [CrossRef]
- Yokokura, H.; Era, S.; Abe, H.; Nakata, T.; Kitamura, T.; Mukoh, A. Liquid-crystal compound, liquid crystal composition and liquid crystal display device. EU-EP0149754A2, 31 July 1985. [Google Scholar]
- Li, J.; Gauza, S.; Wu, S.T. Temperature effect on liquid crystal refractive indices. J. Appl. Phys. 2004, 96, 19–24. [Google Scholar] [CrossRef]
- Li, J.; Gauzia, S.; Wu, S.-T. High temperature-gradient refractive index liquid crystals. Opt. Express 2004, 12, 2002. [Google Scholar] [CrossRef]
- Loiko, P.; Ghanbari, S.; Matrosov, V.; Yumashev, K.; Major, A. Dispersion and anisotropy of thermo-optical properties of Alexandrite laser crystal. Opt. Mater. Express 2018, 8, 3000. [Google Scholar] [CrossRef]
- Gryga, M.; Vala, D.; Kolejak, P.; Gembalova, L.; Ciprian, D.; Hlubina, P. One-dimensional photonic crystal for Bloch surface waves and radiation modes-based sensing. Opt. Mater. Express 2019, 9, 4009. [Google Scholar] [CrossRef]
- Kurihara, K.; Suzuki, K. Theoretical understanding of an absorption-based surface plasmon resonance sensor based on Kretchmann’s theory. Anal. Chem. 2002, 74, 696–701. [Google Scholar] [CrossRef] [PubMed]
- Rakić, A.D.; Djurišić, A.B.; Elazar, J.M.; Majewski, M.L. Optical properties of metallic films for vertical-cavity optoelectronic devices. Appl. Opt. 1998, 37, 5271–5283. [Google Scholar] [CrossRef] [PubMed]
- Liu, C.; Zhang, X.; Gao, Y.; Wei, Y.; Wu, P.; Su, Y.; Wu, P. Fiber SPR refractive index sensor with the variable core refractive index. Appl. Opt. 2020, 59, 1323–1328. [Google Scholar] [CrossRef]
- Cetin, A.E.; Mertiri, A.; Huang, M.; Erramilli, S.; Altug, H. Thermal tuning of surface plasmon polaritons using liquid crystals. Adv. Opt. Mater. 2013, 1, 915–920. [Google Scholar] [CrossRef]
- Du, Y.; Shyu, L.; Hu, W. The Effect of Combining Stationary Wavelet Transform and Independent Component Analysis in the Multi-channel SEMGs Hand Motion Identification System. J. Med Biol. Eng. 2006, 26, 9–14. [Google Scholar]
- Hsu, H.F.; Lin, Y.T.; Huang, Y.T.; Lu, M.F.; Chen, C.H. In Situ Regeneration of Si-based ARROW-B Surface Plasmon Resonance Biosensors. J. Med Biol. Eng. 2015, 35, 305–314. [Google Scholar] [CrossRef][Green Version]
- Zida, S.I.; Yang, C.C.; Khung, Y.L.; Lin, Y.D. Fabrication and Characterization of an Aptamer-Based N-type Silicon Nanowire FET Biosensor for VEGF Detection. J. Med Biol. Eng. 2020, 40, 601–609. [Google Scholar] [CrossRef]
- Gomaa, L.; Shaaban, A.; Hameed, M.F.; Obayya, S.S. Competitiveness of the BPM in studying the optical beams at critical incidence on dielectric interfaces. Opt. Quantum Electron. 2017, 49, 51. [Google Scholar] [CrossRef]
- Shaaban, A.; Du, Y.-C.; Gomaa, L. Effects of smoothing functions on the transformation of TM to TE propagation problems in the framework of FFT-BPM: A comparative study. Opt. Commun. 2021, 478, 126374. [Google Scholar] [CrossRef]
- Shaaban, A.; Hameed, M.F.; Gomaa, L.R.; Obayya, S.S. Accurate calculation of Goos-Hänchen shift at critical angle for complex laser beam profiles using beam propagation method. Optik 2018, 157, 1106–1114. [Google Scholar] [CrossRef]
- Shaaban, A.; Sayed, M.; Hameed, M.F.O.; Saleh, H.I.; Gomaa, L.; Du, Y.-C.; Obayya, S. Fast parallel beam propagation method based on multi-core and many-core architectures. Optik 2019, 180, 484–491. [Google Scholar] [CrossRef]
Publisher’s Note: MDPI stays neutral with regard to jurisdictional claims in published maps and institutional affiliations. |
© 2021 by the authors. Licensee MDPI, Basel, Switzerland. This article is an open access article distributed under the terms and conditions of the Creative Commons Attribution (CC BY) license (https://creativecommons.org/licenses/by/4.0/).